Open Access Cohort profile The Optimal Screening for ... · AbstrAct Purpose There is an ......
12
1 George SZ, et al. BMJ Open 2017;7:e015188. doi:10.1136/bmjopen-2016-015188 Open Access ABSTRACT Purpose There is an increased need for determining which patients with musculoskeletal pain benefit from additional diagnostic testing or psychologically informed intervention. The Optimal Screening for Prediction of Referral and Outcome (OSPRO) cohort studies were designed to develop and validate standard assessment tools for review of systems and yellow flags. This cohort profile paper provides a description of and future plans for the validation cohort. Participants Patients (n=440) with primary complaint of spine, shoulder or knee pain were recruited into the OSPRO validation cohort via a national Orthopaedic Physical Therapy-Investigative Network. Patients were followed up at 4 weeks, 6 months and 12 months for pain, functional status and quality of life outcomes. Healthcare utilisation outcomes were also collected at 6 and 12 months. Findings to date There are no longitudinal findings reported to date from the ongoing OSPRO validation cohort. The previously completed cross-sectional OSPRO development cohort yielded two assessment tools that were investigated in the validation cohort. Future plans Follow-up data collection was completed in January 2017. Primary analyses will investigate how accurately the OSPRO review of systems and yellow flag tools predict 12-month pain, functional status, quality of life and healthcare utilisation outcomes. Planned secondary analyses include prediction of pain interference and/or development of chronic pain, investigation of treatment expectation on patient outcomes and analysis of patient satisfaction following an episode of physical therapy. Trial registration number The OSPRO validation cohort was not registered. INTRODUCTION In USA, interest in direct access physical therapy is increasing because it has been associ- ated with lower cost, less healthcare utilisation and higher patient satisfaction. 1 2 Currently, all 50 states, the District of Columbia and the US Virgin Islands allow patients to seek some level of treatment from a licensed physical thera- pist without a prescription or referral from a physician 3 ; however, medical and chiropractic organisations have questioned whether phys- ical therapists should be front line providers for patients with musculoskeletal pain. 4 One high priority area for allaying these concerns is the development of standard processes that aid in determining suitability for individuals seeking their care. Review of systems of the body is a routine examination process with the goal of identifying concomi- tant disease suggesting a non-musculoskeletal cause of pain. 5 This process typically involves a symptom review followed by focused physical examination as appropriate. During review of systems of the body, attention is paid to whether referral for additional diagnostic testing is required. Another high priority area for developing standard assessment processes is the identification of pain-associated psycho- logical distress (ie, ‘yellow flags’). Yellow flags are psychological prognostic factors for the development of disability following the onset of musculoskeletal pain. 6 In extreme cases, psychological distress could necessitate referral to another provider, but more commonly pain-associated psychological distress is a precursor of delayed recovery and indicates the need for psychologically informed inter- ventions. 7 There are barriers to consistently performing review of systems and identifying pain-associated psychological distress. Review of systems involves querying the presence of ‘red flag’ symptoms. The variability of red flag symptom descriptors used and their lack of accuracy in predicting systemic involve- ment limit the implementation of standard, evidence-supported approaches for review of symptoms linked directly to identification of The Optimal Screening for Prediction of Referral and Outcome (OSPRO) in patients with musculoskeletal pain conditions: a longitudinal validation cohort from the USA Steven Z George, 1,2 Jason M Beneciuk, 3 Trevor A Lentz, 4 Samuel S Wu 5 To cite: George SZ, Beneciuk JM, Lentz TA, et al. The Optimal Screening for Prediction of Referral and Outcome (OSPRO) in patients with musculoskeletal pain conditions: a longitudinal validation cohort from the USA. BMJ Open 2017;7:e015188. doi:10.1136/ bmjopen-2016-015188 Received 14 November 2016 Revised 5 April 2017 Accepted 27 April 2017 1 Musculoskeletal Research, Duke Clinical Research Institute, Durham, North Carolina, USA 2 Orthopaedic Surgery, Duke University, Durham, North Carolina, USA 3 Department of Physical Therapy, Brooks—PHHP Research Collaboration, University of Florida, Gainesville, Florida, USA 4 Department of Physical Therapy, University of Florida, Gainesville, Florida, USA 5 Department of Biostatistics, University of Florida, Gainesville, Florida, USA Correspondence to Dr Steven Z George; [email protected] Cohort profile group.bmj.com on June 12, 2017 - Published by http://bmjopen.bmj.com/ Downloaded from
-
Upload
truongphuc -
Category
Documents
-
view
213 -
download
0
Transcript of Open Access Cohort profile The Optimal Screening for ... · AbstrAct Purpose There is an ......

1George SZ, et al. BMJ Open 2017;7:e015188. doi:10.1136/bmjopen-2016-015188
Open Access
AbstrActPurpose There is an increased need for determining which patients with musculoskeletal pain benefit from additional diagnostic testing or psychologically informed intervention. The Optimal Screening for Prediction of Referral and Outcome (OSPRO) cohort studies were designed to develop and validate standard assessment tools for review of systems and yellow flags. This cohort profile paper provides a description of and future plans for the validation cohort.Participants Patients (n=440) with primary complaint of spine, shoulder or knee pain were recruited into the OSPRO validation cohort via a national Orthopaedic Physical Therapy-Investigative Network. Patients were followed up at 4 weeks, 6 months and 12 months for pain, functional status and quality of life outcomes. Healthcare utilisation outcomes were also collected at 6 and 12 months.Findings to date There are no longitudinal findings reported to date from the ongoing OSPRO validation cohort. The previously completed cross-sectional OSPRO development cohort yielded two assessment tools that were investigated in the validation cohort.Future plans Follow-up data collection was completed in January 2017. Primary analyses will investigate how accurately the OSPRO review of systems and yellow flag tools predict 12-month pain, functional status, quality of life and healthcare utilisation outcomes. Planned secondary analyses include prediction of pain interference and/or development of chronic pain, investigation of treatment expectation on patient outcomes and analysis of patient satisfaction following an episode of physical therapy.Trial registration number The OSPRO validation cohort was not registered.
IntroductIon In USA, interest in direct access physical therapy is increasing because it has been associ-ated with lower cost, less healthcare utilisation and higher patient satisfaction.1 2 Currently, all 50 states, the District of Columbia and the US Virgin Islands allow patients to seek some level
of treatment from a licensed physical thera-pist without a prescription or referral from a physician3; however, medical and chiropractic organisations have questioned whether phys-ical therapists should be front line providers for patients with musculoskeletal pain.4
One high priority area for allaying these concerns is the development of standard processes that aid in determining suitability for individuals seeking their care. Review of systems of the body is a routine examination process with the goal of identifying concomi-tant disease suggesting a non-musculoskeletal cause of pain.5 This process typically involves a symptom review followed by focused physical examination as appropriate. During review of systems of the body, attention is paid to whether referral for additional diagnostic testing is required. Another high priority area for developing standard assessment processes is the identification of pain-associated psycho-logical distress (ie, ‘yellow flags’). Yellow flags are psychological prognostic factors for the development of disability following the onset of musculoskeletal pain.6 In extreme cases, psychological distress could necessitate referral to another provider, but more commonly pain-associated psychological distress is a precursor of delayed recovery and indicates the need for psychologically informed inter-ventions.7
There are barriers to consistently performing review of systems and identifying pain-associated psychological distress. Review of systems involves querying the presence of ‘red flag’ symptoms. The variability of red flag symptom descriptors used and their lack of accuracy in predicting systemic involve-ment limit the implementation of standard, evidence-supported approaches for review of symptoms linked directly to identification of
The Optimal Screening for Prediction of Referral and Outcome (OSPRO) in patients with musculoskeletal pain conditions: a longitudinal validation cohort from the USA
Steven Z George,1,2 Jason M Beneciuk,3 Trevor A Lentz,4 Samuel S Wu5
to cite: George SZ, Beneciuk JM, Lentz TA, et al. The Optimal Screening for Prediction of Referral and Outcome (OSPRO) in patients with musculoskeletal pain conditions: a longitudinal validation cohort from the USA. BMJ Open 2017;7:e015188. doi:10.1136/bmjopen-2016-015188
Received 14 November 2016Revised 5 April 2017Accepted 27 April 2017
1Musculoskeletal Research, Duke Clinical Research Institute, Durham, North Carolina, USA2Orthopaedic Surgery, Duke University, Durham, North Carolina, USA3Department of Physical Therapy, Brooks—PHHP Research Collaboration, University of Florida, Gainesville, Florida, USA4Department of Physical Therapy, University of Florida, Gainesville, Florida, USA5Department of Biostatistics, University of Florida, Gainesville, Florida, USA
Correspondence toDr Steven Z George; steven. george@ duke. edu
Cohort profile
group.bmj.com on June 12, 2017 - Published by http://bmjopen.bmj.com/Downloaded from
2 George SZ, et al. BMJ Open 2017;7:e015188. doi:10.1136/bmjopen-2016-015188
Open Access
serious pathology.8–10 Instead, alternative approaches to red flag screening in the form of identifying predictors of comorbidity status change have shown promise for improving patient management strategies but require further study.11 Furthermore, literature support for the predictive value of identifying pain associated psycho-logical distress, or yellow flags, has not led to this type of assessment being common in physical therapy practice. The lack of psychological assessment in physical therapy practice is likely due to it not being taught in educational settings and the large number of potential psycholog-ical factors to monitor creates confusion over which best drives clinical decision making.6 12 13
Physical therapists currently make clinical decisions for review of systems and identification of pain-associated psychological distress without standard assessment tools and processes.10 14 Therefore, clinical decisions made by physical therapists could be an important contributor to suboptimal outcomes and/or excessive healthcare cost or utilisation. There are successful models for standard, concise assessment processes. For example, the Ottawa Ankle Rules accurately determine which patients are appro-priate for radiographic testing.15 Physical therapists would benefit from similar processes to enhance clinical deci-sion making for patients across common musculoskeletal pain conditions. In particular, our efforts were focused on developing and validating tools that (1) facilitated review of symptoms for predicting change in comorbidity status and (2) identified relevant aspects of pain-associated psycholog-ical distress for predicting poor clinical outcomes for pain and functional status.
These tools were developed with the support of the Orthopaedic Section of the American Physical Therapy Association. Their Clinical Research Network funding mechanism supported the Orthopaedic Physical Thera-py-Investigator Network (OPT-IN) to complete the Optimal Screening for Prediction of Referral and Outcome (OSPRO) separate development and validation cohort studies. The completed development cohort study involved the creation and initial psychometric testing of the OSPRO-Re-view of Systems (OSPRO-ROS) and OSPRO-Yellow Flag (OSPRO-YF) screening tools. The validation cohort study involves administering the newly developed OSPRO-ROS and OSPRO-YF tools to determine their predictive validity for clinical outcomes, comorbidity change and healthcare utilisation. The purpose of this manuscript is to provide an overview of the OSPRO validation cohort study design and methodology as well as define the baseline status of the cohort and indicate future plans for validation analyses. Our overall intent was to provide some transparency before results are reported by providing a detailed description of the methods and indicate our planned analyses prior to completing final follow-up for the cohort.
cohort descrIptIonoverview A convenience sample was gathered from December 2014 and December 2015 by participating OPT-IN clinics. Physical therapists practising in these clinics determined participant eligibility at initial evaluation. Baseline and follow-up data collection occurred online, with partic-ipants completing all survey assessments on the study website. Follow-up time points were at 4 weeks, 6 months and 12 months and participants were notified of a pending assessment by an email that directed them back to the study website to complete their follow-up assess-ment. If participants did not complete their follow-up assessment within 1 week of the first email notification, an additional email reminder was sent each week for up to 3 weeks. Participants who were not responsive to any of these email reminders were contacted by telephone. Follow-up for the validation cohort is on-going and was completed in January 2017 (figure 1).
clinical sitesOPT-IN clinical sites (n=9) were identified through various methods that included advertisement by the Orthopaedic Section, previous collaborative rela-tionships, geographic location, type of setting and suggestions from the Section’s advisory board. Clinics that were able to commit to recruiting 50 subjects and agreed to complete training were included in the network. Clinical sites were contacted by study investi-gators to discuss recruitment expectations and training procedures. Clinic training was performed on-site (n=3) or via videoconference (n=6) and included modules on study background, eligibility criteria and subject recruitment strategies.
The OPT-IN clinics that participated in data collec-tion represented five of eight geographic regions for USA including the Mideast, Southeast, Great Lakes, Rocky Mountain States and Far West. The New England, Plains and Southwest regions were not represented. An attempt was made to balance between urban and rural settings over the entire OPT-IN network, though for prag-matic reasons that balance was not provided within each geographic region.
participantsThe OSPRO validation cohort study was approved by the University of Florida Human Subjects Institutional Review Board and all participants provided consent to participate in the study.
Eligible participants were directed to a secure, Univer-sity of Florida hosted website for the informed consent process and baseline assessment. All assessments were self-report and completed electronically by the partic-ipant in a de-identified manner. Eligibility criteria were reviewed by licensed physical therapists employed within an OPT-IN clinical site. Criteria were intention-ally broad since our intent was to develop assessment tools with potentially wide clinical application. Using
group.bmj.com on June 12, 2017 - Published by http://bmjopen.bmj.com/Downloaded from

3George SZ, et al. BMJ Open 2017;7:e015188. doi:10.1136/bmjopen-2016-015188
Open Access
narrow eligibility criteria would have excluded a signifi-cant number of patients commonly seen by orthopaedic physical therapists, resulting in limited application of these tools. The same eligibility criteria were used for the development and validation cohorts. Demographic and clinical summary of the validation cohort is reported in table 1.
Inclusion criteriaPatients between the ages of 18 and 65 years of age were eligible to participate in this study if they: (1) were seeking outpatient physical therapy treatment for musculoskeletal pain, (2) had primary complaints involving the cervical spine, lumbar spine, shoulder or knee and (3) were able to read and comprehend English language (this criterion was necessary due to the large number of self-report forms used at intake and follow-up).
exclusion criteriaPatients were excluded from study participation for any diagnosis indicative of (1) widespread chronic pain
syndrome (eg, fibromyalgia or irritable bowel syndrome), (2) neuropathic pain syndrome (eg, complex regional pain syndrome or diabetic neuropathy), (3) psychiatric history (currently in care of mental healthcare provider or taking ≥2 prescription psychiatric medications), (4) cancer (currently receiving treatment for active cancer) and (5) neurological disorder (eg, stroke, spinal cord injury or traumatic brain injury).
predictive measuresPredictive measures were collected during the initial session, either while in the clinic or at home after the session. Subjects who preferred to complete the survey at home were provided a handout with a link to the study website. OSPRO validation cohort baseline values for key predictive measures are reported in table 2.
Demographic and historical informationParticipants completed a standard intake form previ-ously used in our clinical studies including age, sex, race, ethnicity, employment status, litigation status, marital status, educational level, insurance provider type,
Figure 1 Study flow diagram for OSPRO validation study. *Items in bold are planned primary outcomes. OSPRO, Optimal Screening for Prediction of Referral and Outcome.
group.bmj.com on June 12, 2017 - Published by http://bmjopen.bmj.com/Downloaded from

4 George SZ, et al. BMJ Open 2017;7:e015188. doi:10.1136/bmjopen-2016-015188
Open Access
Tab
le 1
B
asel
ine
des
crip
tion
of k
ey d
emog
rap
hic
and
his
toric
al v
aria
ble
s fo
r O
SP
RO
val
idat
ion
coho
rt
Vari
able
Lab
elO
vera
ll (n
=44
0)N
eck
(n=
98)
Low
bac
k (n
=11
8)S
houl
der
(n=
107)
Kne
e (n
=11
7)
Age
*(2
mis
sing
)M
ean
±S
D45
.2±
15.8
42.8
±14
.745
.6±
16.0
47.8
±16
.044
.5±
16.2
Med
ian
(Min
, Max
)45 (1
8, 7
5)41 (2
0, 7
4)45 (1
8, 7
5)51 (1
8, 7
3)44
.5(1
8, 7
5)
Gen
der
Mal
e16
4 (3
7.3%
)23
(23.
5%)
49 (4
1.5%
)50
(46.
7%)
42 (3
5.9%
)
Fem
ale
275
(62.
5%)
74 (7
5.5%
)69
(58.
5%)
57 (5
3.3%
)75
(64.
1%)
Not
ans
wer
ed1
(0.2
%)
1 (1
.0%
)
Rac
eA
mer
ican
Ind
ian/
Ala
ska
Nat
ive
3 (0
.7%
)1
(1.0
%)
1 (0
.8%
)1
(0.9
%)
Asi
an25
(5.7
%)
5 (5
.1%
)1
(0.8
%)
9 (8
.4%
)10
(8.5
%)
Bla
ck o
r A
fric
an
Am
eric
an62
(14.
1%)
13 (1
3.3%
)15
(12.
7%)
11 (1
0.3%
)23
(19.
7%)
Whi
te34
3 (7
8.0%
)75
(76.
5%)
100
(84.
7%)
86 (8
0.4%
)82
(70.
1%)
Not
ans
wer
ed7
(1.6
%)
4 (4
.1%
)1
(0.8
%)
2 (1
.7%
)
Eth
nici
tyH
isp
anic
or
Latin
o31
(7.0
%)
9 (9
.2%
)7
(5.9
%)
7 (6
.5%
)8
(6.8
%)
Not
His
pan
ic o
r La
tino
376
(85.
5%)
81 (8
2.7%
)10
1 (8
5.6%
)97
(90.
7%)
97 (8
2.9%
)
Not
ans
wer
ed33
(7.5
%)
8 (8
.2%
)10
(8.5
%)
3 (2
.8%
)12
(10.
3%)
Inco
me
Less
tha
n $2
00 0
0059
(13.
4%)
7 (7
.1%
)18
(15.
3%)
16 (1
5.0%
)18
(15.
4%)
$20
000–
$35
000
53 (1
2.0%
)15
(15.
3%)
16 (1
3.6%
)8
(7.5
%)
14 (1
2.0%
)
$35
001–
$50
000
50 (1
1.4%
)14
(14.
3%)
10 (8
.5%
)7
(6.5
%)
19 (1
6.2%
)
$50
001–
$70
000
56 (1
2.7%
)19
(19.
4%)
15 (1
2.7%
)11
(10.
3%)
11 (9
.4%
)
Gre
ater
tha
n $7
0 00
015
6 (3
5.5%
)27
(27.
6%)
41 (3
4.7%
)50
(46.
7%)
38 (3
2.5%
)
Not
ans
wer
ed66
(15.
0%)
16 (1
6.3%
)18
(15.
3%)
15 (1
4.0%
)17
(14.
5%)
Em
plo
yed
Full-
time
237
(53.
9%)
66 (6
7.3%
)52
(44.
1%)
58 (5
4.2%
)61
(52.
1%)
Par
t-tim
e62
(14.
1%)
13 (1
3.3%
)21
(17.
8%)
18 (1
6.8%
)10
(8.5
%)
Une
mp
loye
d61
(13.
9%)
8 (8
.2%
)20
(16.
9%)
12 (1
1.2%
)21
(17.
9%)
Ret
ired
58 (1
3.2%
)7
(7.1
%)
21 (1
7.8%
)14
(13.
1%)
16 (1
3.7%
)
Not
ans
wer
ed22
(5.0
%)
4 (4
.1%
)4
(3.4
%)
5 (4
.7%
)9
(7.7
%)
Con
tinue
d
group.bmj.com on June 12, 2017 - Published by http://bmjopen.bmj.com/Downloaded from

5George SZ, et al. BMJ Open 2017;7:e015188. doi:10.1136/bmjopen-2016-015188
Open Access
Vari
able
Lab
elO
vera
ll (n
=44
0)N
eck
(n=
98)
Low
bac
k (n
=11
8)S
houl
der
(n=
107)
Kne
e (n
=11
7)
Ed
ucat
ion
Less
tha
n hi
gh s
choo
l11
(2.5
%)
2 (2
.0%
)4
(3.4
%)
1 (0
.9%
)4
(3.4
%)
Gra
dua
ted
from
hig
h sc
hool
38 (8
.6%
)3
(3.1
%)
13 (1
1.0%
)12
(11.
2%)
10 (8
.5%
)
Som
e co
llege
112
(25.
5%)
24 (2
4.5%
)34
(28.
8%)
25 (2
3.4%
)29
(24.
8%)
Gra
dua
ted
from
co
llege
120
(27.
3%)
33 (3
3.7%
)31
(26.
3%)
30 (2
8.0%
)26
(22.
2%)
Som
e p
ostg
rad
uate
56 (1
2.7%
)12
(12.
2%)
13 (1
1.0%
)12
(11.
2%)
19 (1
6.2%
)
Com
ple
ted
p
ostg
rad
uate
97 (2
2.0%
)20
(20.
4%)
22 (1
8.6%
)26
(24.
3%)
29 (2
4.8%
)
Not
ans
wer
ed6
(1.4
%)
4 (4
.1%
)1
(0.8
%)
1 (0
.9%
)
Insu
ranc
eP
rivat
e27
3 (6
2.0%
)65
(66.
3%)
74 (6
2.7%
)62
(57.
9%)
72 (6
1.5%
)
Med
icar
e52
(11.
8%)
4 (4
.1%
)17
(14.
4%)
12 (1
1.2%
)19
(16.
2%)
Med
icai
d19
(4.3
%)
5 (5
.1%
)7
(5.9
%)
4 (3
.7%
)3
(2.6
%)
Wor
ker'
s co
mp
ensa
tion
14 (3
.2%
)5
(5.1
%)
4 (3
.4%
)4
(3.7
%)
1 (0
.9%
)
Dis
abili
ty4
(0.9
%)
1 (0
.8%
)1
(0.9
%)
2 (1
.7%
)
Uni
nsur
ed7
(1.6
%)
2 (2
.0%
)1
(0.8
%)
3 (2
.8%
)1
(0.9
%)
Oth
er45
(10.
2%)
10 (1
0.2%
)12
(10.
2%)
10 (9
.3%
)13
(11.
1%)
Not
ans
wer
ed26
(5.9
%)
7 (7
.1%
)2
(1.7
%)
11 (1
0.3%
)6
(5.1
%)
Ons
et o
f sym
pto
ms
Gra
dua
l23
9 (5
4.3%
)51
(52.
0%)
61 (5
1.7%
)54
(50.
5%)
73 (6
2.4%
)
Sud
den
138
(31.
4%)
34 (3
4.7%
)47
(39.
8%)
31 (2
9.0%
)26
(22.
2%)
Trau
mat
ic63
(14.
3%)
13 (1
3.3%
)10
(8.5
%)
22 (2
0.6%
)18
(15.
4%)
Pre
viou
s ep
isod
es o
ver
pas
t ye
arYe
s22
4 (5
0.9%
)43
(43.
9%)
68 (5
7.6%
)57
(53.
3%)
56 (4
7.9%
)
No
185
(42.
0%)
43 (4
3.9%
)43
(36.
4%)
44 (4
1.1%
)55
(47.
0%)
Do
not
rem
emb
er31
(7.0
%)
12 (1
2.2%
)7
(5.9
%)
6 (5
.6%
)6
(5.1
%)
Wor
k-re
late
dYe
s63
(14.
3%)
19 (1
9.4%
)19
(16.
1%)
15 (1
4.0%
)10
(8.5
%)
No
345
(78.
4%)
68 (6
9.4%
)94
(79.
7%)
83 (7
7.6%
)10
0 (8
5.5%
)
Not
ans
wer
ed32
(7.3
%)
11 (1
1.2%
)5
(4.2
%)
9 (8
.4%
)7
(6.0
%)
Sur
gery
for
prim
ary
com
pla
int
Yes
83 (1
8.9%
)5
(5.1
%)
13 (1
1.0%
)24
(22.
4%)
41 (3
5.0%
)
No
357
(81.
1%)
93 (9
4.9%
)10
5 (8
9.0%
)83
(77.
6%)
76 (6
5.0%
)
*Ind
icat
es m
issi
ng it
ems
with
num
ber
of s
ubje
cts
for
a gi
ven
varia
ble
rep
orte
d in
col
umn.
Tab
le 1
C
ontin
ued
group.bmj.com on June 12, 2017 - Published by http://bmjopen.bmj.com/Downloaded from
6 George SZ, et al. BMJ Open 2017;7:e015188. doi:10.1136/bmjopen-2016-015188
Open Access
self-reported health status and surgical history.16-18 Histor-ical data included anatomical location of the pain, onset of symptoms, duration of symptoms, previous episodes and previous treatments.
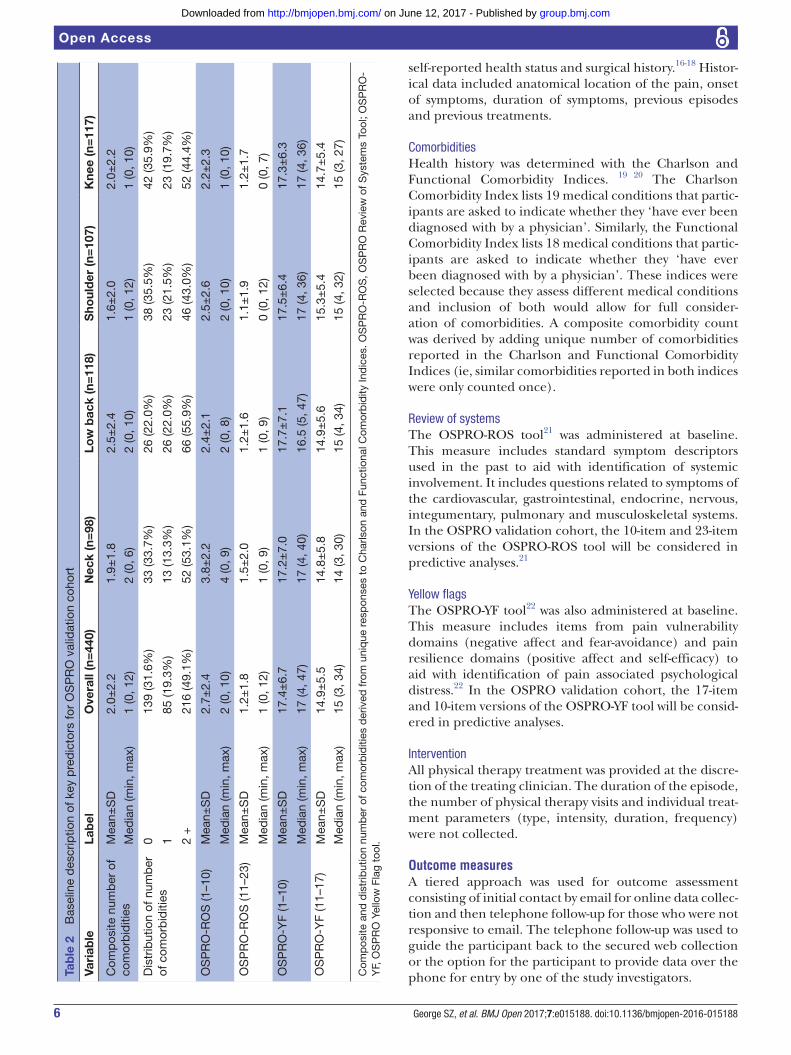
ComorbiditiesHealth history was determined with the Charlson and Functional Comorbidity Indices. 19 20 The Charlson Comorbidity Index lists 19 medical conditions that partic-ipants are asked to indicate whether they ‘have ever been diagnosed with by a physician’. Similarly, the Functional Comorbidity Index lists 18 medical conditions that partic-ipants are asked to indicate whether they ‘have ever been diagnosed with by a physician’. These indices were selected because they assess different medical conditions and inclusion of both would allow for full consider-ation of comorbidities. A composite comorbidity count was derived by adding unique number of comorbidities reported in the Charlson and Functional Comorbidity Indices (ie, similar comorbidities reported in both indices were only counted once).
Review of systemsThe OSPRO-ROS tool21 was administered at baseline. This measure includes standard symptom descriptors used in the past to aid with identification of systemic involvement. It includes questions related to symptoms of the cardiovascular, gastrointestinal, endocrine, nervous, integumentary, pulmonary and musculoskeletal systems. In the OSPRO validation cohort, the 10-item and 23-item versions of the OSPRO-ROS tool will be considered in predictive analyses.21
Yellow flagsThe OSPRO-YF tool22 was also administered at baseline. This measure includes items from pain vulnerability domains (negative affect and fear-avoidance) and pain resilience domains (positive affect and self-efficacy) to aid with identification of pain associated psychological distress.22 In the OSPRO validation cohort, the 17-item and 10-item versions of the OSPRO-YF tool will be consid-ered in predictive analyses.
InterventionAll physical therapy treatment was provided at the discre-tion of the treating clinician. The duration of the episode, the number of physical therapy visits and individual treat-ment parameters (type, intensity, duration, frequency) were not collected.
outcome measuresA tiered approach was used for outcome assessment consisting of initial contact by email for online data collec-tion and then telephone follow-up for those who were not responsive to email. The telephone follow-up was used to guide the participant back to the secured web collection or the option for the participant to provide data over the phone for entry by one of the study investigators.Ta
ble
2
Bas
elin
e d
escr
iptio
n of
key
pre
dic
tors
for
OS
PR
O v
alid
atio
n co
hort
Vari
able
Lab
elO
vera
ll (n
=44
0)N
eck
(n=
98)
Low
bac
k (n
=11
8)S
houl
der
(n=
107)
Kne
e (n
=11
7)
Com
pos
ite n
umb
er o
f co
mor
bid
ities
Mea
n±S
D2.
0±2.
21.
9±1.
82.
5±2.
41.
6±2.
02.
0±2.
2
Med
ian
(min
, max
)1
(0, 1
2)2
(0, 6
)2
(0, 1
0)1
(0, 1
2)1
(0, 1
0)
Dis
trib
utio
n of
num
ber
of
com
orb
iditi
es0
139
(31.
6%)
33 (3
3.7%
)26
(22.
0%)
38 (3
5.5%
)42
(35.
9%)
185
(19.
3%)
13 (1
3.3%
)26
(22.
0%)
23 (2
1.5%
)23
(19.
7%)
2 +
216
(49.
1%)
52 (5
3.1%
)66
(55.
9%)
46 (4
3.0%
)52
(44.
4%)
OS
PR
O-R
OS
(1–1
0)M
ean±
SD
2.7±
2.4
3.8±
2.2
2.4±
2.1
2.5±
2.6
2.2±
2.3
Med
ian
(min
, max
)2
(0, 1
0)4
(0, 9
)2
(0, 8
)2
(0, 1
0)1
(0, 1
0)
OS
PR
O-R
OS
(11–
23)
Mea
n±S
D1.
2±1.
81.
5±2.
01.
2±1.
61.
1±1.
91.
2±1.
7
Med
ian
(min
, max
)1
(0, 1
2)1
(0, 9
)1
(0, 9
)0
(0, 1
2)0
(0, 7
)
OS
PR
O-Y
F (1
–10)
Mea
n±S
D17
.4±
6.7
17.2
±7.
017
.7±
7.1
17.5
±6.
417
.3±
6.3
Med
ian
(min
, max
)17
(4, 4
7)17
(4, 4
0)16
.5 (5
, 47)
17 (4
, 36)
17 (4
, 36)
OS
PR
O-Y
F (1
1–17
)M
ean±
SD
14.9
±5.
514
.8±
5.8
14.9
±5.
615
.3±
5.4
14.7
±5.
4
Med
ian
(min
, max
)15
(3, 3
4)14
(3, 3
0)15
(4, 3
4)15
(4, 3
2)15
(3, 2
7)
Com
pos
ite a
nd d
istr
ibut
ion
num
ber
of c
omor
bid
ities
der
ived
from
uni
que
res
pon
ses
to C
harls
on a
nd F
unct
iona
l Com
orb
idity
Ind
ices
. OS
PR
O-R
OS
, OS
PR
O R
evie
w o
f Sys
tem
s To
ol; O
SP
RO
-Y
F, O
SP
RO
Yel
low
Fla
g to
ol.
group.bmj.com on June 12, 2017 - Published by http://bmjopen.bmj.com/Downloaded from
7George SZ, et al. BMJ Open 2017;7:e015188. doi:10.1136/bmjopen-2016-015188
Open Access
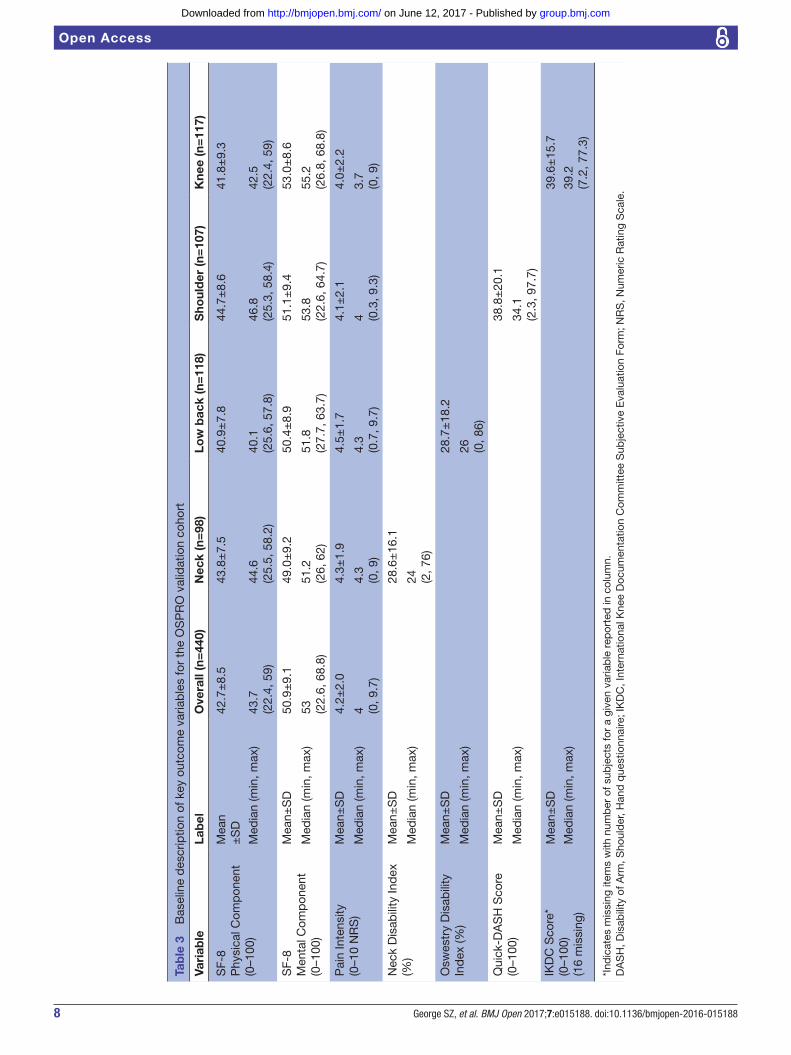
Primary and secondary measures were collected to determine whether there were any important status changes in health for longer-term outcomes. At 4 weeks, primary outcome assessment included pain intensity and self-report functional status to capture information about immediate response to the physical therapy episode. At 6 and 12 months, primary outcome assessment includes pain intensity and functional measures as well as previ-ously mentioned comorbidity assessment. Measures of chronic pain development or maintenance, healthcare utilisation, treatment expectations and patient satisfac-tion were collected at 6 and 12 months as secondary outcomes. OSPRO validation cohort baseline values for outcome measures are reported in table 3. These outcome measures are described in more detail below.
Pain intensityPain intensity was assessed by the Numeric Rating Scale ranging from ‘0’ (no pain) to ‘10’ (worst pain imagin-able).23-25 Participants rated their current pain intensity as well as their best (lowest) and worst (highest) pain inten-sity over the past 24 hours.
Pain interference Pain interference was assessed with four questions to determine the extent to which pain interfered with the participant’s abilities to participate in (1) daily activities, (2) work around the home, (3) social activities and (4) household chores over the previous 7 days. Potential responses were ‘None at all’, ‘A little bit’, ‘Somewhat’, ‘Quite a bit’ and ‘Very much’.
Self-report of functional statusSelf-report of functional status was assessed at intake and 1-year follow-up with two measures: (1) the Medical Outcomes Study 8-item Short-Form Health Survey (SF-8), which is a general quality of life measure that has physical and mental health domains26 and (2) the Neck Disability Index (NDI),27 28 Oswestry Disability Questionnaire,29 30 Quick Disability of Arm, Shoulder and Hand (DASH)31 or International Knee Documentation Committee Subjec-tive Knee Form32 as condition specific measures for cervical, low back, shoulder and knee pain, respectively.
Persistent or chronic pain statusPersistent or chronic pain status was assessed by self-re-port responses to questions accounting for duration of pain and activity limitations. At intake, pain status was determined using established definitions that account for the duration of pain and activity limitations33 34 using the following two questions: (1) ‘How long have you been experiencing your current painful symptoms?’ and (2) ‘Have you experienced ANY pain and activity limita-tions everyday for the past 3 months?’ For 6-month and 12-month follow-up assessments, we included questions to assess: (1) duration of symptoms over follow-up time and (2) duration of persistent, ongoing symptoms over consecutive days. These questions were selected as they
were similar to what was done for defining chronic low back pain.35
Healthcare utilisationHealthcare utilisation was assessed with questions derived from previous population-based studies involving muscu-loskeletal pain that have used survey methods for follow-up assessment.33 34 Briefly, patients were asked whether they have used any of the following: prescription pain medica-tion, injection, imaging, surgery, emergency room visits. ‘Yes’ responses were followed by questions regarding number of visits, types of diagnostic tests performed and interventions received. At 6 months, patients were queried about their utilisation over the past 2 months, allowing for a 4-month window for the current treatment episode to not be accounted for in this assessment. At 12 months, patients were queried about their utilisation over the past 6 months.
Treatment expectationTreatment expectation was assessed at 6 and 12 months with one item asking patients 'Are the results of your phys-ical therapy treatment what you expected?' (1—'definitely not' to 5—'definitely yes').36 37
Patient satisfactionPatient satisfaction was assessed at 6 and 12 months with three separate items asking patients: (1) 'If you had to spend the rest of your life with the symptoms you have right now, how would you feel about it?' (1—'very dissatis-fied' to 5—'very satisfied'), (2) 'Would you have the same physical therapy treatment again if you had the same condition?' (1—'definitely not' to 5—'definitely yes') and (3) 'How would you rate the overall results of your physical therapy treatment?' (1—'terrible' to 6—'excel-lent').36 37
Power analysisSample size estimates were based on precision for the assessment tools. The sample size was calculated so that 95% CI for the accuracy of predicting 23-item versions of the OSPRO-ROS tool from the abbreviated 10-item version have a width of at most ±5%. Specifically, we required that sample size N satisfies sqrt(p*(1-p)/N)*1.96<0.05, where p is the prediction accuracy. This calculation yielded 385 patients with neck, shoulder, low back or knee pain. A liberal estimate of 20% loss to follow-up at 1 year results in a required total sample size of 462, or approximately 115 patients for each anatomical region.
Overview of analysis planThe analysis plan was first developed in 2012 as part of the original grant proposal, with only minor modifica-tions made for changing specific measures during study implementation. Our primary analyses will assess the accuracy of predicting 12-month clinical and healthcare utilisation outcomes by the newly developed assess-ment tools. The outcomes of pain intensity (numeric pain rating scale (NPRS)), condition specific function
group.bmj.com on June 12, 2017 - Published by http://bmjopen.bmj.com/Downloaded from
8 George SZ, et al. BMJ Open 2017;7:e015188. doi:10.1136/bmjopen-2016-015188
Open Access
Tab
le 3
B
asel
ine
des
crip
tion
of k
ey o
utco
me
varia
ble
s fo
r th
e O
SP
RO
val
idat
ion
coho
rt
Vari
able
Lab
elO
vera
ll (n
=44
0)N
eck
(n=
98)
Low
bac
k (n
=11
8)S
houl
der
(n=
107)
Kne
e (n
=11
7)
SF-
8P
hysi
cal C
omp
onen
t(0
–100
)
Mea
n±
SD
42.7
±8.
543
.8±
7.5
40.9
±7.
844
.7±
8.6
41.8
±9.
3
Med
ian
(min
, max
)43
.7(2
2.4,
59)
44.6
(25.
5, 5
8.2)
40.1
(25.
6, 5
7.8)
46.8
(25.
3, 5
8.4)
42.5
(22.
4, 5
9)
SF-
8M
enta
l Com
pon
ent
(0–1
00)
Mea
n±S
D50
.9±
9.1
49.0
±9.
250
.4±
8.9
51.1
±9.
453
.0±
8.6
Med
ian
(min
, max
)53 (2
2.6,
68.
8)51
.2(2
6, 6
2)51
.8(2
7.7,
63.
7)53
.8(2
2.6,
64.
7)55
.2(2
6.8,
68.
8)
Pai
n In
tens
ity(0
–10
NR
S)
Mea
n±S
D4.
2±2.
04.
3±1.
94.
5±1.
74.
1±2.
14.
0±2.
2
Med
ian
(min
, max
)4 (0
, 9.7
)4.
3(0
, 9)
4.3
(0.7
, 9.7
)4 (0
.3, 9
.3)
3.7
(0, 9
)
Nec
k D
isab
ility
Ind
ex
(%)
Mea
n±S
D28
.6±
16.1
Med
ian
(min
, max
)24 (2
, 76)
Osw
estr
y D
isab
ility
In
dex
(%)
Mea
n±S
D28
.7±
18.2
Med
ian
(min
, max
)26 (0
, 86)
Qui
ck-D
AS
H S
core
(0
–100
)M
ean±
SD
38.8
±20
.1
Med
ian
(min
, max
)34
.1(2
.3, 9
7.7)
IKD
C S
core
*(0
–100
)(1
6 m
issi
ng)
Mea
n±S
D39
.6±
15.7
Med
ian
(min
, max
)39
.2(7
.2, 7
7.3)
*Ind
icat
es m
issi
ng it
ems
with
num
ber
of s
ubje
cts
for
a gi
ven
varia
ble
rep
orte
d in
col
umn.
DA
SH
, Dis
abili
ty o
f Arm
, Sho
uld
er, H
and
que
stio
nnai
re; I
KD
C, I
nter
natio
nal K
nee
Doc
umen
tatio
n C
omm
ittee
Sub
ject
ive
Eva
luat
ion
Form
; NR
S, N
umer
ic R
atin
g S
cale
.
group.bmj.com on June 12, 2017 - Published by http://bmjopen.bmj.com/Downloaded from

9George SZ, et al. BMJ Open 2017;7:e015188. doi:10.1136/bmjopen-2016-015188
Open Access
(z transformed scores for NDI, ODI, DASH and lower extremity function scale (LEFS)), quality of life (SF-8) and comorbidity change (from Charlson and/or Func-tional Comorbidity indices)will be fitted with generalised linear models using the newly developed screening tools as planned fixed effects. Logistic regression models will be fitted for dichotomous outcomes on various parame-ters of healthcare utilisation (eg, opioid use, injection, imaging, surgery and/or ER visits). We will consider age, sex, region of pain, clinical site, socioeconomic status, comorbidities (from Charlson and/or Functional Cormorbidity indices) and corresponding outcome measure at baseline as planned covariates in all predic-tion models.
Primary analyses will first be conducted with missing 12-month outcomes imputed by last-value-carried-for-ward method. The results will be compared with those obtained from complete case only analysis and those obtained from multiple imputations. Planned secondary analyses include prediction of other 12-month outcomes including pain interference, development of chronic pain, treatment expectation and patient satisfaction.
FIndIngs to dateThere are no longitudinal findings reported to date from the on-going OSPRO validation cohort. The separate and completed cross-sectional OSPRO development cohort yielded two assessment tools, the OSPRO-ROS21 and OSPRO-YF22, which serve as the primary predictors for the validation cohort.
Briefly, the OSPRO-ROS tool included items that accurately identified patients responding positively to at least one of the 97 items in a red flag symptom item bank. In psychometric analyses, a 10-item version of the OSPRO-ROS tool identified 94.7% of the positive responders to at least one of the items. A 23-item version of the OSPRO-ROS tool provided 100% accuracy. The OSPRO-ROS tools and the complete 97-item bank had similar correlations with concurrent clinical measures, except for a weaker association with depressive symptoms for the OSPRO-ROS tools. However, the ROS tools did still have a moderate positive association with depressive symptoms.
The OSPRO-YF tool included items that estimated estab-lished measures of pain vulnerability (negative affect and fear-avoidance) and resilience (positive affect and self-ef-ficacy). In psychometric analyses, the 17-item version of the OSPRO-YF tool identified elevated vulnerability and decreased resilience with at least 85% accuracy. A 10-item and 7-item version of the OSPRO-YF tool provided at least 81% and 75% accuracy, respectively. All versions of the OSPRO-YF tool contributed additional variance in multi-variate analyses investigating associations with measures of pain and disability (ranging from 19.3% to 36.7%) after controlling for demographics, historical variables and anatomical region of pain. These tools are described in much more detail in the original papers.21 22
strengths and lImItatIonsThe primary strength of the OSPRO validation cohort is the planned methodology to evaluate prognostic capa-bilities of newly developed assessment tools specifically designed to be concise and useful for clinical decision making. Another strength of this cohort is that patient follow-up occurred at 12 months following an initial phys-ical therapy encounter and included a wide variety of outcomes. Finally, a strength of this cohort study is use of assessment tools with flexibility for routine adminis-tration in busy practice settings. We acknowledge simply developing and validating assessment tools does not guar-antee a shift in clinical practice but it is a strength that these assessment tools can be administered using classical pen and paper methods. However, ideally they would be implemented and scored electronically to limit clinician burden. This is particularly important for the OSPRO-YF tool which has complicated scoring algorithms to provide score estimates of established full-length questionnaires. Electronic implementation will also allow for develop-ment of computer-based decision support systems, such as has been done for risk assessment involving worker’s compensation38 39 and chronic low back pain.40
The primary limitation of the OSPRO validation cohort is the reliance on convenience sampling for recruitment for pragmatic reasons. It would have been too burdensome for participating clinics to consecutively track patients for enrolment in the study. Concerns about selection bias are somewhat mitigated by our intentionally broad eligibility criteria that resulted in similarities in many demographic and clinical variables between the development and vali-dation cohorts. However, because the OSPRO-ROS and OSPRO-YF tools are newly developed, data are lacking to compare directly to the target population of interest and determine if the recruited cohorts were representative. We do acknowledge that ideally this sample would have been recruited consecutively. A second limitation is the lack of detailed information on individual treatments received by patients in the cohort. The decision to not collect indi-vidual level treatment information was driven by the goal to develop tools that broadly predicted outcomes. There were also logistic hurdles that could not be overcome in attempting to consistently track individual level treatment information from clinics participating in different health systems. A final limitation to consider is the sample size. While the sample size was adequate for the primary study questions, it may be too small to complete subgroup anal-yses that go beyond our planned secondary analyses.
collaboratIonAfter completion of final follow-up, there will be an embargo on the data sharing to allow the investigator team to complete the primary and secondary analyses. It is anticipated that this embargo period will be no greater than 18 months after completion of the study. At that point, the data will be de-identified and freely available for download. The data will be hosted on the Orthopaedic
group.bmj.com on June 12, 2017 - Published by http://bmjopen.bmj.com/Downloaded from

10 George SZ, et al. BMJ Open 2017;7:e015188. doi:10.1136/bmjopen-2016-015188
Open Access
Section of the American Physical Therapy Association website. There will be no restrictions to its use but to avoid duplicate reporting of findings permission from the Section must be gained by investigators who wish to reuse the data for scientific presentations or publications.
Further detaIlsClinical Practice Guidelines from the Orthopaedic Section of the American Physical Therapy Association have emphasised diagnosis, intervention and outcome assessment.41-47 Screening and prognosis are relatively underdeveloped and data from this validation cohort will help to inform this physical therapy practice area. Anal-yses from the OSPRO validation cohort will add to this evidence base as it will be the first systematic investigation we are aware of that includes review of systems and yellow flag assessment by US physical therapists. Previous studies focusing on these processes have not combined review of systems with yellow flags and have been completed in primary care outside of USA.8 48 The specificity of OSPRO may allow for direction suggestions to be made for improving clinical decision making in physical ther-apist practice in USA. Planned analyses from the already assembled validation cohort will assess the predictive capabilities of the OSPRO-YF and OSPRO-ROS tools for pain, function, quality of life, ccomorbiditychange and healthcare utilisation outcomes. In future studies, we plan to expand on clinimetric properties of these tools by assessing reliability, respondent burden and comparisons to other established screening tools. Collectively, these planned and future analyses will evaluate the absolute and relative accuracy and efficiency of using the OSPRO tools to predict clinical and utilisation outcomes when compared with existing assessment paradigms.
Dissemination of the findings from the OSPRO valida-tion will occur in several different venues. First, primary and secondary analyses will be published in peer-review journals that are accessible to physical therapists. Second, members of the investigator team will submit data from the validation cohort for presentation at scientific confer-ences. Third, the investigator team will plan educational sessions at national conferences that provide instruc-tion on implementation of these tools. Fourth, a website hosted by the Orthopaedic Section is planned that allows for automated scoring of the tools and provides estimates of clinical outcomes. Finally, members of the investigator team will integrate findings from the OSPRO validation study during capacity building and community engage-ment opportunities with key mmusculoskeletalpain stakeholders.49
Acknowledgements Brooks Rehabilitation provided resources for travel related to this study (e.g. clinic training and presentation of preliminary findings). OPT-IN Network Participants included: University of Florida: Joel Bialosky; UF Health: Giorgio Zeppieri, Jr., Daniel Broome, Marty Huegel, Debi Jones, Steve Emery, Mike Hodges, Derek Miles, Jodi Davis, Charlene Stubbington, Mike Darcy; ATI Physical Therapy: Ellen Shanley, Thomas Denninger, Jenna Bartsokas, Elise Harris, Jordan Floyd, Wade Harrell; University of Southern California: Lori Michener, Amy Pomrantz, Brooks Rehabilitation: Raine Osborne, Nata Salvatori, John Leschitz, Brian Hagist,
Laura Langer, Tim Shreve, Nando Malaman, Michael Bourassa, Justin Zych, Tasha Mouton Shanklin; University of Illinois at Chicago: Aaron Keil, Brad Myers, Deb Davey, Justin Payette, Adam Wielechowski, Richard Severin, Erik Martinez; Indiana State University: Ryan Hanigan, Carolina Valencia, Danielle Jena, Nicole Woodard; Arcadia University: Angela Tate; Life’s Work Physical Therapy: Sandra Stryker, Aaron Leonard, Erin Courtney, Brandon Little, Kathryn Jankord, Brad Simpson, Charleen Hall, Paige Nixon, Julia Neufeld; University of Colorado, Declnver: Paul Mintken, Virginia Arnette, Andrea Barsch.
Contributors SZG secured funding, provided overall design, gave input on the analysis plan and approved final version of the manuscript. JMB provided input on design and analysis plan and approved final version of the manuscript. TAL provided input on design, outcome measures and approved final version of the manuscript. SSW led the analysis plan and approved final version of the manuscript.
Funding All authors on this project were supported by the 2013 Clinical Research Network grant from the Orthopaedic Section, American Physical Therapy Association. SZG and JMB received additional support from Brooks Rehabilitation while designing this study and writing this protocol paper. JMB received support from the American National Institutes of Health (NIH) Rehabilitation Research Career Development Program (K12-HD055929). TAL received support from the Foundation for Physical Therapy with a Promotion of Doctoral Studies I (PODS I) Award.
Competing interests None declared.
Patient consent We used local IRB consent forms for this study.
Ethics approval University of Florida Institutional Review Board-01.
Provenance and peer review Not commissioned; externally peer reviewed.
Data sharing statement This is not an original research article. There is a collaboration portion in the paper as is required for cohort profiles.
Open Access This is an Open Access article distributed in accordance with the Creative Commons Attribution Non Commercial (CC BY-NC 4.0) license, which permits others to distribute, remix, adapt, build upon this work non-commercially, and license their derivative works on different terms, provided the original work is properly cited and the use is non-commercial. See: http:// creativecommons. org/ licenses/ by- nc/ 4.0/
© Article author(s) (or their employer(s) unless otherwise stated in the text of the article) 2017. All rights reserved. No commercial use is permitted unless otherwise expressly granted.
references 1. Pendergast J, Kliethermes SA, Freburger JK, et al. A comparison of
health care use for physician-referred and self-referred episodes of outpatient physical therapy. Health Serv Res 2012;47:633–54.
2. Mitchell JM, de Lissovoy G. A comparison of resource use and cost in direct access versus physician referral episodes of physical therapy. Phys Ther 1997;77:10–18.
3. American Physical Therapy Association. Direct Access at the State Level. 2016 http://www. apta. org/ StateIssues/ DirectAccess/ .
4. Shoemaker MJ. Direct consumer access to physical therapy in Michigan: challenges to policy adoption. Phys Ther 2012;92:236–50.
5. American Physical Therapy Association. Guide to Physical Therapist Practice 3.0. 2014 http:// guidetoptpractice. apta. org/ .
6. Nicholas MK, Linton SJ, Watson PJ, et al. Psychological predictors of recovery from low back pain: a prospective study. BMC Musculoskelet Disord 2011;16.
7. Main CJ, George SZ. Psychologically informed practice for management of low back pain: future directions in practice and research. Phys Ther 2011;91:820–4.
8. Henschke N, Maher CG, Refshauge KM, et al. Prevalence of and screening for serious spinal pathology in patients presenting to primary care settings with acute low back pain. Arthritis Rheum 2009;60:3072–80.
9. Underwood M. Diagnosing acute nonspecific low back pain: time to lower the red flags? Arthritis Rheum 2009;60:2855–7.
10. Ferguson FC, Morison S, Ryan CG. Physiotherapists' understanding of red flags for back pain. Musculoskeletal Care 2015;13:42–50.
11. Roach KE, Brown M, Ricker E, et al. The use of patient symptoms to screen for serious back problems. J Orthop Sports Phys Ther 1995;21:2–6.
12. Foster NE, Delitto A. Embedding psychosocial perspectives within clinical management of low back pain: integration of psychosocially informed management principles into physical therapist practice--challenges and opportunities. Phys Ther 2011;91:790–803.
group.bmj.com on June 12, 2017 - Published by http://bmjopen.bmj.com/Downloaded from
11George SZ, et al. BMJ Open 2017;7:e015188. doi:10.1136/bmjopen-2016-015188
Open Access
13. Foster NE, Thomas E, Bishop A, et al. Distinctiveness of psychological obstacles to recovery in low back pain patients in primary care. Pain 2010;148:398–406.
14. Singla M, Jones M, Edwards I, et al. Physiotherapists' assessment of patients' psychosocial status: are we standing on thin ice? A qualitative descriptive study. Man Ther 2015;20:328–34.
15 Perry JJ, Stiell IG. Impact of clinical decision rules on clinical care of traumatic injuries to the foot and ankle, knee, cervical spine, and head. Injury 2006;37:1157–65.
16. George SZ, Fritz JM, Bialosky JE, et al. The effect of a fear-avoidance-based physical therapy intervention for patients with acute low back pain: results of a randomized clinical trial. Spine 2003;28:2551–60.
17. George SZ, Zeppieri G, Cere AL, et al. A randomized trial of behavioral physical therapy interventions for acute and sub-acute low back pain (NCT00373867). Pain 2008;140:145–57.
18. Beneciuk JM, Bishop MD, Fritz JM, et al. The STarT Back Screening Tool and Individual Psycholgical Measures: Prognostic Indicator or Treatment Monitoring for Low Back Pain Clinical Outcomes. Phys Ther 2012;93:321–33.
19. Charlson ME, Pompei P, Ales KL, et al. A new method of classifying prognostic comorbidity in longitudinal studies: development and validation. J Chronic Dis 1987;40:373–83.
20. Groll DL, To T, Bombardier C, et al. The development of a comorbidity index with physical function as the outcome. J Clin Epidemiol 2005;58:595–602.
21. George SZ, Beneciuk JM, Bialosky JE, et al. Development of a Review-of-Systems Screening Tool for Orthopaedic Physical Therapists: results from the optimal screening for prediction of referral and outcome (OSPRO) Cohort. J Orthop Sports Phys Ther 2015;45:512–26.
22. Lentz TA, Beneciuk JM, Bialosky JE, et al. Development of a yellow flag Assessment Tool for Orthopaedic Physical Therapists: results from the optimal screening for prediction of referral and outcome (OSPRO) Cohort. J Orthop Sports Phys Ther 2016;46:327–43.
23. Jensen MP, Turner JA, Romano JM, et al. Comparative reliability and validity of chronic pain intensity measures. Pain 1999;83:157–62.
24. Bolton JE. Accuracy of recall of usual pain intensity in back pain patients. Pain 1999;83:533–9.
25. Childs JD, Piva SR, Fritz JM. Responsiveness of the numeric pain rating scale in patients with low back pain. Spine 2005;30:1331–4.
26. Kosinski M, Dewey JE , et al. How to Score and Interpret Single-Item Health Status Measures: A Manual for Users of the SF-8TM: Ware JEQuality Metric Incoporated, 2001.
27. Vernon H, Mior S. The Neck Disability Index: a study of reliability and validity. J Manipulative Physiol Ther 1991;14:409–15.
28. Vernon H. The Neck Disability Index: state-of-the-art, 1991-2008. J Manipulative Physiol Ther 2008;31:491–502.
29. Hudson-Cook N, Tomes-Nicholson K. Breen A. A revised Oswestry disability questionnaire. In: Roland MO, Jenner JR, eds. Back Pain: New Approaches to Rehabilitation and Education. New York, NY: Manchester University Press, 1989:187–204.
30. Fritz JM, Irrgang JJ. A comparison of a modified Oswestry Low Back Pain Disability Questionnaire and the Quebec Back Pain Disability Scale. Phys Ther 2001;81:776–88.
31. Beaton DE, Wright JG, Katz JN. Upper Extremity Collaborative G. Development of the QuickDASH: comparison of three item-reduction approaches. J Bone Joint Surg Am 2005;87:1038–46.
32. Irrgang JJ, Anderson AF, Boland AL, et al. Development and validation of the international knee documentation committee subjective knee form. Am J Sports Med 2001;29:600–13.
33. Freburger JK, Holmes GM, Agans RP, et al. The rising prevalence of chronic low back pain. Arch Intern Med 2009;169:251.
34. Carey TS, Freburger JK, Holmes GM, et al. Race, care seeking, and utilization for chronic back and neck pain: population perspectives. J Pain 2010;11.
35. Deyo RA, Dworkin SF, Amtmann D, et al. Report of the NIH Task Force on research standards for chronic low back pain. J Pain 2014;15:569–85.
36. Daltroy LH, Cats-Baril WL, Katz JN, et al. The north american spine society lumbar spine outcome assessment Instrument: reliability and validity tests. Spine 1996;21:741–9.
37. George SZ, Robinson ME, Preference RME. Preference, expectation, and satisfaction in a clinical trial of behavioral interventions for acute and sub-acute low back pain. J Pain 2010;11:1074–82.
38. Steenstra IA, Ibrahim SA, Franche RL, et al. Validation of a risk factor-based intervention strategy model using data from the readiness for return to work cohort study. J Occup Rehabil 2010;20:394–405.
39. Brouwer S, Franche RL, Hogg-Johnson S, et al. Return-to-work self-efficacy: development and validation of a scale in claimants with musculoskeletal disorders. J Occup Rehabil 2011;21:244–58.
40. Traeger AC, Henschke N, Hübscher M, et al. Estimating the risk of chronic pain: development and Validation of a Prognostic Model (PICKUP) for patients with acute low back pain. PLoS Med 2016;13:e1002019.
41. McPoil TG, Martin RL, Cornwall MW, et al. Heel pain--plantar fasciitis: clinical practice guildelines linked to the international classification of function, disability, and health from the orthopaedic section of the American Physical Therapy Association. J Orthop Sports Phys Ther 2008;38:A1–A18.
42. Carcia CR, Martin RL, Houck J, et al. Orthopaedic Section of the American Physical Therapy A. Achilles pain, stiffness, and muscle power deficits: achilles tendinitis. The Journal of orthopaedic and sports physical therapy 2010 A1–A26.
43. Logerstedt DS, Snyder-Mackler L, Ritter RC, et al. Orthopaedic Section of the American Physical Therapist A. Knee stability and movement coordination impairments: knee ligament sprain. The Journal of orthopaedic and sports physical therapy 2010.
44. Logerstedt DS, Snyder-Mackler L, Ritter RC, et al. Orthopedic Section of the American Physical Therapy A. Knee pain and mobility impairments: meniscal and articular cartilage lesions. The Journal of orthopaedic and sports physical therapy 2010 40 A1–A35.
45. Cibulka MT, White DM, Woehrle J, et al. Hip pain and mobility deficits--hip osteoarthritis: clinical practice guidelines linked to the international classification of functioning, disability, and health from the orthopaedic section of the American Physical Therapy Association. J Orthop Sports Phys Ther 2009;39:A1–A25.
46. Childs JD, Cleland JA, Elliott JM, et al. American Physical Therapy Association. Neck pain: Clinical practice guidelines linked to the International Classification of Functioning, Disability, and Health from the Orthopedic Section of the American Physical Therapy Association. J Orthop Sports Phys Ther 2008;38.
47. Delitto A, George SZ, Van Dillen L, et al. Low Back Pain. Journal of Orthopaedic & Sports Physical Therapy 2012;42:A1–A57.
48. Hill JC, Dunn KM, Lewis M, et al. A primary care back pain screening tool: identifying patient subgroups for initial treatment. Arthritis Rheum 2008;59:632–41.
49. Patient-Centered Outcomes Research Institute. ‘As a Matter of Pain’ – Capacity Building & Community Engagement for Patient Centered Musculoskeletal Pain Research - Tier I. 2016 http://www. pcori. org/ research- results/ 2016/ % E2% 80% 98- matter- pain% E2% 80% 99- % E2% 80% 93- capacity- building- community- engagement- patient- centered .
group.bmj.com on June 12, 2017 - Published by http://bmjopen.bmj.com/Downloaded from
longitudinal validation cohort from the USAwith musculoskeletal pain conditions: aReferral and Outcome (OSPRO) in patients The Optimal Screening for Prediction of
Steven Z George, Jason M Beneciuk, Trevor A Lentz and Samuel S Wu
doi: 10.1136/bmjopen-2016-0151882017 7: BMJ Open
http://bmjopen.bmj.com/content/7/6/e015188Updated information and services can be found at:
These include:
References #BIBLhttp://bmjopen.bmj.com/content/7/6/e015188
This article cites 39 articles, 6 of which you can access for free at:
Open Access
http://creativecommons.org/licenses/by-nc/4.0/non-commercial. See: provided the original work is properly cited and the use isnon-commercially, and license their derivative works on different terms, permits others to distribute, remix, adapt, build upon this workCommons Attribution Non Commercial (CC BY-NC 4.0) license, which This is an Open Access article distributed in accordance with the Creative
serviceEmail alerting
box at the top right corner of the online article. Receive free email alerts when new articles cite this article. Sign up in the
CollectionsTopic Articles on similar topics can be found in the following collections
(698)Evidence based practice
Notes
http://group.bmj.com/group/rights-licensing/permissionsTo request permissions go to:
http://journals.bmj.com/cgi/reprintformTo order reprints go to:
http://group.bmj.com/subscribe/To subscribe to BMJ go to:
group.bmj.com on June 12, 2017 - Published by http://bmjopen.bmj.com/Downloaded from