
OOG Restructuring · operate the PLSV Polar Onyx with Ceona 2015 - today OOG is provisionally...
65
OOG Restructuring May 2017 CONFIDENTIAL SETTLEMENT COMMUNICATION SUBJECT TO FRE 408
Transcript of OOG Restructuring · operate the PLSV Polar Onyx with Ceona 2015 - today OOG is provisionally...

OOG Restructuring
May 2017
CONFIDENTIAL SETTLEMENT COMMUNICATION SUBJECT TO FRE 408

The material that follows is a confidential presentation of general background information about Odebrecht Óleo e Gás S.A. and
certain of its subsidiaries and joint venture projects (together, the “Company”) as of the date of this material. This material has
been prepared solely for informational purposes. This presentation is not an offer with respect to any securities or a solicitation of
votes to accept a plan of reorganization within the meaning of the U.S. Bankruptcy Code. Any such offer or solicitation will comply
with all applicable securities laws and/or provisions of the U.S. Bankruptcy Code.
No representation or warranty, express or implied, is made by the Company or any of its affiliates or representatives concerning,
and no reliance should be placed on, the accuracy, fairness, or completeness of this information. This material may contain
certain “forward-looking statements” and information relating to the Company that reflects the current views and/or expectations
of the Company and its management with respect to performance, business and future events. Such statements are subject to a
number of risks, uncertainties and assumptions. Such statements are only predictions and are not guarantees of future
performance. A number of important factors could cause actual results to differ materially from the plans, objectives,
expectations, estimates and intentions expressed in these materials. All forward-looking statements in this presentation are based
on information and data available as of the date they were made, and the Company makes no undertaking to update them in
light of new information or future developments.
This presentation and its contents are proprietary information and may not be reproduced or otherwise disseminated in whole or
in part without the Company’s prior written consent.
Confirmation of your Representation: In order to be eligible to view these materials, the recipient must be either (1) a
Qualified Institutional Buyer (a “QIB”) (within the meaning of Rule 144A under the U.S. Securities Act of 1933, as amended (the
“Securities Act ”) or (2) a non-U.S. person (within the meaning of Regulation S under the Securities Act) outside the U.S. These
materials are being delivered to you at your request and by accepting and accessing these materials, you shall be deemed to
have represented to us that you and any customers you represent are either (a) QIBs or (b) non-U.S. persons (within the
meaning of Regulation S under the Securities Act).
Disclaimer
Agenda
1. Company Overview
2. Why Restructuring
3. Summary of Restructuring
4. Restructuring Implementation Proceeding
5. Appendix
a) OOG Corporate Structure
b) Quarterly Budget
c) Overview of Contract Rates
d) Opex Detailing
CONFIDENTIAL SETTLEMENT COMMUNICATION SUBJECT TO FRE 408

4
Odebrecht Presence in the Oil & Gas Sector($ in millions)
Company Overview
Odebrecht Oil & Gas (“OOG”) is a leading Brazilian oilfield services
company and is the oilfield services arm of Odebrecht Group, one of the
largest business conglomerates in Latin America
Created in 2006 to concentrate the Group’s oil & gas investments in a
new company
OOG provides integrated, customized solutions for the upstream oil
industry in Brazil and around the world. It can serve its customers
throughout their business cycle from design engineering, project
management, and integrated service delivery to offshore drilling rigs and
production platforms
Backlog Breakdown
(1) Excludes Sete Brasil contracts.(2) Does not consolidate Cidade de Itajaí, Pioneiro de Libra and PLSVs Assets. (3) No audited financial statements have been issued since December 31, 2015. 1H16 are unaudited figures.(4) Annualized Net Debt EBITDA.
Business Segments
US$ MM 2012 2013 2014 2015 1H15 1H16(3)
Income Statement
Net Revenue 691 988 1,187 1,101 582 478
Growth (%) 86.5% 42.9% 20.1% (7.3%) n/a (17.9%)
EBITDA 273 475 505 556 307 275
EBITDA Margin (%) 39.5% 48.1% 42.5% 50.5% 53% 58%
Net Income (22) (34) (75) (218) 53 (57)
Net Margin (%) (3.2%) (3.4%) (6.3%) (20%) 9.1% (12%)
Balance Sheet
Total Assets 6,160 6,044 6,205 5,707 6,141 5,578
Total Fixed Assets 5,193 5,153 5,041 4,698 5,011 4,638
Cash 431 298 445 244 364 152
Cash and Equivalents 390 212 331 69 148 66
Short-Term Investments
41 86 114 175 216 86
Total Debt 4,683 4,564 4,809 4,539 4,674 4,476
Shareholders' Equity 1,269 1,211 1,121 859 1,169 783
Consolidated Net Debt/ EBITDA
15.6x 9.0x 8.6x 7.7x 7.0x(4) 7.9x(4)
Consolidated Financial Highlights(2)
CONFIDENTIAL SETTLEMENT COMMUNICATION SUBJECT TO FRE 408
Total Backlog: US$ 4.8bn (as of December 31, 2016)(1)
Drilling (excl. Sete Br), 68%
Production, 24%
Subsea, 5% Maintenance, 4%

5
OOG ParentCo
PLSVs(Coral do Atlântico and Estrela do Mar)
Maintenance and Offshore Services
(MSO)
2022 Structure (ODN I & II, Tay IV,
Norbe VI)ODN Delba III
FPSOs CDI and Libra
100% 100% 100% 100%50%
2021 Structure (Norbe VIII & IX)
50%
OOG Current Simplified Corporate Structure
Economicinterest:
100%
ODN I & II: 60%Norbe VI: 100%Tay IV: 100% 48% 100%50% 50%Ownership

6
Odebrecht Oil & Gas History
Growth opportunities Incorporation of Odebrecht Oil & Gas
Consolidation of the offshore oilfield services capabilities
Increased exposure to oil and gas sector
Divestment of all shallow and mid water assets by the end of the decade
Joint venture with Maersk to operate an FPSO in the North Sea
1990’s1970’s to 1980’s 2000’s 2011 - 2014
Starts
operating in
the offshore
drilling
industry
Operations in the
offshore segment
First Brazilian
company to provide
offshore drilling
services to Petrobras
Largest privately
owned offshore
drilling and
exploration fleet
8 platforms in Brazil
by the end of the
1980's
Contract for Norbe VI
Contracts for Norbe VIII and Norbe IX
2010
Increasing drilling portfolio
Contracts for ODN I and ODN II
Norbe VIII / IX Project Bond
Partnership with Temasek (1st round of private placement)
Contracts for ODN Delba III and ODN TAY IV
Strengthening
position in
Production and
Subsea with
Cidade de
Itajaí and 2
PLSVs with
Technip
Partnership
with Gávea
Investimentos
(2nd round of
private
placement)
Partnership
with Sete
Brasil –
Contract to
operate 5 rigs
to be built in
Brazil
Operations of
3 third-party
deepwater
rigs
ODN Tay IV
Project Bond
retap and
Perpetual
Bond Issuance
Libra FPSO
contract
(OOG-TK)
Start of drop
in oil prices
Start of
“Carwash”
investigations
ODN I & II and
Norbe VI Project
Bond and
contract to
operate the PLSV
Polar Onyx with
Ceona
2015 - today
OOG is
provisionally
blocked by
Petrobras from
submitting
new proposals
ODN TAY IV
contract
termination
OOG write off
in Sete Brasil
investment
OOG ParentCo
loses
Investment
Grade Rating
Project Bonds
2021 and 2022
lose
Investment
Grade Rating
Gávea
Investimentos sells
equity interest to
ODB for nominal
value
Temasek sells
equity interest to
ODB for nominal
value
Perpetual Bond
coupon payment
default
OOG Debt
Restructuring
Libra FPSO
start of
Operations
Oil & gas down cycle
To occur
CONFIDENTIAL SETTLEMENT COMMUNICATION SUBJECT TO FRE 408

7
OOG Management – Key Executives
Board of Directors(1) – 8 members (1 Independent)
OOG ParentCo corporate governance includes a board of directors and 3 supporting committees
Name Function
Roberto Lopes Pontes Simões CEO
Herculano de Almeida Barbosa Engineering & Technology
Rogerio Luis Murat Ibrahim CFO
Heitor Gioppo Drilling
Jorge Luis Uchoa MitidieriSubsea, Production and
Maintenance
Guilherme Pacheco de Britto Legal
Marco Aurélio Fonseca Sustainability
José Cláudio Breviglieri Grossi Human Resources
Nir Lander Head of Compliance
Helena Ramos Head of Corporate Finance
Name Function Representative of
Luciano Guidolin Chairman Odebrecht S.A.
André Amaro Director Odebrecht S.A.
Daniel Villar Director Odebrecht S.A.
Marcela Drehmer Director Odebrecht S.A.
Ticiana Marianetti Director Odebrecht S.A.
Monica Bahia Director Odebrecht S.A.
Mauro Motta Director Odebrecht S.A.
José Coutinho Director Independent
OOG Key Executives
Note: As of Jan/31/2017(1) At OOG Par level. Refer to appendix for complete OOG corporate structure.
CONFIDENTIAL SETTLEMENT COMMUNICATION SUBJECT TO FRE 408

8
OOG Supporting Committees
Name Committee Role
Marcela Drehmer Coordinator
Mauro Figueiredo Motta Member
Ticiana Marianetti Member
Rogerio Ibrahim Guest
Guilherme Britto Guest
Danielli Santiago Pugliese Secretary
Name Committee Role
Daniel Villar Coordinator
Marco Aurelio Fonseca Guest
José Cláudio Grossi Guest
Danielli Santiago Pugliese Secretary
Pre-approval of financial statements (before board)
Evaluation and pre-approval (before board) of new projects
Monitoring of ongoing projects (before operations)
Pre-approval of financial transactions (before board)
Monitor key personnel performance
Establishment of human resources policy
Replacement and promotion plans for top and middle management
CPO (People & Organization Committee)
CFI (Financial Investment Committee)
Name Committee Role
Andre Amaro Coordinator
Ticiana Marianetti Member
Nir Lander Guest
Alexandre Cezimbra Secretary
Monitoring the internal compliance control systems and compliance with laws, standards, and regulations
Conducting and/or authorizing investigations into matters within its scope
Proposing periodic updates to the OOG Policy on Compliance and Proposing supplemental guidelines needed for the activity
Promoting interaction with national and international entities, oriented toward best practices in Compliance
Compliance Committee
Note: As of Jan/31/2017
CONFIDENTIAL SETTLEMENT COMMUNICATION SUBJECT TO FRE 408

Associated investments totaling ~US$5 billion(1)
Drilling Unit backlog of US$3.3bn as of Dec/16(2)
9
Fleet Overview
Norbe VIII Norbe IX Norbe VI ODN I ODN II ODN Tay IV ODN Delba III
[PIC] [PIC] [PIC] [PIC] [PIC] [PIC] [PIC]
Ownership 100% 100% 100% 60%(5) 60%(5) 100% 48%(5)
Client Petrobras Petrobras Petrobras Petrobras Petrobras Not Chartered Petrobras
Charter daily rate (3) US$381 US$358 US$210 US$335 US$335 n.m. US$223
Services daily rate (3) R$123 R$116 R$450 R$109 R$109 n.m. R$477
Contract Maturity
Jul 2021 Oct 2021 Jul 2018(4) Sep 2022 Aug 2022 n.m. Aug 2019
Year Built2011
(DSME)2011
(DSME)2010 (SBM)
2011 (DSME)
2011(DSME)
1981/ converted to drilling rig in 1999 / refurbished in 2011
2011 (SBM)
DrillingCapacitywater depth
3,000m 3,000m 2,400m 3,000m 3,000m 2,400m 2,400m
DesignDSME 10,000
DSME 10,000
TDS-2000 Plus
DSME 10,000
DSME 10,000
Friede & Goldman L-767C
TDS-2500
2021 BOND STRUCTURE 2022 BOND STRUCTURE DELBA III
(1) Includes all of OOG assets.(2) Excludes Sete Brasil contracts.(3) As of March/2017. Charter daily rates in $ 000’. Service daily rates in R$ 000’. (4) Norbe VI contract was originally scheduled to expire on July 11, 2018 and was extended for an additional 258 days as a result of an unilateral extension right exercised by Petrobras in 2013.
Afterwards (in 2016), Petrobras decided to revoke its decision and the original expiration date was restated.
(5) Economic interest of 100%.
Currently idle in Tenerife and will
likely be scrapped in 2H2017
CONFIDENTIAL SETTLEMENT COMMUNICATION SUBJECT TO FRE 408
10
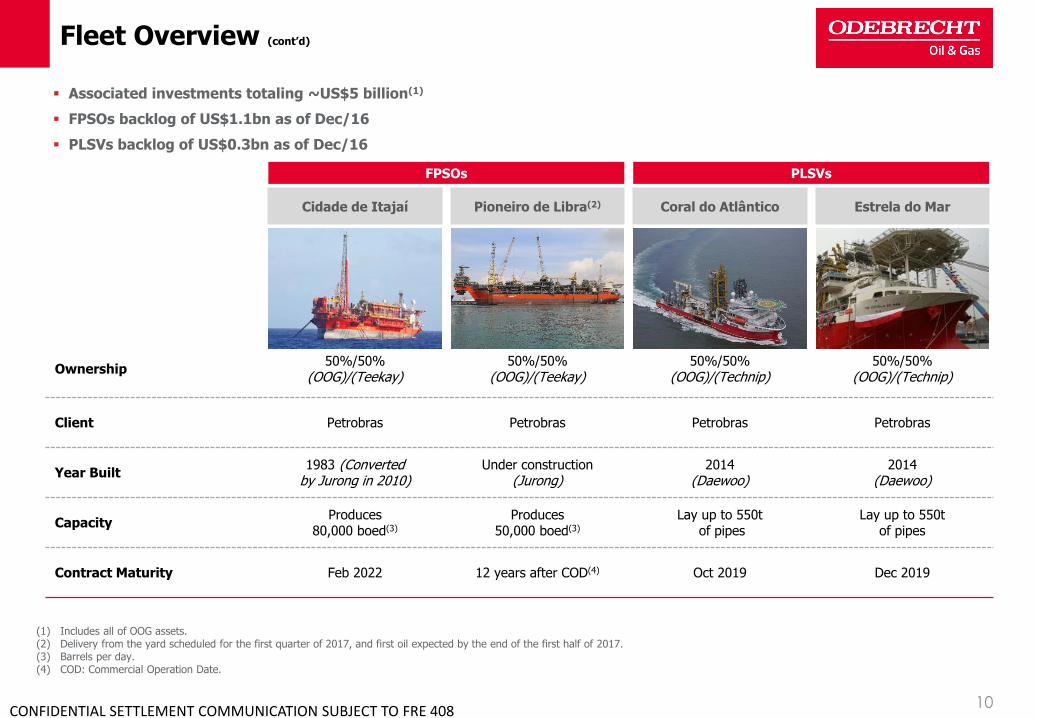
Fleet Overview (cont’d)
Cidade de Itajaí Pioneiro de Libra(2) Coral do Atlântico Estrela do Mar
[PIC] [PIC] [PIC] [PIC]
Ownership50%/50%
(OOG)/(Teekay)50%/50%
(OOG)/(Teekay)50%/50%
(OOG)/(Technip)50%/50%
(OOG)/(Technip)
Client Petrobras Petrobras Petrobras Petrobras
Year Built1983 (Converted
by Jurong in 2010)Under construction
(Jurong)2014
(Daewoo)2014
(Daewoo)
CapacityProduces
80,000 boed(3)
Produces 50,000 boed(3)
Lay up to 550tof pipes
Lay up to 550t of pipes
Contract Maturity Feb 2022 12 years after COD(4) Oct 2019 Dec 2019
PLSVsFPSOs
Associated investments totaling ~US$5 billion(1)
FPSOs backlog of US$1.1bn as of Dec/16
PLSVs backlog of US$0.3bn as of Dec/16
(1) Includes all of OOG assets.(2) Delivery from the yard scheduled for the first quarter of 2017, and first oil expected by the end of the first half of 2017.(3) Barrels per day.(4) COD: Commercial Operation Date.
CONFIDENTIAL SETTLEMENT COMMUNICATION SUBJECT TO FRE 408

11
Operational Track Record
CONFIDENTIAL SETTLEMENT COMMUNICATION SUBJECT TO FRE 408
OOG’s Drilling Fleet historical performance (yearly)
(1) Excludes ODN Tay IV.
(1) (1)

12
Operational Track Record (cont’d)
CONFIDENTIAL SETTLEMENT COMMUNICATION SUBJECT TO FRE 408
96%
70%
80%
99%
90% 92%97% 97%
89%94%
84%
100%
90%86%
97%
70%
81%
108%
93%98%
101% 103%
91%94% 94%
100%
88% 88%
3Q13 4Q13 1Q14 2Q14 3Q14 4Q14 1Q15 2Q15 3Q15 4Q15 1Q16 2Q16 3Q16 4Q16
ODEBRE 21'
Operational Uptimes Economic Uptimes
88%83%
96%
80%
72%
94%90% 88%
96%
76%
97% 98%92%
85%
93%88%
102%
83%76%
97%93% 93%
104%
77%
104%101% 98%
86%
3Q13 4Q13 1Q14 2Q14 3Q14 4Q14 1Q15 2Q15 3Q15 4Q15 1Q16 2Q16 3Q16 4Q16
ODEBRE 22'
Operational Uptimes Economic Uptimes
(1)
Original Series
Issuance
New Series
Issuance
(1) (1) (1) (1) (1)
(1) Excludes ODN Tay IV.
13
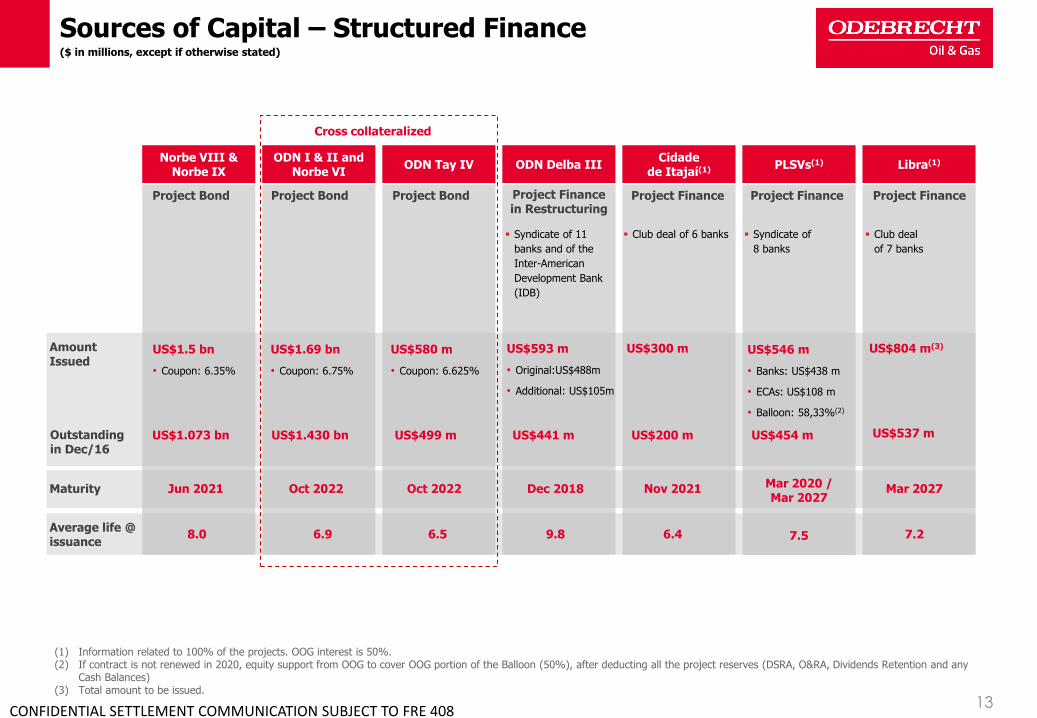
Sources of Capital – Structured Finance($ in millions, except if otherwise stated)
Project FinanceProject Bond Project Finance in Restructuring
Project Bond
Amount Issued
Average life @ issuance
Cidade de Itajaí(1)
ODN I & II and Norbe VI
ODN Tay IV ODN Delba III
US$1.69 bn
• Coupon: 6.75%
6.9
US$593 m
• Original:US$488m
• Additional: US$105m
9.8
Syndicate of 11
banks and of the
Inter-American
Development Bank
(IDB)
6.5
US$300 m
6.4
Club deal of 6 banks
Maturity Oct 2022 Dec 2018Oct 2022 Nov 2021
Project Finance
PLSVs(1)
7.5
Mar 2020 /Mar 2027
Syndicate of
8 banks
US$546 m
• Banks: US$438 m
• ECAs: US$108 m
• Balloon: 58,33%(2)
US$580 m
• Coupon: 6.625%
Cross collateralized
Outstandingin Dec/16
Project Bond
Norbe VIII &Norbe IX
US$1.5 bn
• Coupon: 6.35%
8.0
Jun 2021
US$1.073 bn US$1.430 bn US$499 m US$441 m US$200 m US$454 m
Project Finance
Libra(1)
Club deal
of 7 banks
US$804 m(3)
Mar 2027
7.2
US$537 m
(1) Information related to 100% of the projects. OOG interest is 50%.(2) If contract is not renewed in 2020, equity support from OOG to cover OOG portion of the Balloon (50%), after deducting all the project reserves (DSRA, O&RA, Dividends Retention and any
Cash Balances) (3) Total amount to be issued.
CONFIDENTIAL SETTLEMENT COMMUNICATION SUBJECT TO FRE 408

14
Sources of Capital – Corporate Debt Profile($ in millions, as of 12/31/2016)
550
41
550
42
197 198
31 27 27 27
59 43
-
100
200
300
400
500
600
Accrued Interest12/31/2016
2017 2018 2019 2020 2021 2022 >2023
Perpetual Bond Other Corporate Debt Project Bonds Promissory Notes(1)
(1) Perpetual Bond is redeemable in 2024 at OOG’s discretion. Information as of December 31, 2016. Debt is at OOG level, does not include project level debt.(2) Includes Banco do Brasil, HSBC, Bradesco, BNDES, FINEP, SwissRe and ING.
CONFIDENTIAL SETTLEMENT COMMUNICATION SUBJECT TO FRE 408
(2)
Amortization Profile

Agenda
CONFIDENTIAL SETTLEMENT COMMUNICATION SUBJECT TO FRE 408
1. Company Overview
2. Why Restructuring
3. Summary of Restructuring
4. Restructuring Implementation Proceeding
5. Appendix
a) OOG Corporate Structure
b) Quarterly Budget
c) Overview of Contract Rates
d) Opex Detailing

16
Changes in Market Environment
Contract Termination
ODN Tay IV charter and services contract terminated by Petrobras
Termination was unexpected by OOG
No market to recontract or sell ODN Tay IV
Odebrecht SA and Petrobras involvement in Carwash investigations
Brazilian oil & gas sector is not able to attract new investors
OOG has no access to lines of credit
OOG has no ability to renew and issue letters of credit associated to its projects
Operational uptimes have been lower than originally forecasted
OpEx and CapEx higher than originally forecasted due to high demand for offshore drilling between 2011-mid 2015:
Labor costs increased above inflation
Equipment suppliers consistently increased costs
Macondo accident has raised industry safety standards and consequently, maintenance costs
Changes in REPETRO rules increased importation costs
Increase in ANP inspections due to recent accidents in the industry
Change in taxation on income tax (IRRF) not entirely absorbed by Petrobras until now
BRL / USD exchange rate variation from approximately 2:1 to 4:1 significantly increased equity support necessity from OOG ParentCo
Pursuant to bonds indentures, OOG ParentCo (“Operator”) would be reimbursed by project bond structuresregarding opex, limited to a defined cap
Such reimbursement would be reduced by the amount received by the Operator in BRL. Such amount would be converted to USD based on a fixed 2:1 exchange rate (cap fx)
Credit Liquidity Operational Metrics Foreign Exchange
Since their issuance, operating environment for assets securing Bonds 2021 and 2022 has changed. Additionally, certain targeted operating metrics have not been achieved
CONFIDENTIAL SETTLEMENT COMMUNICATION SUBJECT TO FRE 408

17
Existing Structural Issues
Higher opex and capex than originally forecasted, exceeding caps, and therefore generating funding requirements by ParentCo
Existing cap OpEx and restriction to pay CapEx
One less asset
Petrobras terminated ODN Tay IV contract, which no longer generates cash flow for the 2022 structure
Re-chartering of Norbe VI at an acceptable rate may be difficult
Norbe VI renewal
Currency movements have significantly impacted OOG’s funding requirements
Existing exchange rate cap
Between 2010 and 2015, OOG supported the drilling assets with US$705m (net of dividends received) through CapEx/OpEx overage andinterest on corporate debt issued at OOG ParentCo level(1)
Starting in 2016, 2021/2022 bondholders agreed to waive OOG ParentCo CapEx/OpEx cap obligation in exchange for promissory notes at OOGParentCo, resulting in the issuance of $142.1m in promissory notes until April-2017
Based on current estimates, OOG would have to support the drilling assets with an additional US$1.0bn to US$1.1bn to keep the rigs inoperation throughout project bonds maturity (starting on May-2017)
From US$399 to US$505m in OpEx/CapEx above the existing caps as set forth under the project bonds indentures (notwithstanding thisamount could be substantially higher depending on operational and market conditions)
US$568m to support debt service obligations
At issuance, structures were intended to receive little, if any, support from ParentCo
Since their issuance, operating environment for assets securing Bonds 2021 and 2022 has changed. Additionally, certain targeted operating metrics have not been achieved
(1) For further details refer to page 18.
CONFIDENTIAL SETTLEMENT COMMUNICATION SUBJECT TO FRE 408

18
OOG Historical Support($ in millions)
Since the beginning of 2021 and 2022 assets operations, OOG has made significant funding contributions to support:
OpEx requirements above the opex cap (as set in the indentures)
Capital expenditures
Equity injections to fund the ramp up of the rigs
Shortfalls to cover debt service
From Project Bonds issuance to December 2015, OOG supported the structures with $705 million
In 2016, 2021/2022 bondholders agreed to waive OOG ParentCo capex/opex cap obligation in exchange for promissory
notes at OOG ParentCo
Promissory notes were issued for project bonds 2021/2022. As of 04/30/2017, total amount outstanding was $142.1m(1) ($87.5m for
2021 and $54.6m for 2022)
In addition, a total of $23.2m ($22.1m for 2022 and $1.2m for 2021) of letters of credits guaranteeing debt service payments were
withdrawn
CONFIDENTIAL SETTLEMENT COMMUNICATION SUBJECT TO FRE 408
(1) As of 12/31/2016, total amount outstanding was $102m ($59m for 2021 and $43m for 2022)(2) Calculated as the average interest on OOG ParentCo debt multiplied by Cumulative Total Equity Investment
OOG Funding to Date 2010 2011 2012 2013 2014 2015
2021 Structure
Dividends - 64 32 21 32 21
Equity Injections - (285) (40) (47) (76) (59)
Net Equity Investment (a) - (220) (8) (26) (44) (38)
2022 Structure
Dividends - - 20 320 179 73
Equity Injections (41) (105) (198) (245) (132) (129)
Net Equity Investment (b) (41) (105) (177) 74 48 (56)
Total
Net Equity Investment (a) + (b) (41) (325) (186) 48 4 (94)
Allocated Interest Costs(2) - (4) (12) (27) (31) (36)
Total Equity Investment (41) (330) (198) 21 (27) (131)
Cumulative Total Equity Investment (41) (371) (568) (547) (574) (705)
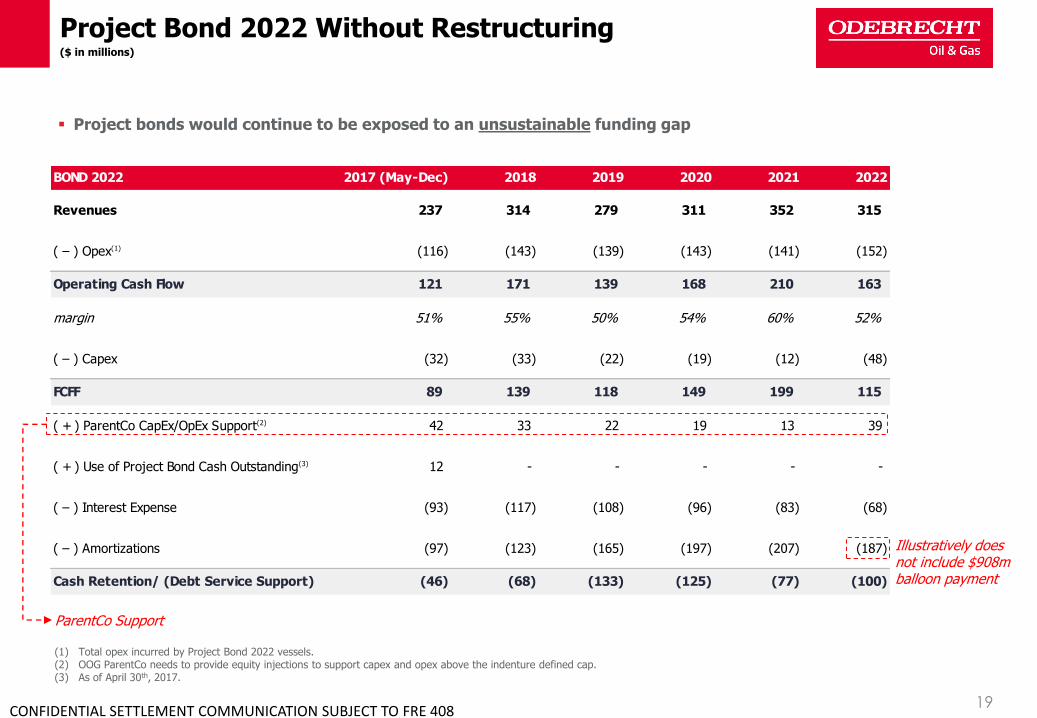
BOND 2022 2017 (May-Dec) 2018 2019 2020 2021 2022
Revenues 237 314 279 311 352 315
( – ) Opex(1) (116) (143) (139) (143) (141) (152)
Operating Cash Flow 121 171 139 168 210 163
margin 51% 55% 50% 54% 60% 52%
( – ) Capex (32) (33) (22) (19) (12) (48)
FCFF 89 139 118 149 199 115
( + ) ParentCo CapEx/OpEx Support(2) 42 33 22 19 13 39
( + ) Use of Project Bond Cash Outstanding(3) 12 - - - - -
( – ) Interest Expense (93) (117) (108) (96) (83) (68)
( – ) Amortizations (97) (123) (165) (197) (207) (187)
Cash Retention/ (Debt Service Support) (46) (68) (133) (125) (77) (100)
19
Project Bond 2022 Without Restructuring($ in millions)
Project bonds would continue to be exposed to an unsustainable funding gap
Illustratively does not include $908m balloon payment
CONFIDENTIAL SETTLEMENT COMMUNICATION SUBJECT TO FRE 408
(1) Total opex incurred by Project Bond 2022 vessels.(2) OOG ParentCo needs to provide equity injections to support capex and opex above the indenture defined cap.(3) As of April 30th, 2017.
ParentCo Support

BOND 2021 2017 (May-Dec) 2018 2019 2020 2021
Revenues 175 278 277 279 227
( – ) Opex(1) (68) (94) (93) (100) (104)
Operating Cash Flow 107 184 185 179 123
margin 61% 66% 67% 64% 54%
( – ) Capex (17) (16) (8) (16) (39)
FCFF 90 168 176 163 84
( + ) ParentCo CapEx/OpEx Support(2) 41 45 38 56 49
( + ) Use of Project Bond Cash Outstanding(3) 37 - - - -
( – ) Interest Expense (66) (59) (50) (41) (31)
( – ) Amortizations (120) (128) (143) (150) (83)
Cash Retention(4)/ (Debt Service Support) (19) 27 22 28 20
20
Project Bond 2021 Without Restructuring($ in millions)
Project bonds would continue to be exposed to an unsustainable funding gap
Illustratively does not include $450m balloon payment
CONFIDENTIAL SETTLEMENT COMMUNICATION SUBJECT TO FRE 408
(1) Total opex incurred by Project Bond 2021 vessels.(2) OOG ParentCo needs to provide equity injections to support capex and opex above the indenture defined cap. (3) As of April 30th, 2017. (4) Cash required to be retained in Project Bond structure in order to support $450m balloon payment in 2021.
ParentCo Support

OOG ParentCo May-17 Jun-17 Jul-17 Aug-17 Sep-17 Oct-17 Nov-17
Sources
Cash Flow from Project Bond 2022 (4) (1) (3) (5) (6) (6) (6)
Cash Flow from Project Bond 2021 (8) (4) (4) (4) (4) (4) (4)
Cash Flow from Other Projects (0) 1 (1) (0) (0) 2 (0)
Total Sources (a) (12) (4) (8) (10) (10) (7) (10)
Uses
Expenses at OOG ParentCo (1) (1) (3) (1) (1) (2) (0)
Total Uses (b) (1) (1) (3) (1) (1) (2) (0)
Change in Cash (a)+(b) (13) (5) (11) (11) (10) (10) (10)
Beginning Cash Balance 54 41 36 25 14 3 (6)
Ending Cash Balance 41 36 25 14 3 (6) (16)
21
OOG ParentCo Without Restructuring($ in millions)
Equity injections on project bonds would generate a cash insufficiency at OOG ParentCo
Cash flow forecast does not include corporate debt service payments (US$111m of accrued interest as of Apr/17 and
US$136m of principal due in the 1H17)
OOG monthly working capital requirement is US$30m
CONFIDENTIAL SETTLEMENT COMMUNICATION SUBJECT TO FRE 408

Agenda
CONFIDENTIAL SETTLEMENT COMMUNICATION SUBJECT TO FRE 408
1. Company Overview
2. Why Restructuring
3. Summary of Restructuring
4. Restructuring Implementation Proceeding
5. Appendix
a) OOG Corporate Structure
b) Quarterly Budget
c) Overview of Contract Rates
d) Opex Detailing

23
Proposal Development
Amending Project Bonds 2021 and 2022 existing securitization structures will significantly improve their long-term viability
Amending the current financing structure would allow all disbursement requirements, including capex and opex above the current cap, to be borne by Drilling Assets cash flows
Viability of the operator is crucial to both the 2021 and 2022 Notes and for preserving agreements with Petrobras
OOG and its advisors developed a proposal to address the Drilling Assets liquidity and capital structure
The proposal developed by OOG and its advisors seeks:
A sustainable debt structure for the Drilling Assets
Deleveraging OOG ParentCo, which is the operator of the rigs
Limitation on incurring debt at ParentCo
Preserving services agreement and charter agreements with Petrobras (not only Project Bonds 2021 and 2022 vessels, but also FPSOs, PLSVs and MSO)
Mitigating risk of acceleration of the 2022 Notes as a result of the termination of Tay IV and potential adverse impact on other agreements with Petrobras
Value to Noteholders in the form of both interest and amortization
Keeps LC support in place
Flexibility to deal with uncertainty in re-chartering Norbe VI in 2018
A viable operating company
In addition to its debt restructuring, the company has been involved in contract renegotiations with Petrobras. The negotiation is currently on hold at Petrobras’s request while it completes its investment plan process
Nonetheless, the operating scenarios herein illustrate potential outcomes OOG management worked with prior to the negotiation being put on hold
CONFIDENTIAL SETTLEMENT COMMUNICATION SUBJECT TO FRE 408
24CONFIDENTIAL SETTLEMENT COMMUNICATION SUBJECT TO FRE 408
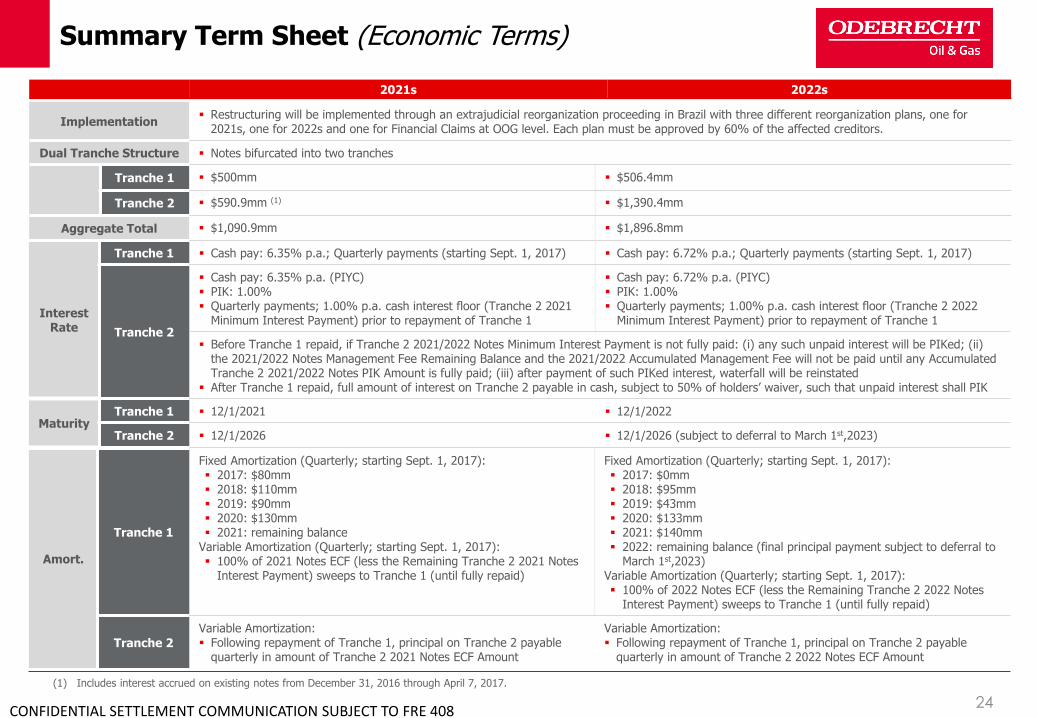
Summary Term Sheet (Economic Terms)
2021s 2022s
Implementation Restructuring will be implemented through an extrajudicial reorganization proceeding in Brazil with three different reorganization plans, one for
2021s, one for 2022s and one for Financial Claims at OOG level. Each plan must be approved by 60% of the affected creditors.
Dual Tranche Structure Notes bifurcated into two tranches
Tranche 1 $500mm $506.4mm
Tranche 2 $590.9mm (1) $1,390.4mm
Aggregate Total $1,090.9mm $1,896.8mm
Interest Rate
Tranche 1 Cash pay: 6.35% p.a.; Quarterly payments (starting Sept. 1, 2017) Cash pay: 6.72% p.a.; Quarterly payments (starting Sept. 1, 2017)
Tranche 2
Cash pay: 6.35% p.a. (PIYC) PIK: 1.00% Quarterly payments; 1.00% p.a. cash interest floor (Tranche 2 2021
Minimum Interest Payment) prior to repayment of Tranche 1
Cash pay: 6.72% p.a. (PIYC) PIK: 1.00% Quarterly payments; 1.00% p.a. cash interest floor (Tranche 2 2022
Minimum Interest Payment) prior to repayment of Tranche 1
Before Tranche 1 repaid, if Tranche 2 2021/2022 Notes Minimum Interest Payment is not fully paid: (i) any such unpaid interest will be PIKed; (ii) the 2021/2022 Notes Management Fee Remaining Balance and the 2021/2022 Accumulated Management Fee will not be paid until any Accumulated Tranche 2 2021/2022 Notes PIK Amount is fully paid; (iii) after payment of such PIKed interest, waterfall will be reinstated
After Tranche 1 repaid, full amount of interest on Tranche 2 payable in cash, subject to 50% of holders’ waiver, such that unpaid interest shall PIK
MaturityTranche 1 12/1/2021 12/1/2022
Tranche 2 12/1/2026 12/1/2026 (subject to deferral to March 1st,2023)
Amort.
Tranche 1
Fixed Amortization (Quarterly; starting Sept. 1, 2017): 2017: $80mm 2018: $110mm 2019: $90mm 2020: $130mm 2021: remaining balance
Variable Amortization (Quarterly; starting Sept. 1, 2017): 100% of 2021 Notes ECF (less the Remaining Tranche 2 2021 Notes
Interest Payment) sweeps to Tranche 1 (until fully repaid)
Fixed Amortization (Quarterly; starting Sept. 1, 2017): 2017: $0mm 2018: $95mm 2019: $43mm 2020: $133mm 2021: $140mm 2022: remaining balance (final principal payment subject to deferral to
March 1st,2023)Variable Amortization (Quarterly; starting Sept. 1, 2017): 100% of 2022 Notes ECF (less the Remaining Tranche 2 2022 Notes
Interest Payment) sweeps to Tranche 1 (until fully repaid)
Tranche 2
Variable Amortization: Following repayment of Tranche 1, principal on Tranche 2 payable
quarterly in amount of Tranche 2 2021 Notes ECF Amount
Variable Amortization: Following repayment of Tranche 1, principal on Tranche 2 payable
quarterly in amount of Tranche 2 2022 Notes ECF Amount
(1) Includes interest accrued on existing notes from December 31, 2016 through April 7, 2017.

25CONFIDENTIAL SETTLEMENT COMMUNICATION SUBJECT TO FRE 408
Summary Term Sheet (Economic Terms) (cont’d)
2021s 2022s
Amort. (cont.)
Waterfall (1)
Prior to the Tranche 1 2021/2022 Notes Maturity Date, the waterfall occurs as follows (on a quarterly basis, except for (v)):
Mandatory Obligations:
(i) 2021/2022 Notes OPEX/CAPEX Monthly Expense
(ii) 2021/2022 Notes Offshore Minimum Cash Reserve Account Required Balance
(iii) cash interest on Tranche 1
(iv) fixed amortization on Tranche 1(2)
(v) 2021/2022 Notes Management Incentive Payment (annually, beginning in March 2018) (after withdrawing all amounts from 2021/2022
Notes MIP Quarterly Accrual)
(vi) 35% of 2021/2022 Notes Management Fee
(vii) Minimum Tranche 2 2021/2022 Notes Interest Payment
(viii) 2021/2022 Notes Management Fee Remaining Balance(3) and 2021/2022 Notes Accumulated Management Fee, after satisfying any
Accumulated Tranche 2 2021/2022 Notes PIK Amount(4)
(ix) 2021/2022 Notes MIP Quarterly Accrual
Excess Funds Sweep:
(i) Remaining Tranche 2 2021/2022 Notes Interest Payment (PIYC, no reserve account),
(ii) 100% of remaining 2021/2022 Notes ECF to pay principal before all Drilling Units are recontracted,
(iii) 90% of remaining 2021/2022 Notes ECF to pay principal / 10% to Operator after all Drilling Units are recontracted
After the Tranche 1 2021/2022 Notes Maturity Date, the waterfall occurs as follows:
Mandatory Obligations:
(i) 2021/2022 Notes OPEX/CAPEX Monthly Expense
(ii) 2021/2022 Notes Offshore Minimum Cash Reserve Account Required Balance
(iii) 35% of 2021/2022 Notes Management Fee
(iv) full cash interest on Tranche 2 and any Accumulated Tranche 2 2021/2022 Notes PIK Amount (failure to pay constitutes an event of default,
subject to 50% holders’ waiver, in which case unpaid interest to PIK)
(v) 2021/2022 Notes Management Fee Remaining Balance and 2021/2022 Notes Accumulated Management Fee
Excess Funds Sweep:
(i) Tranche 2 2021/2022 Notes ECF Amount sweep to repay principal (equal to 90% of remaining 2021/2022 Notes ECF if all Drilling Units under
Charter Agreement Recontracting Period, otherwise equal to 100% of remaining 2021/2022 Notes ECF)
(ii) 2021/2022 Notes Operator ECF Sweep Amount (equal to 10% of remaining 2021/2022 Notes ECF, only if all Drilling Units under Charter
Agreement Recontracting Period)
(1) Proceeds from asset sales will be used to pay down Tranche 1 first then Tranche 2.(2) Amortization payment for 2022 Notes due on December 1st, 2022 moved to seventh priority in the waterfall and will not be an event of default if not paid in full in December 1st, 2022. Any amount not paid
deferred to March 1st, 2023 and due in full at that date.(3) 2021/2022 Notes Management Fee Remaining Balance means 65% of the 2021/2022 Notes Management Fee minus amount of CAPEX/OPEX spent in excess of certain ranges set forth in the annual budget
for such quarter and minus an amount equivalent to revenues lost for operating at downtime in excess of 15% (such amount not to exceed 65% of the Management Fee applicable to such vessel).(4) In case of insufficiency to make full payment of 2021/2022 Note Management Fee Remaining Balance, amounts to accrue and be payable on following payment date.

26CONFIDENTIAL SETTLEMENT COMMUNICATION SUBJECT TO FRE 408
Summary Term Sheet (Economic Terms) (cont’d)
2021s 2022s
Payments to OOG
Management Fee: $3,250,000 per Drilling Unit per year; if any Drilling Unit is Stacked, the 2021/2022 Notes Management Fee applicable to such Drilling Unit
is reduced to $2,437,500; payable quarterly and in accordance with waterfall
After the Tranche 1 2021/2022 Notes Maturity Date, Operator to receive 10% of any remaining 2021/2022 Notes ECF, subject to all 2021/2022 Drilling Units
being under Charter Agreement Recontracting Period.
Management Incentive Program:
25% of aggregate operational cost-savings achieved vs. Annual Budget to be distributed to relevant operator
Tested and distributed annually
2021/2022 Notes Management Incentive Payment to cease upon Tranche 1 2021/2022 Notes Maturity Date
No fee payable to OOG if Payment Default is ongoing, and no fee payable with respect to a Drilling Unit if related charter or services agreements terminated
due to OOG breach
Annual Budget
Annual Budget for 2017, 2018 and 2019 to be approved by holders as part of restructuring
Annual Budget for 2020 and 2021 subject to approval by Creditor Representative
Extraordinary Increases in Annual Budget for 2017, 2018 and 2019 to be approved by the Creditor Representative and notified to trustee and holders; if
holders representing 50% of aggregate principal amount of Tranche 1 do not object in writing within 30 days from date of notice, changes are deemed
approved
Project-Level Governance
Creditor Representative: individual jointly appointed by holders of New 2021 and 2022 Notes; will remain engaged so long as any New 2021 or 2022 Notes
are outstanding; selected consensually for first mandate as part of restructuring
Affirmative consent of Creditor Representative required for approval of Annual Budget for each Drilling Unit and certain related party transactions
Creditor Representative entitled to observe any meetings of OOG Par board of directors and OOG board of executive officers in which the New Notes,
Drilling Units, Collateral and Annual budget are discussed, and to have access to documents and information necessary to perform its duties
Creditor Representative may be replaced at any time by holders of 50% of either Tranche 1 2021 Notes or Tranche 1 2022 Notes. Procedures for selection
of replacement upon resignation or removal of Creditor Representative detailed in legal term sheet
Step-in Rights: Majority holders of 2021/2022 Notes can instruct collateral agent to replace relevant operator upon 2021/2022 Notes Material Performance
Event or an event of default under related indenture (any obligations of OOG as operator to cease upon replacement)
Collective Action: until repayment of Tranche 1, only Tranche 1 to vote on certain matters including acceleration, waiver of defaults, collateral enforcement,
approval of Annual Budget and Petrobras negotiations, among others
Other governance practices, including engagement of Independent Consultant, detailed in legal term sheet
ODN Tay IV
To be scrapped by later of 120 days from ER Filing Date and 45 days from the ER Approval Date (subject to extension); no costs associated with Tay IV to be
payable from waterfall structure from earlier of (A) completion of ODN Tay IV Disposition or (B) the later of 120 days from ER Filing Date and 45 days from
the ER Approval Date.

27CONFIDENTIAL SETTLEMENT COMMUNICATION SUBJECT TO FRE 408
Summary Term Sheet (Economic Terms) (cont’d)
2021s 2022s
Minimum Cash Balance/ Reserve
$25mm cash reserve established, to be funded by waterfall (2021 Notes
Offshore Minimum Cash Reserve Account Required Balance)
$40mm cash reserve established, to be funded by waterfall (2022 Notes
Offshore Minimum Cash Reserve Account Required Balance)
Collateral Structure
All existing collateral remains in place. First priority lien on substantially all of the assets of the respective project entities enforceable in Brazil and offshore,
including but not limited to the drilling rigs, cash collateral, interests in the charter and services agreements and accounts receivable, and lien on equity in
structures. Implementation of measures to enhance collateral package and protect the security interests on the collateral, as described in legal term sheet
LCs
All new LCs will cover Debt Service (i.e. no more O&M LCs)
Existing LCs issued by LC Creditors that do not adhere to restructuring plan will be drawn in full and shall receive Participating Titles to extent necessary to
restructure their LC Reimbursement Claims
LC Creditors that adhere to restructuring plan to issue new LCs as provided below and their existing undrawn LCs will be released
Tranche 1: New LCs to be issued to cover Tranche 1 in amount equal to 1/4 of the then outstanding undrawn amounts of the LCs and not to exceed such
undrawn amounts. Will be released at maturity unless a shortfall exists; OOG guarantee
LC providers may seek reimbursement against OOG only in amounts up to 35% of the Management Fee paid to OOG with respect to any draws on
Tranche 1 LCs while Tranche 1 debt is outstanding
Tranche 2: New LCs to be issued to cover Tranche 2 in amount equal to 3/4 of the then outstanding undrawn amounts of the LCs and not to exceed such
undrawn amounts. Will be released at maturity unless a shortfall exists; Participating Titles to be issued to LC Creditors as OOG guarantee
Termination of
ESA /
Undertaking
Agreement
Pursuant to ESA / Undertaking Agreement, OOG is currently required to pay for CAPEX and OPEX in excess of caps provided for under the 2021 / 2022
Agreements
ESA and Undertaking Agreement will be terminated in connection with the Restructuring and each structure will support its own CAPEX/OPEX needs
2021/2022 holders will receive a claim against OOG for future OPEX/CAPEX claims. These Financial Claims will be restructured as part of OOG restructuring
Financial Claims
of 2021/2022
holders at OOG
level
OOG has issued promissory notes in connection with past cap relief
In exchange for their Financial Claims against OOG, holders to receive OOG ParentCo Participating Titles
As per current forecasts, issued promissory notes and claims resulting from termination of ESA and Undertaking Agreement, would entitle Project Bonds
holders to an economic interest of ~10% of OOG ParentCo via Participating Titles (~6% to 2021 holders and ~4% to 2022 holders)
Amendments to
Charter/Services
Agreements
The company has been engaged in contract renegotiations of its existing charter and services agreements.
The company is permitted to enter into amendments of existing charter and services agreements to the extent that these amendments result in cash flows
that are substantially consistent with the cash flows set forth in the annual budget (refer to appendix).

28CONFIDENTIAL SETTLEMENT COMMUNICATION SUBJECT TO FRE 408
Summary Term Sheet (Economic Terms) (cont’d)
Financial Claims at OOG Level
Restructuring of
Financial Claims
at OOG Level
Financial Claims to be restructured at OOG level are comprised of (a) the Banks Claim; (b) the LC Reimbursement Claims; (c) the Perpetual Notes Claim; (d)
the NPs; (e) the ESA Termination Claim; and (f) the Undertaking Termination Claim.
All holders of Financial Claims will have equal treatment and are to receive Participating Titles in exchange for their Financial Claims
Participating
Titles
Participating Titles to be issued as perpetual securities paying interest calculated as a variable percentage of any OOG Shareholder Distributions
Redemption/Repurchase: Participating Titles can be redeemed or repurchased by the issuer or guarantor at their option. Participating Titles also to be
repurchased at option of holder in the event of a merger or change of control or IPO of OOG; in such cases, repurchase price for Participating Titles will
reflect consideration received in exchange for any OOG capital stock transferred pursuant to such transaction
Anti-dilution: Upon any issuance of OOG equity, subject to certain exceptions, holders can subscribe such additional Participating Titles to maintain their share
of Participating Titles Distributions
Conversion: Participating Titles are convertible into OOG preferred shares in case of an Event of Default (nonpayment of Participating Titles Distributions or
non-payment of redemption price or repurchase price, nonperformance of covenants and certain events of bankruptcy or insolvency of OOG)

BRLPayments under
Services Agreements
29CONFIDENTIAL SETTLEMENT COMMUNICATION SUBJECT TO FRE 408
New Cash Waterfall – 2021 and 2022 Notes: Tranche 1
$25 million cash reserve for 2021s
$40 million cash reserve for 2022s
1st
2nd
3rd
4th
USDPayments under
Charter Agreements
5th
Pledged
Not Pledged
Guarantor service account (All O&M / CAPEX needs after Onshore Proceeds Account)
Minimum Cash Reserve Account
Debt service account (Tranche 1 Cash Interest)
Guarantor service account (Management Incentive Program) (annually)
Debt service account (Tranche 1 Fixed Amortization)
Guarantor service account (35% Management Fee)
Debt service account (Tranche 2 Minimum Cash Interest)
Project OPEX/CAPEX
Guarantor service account (Management Fee Remaining Balance)
Management Incentive Program Accrual
Excess Cash Flow Pay-if-you-can interest on Tranche 2
ECF sweep to Tranche 1
6th
7th
8th
Reserve to pay incentive fee if company has
accumulated savings
65% minus OPEX/CAPEX paid in excess of budgeted ranges minus an amount
equivalent to revenues lost for operating at downtime in excess of 15%, limited to
the remaining balance of the Management Fee of the rig that suffered downtime
9th
10th
Onshore Proceeds Account
Failure to pay is event of default
Failure to pay is not event of default; company may PIK (but then cannot pay
Management Fee Remaining Balance until all PIKed interest is repaid)
Offshore Proceeds Account
Failure to pay is event of default
Pledged (in Management Incentive Program Accrual
Account) until released annually

10% ECF Sweep to ParentCo (after rigs re-contracted)
30CONFIDENTIAL SETTLEMENT COMMUNICATION SUBJECT TO FRE 408
New Cash Waterfall – 2021 and 2022 Notes: Tranche 2 (after repayment of Tranche 1)
1st
2nd
3rd
4th
5th
Pledged
Not Pledged
Guarantor service account (All O&M / CAPEX needs after Onshore Proceeds Account)
Minimum Cash Reserve Account
Guarantor Service Account(35% Management Fee)
Guarantor service account (Management Fee Remaining Balance)
Debt service account (Tranche 2 Cash Interest)
Project OPEX/CAPEX
Excess Cash Flow 100% ECF sweep to Tranche 2 (before rigs re-contracted) 90% ECF sweep to Tranche 2 (after rigs re-contracted)
6th
Onshore Proceeds Account
Failure to pay constitutes event of default, subject to waiver by 50% of holders
Offshore Proceeds Account
BRLPayments under
Services Agreements
USDPayments under
Charter Agreements
65% minus OPEX/CAPEX paid in excess of budgeted ranges minus an amount
equivalent to revenues lost for operating at downtime in excess of 15%, limited to
the remaining balance of the Management Fee of the rig that suffered downtime

31
Bond 2021 Post Restructuring Cash Flow - Case A($ in millions)
No changes to PBR current contracts
CONFIDENTIAL SETTLEMENT COMMUNICATION SUBJECT TO FRE 408
Note 1: This cash flow statement is for illustrative purposes and represents estimates subject to significant change depending on variations on assumptions used, future measures taken by Petrobras and changes in
macroeconomic factors.
Note 2: Norbe VIII Operational Assumptions (averages between 2017 and 2021): Opex: USD 144 k/day, Capex: USD 27 k/day and Economic Uptime: 95%; Starting on 3Q2021, projections based on new contracts and OOG’s
future recontracting assumptions. Operational Assumptions (averages between 2017 and 2026): Opex: USD 150 k/day, Capex: USD 25 k/day and Economic Uptime: 96%
Note 3: Norbe IX Operational Assumptions (averages between 2017 and 2021): Opex: USD 145 k/day, Capex: USD 30 k/day and Economic Uptime: 97%; Starting on 3Q2021, projections based on new contracts and OOG’s
future recontracting assumptions. Operational Assumptions (averages between 2017 and 2026): Opex: USD 151 k/day, Capex: USD 25 k/day and Economic Uptime: 97%
BOND 2021 2018 2019 2020 2021 2022 2023 2024 2025 2026
Revenues 175 278 277 279 227 240 251 252 252 243
( – ) Opex (72) (94) (93) (100) (104) (101) (106) (111) (116) (121)
Operating Cash Flow 103 184 185 179 123 139 145 141 136 122
( – ) Capex (17) (16) (8) (16) (39) (10) (10) (10) (10) (35)
Cash Flow From Assets 86 168 176 163 84 130 136 131 127 87
( +/– ) Minimum Cash Reserve ($25m) 9 (9) - - - - - - - -
( – ) Tranche 1 Cash Interest (20) (24) (17) (10) (2) - - - - -
( – ) Tranche 1 Fixed Amortization (80) (110) (90) (130) (71) - - - - -
( – ) Mandatory Cash Interest on Tranche 2 (4) (6) (7) (7) (7) (46) (41) (36) (32) (27)
( – ) Management Fees to ParentCo (3) (6) (6) (6) (6) (6) (6) (6) (6) (6)
Cash Flow After Mandatory Payments (12) 13 57 10 (2) 78 89 89 89 53
( – ) Additional Cash interest on Tranche 2 - - (35) (15) - - - - - -
( – ) ECF Sweep to Tranche 1 - - (19) - - - - - - -
Cash Flow Before Tranche 2 Amortizations (12) 13 3 (5) (2) 78 89 89 89 53
( – ) ECF Sweep to Tranche 2 (90% ) - - - - - (66) (80) (80) (80) (48)
( – ) ECF Sweep to ParentCo (10% ) - - - - - (7) (9) (9) (9) (5)
Change in Excess Cash (12) 13 3 (5) (2) 4 (0) (0) (0) (0)
Memo: Minimum Cash Account Balance 16 25 25 25 25 25 25 25 25 25
Memo: Excess Cash Account Balance - 13 16 11 8 13 12 12 12 11
Debt Balance 2017 2018 2019 2020 2021 2022 2023 2024 2025 2026
( + ) Tranche 1 EoP 500 420 310 201 71 - - - - - -
( + ) Tranche 2 EoP 591 615 655 662 690 734 675 602 527 452 408
Total Debt 1,091 1,035 965 864 761 734 675 602 527 452 408
2017 (May- Dec)
April 7, 2017

32
Bond 2022 Post Restructuring Cash Flow - Case A($ in millions)
CONFIDENTIAL SETTLEMENT COMMUNICATION SUBJECT TO FRE 408
Note 1: This cash flow statement is for illustrative purposes and represents estimates subject to significant change depending on variations on assumptions used, future measures taken by Petrobras and changes in macroeconomic factors. Note 2: ODN I Operational Assumptions (averages between 2017 and 2022): Opex: USD 140 k/day, Capex: USD 32 k/day and Economic Uptime: 97%; Starting on 3Q2022, projections based on new contracts and OOG’s future
recontracting assumptions. Operational Assumptions (averages between 2017 and 2026): Opex: USD 148 k/day, Capex: USD 24 k/day and Economic Uptime: 97%Note 3: ODN II Operational Assumptions (averages between 2017 and 2022): Opex: USD 148 k/day, Capex: USD 34 k/day and Economic Uptime: 97%; Starting on 3Q2022, projections based on new contracts and OOG’s future
recontracting assumptions. Operational Assumptions (averages between 2017 and 2026): Opex: USD 152 k/day, Capex: USD 25 k/day and Economic Uptime: 97%Note 4: Norbe VI Operational Assumptions (averages between 2017 and 2022): Opex: USD 132 k/day, Capex: USD 16 k/day and Economic Uptime: 83%; Starting on 3Q2018, projections based on new contracts and OOG’s future
recontracting assumptions. Operational Assumptions (averages between 2017 and 2026): Opex: USD 142 k/day, Capex: USD 20 k/day and Economic Uptime: 90%Note 5: Tay IV: Scrapped in 2017 with associated costs of $17m (net of scrapping proceeds).
No changes to PBR current contracts
BOND 2022 2018 2019 2020 2021 2022 2023 2024 2025 2026
Revenues 237 314 279 311 352 315 352 364 369 371
( – ) Opex (123) (143) (139) (143) (141) (152) (158) (166) (173) (181)
Operating Cash Flow 114 171 139 168 210 163 194 198 196 190
( – ) Capex (32) (33) (22) (19) (12) (48) (15) (28) (15) (15)
Cash Flow From Assets 82 139 118 149 199 115 179 171 181 175
( – ) March LC Withdrawal Reimbursement (10) - - - - - - - - -
( +/– ) Minimum Cash Reserve ($40m) (28) 9 (9) 19 (19) 12 (12) - - -
( – ) Tranche 1 Cash Interest (22) (32) (26) (22) (12) (4) - - - -
( – ) Tranche 1 Fixed Amortization - (95) (43) (133) (140) (95) - - - -
( – ) Mandatory Cash Interest on Tranche 2 (9) (15) (16) (17) (18) (19) (108) (136) (136) (136)
( – ) Management Fees to ParentCo (6) (9) (8) (10) (9) (9) (9) (10) (9) (10)
Cash Flow After Mandatory Payments 8 (4) 16 (14) 1 (1) 50 24 36 29
( – ) Additional Cash interest on Tranche 2 (2) (2) (2) - - - (3) - - -
( – ) ECF Sweep to Tranche 1 - - - - - - - - - -
Cash Flow Before Tranche 2 Amortizations 6 (6) 14 (14) 1 (1) 46 24 36 29
( – ) ECF Sweep to Tranche 2 (90% ) - - - - - - (27) (29) (26) (34)
( – ) ECF Sweep to ParentCo (10% ) - - - - - - (3) (3) (3) (4)
Change in Excess Cash 6 (6) 14 (14) 1 (1) 17 (8) 7 (8)
Memo: Minimum Cash Account Balance 40 31 40 21 40 28 40 40 40 40
Memo: Excess Cash Account Balance 6 - 14 - 1 - 17 9 16 8
Debt Balance 2017 2018 2019 2020 2021 2022 2023 2024 2025 2026
( + ) Tranche 1 EoP 506 506 411 368 235 95 - - - - -
( + ) Tranche 2 EoP 1,390 1,450 1,547 1,652 1,765 1,887 2,017 2,036 2,028 2,022 2,008
Total Debt 1,897 1,956 1,959 2,020 2,001 1,982 2,017 2,036 2,028 2,022 2,008
2017 (May- Dec)
April 7, 2017

33
OOG ParentCo Post Restructuring Cash Flow - Case A($ in millions)
No changes to PBR current contracts
CONFIDENTIAL SETTLEMENT COMMUNICATION SUBJECT TO FRE 408
Note 1: This cash flow statement is for illustrative purposes and represents estimates subject to significant change depending on variations on assumptions used, future measures taken by Petrobras and changes in macroeconomic factors.
(1) Net of LC Issuers reimbursements relative to pre-restructuring withdrawals.
OOG ParentCo 2017 (May-Dec) 2018 2019 2020 2021 2022 2023 2024 2025 2026
Sources
Cash Flow 2022 Structure (1) 4 7 5 7 6 7 12 13 12 14
Cash Flow 2021 Structure (1) 3 6 6 6 6 13 15 15 15 11
Project A - - - - - - - - - -
Project B (2) 32 28 25 33 38 42 45 58 60
Project C 2 8 12 12 13 13 14 14 14 15
Project D - - - - - - - - - -
ODB Capital Increase 30 - - - - - - - - -
Total Sources (a) 37 53 51 51 59 71 83 87 99 99
Uses
Unallocated G&A (13) (12) (14) (14) (14) (14) (14) (14) (14) (14)
Restructuring Costs (3) - - - - - - - - -
LC Costs (Other Projects) (2) (3) (3) (3) (3) (3) (3) (3) (2) (2)
LC Costs (Project Bonds) (1) (2) (2) (2) (2) (2) (2) (2) (2) (2)
FINEP & BNDES Debt Service (1) (1) (1) (1) (0) (0) - - - -
Total Uses (b) (20) (18) (20) (19) (19) (19) (19) (19) (18) (18)
OOG ParentCo Cash Flow (a)+(b) 17 35 31 31 40 53 64 68 80 81

34
Assumes stacking of one rig for the maximum considered period of time, with revenue reduction in exchange of optional maximum backlog extension
Bond 2021 Post Restructuring Cash Flow - Case B($ in millions)
CONFIDENTIAL SETTLEMENT COMMUNICATION SUBJECT TO FRE 408
Note 1: This cash flow statement is for illustrative purposes and represents estimates subject to significant change depending on variations on assumptions used, future measures taken by Petrobras and changes in
macroeconomic factors.
Note 2: Norbe VIII Operational Assumptions (averages between 2017 and 2021): Opex: USD 124 k/day, Capex: USD 15 k/day and Economic Uptime: 95%; Starting on 3Q2022, projections based on new contracts and OOG’s
future recontracting assumptions. Operational Assumptions (averages between 2017 and 2026):, Opex: USD 138 k/day, Capex: USD 18 k/day and Economic Uptime: 96%;
Note 3: Norbe IX Operational Assumptions (averages between 2017 and 2021): Opex: USD 145 k/day, Capex: USD 26 k/day and Economic Uptime: 97%; Starting on 3Q2021, projections based on new contracts and OOG’s
future recontracting assumptions. Operational Assumptions (averages between 2017 and 2026): Opex: USD 151 k/day, Capex: USD 24 k/day and Economic Uptime: 97%
BOND 2021 2018 2019 2020 2021 2022 2023 2024 2025 2026
Revenues 173 232 236 274 254 222 258 247 259 255
( – ) Opex (70) (75) (83) (100) (104) (101) (106) (111) (116) (121)
Operating Cash Flow 103 157 153 174 150 121 153 137 143 134
( – ) Capex (9) (8) (15) (12) (27) (10) (10) (22) (10) (22)
Cash Flow From Assets 94 149 138 162 123 112 143 114 134 112
( +/– ) Minimum Cash Reserve ($25m) 0 (0) - - - - - 0 - -
( – ) Tranche 1 Cash Interest (20) (24) (18) (11) (4) - - - - -
( – ) Tranche 1 Fixed Amortization (80) (110) (90) (130) (89) - - - - -
( – ) Mandatory Cash Interest on Tranche 2 (4) (6) (7) (7) (7) (47) (43) (38) (35) (30)
( – ) Management Fees to ParentCo (3) (6) (5) (6) (6) (6) (6) (6) (6) (6)
Cash Flow After Mandatory Payments (12) 3 19 8 18 59 94 70 93 76
( – ) Additional Cash interest on Tranche 2 - - (7) (7) (21) - - - - -
( – ) ECF Sweep to Tranche 1 - - - - (1) - - - - -
Cash Flow Before Tranche 2 Amortizations (12) 3 12 0 (5) 59 94 70 93 76
( – ) ECF Sweep to Tranche 2 (90% ) - - - - - (50) (85) (66) (81) (69)
( – ) ECF Sweep to ParentCo (10% ) - - - - - (6) (9) (7) (9) (8)
Change in Excess Cash (12) 3 12 0 (5) 3 (0) (3) 3 (0)
Memo: Minimum Cash Account Balance 25 25 25 25 25 25 25 25 25 25
Memo: Excess Cash Account Balance - 3 15 15 10 13 13 10 12 12
Debt Balance 2017 2018 2019 2020 2021 2022 2023 2024 2025 2026
( + ) Tranche 1 EoP 500 420 310 220 90 - - - - - -
( + ) Tranche 2 EoP 591 615 655 691 729 754 711 633 573 497 433
Total Debt 1,091 1,035 965 911 819 754 711 633 573 497 433
2017 (May- Dec)
April 7, 2017

35
Bond 2022 Post Restructuring Cash Flow - Case B ($ in millions)
CONFIDENTIAL SETTLEMENT COMMUNICATION SUBJECT TO FRE 408
(1)
Note 1: This cash flow statement is for illustrative purposes and represents estimates subject to significant change depending on variations on assumptions used, future measures taken by Petrobras and changes in macroeconomic factors. Note 2: ODN I Operational Assumptions (averages between 2017 and 2022): Opex: USD 140 k/day, Capex: USD 31 k/day and Economic Uptime: 97%; Starting on 3Q2022, projections based on new contracts and OOG’s future
recontracting assumptions. Operational Assumptions (averages between 2017 and 2026): Opex: USD 148 k/day, Capex: USD 23 k/day and Economic Uptime: 97%Note 3: ODN II Operational Assumptions (averages between 2017 and 2022): Opex: USD 148 k/day, Capex: USD 32 k/day and Economic Uptime: 97%; Starting on 3Q2022, projections based on new contracts and OOG’s future
recontracting assumptions. Operational Assumptions (averages between 2017 and 2026): Opex: USD 152 k/day, Capex: USD 24 k/day and Economic Uptime: 97%Note 4: Norbe VI Operational Assumptions (averages between 2017 and 2022): Opex: USD 121 k/day, Capex: USD 14 k/day and Economic Uptime: 82%; Starting on 4Q2020, projections based on new contracts and OOG’s future
recontracting assumptions. Operational Assumptions (averages between 2017 and 2026): Opex: USD 136 k/day, Capex: USD 18 k/day and Economic Uptime: 89%Note 5: Tay IV: Scrapped in 2017 with associated costs of $17m (net of scrapping proceeds).
Assumes stacking of one rig for the maximum considered period of time, with revenue reduction in exchange of optional maximum backlog extension
BOND 2022 2018 2019 2020 2021 2022 2023 2024 2025 2026
Revenues 230 282 290 331 331 294 330 343 346 348
( – ) Opex (120) (125) (138) (143) (141) (152) (158) (166) (173) (181)
Operating Cash Flow 111 157 151 187 189 142 172 177 173 167
( – ) Capex (22) (29) (24) (19) (12) (48) (15) (28) (15) (15)
Cash Flow From Assets 89 128 127 168 177 94 157 149 158 152
( – ) March LC Withdrawal Reimbursement (10) - - - - - - - - -
( +/– ) Minimum Cash Reserve ($40m) (28) 13 (13) 2 2 34 (38) - - -
( – ) Tranche 1 Cash Interest (22) (32) (26) (22) (12) (4) - - - -
( – ) Tranche 1 Fixed Amortization - (95) (43) (133) (140) (95) - - - -
( – ) Mandatory Cash Interest on Tranche 2 (9) (15) (16) (17) (18) (19) (108) (139) (140) (141)
( – ) Management Fees to ParentCo (6) (9) (8) (10) (9) (9) (9) (10) (9) (10)
Cash Flow After Mandatory Payments 15 (9) 22 (11) - - 2 1 9 1
( – ) Additional Cash interest on Tranche 2 (5) - (6) (5) - - - - - -
( – ) ECF Sweep to Tranche 1 - - - - - - - - - -
Cash Flow Before Tranche 2 Amortizations 9 (9) 16 (16) - - 2 1 9 1
( – ) ECF Sweep to Tranche 2 (90% ) - - - - - - - - (0) (5)
( – ) ECF Sweep to ParentCo (10% ) - - - - - - - - (0) (1)
Change in Excess Cash 9 (9) 16 (16) - - 2 1 9 (5)
Memo: Minimum Cash Account Balance 40 27 40 38 36 2 40 40 40 40
Memo: Excess Cash Account Balance 9 - 16 - - - 2 3 11 6
Debt Balance 2017 2018 2019 2020 2021 2022 2023 2024 2025 2026
( + ) Tranche 1 EoP 506 506 411 368 235 95 - - - - -
( + ) Tranche 2 EoP 1,390 1,446 1,546 1,647 1,755 1,876 2,005 2,054 2,075 2,095 2,111
Total Debt 1,897 1,953 1,957 2,015 1,990 1,971 2,005 2,054 2,075 2,095 2,111
2017 (May- Dec)
April 7, 2017

36
OOG ParentCo Post Restructuring Cash Flow - Case B ($ in millions)
CONFIDENTIAL SETTLEMENT COMMUNICATION SUBJECT TO FRE 408
Note 1: This cash flow statement is for illustrative purposes and represents estimates subject to significant change depending on variations on assumptions used, future measures taken by Petrobras and changes in macroeconomic factors.
(1) Net of LC Issuers reimbursements relative to pre-restructuring withdrawals.
Assumes stacking of two rigs for the maximum considered period of time, with revenue reduction in exchange of optional maximum backlog extension
OOG ParentCo 2017 (May-Dec) 2018 2019 2020 2021 2022 2023 2024 2025 2026
Sources
Cash Flow 2022 Structure (1) 4 7 5 7 6 7 9 10 9 10
Cash Flow 2021 Structure (1) 2 5 5 6 6 12 15 13 15 14
Project A - - - - - - - - - -
Project B (2) 32 28 25 33 38 42 45 58 60
Project C 2 8 12 12 13 13 14 14 14 15
Project D - - - - - - - - - -
ODB Capital Increase 30 - - - - - - - - -
Total Sources (a) 36 52 50 51 59 70 80 82 96 98
Uses
Unallocated G&A (13) (12) (14) (14) (14) (14) (14) (14) (14) (14)
Restructuring Costs (3) - - - - - - - - -
LC Costs (Other Projects) (2) (3) (3) (3) (3) (3) (3) (3) (2) (2)
LC Costs (Project Bonds) (1) (2) (2) (2) (2) (2) (2) (2) (2) (2)
FINEP & BNDES Debt Service (1) (1) (1) (1) (0) (0) - - - -
Total Uses (b) (20) (18) (20) (19) (19) (19) (19) (19) (18) (18)
OOG ParentCo Cash Flow (a)+(b) 16 34 31 31 40 51 62 64 77 80

Agenda
CONFIDENTIAL SETTLEMENT COMMUNICATION SUBJECT TO FRE 408
1. Company Overview
2. Why Restructuring
3. Summary of Restructuring
4. Restructuring Implementation Proceeding
5. Appendix
a) OOG Corporate Structure
b) Quarterly Budget
c) Overview of Contract Rates
d) Opex Detailing

38
Restructuring Implementation Proceeding
Implementation through an extrajudicial restructuring proceeding in Brazil
Extrajudicial restructuring (”ER”) is a proceeding under Brazilian Bankruptcy Law through which a debtor(or a group of debtors) can implement a restructuring agreement entered into with creditors comprisingat least 60% of the total amount of restructured debt (the ”ER Plan”) that binds all creditors subject tothe Restructuring upon judicial confirmation of the ER Plan. The judicial confirmation binds non-signatorycreditors, including opposing creditors, if applicable.
Overview of the proceeding:
The ER is filed before the Rio de Janeiro Commercial Courts (”ER Court”). The ER Court approves therequest for ER and requires that all creditors subject to the restructuring are notified about theproceeding, granting a 30-day term for challengers or requests for adhesion, as and if applicable. The ERCourt may also approve, upon request, a stay period, which prevents any enforcement proceedingagainst the Company, with respect to all claims subject to the restructuring.
After the opposition period, the ER Court grants the Company a 5-day period to submit its response. Theduration of the discussions related to opposition from creditors depends on the number and materiality ofoppositions filed.
After the discussion period, the ER Court assesses the challenges and the content of the ER Plan, andmay confirm the ER Plan (”ER Confirmation”). Upon confirmation, all terms and conditions of the ER Planbecome binding upon all creditors subject to the restructuring.
CONFIDENTIAL SETTLEMENT COMMUNICATION SUBJECT TO FRE 408

39
Restructuring Implementation Proceeding (Cont’d.)
This restructuring will be implemented through a single ER procedure comprised of 3 differentER Plans signed by creditors representing at least 60% of the total amount of claims for eachrelevant ER Plan, as follows:
• An ER Plan involving the Company entities and creditors related to the 2021 Notes, which sets forthall terms and conditions for the restructuring of claims in connection with the 2021 Notes;
• An ER Plan involving the Company entities and creditors related to the 2022 Notes, which sets forthall terms and conditions for the restructuring of claims in connection with the 2022 Notes;
• An ER Plan involving the Company and other holding entities and related financial creditors, whichsets forth all terms and conditions for the restructuring of financial claims in connection withfinancial creditors;
Holders adhesion to the ER Plans
In order to sign each of the ER Plans, holders must duly submit to the ER Court proof of their claims in the form of an ownership statement indicating the ownership and the amount of claims they hold under the 2021 or 2022 Notes, as well as other documents verifying signing entities powers, such as a certificate of incumbency, in a process known as “Individualization”. Holders must complete the Individualization procedure before the filing of the ER Plans.
Upon the signature of each ER Plan, holders will be restricted and prevented from trading their 2021 or 2022 Notes until the filing of the ER before the ER Courts. After the filing, the titles are freely transferable, provided that any transferee is fully bound to all terms and conditions of the ER Plan.
CONFIDENTIAL SETTLEMENT COMMUNICATION SUBJECT TO FRE 408

40
Restructuring Implementation Proceeding (Cont’d.)
Chapter 15 Proceeding
After the ER Confirmation, the Company will enter into an ancillary Chapter 15 Proceeding (”Chapter 15 Proceeding”) in the United States pursuant to the U.S. Bankruptcy Code, to the extent necessary for recognition of the effects of the Brazilian ER in the United States. Upon approval of the ancillary Chapter 15 Proceeding, the U.S. Bankruptcy Court will issue a court order determining the due recognition and confirmation of all effects of the ER Plans in the United States.
Mandatory Exchange before DTC.
After the issuance of the U.S. Bankruptcy Court recognition court order, the Company will conduct a mandatory exchange through DTC through which all former 2021 and 2022 notes will be substituted by New 2021 and 2022 notes subject to all terms and conditions agreed in the ER Plan.
Financial creditors will also receive new notes issued as an effect of the mandatory exchange. The procedure will be conducted through an agent via DTC, in accordance with DTC’s internal procedures.
CONFIDENTIAL SETTLEMENT COMMUNICATION SUBJECT TO FRE 408

41
Restructuring Timeline(1)
Restructuring implementation expected timeline
CONFIDENTIAL SETTLEMENT COMMUNICATION SUBJECT TO FRE 408
Deadline for submission of
creditors’ adhesions and
challenges
ER Confirmation
in Brazil
Decision granting the
ER Proceeding
• all creditors are notified about the ER Proceeding and are able to file adhesions or challenges, as applicable
• granting of stay period binds all creditors subject to the restructuring
ER Filing
10 days
(1) Estimates based in recent ER Proceedings and Chapter 15 recognitions. All estimates consider the absence of challenges or oppositions. The timing related to the Brazilian ER might be
considered in business days in accordance with recent developments under the new Brazilian civil procedure code.
(2) The filing for the Chapter 15 Proceeding might occur simultaneously with the ER Filing in Brazil, if necessary.
60 days
30 days
Chapter 15
Filing(2)
Exchange of Notes
Completed
Chapter 15 Recognition
45 days
Request for mandatory
exchange before DTC
15 days
Almost Simultaneous
Almost Simultaneous

Agenda
CONFIDENTIAL SETTLEMENT COMMUNICATION SUBJECT TO FRE 408
1. Company Overview
2. Why Restructuring
3. Summary of Restructuring
4. Restructuring Implementation Proceeding
5. Appendix
a) OOG Corporate Structure
b) Quarterly Budget
c) Overview of Contract Rates
d) Opex Detailing

43
OOG Current Complete Corporate Structure
Apicatus HoldingGmbH
ODN I Perfurações
Ltda
Cayman
UK
60%
50%
49%
ODN IODN II
NSP
OOSL
ODN Tay IV Holding
GmbH
ODN Tay IV
OOGServiços em Óleo e Gás
Ltda
Ownerships of 100%, except if otherwise noted
ODN Tay IV GmbH
NSPC
89,75%
Uruguay
Netherlands
Delba Drilling International
Coöperatie
ODN Drilling Services B.V.
ODN Delba III
53%
OOG Subsea GmbH
OOG Pipe Laying
B.V.
TechnipOdebrechtPLSV C.V.
Delba Perfuradora Internacional S.A.
49%
49,95%0,10%
50%
Neptune Drilling
Coöperatief
15%
TechnipOdebrechtPLSV B.V.
Cayman
USA
Brazil
Austria
Netherlands
UruguayUK
OOG-TKP Oil Services Ltd
50%
Norbe IX
Norbe VIII
Norbe VI
ODN VIII/IX Ltd
50% 50%
ODN Six GmbH
ODN Nine GmbH
ODN Eight GmbH
USA
OOG FPSO GmbH
50%
OOG-TKP FPSO
GmbH & Co KG
Brazil
OOG-TKP Produção de
Petróleo Ltda
OOG-TKP Operator
Holdings Ltd
Cayman
OOG-TKP FPSO GmbH
Pituba Drilling
B.V.
Boipeba Drilling
B.V.
Botinas Drilling
B.V.
Interlagos Drilling
B.V.
15% 15% 15% 15%
Odebrecht Offshore Drilling Finance Limited
50,18%
Odebrecht Drilling
Services LLC
1 quota
24,27%25,55%
Odebrecht Oil & Gas Finance Limited
OOG Offshore
Services Ltd
50%
OOGTK LIBRA
GmbH & Co KG
OOGTK LIBRA GmbH
50% 50%
OOGTK Libra Produção de
Petróleo Ltda
Ondina Drilling
B.V.
1 quota
ODN IGmbH
ODN Holding GmbH
OOG GmbH
OOG Participações
S.A.
OOG S.A.
11% 51% 51% 49%
AIAS Holding GmbH
OOG Holding S.A.
OOGTK Libra
Operator Holdings
Ltd.

Agenda
CONFIDENTIAL SETTLEMENT COMMUNICATION SUBJECT TO FRE 408
1. Company Overview
2. Why Restructuring
3. Summary of Restructuring
4. Restructuring Implementation Proceeding
5. Appendix
a) OOG Corporate Structure
b) Quarterly Budget
c) Overview of Contract Rates
d) Opex Detailing

45
Bond 21 & Bond 22 Cash Flows Forecasts for MIP CalculationScenario: No changes to PBR current contracts (case A)
CONFIDENTIAL SETTLEMENT COMMUNICATION SUBJECT TO FRE 408
Note: Since MIP accruals are calculated as of March 1st, June 1st, Sep 1st and Dec 1st, abovementioned quarters include the three preceding months prior to each accrual date (i.e., 1Q = Dec/Jan/Feb; 2Q = Mar/Apr/May; 3Q = Jun/Jul/Aug; 4Q = Sep/Oct/Nov).(1) Management Incentive Plan as described in Bonds 2021 and 2022 Indentures.(2) Assumes conclusion of transaction in August with payment of advisor’s success fee on the same month.
US$ mm
BOND 21 2Q17 3Q17 4Q17 1Q18 2Q18 3Q18 4Q18 1Q19 2Q19 3Q19 4Q19
Gross Revenue 61.5 60.4 76.1 72.7 64.3 72.8 75.0 73.0 71.8 64.7 73.4
(-) WH Taxes (1.8) (1.7) (2.0) (2.0) (1.7) (1.7) (1.6) (1.4) (1.4) (1.3) (1.4)
(=) Net Revenue 59.7 58.7 74.1 70.7 62.6 71.1 73.4 71.6 70.4 63.4 72.0
(-) Opex (27.4) (25.1) (24.1) (23.5) (23.8) (23.8) (23.5) (23.0) (23.4) (23.4) (23.2)
(-) Capex (7.0) (3.0) (3.0) (8.6) (2.5) (5.4) (5.4) (2.2) (2.1) (2.1) (2.1)
(-) Restructuring Costs (2) (2.0) (4.8) - - - - - - - - -
(=) Unleveraged Free Cash Flow 23.3 25.8 47.0 38.6 36.3 41.8 44.4 46.4 44.9 37.9 46.8
US$ mm
BOND 22 2Q17 3Q17 4Q17 1Q18 2Q18 3Q18 4Q18 1Q19 2Q19 3Q19 4Q19
Gross Revenue 104.6 95.5 89.1 96.9 89.7 88.0 67.4 59.7 65.9 71.9 75.7
(-) WH Taxes (4.9) (4.5) (4.4) (4.5) (4.1) (3.2) (1.3) (1.2) (1.3) (1.8) (2.6)
(=) Net Revenue 99.7 91.0 84.7 92.4 85.6 84.9 66.1 58.6 64.6 70.2 73.1
(-) Opex (46.3) (45.3) (37.8) (36.0) (36.0) (38.3) (34.6) (31.0) (31.9) (40.4) (34.9)
(-) Capex (5.1) (4.0) (14.1) (20.2) (11.5) (4.7) (4.0) (4.6) (8.0) (5.8) (4.7)
(-) Restructuring Costs (2) (4.0) (9.7) - - - - - - - - -
(=) Unleveraged Free Cash Flow 44.2 32.1 32.7 36.2 38.1 41.9 27.5 23.0 24.7 23.9 33.5
Project Bonds unlevered free cash flow to be used for MIP(1) calculation purposes
Project Bond 2022 assumptions shall be revised in light of changes on N6 recontracting scenario

46
Norbe VIII & IX Cash Flow ForecastsScenario: No changes to PBR current contracts (case A)
CONFIDENTIAL SETTLEMENT COMMUNICATION SUBJECT TO FRE 408
US$ mm
Norbe VIII 2Q17 3Q17 4Q17 1Q18 2Q18 3Q18 4Q18 1Q19 2Q19 3Q19 4Q19
Gross Revenue 26.8 33.5 37.5 37.5 29.7 37.5 37.5 37.8 37.0 37.5 37.9
(-) WH Taxes (0.8) (0.9) (1.0) (1.0) (0.7) (0.7) (0.7) (0.7) (0.7) (0.7) (0.7)
(=) Net Revenue 25.9 32.6 36.5 36.5 29.0 36.8 36.8 37.1 36.3 36.8 37.1
(-) Opex (13.3) (12.6) (12.2) (11.6) (11.7) (11.7) (11.5) (11.6) (12.0) (12.0) (11.8)
(-) Capex (1.4) (1.9) (1.9) (4.5) (1.3) (4.2) (1.3) (1.2) (1.2) (1.2) (1.2)
(-) Restructuring Costs (2) (1.0) (2.4) - - - - - - - - -
(=) Unleveraged Free Cash Flow 10.2 15.6 22.4 20.4 16.1 20.9 24.0 24.3 23.1 23.6 24.1
US$ mm
Norbe IX 2Q17 3Q17 4Q17 1Q18 2Q18 3Q18 4Q18 1Q19 2Q19 3Q19 4Q19
Gross Revenue 34.8 26.9 38.6 35.2 34.6 35.2 37.5 35.2 34.8 27.2 35.6
(-) WH Taxes (1.0) (0.8) (1.0) (1.0) (0.9) (1.0) (0.9) (0.7) (0.7) (0.5) (0.7)
(=) Net Revenue 33.8 26.1 37.6 34.3 33.6 34.3 36.6 34.5 34.1 26.7 34.9
(-) Opex (14.1) (12.4) (11.9) (11.8) (12.1) (12.1) (12.0) (11.4) (11.5) (11.5) (11.3)
(-) Capex (5.5) (1.0) (1.0) (4.2) (1.2) (1.2) (4.2) (1.0) (0.9) (0.9) (0.9)
(-) Restructuring Costs (2) (1.0) (2.4) - - - - - - - - -
(=) Unleveraged Free Cash Flow 13.2 10.3 24.7 18.2 20.3 20.9 20.5 22.1 21.8 14.3 22.7
Note: Since MIP accruals are calculated as of March 1st, June 1st, Sep 1st and Dec 1st, abovementioned quarters include the three preceding months prior to each accrual date (i.e., 1Q = Dec/Jan/Feb; 2Q = Mar/Apr/May; 3Q = Jun/Jul/Aug; 4Q = Sep/Oct/Nov). (1) Management Incentive Plan as described in Bonds 2021 and 2022 Indentures.(2) Assumes conclusion of transaction in August with payment of advisor’s success fee on the same month.
Detailed cash flow forecast, for informative purposes only

47
ODN I & II Cash Flow ForecastsScenario: No changes to PBR current contracts (case A)
CONFIDENTIAL SETTLEMENT COMMUNICATION SUBJECT TO FRE 408
US$ mm
ODN I 2Q17 3Q17 4Q17 1Q18 2Q18 3Q18 4Q18 1Q19 2Q19 3Q19 4Q19
Gross Revenue 36.9 32.1 32.5 29.7 34.1 33.4 33.7 26.1 32.9 33.4 33.7
(-) WH Taxes (0.9) (0.9) (0.9) (0.8) (0.8) (0.7) (0.7) (0.5) (0.6) (0.7) (0.7)
(=) Net Revenue 35.9 31.3 31.6 28.9 33.3 32.7 33.0 25.6 32.3 32.7 33.0
(-) Opex (13.5) (13.5) (13.0) (12.2) (12.1) (12.1) (12.0) (11.6) (11.8) (11.8) (11.7)
(-) Capex (1.0) (1.1) (11.3) (8.2) (2.1) (2.1) (2.1) (1.6) (1.4) (1.4) (1.4)
(-) Restructuring Costs (2) (1.0) (2.4) - - - - - - - - -
(=) Unleveraged Free Cash Flow 20.5 14.2 7.3 8.6 19.1 18.5 19.0 12.3 19.1 19.5 20.0
US$ mm
ODN II 2Q17 3Q17 4Q17 1Q18 2Q18 3Q18 4Q18 1Q19 2Q19 3Q19 4Q19
Gross Revenue 32.8 32.1 24.9 32.5 24.8 33.4 33.7 33.7 32.9 33.4 26.1
(-) WH Taxes (0.9) (0.9) (0.7) (0.9) (0.6) (0.7) (0.7) (0.7) (0.6) (0.7) (0.5)
(=) Net Revenue 31.9 31.2 24.1 31.6 24.2 32.7 33.0 33.0 32.3 32.7 25.6
(-) Opex (15.5) (14.2) (13.7) (12.8) (12.7) (12.7) (12.6) (12.1) (12.1) (12.1) (12.0)
(-) Capex (3.0) (1.4) (1.4) (10.4) (7.5) (1.9) (1.9) (1.5) (1.3) (1.3) (1.3)
(-) Restructuring Costs (2) (1.0) (2.4) - - - - - - - - -
(=) Unleveraged Free Cash Flow 12.4 13.2 9.0 8.4 3.9 18.1 18.5 19.5 18.9 19.3 12.4
Detailed cash flow forecast, for informative purposes only
Note: Since MIP accruals are calculated as of March 1st, June 1st, Sep 1st and Dec 1st, abovementioned quarters include the three preceding months prior to each accrual date (i.e., 1Q = Dec/Jan/Feb; 2Q = Mar/Apr/May; 3Q = Jun/Jul/Aug; 4Q = Sep/Oct/Nov). (1) Management Incentive Plan as described in Bonds 2021 and 2022 Indentures.(2) Assumes conclusion of transaction in August with payment of advisor’s success fee on the same month.

48
Norbe VI & ODN Tay IV Cash Flow ForecastsScenario: No changes to PBR current contracts (case A)
CONFIDENTIAL SETTLEMENT COMMUNICATION SUBJECT TO FRE 408
US$ mm
Norbe VI 2Q17 3Q17 4Q17 1Q18 2Q18 3Q18 4Q18 1Q19 2Q19 3Q19 4Q19
Gross Revenue 34.9 31.2 31.8 31.7 30.9 21.3 - - - 5.2 16.0
(-) WH Taxes (3.1) (2.7) (2.8) (2.8) (2.7) (1.8) - - - (0.5) (1.4)
(=) Net Revenue 31.8 28.5 28.9 28.9 28.2 19.4 - - - 4.8 14.5
(-) Opex (13.6) (11.6) (11.1) (10.9) (11.2) (13.4) (10.0) (7.3) (8.0) (16.5) (11.3)
(-) Capex (0.8) (1.4) (1.4) (1.7) (1.9) (0.6) - (1.5) (5.3) (3.2) (2.1)
(-) Restructuring Costs (2) (1.0) (2.4) - - - - - - - - -
(=) Unleveraged Free Cash Flow 16.3 13.1 16.4 16.3 15.1 5.4 (10.0) (8.8) (13.4) (15.0) 1.2
US$ mm
ODN Tay IV 2Q17 3Q17 4Q17 1Q18 2Q18 3Q18 4Q18 1Q19 2Q19 3Q19 4Q19
Gross Revenue - - - 3.0 - - - - - - -
(-) WH Taxes - - - - - - - - - - -
(=) Net Revenue - - - 3.0 - - - - - - -
(-) Opex (3.8) (6.0) - - - - - - - - -
(-) Capex (0.3) - - - - - - - - - -
(-) Restructuring Costs (2) (1.0) (2.4) - - - - - - - - -
(=) Unleveraged Free Cash Flow (5.0) (8.4) - 3.0 - - - - - - -
Detailed cash flow forecast, for informative purposes only
Note: Since MIP accruals are calculated as of March 1st, June 1st, Sep 1st and Dec 1st, abovementioned quarters include the three preceding months prior to each accrual date (i.e., 1Q = Dec/Jan/Feb; 2Q = Mar/Apr/May; 3Q = Jun/Jul/Aug; 4Q = Sep/Oct/Nov). (1) Management Incentive Plan as described in Bonds 2021 and 2022 Indentures.(2) Assumes conclusion of transaction in August with payment of advisor’s success fee on the same month.
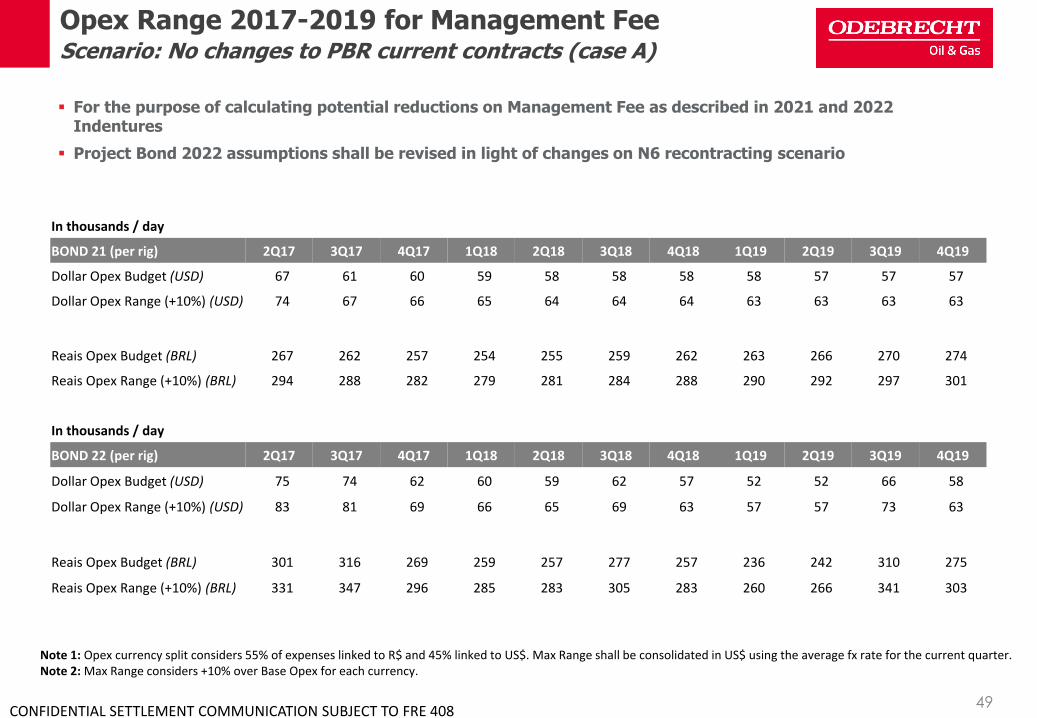
49
Opex Range 2017-2019 for Management FeeScenario: No changes to PBR current contracts (case A)
CONFIDENTIAL SETTLEMENT COMMUNICATION SUBJECT TO FRE 408
In thousands / day
BOND 21 (per rig) 2Q17 3Q17 4Q17 1Q18 2Q18 3Q18 4Q18 1Q19 2Q19 3Q19 4Q19
Dollar Opex Budget (USD) 67 61 60 59 58 58 58 58 57 57 57
Dollar Opex Range (+10%) (USD) 74 67 66 65 64 64 64 63 63 63 63
Reais Opex Budget (BRL) 267 262 257 254 255 259 262 263 266 270 274
Reais Opex Range (+10%) (BRL) 294 288 282 279 281 284 288 290 292 297 301
In thousands / day
BOND 22 (per rig) 2Q17 3Q17 4Q17 1Q18 2Q18 3Q18 4Q18 1Q19 2Q19 3Q19 4Q19
Dollar Opex Budget (USD) 75 74 62 60 59 62 57 52 52 66 58
Dollar Opex Range (+10%) (USD) 83 81 69 66 65 69 63 57 57 73 63
Reais Opex Budget (BRL) 301 316 269 259 257 277 257 236 242 310 275
Reais Opex Range (+10%) (BRL) 331 347 296 285 283 305 283 260 266 341 303
Note 1: Opex currency split considers 55% of expenses linked to R$ and 45% linked to US$. Max Range shall be consolidated in US$ using the average fx rate for the current quarter.Note 2: Max Range considers +10% over Base Opex for each currency.
For the purpose of calculating potential reductions on Management Fee as described in 2021 and 2022 Indentures
Project Bond 2022 assumptions shall be revised in light of changes on N6 recontracting scenario

50CONFIDENTIAL SETTLEMENT COMMUNICATION SUBJECT TO FRE 408
For the purpose of calculating potential reductions on Management Fee as described in 2021 and 2022 Indentures
Project Bond 2022 assumptions shall be revised in light of changes on N6 recontracting scenario
Capex Range 2017-2019 for Management FeeScenario: No changes to PBR current contracts (case A)
Note : Extraordinary capex schedule may change as a result of negotiation with class society, Petrobras well program or any unscheduled emergency maintenance.
US$ mm
BOND 21 2Q17 3Q17 4Q17 1Q18 2Q18 3Q18 4Q18 1Q19 2Q19 3Q19 4Q19
Fleet Spare & Operational Capex
Ongoing Dollar Capex Budget 2.1 3.0 3.0 8.6 2.5 2.4 2.4 2.2 2.1 2.1 2.1
Ongoing Dollar Capex Budget (+10%) 2.3 3.3 3.3 9.5 2.7 2.7 2.7 2.4 2.3 2.3 2.3
SPS 5 yrs / Thruster
Extraordinary Dollar Capex Budget 4.9 - - - - 3.0 3.0 - - - -
Extraordinary Dollar Capex Budget (+10%) 5.4 - - - - 3.3 3.3 - - - -
US$ mm
BOND 22 2Q17 3Q17 4Q17 1Q18 2Q18 3Q18 4Q18 1Q19 2Q19 3Q19 4Q19
Fleet Spare & Operational Capex
Ongoing Dollar Capex Budget 3.3 4.0 4.0 11.3 5.9 4.7 4.0 3.1 2.7 4.0 4.7
Ongoing Dollar Capex Budget (+10%) 3.7 4.4 4.4 12.4 6.5 5.1 4.4 3.4 3.0 4.4 5.2
SPS 5 yrs / Thruster
Extraordinary Dollar Capex Budget 1.8 - 10.1 9.0 5.6 - - 1.5 5.3 1.8 -
Extraordinary Dollar Capex Budget (+10%) 2.0 - 11.1 9.9 6.2 - - 1.7 5.8 2.0 -

51
Bond 21 & Bond 22 Cash Flow ForecastsStacking Scenario: N6 11m | N8 2yr | No penalties (case B)
CONFIDENTIAL SETTLEMENT COMMUNICATION SUBJECT TO FRE 408
US$ mm
BOND 21 2Q17 3Q17 4Q17 1Q18 2Q18 3Q18 4Q18 1Q19 2Q19 3Q19 4Q19
Gross Revenue 61.7 71.1 66.9 58.5 58.8 58.7 61.2 58.8 58.2 51.0 69.4
(-) WH Taxes (1.8) (1.8) (1.8) (1.6) (1.6) (1.5) (1.4) (1.2) (1.2) (1.0) (1.3)
(=) Net Revenue 59.9 69.3 65.2 56.8 57.3 57.2 59.8 57.7 57.1 49.9 68.0
(-) Opex (27.4) (28.1) (20.6) (19.2) (19.5) (18.6) (18.0) (17.4) (17.6) (20.4) (26.0)
(-) Capex (7.0) (3.0) (1.0) (1.2) (1.2) (1.2) (4.2) (2.5) (3.0) (7.1) (2.1)
(-) Restructuring Costs (2) (2.0) (4.8) - - - - - - - - -
(=) Unleveraged Free Cash Flow 23.5 33.4 43.6 36.5 36.5 37.4 37.7 37.8 36.5 22.4 39.9
US$ mm
BOND 22 2Q17 3Q17 4Q17 1Q18 2Q18 3Q18 4Q18 1Q19 2Q19 3Q19 4Q19
Gross Revenue 104.6 107.6 73.7 81.5 75.1 77.8 67.4 59.7 65.9 74.2 82.7
(-) WH Taxes (4.9) (4.6) (3.1) (3.1) (2.8) (2.3) (1.3) (1.2) (1.3) (2.0) (3.1)
(=) Net Revenue 99.7 103.0 70.6 78.4 72.2 75.5 66.1 58.6 64.6 72.3 79.6
(-) Opex (46.3) (46.6) (34.2) (32.3) (32.1) (31.0) (30.5) (29.6) (35.2) (37.1) (34.9)
(-) Capex (4.7) (2.6) (12.7) (12.5) (9.6) (4.0) (4.0) (4.6) (9.4) (6.3) (4.7)
(-) Restructuring Costs (2) (4.0) (9.7) - - - - - - - - -
(=) Unleveraged Free Cash Flow 44.7 44.1 23.7 33.5 30.5 40.4 31.5 24.3 20.0 28.9 40.0
Project Bonds unlevered free cash flow to be used for MIP(1) calculation purposes
Project Bond 2021 and 2022 assumptions shall be revised in light of changes in current negotiations with Petrobras, or in case stacking assumptions do not match Petrobras Stacking options exercise
Note: Since MIP accruals are calculated as of March 1st, June 1st, Sep 1st and Dec 1st, abovementioned quarters include the three preceding months prior to each accrual date (i.e., 1Q = Dec/Jan/Feb; 2Q = Mar/Apr/May; 3Q = Jun/Jul/Aug; 4Q = Sep/Oct/Nov). (1) Management Incentive Plan as described in Bonds 2021 and 2022 Indentures.(2) Assumes conclusion of transaction in August with payment of advisor’s success fee on the same month.

52
Norbe VIII & IX Cash Flow ForecastsStacking Scenario: N6 11m | N8 2yr | No penalties (case B)
CONFIDENTIAL SETTLEMENT COMMUNICATION SUBJECT TO FRE 408
US$ mm
Norbe VIII 2Q17 3Q17 4Q17 1Q18 2Q18 3Q18 4Q18 1Q19 2Q19 3Q19 4Q19
Gross Revenue 26.8 43.9 28.0 22.9 23.9 23.1 23.3 23.3 23.1 23.5 33.4
(-) WH Taxes (0.8) (0.9) (0.8) (0.7) (0.6) (0.5) (0.5) (0.5) (0.5) (0.5) (0.7)
(=) Net Revenue 26.0 43.0 27.2 22.2 23.3 22.6 22.8 22.8 22.6 23.0 32.8
(-) Opex (13.3) (15.7) (8.6) (7.3) (7.4) (6.5) (6.0) (6.0) (6.1) (9.0) (14.7)
(-) Capex (1.4) (1.9) - - - - - (1.5) (2.1) (6.2) (1.2)
(-) Restructuring Costs (2) (1.0) (2.4) - - - - - - - - -
(=) Unleveraged Free Cash Flow 10.3 22.9 18.6 14.9 15.9 16.1 16.9 15.3 14.4 7.8 16.9
US$ mm
Norbe IX 2Q17 3Q17 4Q17 1Q18 2Q18 3Q18 4Q18 1Q19 2Q19 3Q19 4Q19
Gross Revenue 34.9 27.2 38.9 35.6 34.9 35.6 37.9 35.5 35.1 27.5 35.9
(-) WH Taxes (1.0) (0.8) (1.0) (1.0) (1.0) (1.0) (0.9) (0.7) (0.7) (0.5) (0.7)
(=) Net Revenue 33.9 26.4 38.0 34.6 34.0 34.6 37.0 34.8 34.5 26.9 35.2
(-) Opex (14.1) (12.4) (11.9) (11.8) (12.1) (12.1) (12.0) (11.4) (11.5) (11.5) (11.3)
(-) Capex (5.5) (1.0) (1.0) (1.2) (1.2) (1.2) (4.2) (1.0) (0.9) (0.9) (0.9)
(-) Restructuring Costs (2) (1.0) (2.4) - - - - - - - - -
(=) Unleveraged Free Cash Flow 13.3 10.5 25.0 21.6 20.6 21.3 20.8 22.4 22.1 14.6 23.0
Detailed cash flow forecast, for informative purposes only
Note: Since MIP accruals are calculated as of March 1st, June 1st, Sep 1st and Dec 1st, abovementioned quarters include the three preceding months prior to each accrual date (i.e., 1Q = Dec/Jan/Feb; 2Q = Mar/Apr/May; 3Q = Jun/Jul/Aug; 4Q = Sep/Oct/Nov). (1) Management Incentive Plan as described in Bonds 2021 and 2022 Indentures.(2) Assumes conclusion of transaction in August with payment of advisor’s success fee on the same month.

53
ODN I & II Cash Flow ForecastsStacking Scenario: N6 11m | N8 2yr | No penalties (case B)
CONFIDENTIAL SETTLEMENT COMMUNICATION SUBJECT TO FRE 408
US$ mm
ODN I 2Q17 3Q17 4Q17 1Q18 2Q18 3Q18 4Q18 1Q19 2Q19 3Q19 4Q19
Gross Revenue 36.9 32.1 32.5 29.7 34.1 33.4 33.7 26.1 32.9 33.4 33.7
(-) WH Taxes (0.9) (0.9) (0.9) (0.8) (0.8) (0.7) (0.7) (0.5) (0.6) (0.7) (0.7)
(=) Net Revenue 35.9 31.3 31.6 28.9 33.3 32.7 33.0 25.6 32.3 32.7 33.0
(-) Opex (13.5) (13.5) (13.0) (12.2) (12.1) (12.1) (12.0) (11.6) (11.8) (11.8) (11.7)
(-) Capex (1.0) (1.1) (11.3) (5.2) (2.1) (2.1) (2.1) (1.6) (1.4) (1.4) (1.4)
(-) Restructuring Costs (2) (1.0) (2.4) - - - - - - - - -
(=) Unleveraged Free Cash Flow 20.5 14.2 7.3 11.6 19.1 18.5 19.0 12.3 19.1 19.5 20.0
US$ mm
ODN II 2Q17 3Q17 4Q17 1Q18 2Q18 3Q18 4Q18 1Q19 2Q19 3Q19 4Q19
Gross Revenue 32.8 32.1 24.9 32.5 24.8 33.4 33.7 33.7 32.9 33.4 26.1
(-) WH Taxes (0.9) (0.9) (0.7) (0.9) (0.6) (0.7) (0.7) (0.7) (0.6) (0.7) (0.5)
(=) Net Revenue 31.9 31.2 24.1 31.6 24.2 32.7 33.0 33.0 32.3 32.7 25.6
(-) Opex (15.5) (14.2) (13.7) (12.8) (12.7) (12.7) (12.6) (12.1) (12.1) (12.1) (12.0)
(-) Capex (3.0) (1.4) (1.4) (7.4) (7.5) (1.9) (1.9) (1.5) (1.3) (1.3) (1.3)
(-) Restructuring Costs (2) (1.0) (2.4) - - - - - - - - -
(=) Unleveraged Free Cash Flow 12.4 13.2 9.0 11.4 3.9 18.1 18.5 19.5 18.9 19.3 12.4
Detailed cash flow forecast, for informative purposes only
Note: Since MIP accruals are calculated as of March 1st, June 1st, Sep 1st and Dec 1st, abovementioned quarters include the three preceding months prior to each accrual date (i.e., 1Q = Dec/Jan/Feb; 2Q = Mar/Apr/May; 3Q = Jun/Jul/Aug; 4Q = Sep/Oct/Nov). (1) Management Incentive Plan as described in Bonds 2021 and 2022 Indentures.(2) Assumes conclusion of transaction in August with payment of advisor’s success fee on the same month.

54
Norbe VI & ODN Tay IV Cash Flow ForecastsStacking Scenario: N6 11m | N8 2yr | No penalties (case B)
CONFIDENTIAL SETTLEMENT COMMUNICATION SUBJECT TO FRE 408
US$ mm
Norbe VI 2Q17 3Q17 4Q17 1Q18 2Q18 3Q18 4Q18 1Q19 2Q19 3Q19 4Q19
Gross Revenue 34.9 43.4 16.3 16.3 16.2 11.0 - - - 7.5 23.0
(-) WH Taxes (3.1) (2.9) (1.4) (1.4) (1.4) (1.0) - - - (0.6) (2.0)
(=) Net Revenue 31.8 40.5 14.9 14.9 14.8 10.1 - - - 6.9 21.0
(-) Opex (13.6) (12.9) (7.5) (7.3) (7.3) (6.2) (5.9) (6.0) (11.3) (13.2) (11.3)
(-) Capex (0.4) (0.1) - - - - - (1.5) (6.8) (3.6) (2.1)
(-) Restructuring Costs (2) (1.0) (2.4) - - - - - - - - -
(=) Unleveraged Free Cash Flow 16.8 25.1 7.4 7.6 7.4 3.9 (5.9) (7.5) (18.0) (10.0) 7.6
US$ mm
ODN Tay IV 2Q17 3Q17 4Q17 1Q18 2Q18 3Q18 4Q18 1Q19 2Q19 3Q19 4Q19
Gross Revenue - - - 3.0 - - - - - - -
(-) WH Taxes - - - - - - - - - - -
(=) Net Revenue - - - 3.0 - - - - - - -
(-) Opex (3.8) (6.0) - - - - - - - - -
(-) Capex (0.3) - - - - - - - - - -
(-) Restructuring Costs (2) (1.0) (2.4) - - - - - - - - -
(=) Unleveraged Free Cash Flow (5.0) (8.4) - 3.0 - - - - - - -
Detailed cash flow forecast, for informative purposes only
Note: Since MIP accruals are calculated as of March 1st, June 1st, Sep 1st and Dec 1st, abovementioned quarters include the three preceding months prior to each accrual date (i.e., 1Q = Dec/Jan/Feb; 2Q = Mar/Apr/May; 3Q = Jun/Jul/Aug; 4Q = Sep/Oct/Nov).(1) Management Incentive Plan as described in Bonds 2021 and 2022 Indentures.(2) Assumes conclusion of transaction in August with payment of advisor’s success fee on the same month.

55CONFIDENTIAL SETTLEMENT COMMUNICATION SUBJECT TO FRE 408
In thousands / day
BOND 21 (per rig) 2Q17 3Q17 4Q17 1Q18 2Q18 3Q18 4Q18 1Q19 2Q19 3Q19 4Q19
Dollar Opex Budget (USD) 67 69 51 48 48 45 44 43 43 50 64
Dollar Opex Range (+10%) (USD) 74 76 56 53 52 50 49 48 47 55 71
Reais Opex Budget (BRL) 267 294 219 207 209 202 200 199 200 235 307
Reais Opex Range (+10%) (BRL) 294 324 241 228 230 222 220 219 219 259 338
In thousands / day
BOND 22 (per rig) 2Q17 3Q17 4Q17 1Q18 2Q18 3Q18 4Q18 1Q19 2Q19 3Q19 4Q19
Dollar Opex Budget (USD) 75 76 56 54 52 51 50 49 57 60 58
Dollar Opex Range (+10%) (USD) 83 84 62 59 58 56 55 54 63 67 63
Reais Opex Budget (BRL) 301 325 243 233 230 225 227 226 266 285 275
Reais Opex Range (+10%) (BRL) 331 358 267 256 253 247 249 249 293 313 303
Note 1: Opex currency split considers 55% of expenses linked to R$ and 45% linked to US$. Max Range shall be consolidated in US$ using the average fx rate for the current quarter.Note 2: Max Range considers +10% over Base Opex for each currency.
For the purpose of calculating potential reductions on Management Fee as described in 2021 and 2022 Indentures
Project Bond 2021 and 2022 assumptions shall be revised in light of changes in current negotiations with Petrobras, or in case stacking assumptions do not match Petrobras Stacking options exercise
Opex Range 2017-2019 for Management FeeStacking Scenario: N6 11m | N8 2yr | No penalties (case B)

56CONFIDENTIAL SETTLEMENT COMMUNICATION SUBJECT TO FRE 408
Capex Range 2017-2019 for Management FeeStacking Scenario: N6 11m | N8 2yr | No penalties (case B)
For the purpose of calculating potential reductions on Management Fee as described in 2021 and 2022 Indentures
Project Bond 2021 and 2022 assumptions shall be revised in light of changes in current negotiations with Petrobras, or in case stacking assumptions do not match Petrobras Stacking options exercise
Note : Extraordinary capex schedule may change as a result of negotiation with class society, Petrobras well program or any unscheduled emergency maintenance.
US$ mm
BOND 21 2Q17 3Q17 4Q17 1Q18 2Q18 3Q18 4Q18 1Q19 2Q19 3Q19 4Q19
Fleet Spare & Operational Capex
Ongoing Dollar Capex Budget 2.1 3.0 1.0 1.2 1.2 1.2 1.2 1.0 0.9 0.9 2.1
Ongoing Dollar Capex Budget (+10%) 2.3 3.3 1.1 1.3 1.4 1.4 1.3 1.1 0.9 1.0 2.3
SPS 5 yrs / Thruster
Extraordinary Dollar Capex Budget 4.9 - - - - - 3.0 1.5 2.1 6.2 -
Extraordinary Dollar Capex Budget (+10%) 5.4 - - - - - 3.3 1.7 2.3 6.8 -
US$ mm
BOND 22 2Q17 3Q17 4Q17 1Q18 2Q18 3Q18 4Q18 1Q19 2Q19 3Q19 4Q19
Fleet Spare & Operational Capex
Ongoing Dollar Capex Budget 2.9 2.6 2.6 3.5 4.0 4.0 4.0 3.1 2.6 4.1 4.7
Ongoing Dollar Capex Budget (+10%) 3.2 2.9 2.8 3.9 4.4 4.4 4.4 3.4 2.9 4.5 5.2
SPS 5 yrs / Thruster
Extraordinary Dollar Capex Budget 1.8 - 10.1 9.0 5.6 - - 1.5 6.8 2.2 -
Extraordinary Dollar Capex Budget (+10%) 2.0 - 11.1 9.9 6.2 - - 1.7 7.5 2.4 -

57
Onshore Support (Drilling Business Unit):• Costs are allocated evenly per number of rigs in operation (currently each rig pays for 1/6(1) of
the Drilling BU overhead)
Corporate:• Costs are allocated as a function of revenue produced by each Business Unit• 76% of 2017 corporate expenses budget of $19m is allocated to the Drilling BU.
• From 2018 onwards, 66% of expenses are allocated to the Drilling BU• At the end of each year, adjustments to the allocated overhead costs are implemented
accordingly to the actual corporate costs and actual revenue of each business unit• For budget purposes, overhead corporate cost from 2018 onwards are calculated with a 5%
inflation in BRL. Those values are then converted by the forecasted exchange rate and allocated as a function of forecasted revenue produced by each business unit
• In any year, corporate overhead costs allocated to the Drilling Business Unit are divided equally among the number of rigs in operation
SG&A Allocation
CONFIDENTIAL SETTLEMENT COMMUNICATION SUBJECT TO FRE 408
• Any cost that is directly related to a rig is allocated directly (i.e., is not part of overhead)• Areas / departments that serves the fleet have their cost allocated through overhead
Cost Allocation Criteria
Overhead
(1) Rigs in Drilling BU include ODN I, ODN II and Norbe VI (2022 vessels), Norbe VIII and Norbe IX (2021 vessels) and Delba III.

58
SG&A Allocation (included in Opex)
CONFIDENTIAL SETTLEMENT COMMUNICATION SUBJECT TO FRE 408
US$ mm
SG&A Allocation 2Q17 3Q17 4Q17 1Q18 2Q18 3Q18 4Q18 1Q19 2Q19 3Q19 4Q19
Onshore Support (100%) (1.2) (3.5) (3.5) (3.5) (3.6) (3.6) (3.5) (3.5) (3.5) (3.5) (3.5)
TAC (76%) ¹ (5.4) (4.6) (2.9) (2.7) (2.6) (2.6) (2.6) (2.5) (2.6) (2.6) (2.6)
Total (6.6) (8.2) (6.4) (6.1) (6.2) (6.2) (6.1) (6.0) (6.1) (6.1) (6.0)
SG&A Allocated per rig (1.3) (1.6) (1.3) (1.2) (1.2) (1.2) (1.2) (1.2) (1.2) (1.2) (1.2)
Note: ODN Tay IV scraped, not receiving TAC allocation.(1) Corporate expenses allocated to each Project Bond.(2) 5/6 of total budgeted corporate expenses, since Delba III is in a separate Project Finance structure .

59
Tax Allocation
CONFIDENTIAL SETTLEMENT COMMUNICATION SUBJECT TO FRE 408
Taxes are allocated directly whenever applicable:
• Taxes over payroll are allocated to the payroll of each unit
• Taxes over G&A are allocated directly to administrative expenses
• Taxes over services and materials are allocated directly to the event that generates them
Indirect taxes:
• Petrobras payments are net of certain withholding taxes
• Whenever there is a tax recovery, it remains within the structure
Current tax structure:
• Current OOG tax structure was designed in light of current contracts with Petrobras
• In case of new contracts, tax structure must be reviewed
• In case of changes in existing tax agreements/rulings and/or changes that affect OOG current tax structure, there will be need to implement adjustments
• Budget should be reviewed to reflect changes in tax structure
Agenda
CONFIDENTIAL SETTLEMENT COMMUNICATION SUBJECT TO FRE 408
1. Company Overview
2. Why Restructuring
3. Summary of Restructuring
4. Restructuring Implementation Proceeding
5. Appendix
a) OOG Corporate Structure
b) Quarterly Budget
c) Overview of Contract Rates
d) Opex Detailing

61
Overview of Contract Rates($ in thousands)
CONFIDENTIAL SETTLEMENT COMMUNICATION SUBJECT TO FRE 408
Below are the contract rates utilized in Case A forecast. Rates are consistent with existing contracts.
Note: Daily rates net of contractual penalties.
2022 Drilling Assets Status 2017 2018 2019 2020 2021 2022
Service Dayrate (R$ k/day)
ODN I Currently Contracted 111 117 122 129 136 140
ODN II Currently Contracted 111 117 122 129 136 140
Norbe VI Currently Contracted 467 482
Off hire - -
Re-contracted 270 329 496 513
Charter Dayrate (US$ k/day)
ODN I Currently Contracted 335 335 335 338 339 341
ODN II Currently Contracted 335 335 335 338 339 341
Norbe VI Currently Contracted 210 212
Off hire - -
Re-contracted 105 122 174 174
2021 Drilling Assets Status 2017 2018 2019 2020 2021 2022
Service Dayrate (R$ k/day)
Norbe VIII Currently Contracted 124 130 136 144 150 -
Norbe IX Currently Contracted 117 122 128 135 142 -
Charter Dayrate (US$ k/day)
Norbe VIII Currently Contracted 375 376 377 380 381 -
Norbe IX Currently Contracted 352 354 355 357 358 -

Agenda
CONFIDENTIAL SETTLEMENT COMMUNICATION SUBJECT TO FRE 408
1. Company Overview
2. Why Restructuring
3. Summary of Restructuring
4. Restructuring Implementation Proceeding
5. Appendix
a) OOG Corporate Structure
b) Quarterly Budget
c) Overview of Contract Rates
d) Opex Detailing

63
Forecasted Opex of each Vessel (21’s)
CONFIDENTIAL SETTLEMENT COMMUNICATION SUBJECT TO FRE 408
Note 1: Amounts from 2017 to 2019 derive from the annual budget. Amounts from 2020 to 2021 are illustrative and shall not be considered as annual budget. Note 2: Does not include restructuring costs incurred at project level.
Case A - No changes to PBR current contracts

64
Forecasted Opex of each Vessel (22’s)
CONFIDENTIAL SETTLEMENT COMMUNICATION SUBJECT TO FRE 408
Note 1: Amounts from 2017 to 2019 derive from the annual budget. Amounts from 2020 to 2022 are illustrative and shall not be considered as annual budget. Note 2: Does not include restructuring costs incurred at project level.
Case A - No changes to PBR current contracts

65
Forecasted Capex of each Vessel($ in MM)
CONFIDENTIAL SETTLEMENT COMMUNICATION SUBJECT TO FRE 408
Case A - No changes to PBR current contracts
Note: Amounts from 2017 to 2019 derive from the annual budget. Amounts from 2020 to 2021 are illustrative and shall not be considered as annual budget.
Norbe VI 2017 2018 2019 2020 2021 2022
Total 4.5 5.2 11.3 5.1 2.5 5.8
ODN I 2017 2018 2019 2020 2021 2022
Total 20.2 8.4 5.6 6.3 4.5 21.0
ODN II 2017 2018 2019 2020 2021 2022
Total 9.5 18.9 5.0 7.7 4.8 21.3
Norbe VIII 2017 2018 2019 2020 2021 2022
Total 9.3 8.0 4.8 10.5 17.4 5.0
Norbe IX 2017 2018 2019 2020 2021 2022
Total 11.3 7.9 3.5 5.7 21.6 4.7


![> 3/128 78; 1 oog¥D 1 0:00 TEL 0852)24-5200 TEL(085 )24boo ... · 1 OOB¥D 100*) +YñYYî-— —fi]CT oog¥D I I Okg) I OOg¥D I OOOkgßRD 1 OOg¥D 1 oog¥D 1 OOO˽D 7'ayZlJ—](https://static.fdocuments.us/doc/165x107/6125ad65a251f0423a6e74d0/-3128-78-1-oogd-1-000-tel-085224-5200-tel085-24boo-1-oobd-100.jpg)


![HA@Au-7-73-Oog g + g]](https://static.fdocuments.us/doc/165x107/61bd19a761276e740b0f59e0/haau-7-73-oog-g-g.jpg)
