
Onsite Wastewater Concepts -Part B, Onsite Sewage System ...

Onsite Nitrogen RemovalOnsite Nitrogen Removal
Stewart OakleyStewart OakleyDepartment of Civil EngineeringDepartment of Civil EngineeringCalifornia State University, ChicoCalifornia State University, Chico
University Curriculum Development University Curriculum Development forfor DecentralizedDecentralized Wastewater Wastewater
ManagementManagement

NDWRCDP DisclaimerNDWRCDP DisclaimerThis work was supported by the National Decentralized Water This work was supported by the National Decentralized Water Resources Capacity Development Project (NDWRCDP) with Resources Capacity Development Project (NDWRCDP) with
funding provided by the U.S. Environmental Protection Agency funding provided by the U.S. Environmental Protection Agency through a Cooperative Agreement (EPA No. CR827881through a Cooperative Agreement (EPA No. CR827881--0101--0) 0) with Washington University in St. Louis. These materials have with Washington University in St. Louis. These materials have
not been reviewed by the U.S. Environmental Protection not been reviewed by the U.S. Environmental Protection Agency. These materials have been reviewed by Agency. These materials have been reviewed by representatives of the NDWRCDP. The contents representatives of the NDWRCDP. The contents
of these materials do not necessarily reflect the views and of these materials do not necessarily reflect the views and policies of the NDWRCDP, Washington University, or the U.S. policies of the NDWRCDP, Washington University, or the U.S.
Environmental Protection Agency, nor does the mention of trade Environmental Protection Agency, nor does the mention of trade names or commercial products constitute their endorsement or names or commercial products constitute their endorsement or
recommendation for use.recommendation for use.

CIDWT/University DisclaimerCIDWT/University DisclaimerThese materials are the collective effort of individuals from These materials are the collective effort of individuals from
academic, regulatory, and private sectors of the academic, regulatory, and private sectors of the onsite/decentralized wastewater industry. These materials have onsite/decentralized wastewater industry. These materials have
been peerbeen peer--reviewed and represent the current state of reviewed and represent the current state of knowledge/science in this field. They were developed through a knowledge/science in this field. They were developed through a series of writing and review meetings with the goal of formulatiseries of writing and review meetings with the goal of formulating ng a consensus on the materials presented. These materials do not a consensus on the materials presented. These materials do not
necessarily reflect the views and policies of University of necessarily reflect the views and policies of University of Arkansas, and/or the Consortium of Institutes for Decentralized Arkansas, and/or the Consortium of Institutes for Decentralized
Wastewater Treatment (CIDWT). The mention of trade names or Wastewater Treatment (CIDWT). The mention of trade names or commercial products does not constitute an endorsement or commercial products does not constitute an endorsement or
recommendation for use from these individuals or entities, nor recommendation for use from these individuals or entities, nor does it constitute criticism for similar ones not mentioned.does it constitute criticism for similar ones not mentioned.

CitationCitation
Oakley, S. 2005. Onsite Nitrogen Removal Oakley, S. 2005. Onsite Nitrogen Removal --PowerPoint Presentation. PowerPoint Presentation. inin (M.A. Gross and (M.A. Gross and N.E. Deal, eds.) University Curriculum N.E. Deal, eds.) University Curriculum Development for Decentralized Wastewater Development for Decentralized Wastewater Management. National Decentralized Water Management. National Decentralized Water Resources Capacity Development Project. Resources Capacity Development Project. University of Arkansas, Fayetteville, AR.University of Arkansas, Fayetteville, AR.
Chemistry of NitrogenChemistry of Nitrogen
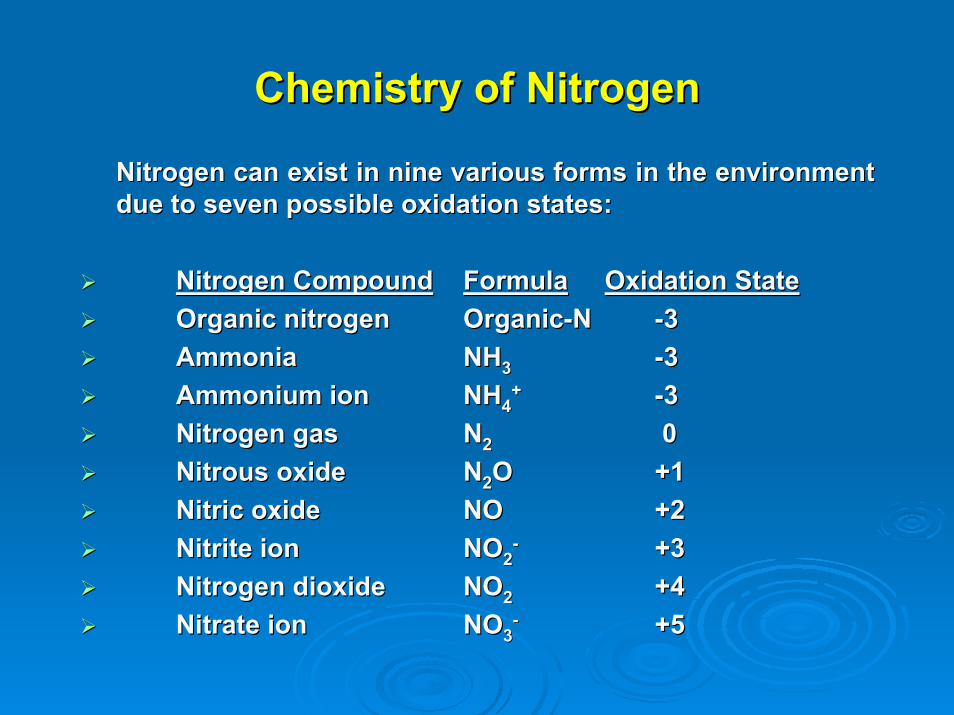
Nitrogen can exist in nine various forms in the environment Nitrogen can exist in nine various forms in the environment due to seven possible oxidation states: due to seven possible oxidation states:
Nitrogen CompoundNitrogen Compound FormulaFormula Oxidation StateOxidation StateOrganic nitrogenOrganic nitrogen OrganicOrganic--NN --33AmmoniaAmmonia NHNH33 --33Ammonium ionAmmonium ion NHNH44
++ --33Nitrogen gasNitrogen gas NN22 00Nitrous oxideNitrous oxide NN22OO +1+1Nitric oxideNitric oxide NONO +2+2Nitrite ionNitrite ion NONO22
-- +3+3Nitrogen dioxideNitrogen dioxide NONO22 +4+4Nitrate ionNitrate ion NONO33
-- +5+5

Chemistry of NitrogenChemistry of Nitrogen
Because of the various oxidation states that can change in the Because of the various oxidation states that can change in the environment, it is customary to express the forms of nitrogen environment, it is customary to express the forms of nitrogen in terms of nitrogen rather than the specific chemical in terms of nitrogen rather than the specific chemical compound: (compound: (egeg., Organic., Organic--N, NHN, NH33--N, NHN, NH44
++--N, NN, N22--N, NON, NO22----N, and N, and
NONO33----N.)N.)
Thus, for example, 10 mg/L of NOThus, for example, 10 mg/L of NO33----N is equivalent to 45 mg/L N is equivalent to 45 mg/L
of NOof NO33-- ion. ion.

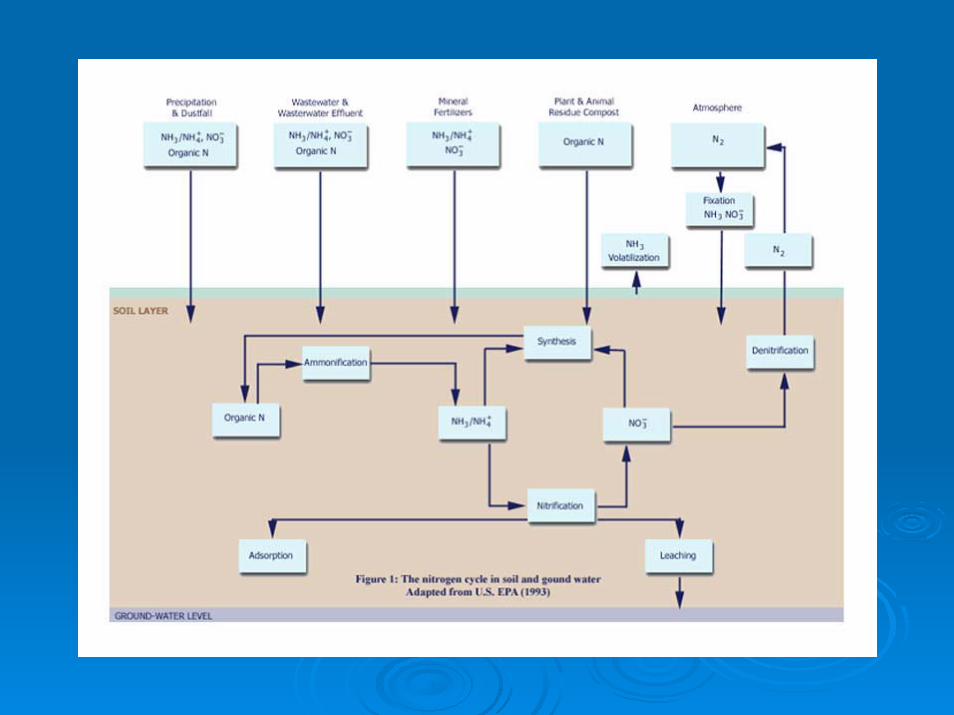
The Nitrogen Cycle in SoilThe Nitrogen Cycle in Soil--Groundwater Groundwater SystemsSystems
As shown in Figure 1, transformation of the principal nitrogen As shown in Figure 1, transformation of the principal nitrogen compounds in soilcompounds in soil--groundwater systems (Organicgroundwater systems (Organic--N, NHN, NH33--N, N, NHNH44
++--N, NN, N22--N, NON, NO22----N, and NON, and NO33
----N) can occur through five key N) can occur through five key mechanisms in the environment:mechanisms in the environment:
FixationFixationAmmonification Ammonification Synthesis Synthesis Nitrification Nitrification DenitrificationDenitrification

Nitrogen FixationNitrogen Fixation
Nitrogen fixation is the conversion of nitrogen gas into nitrogeNitrogen fixation is the conversion of nitrogen gas into nitrogen n compounds that can be assimilated by plants. Biological compounds that can be assimilated by plants. Biological fixation is the most common, but fixation can also occur by fixation is the most common, but fixation can also occur by lightning, and through industrial processes: lightning, and through industrial processes:
Biological:Biological: NN22 →→ OrganicOrganic--NN
Lightning:Lightning: NN22 →→ NONO33--
Industrial:Industrial: NN22 →→ NONO33-- or NHor NH33/ NH/ NH44
++
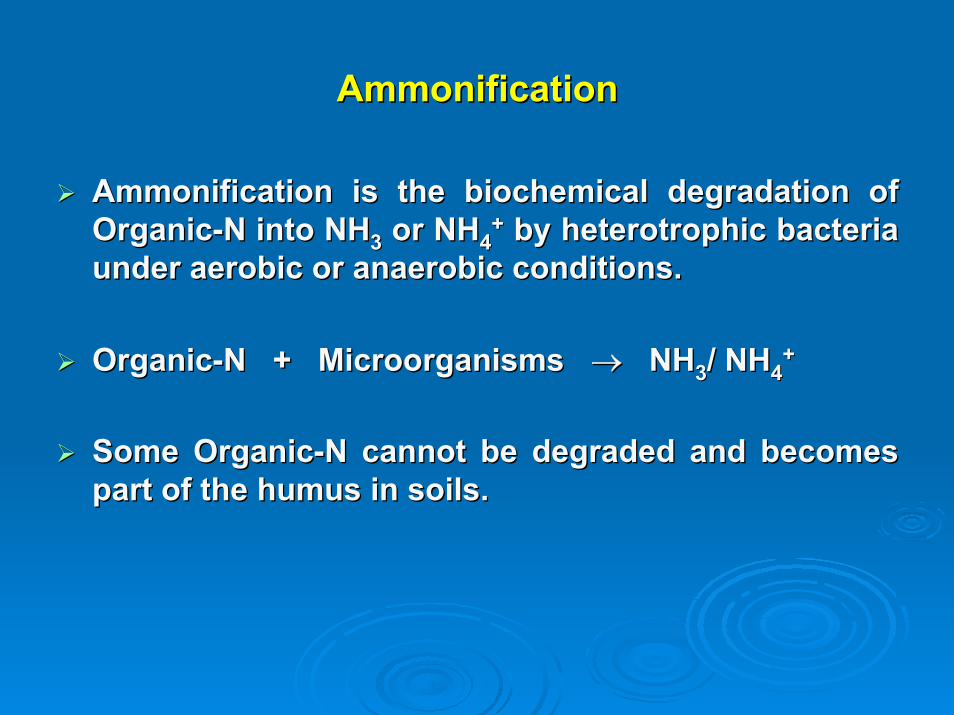
AmmonificationAmmonification
Ammonification is the biochemical degradation of Ammonification is the biochemical degradation of OrganicOrganic--N into NHN into NH33 or NHor NH44
++ by heterotrophic bacteria by heterotrophic bacteria under aerobic or anaerobic conditions.under aerobic or anaerobic conditions.
OrganicOrganic--N + Microorganisms N + Microorganisms →→ NHNH33/ NH/ NH44++
Some OrganicSome Organic--N cannot be degraded and becomes N cannot be degraded and becomes part of the humus in soils.part of the humus in soils.

SynthesisSynthesis
Synthesis is the biochemical mechanism in which Synthesis is the biochemical mechanism in which NHNH44
++--N or NON or NO33----N is converted into plant OrganicN is converted into plant Organic--N:N:
NHNH44++ + CO+ CO22 + green plants + sunlight + green plants + sunlight →→ OrganicOrganic--NN
NONO33-- + CO+ CO22 + green plants + sunlight + green plants + sunlight →→ OrganicOrganic--NN

SynthesisSynthesis
Nitrogen fixation is also a unique form of synthesis that can onNitrogen fixation is also a unique form of synthesis that can only ly be performed by nitrogenbe performed by nitrogen--fixing bacteria and algae:fixing bacteria and algae:
NN--Fixing Fixing Bacteria/AlgaeBacteria/Algae
NN22 →→ OrganicOrganic--NN

NitrificationNitrification
Nitrification is the biological oxidation of NHNitrification is the biological oxidation of NH44++ to NOto NO33
-- through a through a twotwo--step autotrophic process by the bacteria step autotrophic process by the bacteria Nitrosomonas Nitrosomonas and and NitrobacterNitrobacter::
NitrosomonasNitrosomonasStep 1:Step 1: NHNH44
++ + 3/2O+ 3/2O22 →→ NONO22---- + 2H+ 2H+ + + H+ H22OO
NitrobacterNitrobacterStep 2:Step 2: NONO22
-- + 1/2O+ 1/2O22 →→ NONO33--

NitrificationNitrification
The twoThe two--step reactions are usually very rapid and hence it is step reactions are usually very rapid and hence it is rare to find nitrite levels higher than 1.0 mg/L in water. rare to find nitrite levels higher than 1.0 mg/L in water.
The nitrate formed by nitrification is, in the nitrogen cycle, uThe nitrate formed by nitrification is, in the nitrogen cycle, used sed by plants as a nitrogen source (synthesis) or reduced to Nby plants as a nitrogen source (synthesis) or reduced to N22 gas gas through the process of denitrification. through the process of denitrification.
Nitrate can, however, contaminate groundwater if it is not used Nitrate can, however, contaminate groundwater if it is not used for synthesis or reduced through denitrification as shown in for synthesis or reduced through denitrification as shown in Figure 1. Figure 1.
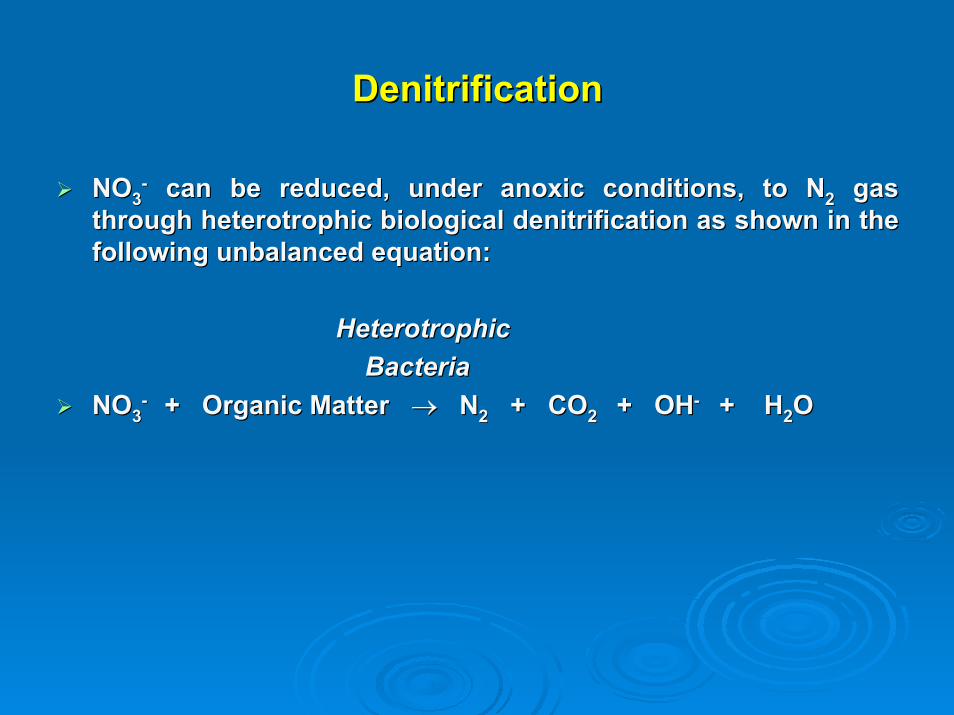
DenitrificationDenitrification
NONO33-- can be reduced, under anoxic conditions, to Ncan be reduced, under anoxic conditions, to N22 gas gas
through heterotrophic biological denitrification as shown in thethrough heterotrophic biological denitrification as shown in thefollowing unbalanced equation:following unbalanced equation:
HeterotrophicHeterotrophicBacteriaBacteria
NONO33-- + Organic Matter + Organic Matter →→ NN22 + CO+ CO2 2 + OH+ OH-- + H+ H22OO

DenitrificationDenitrification
The denitrification equation is identical to the equation for thThe denitrification equation is identical to the equation for the e biological oxidation of organic matter with the exception that biological oxidation of organic matter with the exception that NONO33
-- is used as an electron acceptor instead of Ois used as an electron acceptor instead of O22::
HeterotrphicHeterotrphicBacteriaBacteria
OO22 + Organic Matter + Organic Matter →→ COCO22 + OH+ OH-- + H+ H22OO

DenitrificationDenitrification
A large variety of heterotrophic bacteria can use nitrate in A large variety of heterotrophic bacteria can use nitrate in lieu of oxygen for the degradation of organic matter under lieu of oxygen for the degradation of organic matter under anoxic conditions. anoxic conditions.
If OIf O22 is present, however, the bacteria will preferentially is present, however, the bacteria will preferentially select it instead of NOselect it instead of NO33
--. Thus it is very important that anoxic . Thus it is very important that anoxic conditions exist in order that NOconditions exist in order that NO33
-- will be used as the will be used as the electron acceptor. electron acceptor.
A carbon source is required as the electron donor for A carbon source is required as the electron donor for denitrification to occur. denitrification to occur.

DenitrificationDenitrification
Autotrophic denitrification is also possible with either Autotrophic denitrification is also possible with either elemental sulfur or hydrogen gas used as the electron donor by elemental sulfur or hydrogen gas used as the electron donor by autotrophic bacteria as shown in the following unbalanced autotrophic bacteria as shown in the following unbalanced equation: equation:
AutotrophicAutotrophicBacteriaBacteria
NONO33-- + CO+ CO2 2 + Inorganic Electron Donor + Inorganic Electron Donor →→ NN2 2 + Oxidized Electron + Oxidized Electron
(Sulfur or H(Sulfur or H22 gas)gas) DonorDonor

Environmental Effects of Nitrogen DischargesEnvironmental Effects of Nitrogen Discharges
Health Effects from Groundwater Contamination with NitratesHealth Effects from Groundwater Contamination with NitratesMethemoglobinemia Methemoglobinemia CarcinogenesisCarcinogenesisBirth Defects Birth Defects
Surface Water Pollution with NitrogenSurface Water Pollution with NitrogenEutrophicationEutrophicationOxygen Demand through NitrificationOxygen Demand through NitrificationAmmonia Toxicity to Aquatic OrganismsAmmonia Toxicity to Aquatic Organisms
Sources of Nitrogen Discharges to Sources of Nitrogen Discharges to GroundwaterGroundwater
Agricultural Activities:Agricultural Activities:
A significant source of nitrate in groundwater. A significant source of nitrate in groundwater.
Nitrate can enter groundwater at elevated levels by: Nitrate can enter groundwater at elevated levels by: Excessive or inappropriate use of nitrogenExcessive or inappropriate use of nitrogen--based nutrient based nutrient sources:sources:
Commercial fertilizersCommercial fertilizersAnimal manuresAnimal manuresTypes of crops utilized Types of crops utilized
Crop irrigation that leads to nitrate leaching Crop irrigation that leads to nitrate leaching Inappropriate livestock manure storageInappropriate livestock manure storage
Sources of Nitrogen Discharges to Sources of Nitrogen Discharges to GroundwaterGroundwater
Septic TankSeptic Tank--Soil Absorption Systems:Soil Absorption Systems:
Contamination of groundwater with nitrates from septic tankContamination of groundwater with nitrates from septic tank--soil absorption systems is a problem in many parts of the US. soil absorption systems is a problem in many parts of the US.
The buildThe build--up of nitrate in groundwater is one of the most up of nitrate in groundwater is one of the most significant longsignificant long--term consequences of onsite wastewater term consequences of onsite wastewater disposal. disposal.
As an example, the annual nitrogen contribution for a family of As an example, the annual nitrogen contribution for a family of four from a septicfour from a septic--tank soil absorption system on a quarter tank soil absorption system on a quarter acre lot could be as high as 50 lbs. per year. acre lot could be as high as 50 lbs. per year.

Sources of Nitrogen Discharges to Sources of Nitrogen Discharges to GroundwaterGroundwater
Septic TankSeptic Tank--Soil Absorption Systems:Soil Absorption Systems:The annual nitrogen requirement for a quarter acre of Bermuda The annual nitrogen requirement for a quarter acre of Bermuda grass is also about 50 lbs. per year, which could also be close grass is also about 50 lbs. per year, which could also be close to the annual nitrogen production of a family of four. to the annual nitrogen production of a family of four.
The nitrogen from the septic tankThe nitrogen from the septic tank--soil absorption system, soil absorption system, however, is not uniformly distributed throughout a lawn and is however, is not uniformly distributed throughout a lawn and is typically discharged at a depth below which plants can utilize itypically discharged at a depth below which plants can utilize it. t.
Nitrogen exists as OrganicNitrogen exists as Organic--N and NHN and NH33--N/NHN/NH44++--N in septic tank N in septic tank
effluent, and is usually transformed into nitrate as the effluent, and is usually transformed into nitrate as the wastewater percolates through the soil column. Also, the wastewater percolates through the soil column. Also, the nitrogen loading from high housing densities can greatly nitrogen loading from high housing densities can greatly exceed any potential plant uptake of nitrogen even if the exceed any potential plant uptake of nitrogen even if the effluent was uniformly distributed for plant uptake.effluent was uniformly distributed for plant uptake.

Control of Nitrogen Discharges from Onsite Control of Nitrogen Discharges from Onsite SystemsSystems
Public health and water pollution control agencies have tried toPublic health and water pollution control agencies have tried tolimit the number of onsite systems in a given area by:limit the number of onsite systems in a given area by:
Quantifying nitrogen loadingsQuantifying nitrogen loadings
Examining alternative onsite technologies that provide Examining alternative onsite technologies that provide nitrogen removalnitrogen removal

Quantifying Nitrogen Loading RatesQuantifying Nitrogen Loading Rates
HantzscheHantzsche--Finnemore Mass Balance Equation: Finnemore Mass Balance Equation:
The HantzscheThe Hantzsche--Finnemore Equation estimates nitrate loadings Finnemore Equation estimates nitrate loadings to groundwater based upon the measured factors of rainfall, to groundwater based upon the measured factors of rainfall, aquifer recharge, septic system nitrogen loadings, and aquifer recharge, septic system nitrogen loadings, and denitrification. denitrification.

Quantifying Nitrogen Loading RatesQuantifying Nitrogen Loading Rates
HantzscheHantzsche--Finnemore Mass Balance Equation: Finnemore Mass Balance Equation:
nnrr = = II··nnww··(1(1--d) + d) + RR··nnbb(I + R)(I + R)
nnrr = = NONO33--
--N concentration in groundwater, mg/LN concentration in groundwater, mg/LII == volume of wastewater entering the soil averaged volume of wastewater entering the soil averaged
over the gross developed area, in/yrover the gross developed area, in/yrnnww == TotalTotal--N concentration of wastewater, mg/LN concentration of wastewater, mg/Ldd == fraction of NOfraction of NO33
----N lost to denitrificationN lost to denitrification
RR == average recharge rate of rainfall, in/yraverage recharge rate of rainfall, in/yrnnbb == background NObackground NO33
----N concentration, mg/LN concentration, mg/L

Quantifying Nitrogen Loading RatesQuantifying Nitrogen Loading Rates
HantzscheHantzsche--Finnemore Mass Balance Equation:Finnemore Mass Balance Equation:
The number of gross acres per dwelling unit to ensure that The number of gross acres per dwelling unit to ensure that groundwater NOgroundwater NO33--N will not exceed 10 mg/L can be calculated N will not exceed 10 mg/L can be calculated from the following equation:from the following equation:
A = A = 0.01344W[n0.01344W[nww –– dd··nnww –– 10]10]R(10 R(10 -- nnbb) )
AA = gross acres/dwelling unit = gross acres/dwelling unit WW = average daily wastewater flow per dwelling unit, = average daily wastewater flow per dwelling unit,
gallonsgallons

Nitrogen Dynamics in Septic TankNitrogen Dynamics in Septic Tank--Soil Absorption SystemsSoil Absorption Systems
Wastewater Characteristics:Wastewater Characteristics:
The mass loading of nitrogen in domestic wastewater averages The mass loading of nitrogen in domestic wastewater averages from 4 to 18 lbs. of Totalfrom 4 to 18 lbs. of Total--N per capita per year. N per capita per year.
Untreated domestic wastewater typically contains 20 to 85 mg/L Untreated domestic wastewater typically contains 20 to 85 mg/L TotalTotal--N, with the majority occurring as a mixture of NHN, with the majority occurring as a mixture of NH33--N/NHN/NH44
++--N (12N (12--50 mg/L) and Organic50 mg/L) and Organic--N (8N (8--35 mg/L) 35 mg/L)

Nitrogen Dynamics in Septic TankNitrogen Dynamics in Septic Tank--Soil Absorption SystemsSoil Absorption Systems
Because the carbon to nitrogen ratio of wastewater is typically Because the carbon to nitrogen ratio of wastewater is typically on the order of 4:1 to 6:1, there will be excess nitrogen after on the order of 4:1 to 6:1, there will be excess nitrogen after secondary biological treatment (BOD removal) that cannot be secondary biological treatment (BOD removal) that cannot be assimilated by microorganisms as shown in the following assimilated by microorganisms as shown in the following unbalanced equation:unbalanced equation:
bacteriabacteriaCOHNS + OCOHNS + O22 + Nutrients + Nutrients →→ COCO22 + NH+ NH44
++ + C+ C55HH77NONO22 + end products+ end productsOrganic Organic new bacterialnew bacterial
MatterMatter cellscells

Nitrogen Dynamics in Septic TankNitrogen Dynamics in Septic Tank--Soil Absorption SystemsSoil Absorption Systems
Septic Tanks:Septic Tanks:
The removal of TotalThe removal of Total--N within septic tanks is on the order of 10 N within septic tanks is on the order of 10 to 30%, with the majority being removed as particulate matter to 30%, with the majority being removed as particulate matter through sedimentation or flotation processes. through sedimentation or flotation processes.
Because of the septic tank's anaerobic environment, nitrogen Because of the septic tank's anaerobic environment, nitrogen exists principally as Organicexists principally as Organic--N and NHN and NH33--N/NHN/NH44
++--N (TKN).N (TKN).
Nitrogen Dynamics in Septic TankNitrogen Dynamics in Septic Tank--Soil Absorption SystemsSoil Absorption Systems
Subsurface Absorption Trenches:Subsurface Absorption Trenches:
Nitrogen can undergo several transformations within and below Nitrogen can undergo several transformations within and below subsurface absorption trenches:subsurface absorption trenches:
Adsorption of NHAdsorption of NH44++--N in the soil N in the soil
Volatilization of NHVolatilization of NH33--N in alkaline soils at a pH above 8.0 N in alkaline soils at a pH above 8.0 Nitrification and subsequent movement of NONitrification and subsequent movement of NO33
-- --N towards the N towards the groundwater groundwater Biological uptake of both NHBiological uptake of both NH33
--N/NHN/NH44++--N and NON and NO33
-- --N N Denitrification if the environmental conditions are appropriate Denitrification if the environmental conditions are appropriate

Treatment Processes for Treatment Processes for Onsite Nitrogen RemovalOnsite Nitrogen Removal
Sequential Nitrification/Denitrification Processes (Figure 2):Sequential Nitrification/Denitrification Processes (Figure 2):
Sequential nitrification/denitrification processes form the basiSequential nitrification/denitrification processes form the basis s of all biological nitrogen removal technologies that have been of all biological nitrogen removal technologies that have been used or proposed for onsite wastewater treatment. used or proposed for onsite wastewater treatment.
Aerobic processes are first used to remove BOD and nitrify Aerobic processes are first used to remove BOD and nitrify organic and NHorganic and NH44
++--N.N.
Anoxic processes are then used to reduce NOAnoxic processes are then used to reduce NO33--
--N to NN to N22 gas, gas, either using the wastewater as a carbon source or an external either using the wastewater as a carbon source or an external carbon source. carbon source.


Treatment Processes for Treatment Processes for Onsite Nitrogen RemovalOnsite Nitrogen Removal
Classification of Biological Nitrogen Removal Systems:Classification of Biological Nitrogen Removal Systems:
Table 1 gives a summary of onsite nitrogen removal systems Table 1 gives a summary of onsite nitrogen removal systems that have been reported in the literature.that have been reported in the literature.
Using the terminology of wastewater engineering, the systems Using the terminology of wastewater engineering, the systems outlined in Table 1 are categorized according to whether they outlined in Table 1 are categorized according to whether they are suspended growth or attachedare suspended growth or attached--growth processes. growth processes.
SuspendedSuspended--growth processes are biological treatment processes in which growth processes are biological treatment processes in which the microorganisms responsible for treatment are maintained in the microorganisms responsible for treatment are maintained in suspension within the liquid, usually through mechanical or diffsuspension within the liquid, usually through mechanical or diffusedused--air air aeration. aeration.
AttachedAttached--growth processes are those in which the microorganisms growth processes are those in which the microorganisms responsible for treatment are attached to an inert medium such aresponsible for treatment are attached to an inert medium such as sand or s sand or plastic trickling filter media. plastic trickling filter media.

Treatment Processes for Treatment Processes for Onsite Nitrogen RemovalOnsite Nitrogen Removal
Table 1Table 1Examples of Onsite Biological Nitrogen Removal from the LiteratuExamples of Onsite Biological Nitrogen Removal from the Literaturere
TotalTotal--N Removal Effluent TotalN Removal Effluent Total--NNTechnology Examples Technology Examples Efficiency, % Efficiency, % mg/Lmg/L
Suspended Growth:Suspended Growth:Aerobic units w/pulse aerationAerobic units w/pulse aeration 2525--6161 3737--6060Sequencing batch reactorSequencing batch reactor 6060 15.515.5
Attached Growth:Attached Growth:Single Pass Sand Filters (SPSF)Single Pass Sand Filters (SPSF) 88--5050 3030--6565Recirculating Sand/Gravel Filters (RSF)Recirculating Sand/Gravel Filters (RSF) 1515--8484 1010--4747MultiMulti--Pass Textile FiltersPass Textile Filters 1414--3131 1414--1717RSF w/Anoxic FilterRSF w/Anoxic Filter 4040--9090 77--2323RSF w/Anoxic Filter w/External Carbon SourceRSF w/Anoxic Filter w/External Carbon Source 7474--8080 1010--1313RUCK SystemRUCK System 2929--5454 1818--5353

Biological NitrificationBiological Nitrification
Process Chemistry:Process Chemistry:
Nitrification is a twoNitrification is a two--step autotrophic process (nitrifiers use step autotrophic process (nitrifiers use COCO22 instead of organic carbon as their carbon source for cell instead of organic carbon as their carbon source for cell synthesis) for the conversion of NHsynthesis) for the conversion of NH44
++ to NOto NO33----N. During this N. During this
energy yielding reaction some of the NHenergy yielding reaction some of the NH44++ is synthesized into is synthesized into
cell tissue giving the following overall oxidation and synthesiscell tissue giving the following overall oxidation and synthesisreaction:reaction:
AutotrophicAutotrophic1.00NH1.00NH44
++ + 1.89O+ 1.89O2 2 + 0.08CO+ 0.08CO22 →→ 0.98NO0.98NO33-- ++ 0.016C0.016C55HH77OO22N + 0.95HN + 0.95H22O + 1.98HO + 1.98H++
Bacteria new bacterial cellsBacteria new bacterial cells
Biological NitrificationBiological Nitrification
Process Chemistry:Process Chemistry:
The previous balanced equation shows that:The previous balanced equation shows that:For each mole of NHFor each mole of NH44
++ oxidized, 1.89 moles of oxygen are required and oxidized, 1.89 moles of oxygen are required and 1.98 moles of hydrogen ions will be produced. 1.98 moles of hydrogen ions will be produced.
In mass terms, 4.32 mg of OIn mass terms, 4.32 mg of O22 are required for each mg of NHare required for each mg of NH44++--NN
oxidized, with the subsequent loss of 7.1 mg of alkalinity as Caoxidized, with the subsequent loss of 7.1 mg of alkalinity as CaCOCO33 in in the wastewater, and the synthesis of 0.1 mg of new bacterial celthe wastewater, and the synthesis of 0.1 mg of new bacterial cells. ls.
Sources: Sources: US EPA, Manual: US EPA, Manual: NitrogenNitrogen Control, EPA/625/RControl, EPA/625/R--93/010, Office 93/010, Office ofofWaterWater, Washington, , Washington, D.CD.C., ., SeptemberSeptember, 1993, 1993, p.88., p.88.MetcalfMetcalf & & EddyEddy, , WastewaterWastewater EngineeringEngineering: : TreatmentTreatment, , DisposalDisposal, , andand ReuseReuse,, 3rd. 3rd. EditionEdition, , McGrawMcGraw--Hill, Hill, NewNew YorkYork, 1991, 1991, p.696., p.696.
Biological NitrificationBiological Nitrification
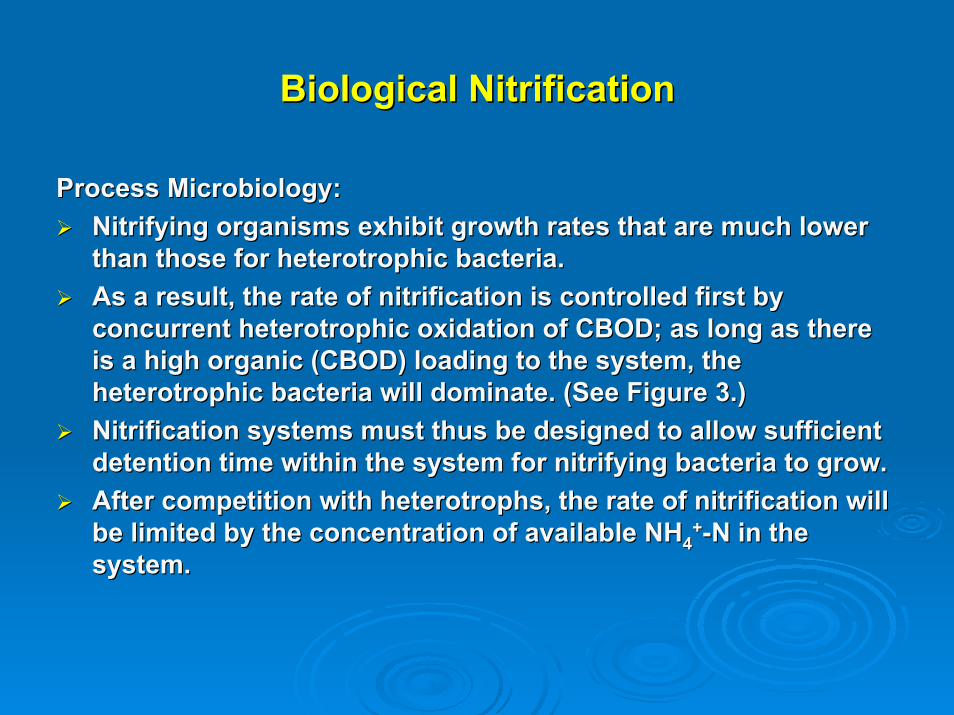
Process Microbiology:Process Microbiology:Nitrifying organisms exhibit growth rates that are much lower Nitrifying organisms exhibit growth rates that are much lower than those for heterotrophic bacteria. than those for heterotrophic bacteria. As a result, the rate of nitrification is controlled first by As a result, the rate of nitrification is controlled first by concurrent heterotrophic oxidation of CBOD; as long as there concurrent heterotrophic oxidation of CBOD; as long as there is a high organic (CBOD) loading to the system, the is a high organic (CBOD) loading to the system, the heterotrophic bacteria will dominate. (See Figure 3.)heterotrophic bacteria will dominate. (See Figure 3.)Nitrification systems must thus be designed to allow sufficient Nitrification systems must thus be designed to allow sufficient detention time within the system for nitrifying bacteria to growdetention time within the system for nitrifying bacteria to grow. . After competition with After competition with heterotrophsheterotrophs, the rate of nitrification will , the rate of nitrification will be limited by the concentration of available NHbe limited by the concentration of available NH44
++--N in the N in the system. system.


Biological NitrificationBiological Nitrification
Process Microbiology:Process Microbiology:
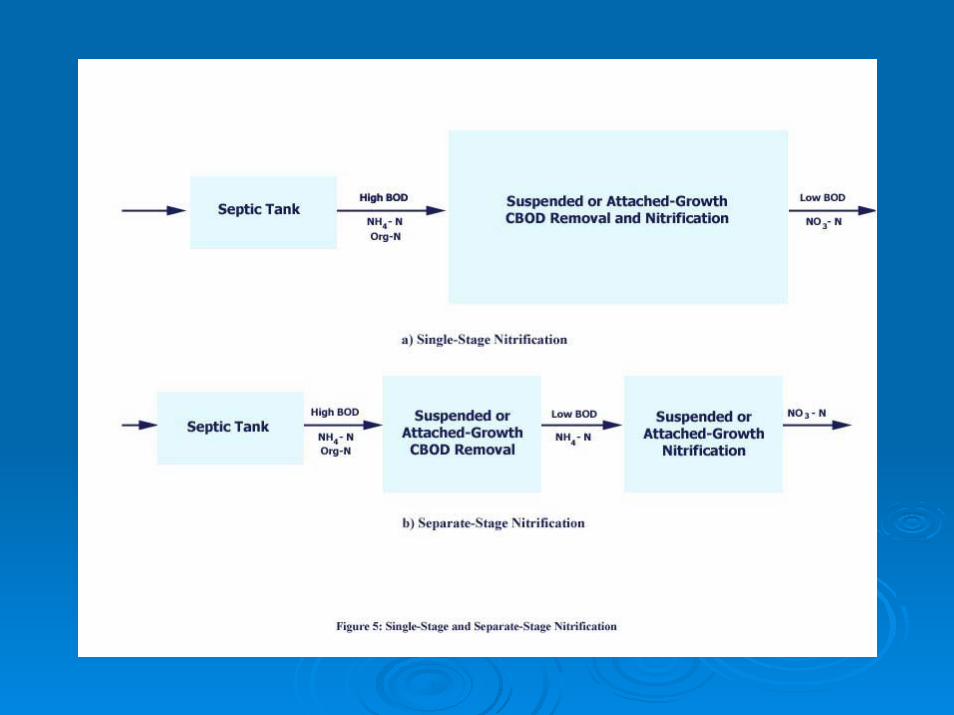
Figure 4 shows the relationship between fraction of nitrifying Figure 4 shows the relationship between fraction of nitrifying organisms in suspendedorganisms in suspended--growth wastewater treatment growth wastewater treatment (activated sludge) and the BOD(activated sludge) and the BOD55/TKN ratio. /TKN ratio.
At low BODAt low BOD55/TKN ratios (0.5 to 3) the population of nitrifying /TKN ratios (0.5 to 3) the population of nitrifying bacteria is high and nitrification should not be influenced by bacteria is high and nitrification should not be influenced by heterotrophic oxidation of CBOD; this type of nitrification heterotrophic oxidation of CBOD; this type of nitrification process is termed separateprocess is termed separate--stage nitrification. At higher stage nitrification. At higher BODBOD55/TKN ratios, the fraction of nitrifying organisms in the /TKN ratios, the fraction of nitrifying organisms in the system is much lower due to heterotrophic competition from system is much lower due to heterotrophic competition from oxidation of CBOD; this process is termed singleoxidation of CBOD; this process is termed single--stage stage nitrification. Examples of singlenitrification. Examples of single--stage and separatestage and separate--stage stage nitrification are shown in Figure 5. nitrification are shown in Figure 5.


Biological NitrificationBiological Nitrification
Dissolved Oxygen Requirements and Organic Loading Rates:Dissolved Oxygen Requirements and Organic Loading Rates:
Suspended Growth SystemsSuspended Growth Systems
The concentration of DO has a significant effect on nitrificatioThe concentration of DO has a significant effect on nitrification in n in wastewater treatment. wastewater treatment.
Although much research has been performed, practical experience Although much research has been performed, practical experience has shown that DO levels must be maintained at approximately 2.0has shown that DO levels must be maintained at approximately 2.0mg/L in suspendedmg/L in suspended--growth (aerobic) systems, especially when growth (aerobic) systems, especially when NHNH44
++--N loadings are expected to fluctuate widely; this is likely to N loadings are expected to fluctuate widely; this is likely to be the case in domestic onsite wastewater systems. be the case in domestic onsite wastewater systems.

Biological NitrificationBiological Nitrification
Dissolved Oxygen Requirements and Organic Loading Rates:Dissolved Oxygen Requirements and Organic Loading Rates:
AttachedAttached--Growth Systems. Growth Systems. DO levels must be maintained at levels that are at least 2.7 timDO levels must be maintained at levels that are at least 2.7 times greater es greater than the NHthan the NH44
++--N concentrations in order to prevent oxygen transfer through N concentrations in order to prevent oxygen transfer through the biofilm from limiting nitrification rates. the biofilm from limiting nitrification rates. This is usually overcome in practice by using lower organic surfThis is usually overcome in practice by using lower organic surface ace loadings than what would be normally applied for CBOD removal toloadings than what would be normally applied for CBOD removal to allow allow for growth of nitrifying organisms; otherwise the heterotrophic for growth of nitrifying organisms; otherwise the heterotrophic organisms organisms will dominate the bacterial film within the attachedwill dominate the bacterial film within the attached--growth media. growth media. For trickling filters, for example, the organic loading rate forFor trickling filters, for example, the organic loading rate for nitrification is nitrification is only about 1/5 to 1/8 of the CBOD loading for CBOD removal. only about 1/5 to 1/8 of the CBOD loading for CBOD removal. Recirculation of effluent through the attached growth media, andRecirculation of effluent through the attached growth media, and use of use of special media, such as trickling filter plastic media with high special media, such as trickling filter plastic media with high specific specific surface areas, are also used to lower organic surface loadings asurface areas, are also used to lower organic surface loadings and to nd to promote high oxygen transfer rates. promote high oxygen transfer rates.

Biological NitrificationBiological Nitrification
Table 2 shows design organic loading rates for various Table 2 shows design organic loading rates for various attachedattached--growth systems to achieve nitrification. growth systems to achieve nitrification. Unfortunately, organic loading rates for onsite attachedUnfortunately, organic loading rates for onsite attached--growth growth systems are not well defined even for CBOD removal, let alone systems are not well defined even for CBOD removal, let alone nitrification.nitrification.The more commonly used hydraulic loading rates show mixed The more commonly used hydraulic loading rates show mixed
results for nitrification as cited in the literature. results for nitrification as cited in the literature. This is no doubt due, at least in part, to varying organic loadiThis is no doubt due, at least in part, to varying organic loading ng rates that were not taken into consideration since the CBODrates that were not taken into consideration since the CBOD55 of of septic tank effluent can vary greatly, ranging from less than 10septic tank effluent can vary greatly, ranging from less than 100 0 to 480 mg/L.to 480 mg/L.

Biological NitrificationBiological Nitrification
Table 2Table 2
Design Loading Rates for Attached Growth Systems to Achieve >85%Design Loading Rates for Attached Growth Systems to Achieve >85% NitrificationNitrification
Hydraulic Loading OrganiHydraulic Loading Organic Loadingc Loading State of KnowledgeState of KnowledgeProcess Rate, gpd/ftProcess Rate, gpd/ft22 Rate, lbs. BOD/ftRate, lbs. BOD/ft22--dayday for Designfor Design
Trickling FiltersTrickling FiltersRock MediaRock Media 3030--900900 0.040.04--0.120.12 Well KnownWell Known
Plastic MediaPlastic Media 288288--17001700 0.100.10--0.250.25 Well KnownWell Known
Sand FiltersSand FiltersSingle PassSingle Pass 0.40.4--1.2 1.2 0.0001350.000135--0.002 0.002 Lesser KnownLesser Known
RecirculatingRecirculating 33--5 5 0.0020.002--0.008 0.008 Lesser KnownLesser Known

Biological NitrificationBiological Nitrification
pH and Alkalinity Effects:pH and Alkalinity Effects:
The optimum pH range for nitrification is 6.5 to 8.0. The optimum pH range for nitrification is 6.5 to 8.0.
Nitrification consumes about 7.1 mg of alkalinity (as CaCONitrification consumes about 7.1 mg of alkalinity (as CaCO33) for ) for every mg of NHevery mg of NH44
++--N oxidized.N oxidized.
In low alkalinity wastewaters there is a risk that nitrificationIn low alkalinity wastewaters there is a risk that nitrification will will lower the pH to inhibitory levels. lower the pH to inhibitory levels.
Biological NitrificationBiological Nitrification
pH and Alkalinity Effects:pH and Alkalinity Effects:
Figures 6 and 7 graphically show the loss of alkalinity with nitFigures 6 and 7 graphically show the loss of alkalinity with nitrification rification for septic tank effluent that percolated through the soil columnfor septic tank effluent that percolated through the soil column and and was measured at a twowas measured at a two--foot depth with suction foot depth with suction lysimeterslysimeters..
In this particular example, the alkalinity decreased from an aveIn this particular example, the alkalinity decreased from an average of rage of approximately 400 mg/L to 100 mg/L as CaCOapproximately 400 mg/L to 100 mg/L as CaCO33 in order to nitrify an in order to nitrify an average of about 40 mg/L organicaverage of about 40 mg/L organic--N and NHN and NH44
++--N. N.
Figure 8 shows the theoretical relationship of the fraction of TFigure 8 shows the theoretical relationship of the fraction of TKN that KN that can be nitrified as a function of initial TKN and alkalinity in can be nitrified as a function of initial TKN and alkalinity in the the wastewater.wastewater.

Figure 6: Alkalinity Concentrations in Septic Tank Effluent and Vadose Zone Receiving Nitrified Effluents
0
100
200
300
400
500
600
700
Jun-96 Jul-96 Aug-96 Sep-96 Oct-96 Nov-96 Dec-96 Jan-97 Feb-97
Date
Alk
alin
ity, m
g/L
as C
alci
um C
arbo
nate S e ptic Tank Efflue nt
Vadose Zone Be ne ath Tre nch

Figure 7: Nitrate Nitrogen Concentrations in Septic Tank Effluent andVadose Zone Receiving Nitrified Effluents
0
10
20
30
40
50
60
70
Jun-96 Jul-96 Aug-96 Sep-96 Oct-96 Nov-96 Dec-96 Jan-97 Feb-97 Mar-97 Apr-97 May-97
Date
Nit
rate
Nit
roge
n C
once
ntra
tion
, mg/
L a
N
Vadose Zone Beneath Trench
Septic Tank Effluent

Figure 8: Nitrification as a Function of Initial TKN and Alkalinity
0.0
0.1
0.2
0.3
0.4
0.5
0.6
0.7
0.8
0.9
1.0
0 10 20 30 40 50 60 70 80 90 100
TKN, mg/L as N
Frac
tion
of T
KN
Nitr
ified
Alkalinity = 100 mg/L as CaCO3
Alkalinity = 200 mg/L as CaCO3
Alkalinity = 300 mg/L as CaCO3
Alkalinity = 400 mg/L as CaCO3

Biological NitrificationBiological Nitrification
Temperature Effects:Temperature Effects:
Temperature has a significant effect on nitrification that must Temperature has a significant effect on nitrification that must be taken into consideration for design. be taken into consideration for design.
In general, colder temperatures require longer cell residence In general, colder temperatures require longer cell residence times in suspendedtimes in suspended--growth systems and lower hydraulic growth systems and lower hydraulic loading rates in attachedloading rates in attached--growth systems due to slower growth growth systems due to slower growth rates of nitrifying bacteria.rates of nitrifying bacteria.
Biological NitrificationBiological Nitrification
Inhibitors:Inhibitors:
Nitrifying bacteria are much more sensitive than heterotrophic Nitrifying bacteria are much more sensitive than heterotrophic bacteria and are susceptible to a wide range of organic and inorbacteria and are susceptible to a wide range of organic and inorganic ganic inhibitors as shown in Table 3. inhibitors as shown in Table 3.
There is a need to establish a methodology for onsite wastewaterThere is a need to establish a methodology for onsite wastewatersystems for assessing the potential for, and occurrence of, systems for assessing the potential for, and occurrence of, nitrification inhibition. nitrification inhibition.
Figure 9 illustrates the effect of an inhibitor on nitrificationFigure 9 illustrates the effect of an inhibitor on nitrification in a septic in a septic tank/recirculating trickling filter system; in this particular ctank/recirculating trickling filter system; in this particular case a carpet ase a carpet cleaning solvent that was flushed down the toilet contaminated tcleaning solvent that was flushed down the toilet contaminated the he septic tank and destroyed the nitrifying bacterial population inseptic tank and destroyed the nitrifying bacterial population in the the attachedattached--growth media. If this system had not been continuously growth media. If this system had not been continuously monitored, the effects of the inhibitor on nitrification would hmonitored, the effects of the inhibitor on nitrification would have ave passed unnoticed.passed unnoticed.

Biological NitrificationBiological Nitrification
Table 3: Examples of Nitrification InhibitorsTable 3: Examples of Nitrification Inhibitors
Inorganic CompoundsInorganic Compounds Organic CompoundsOrganic CompoundsZincZinc CadmiumCadmium AcetoneAcetoneFree CyanideFree Cyanide ArsenicArsenic Carbon DisulfideCarbon DisulfidePerchloratePerchlorate FluorideFluoride ChloroformChloroformCopperCopper LeadLead EthanolEthanolMercuryMercury Free ammoniaFree ammonia PhenolPhenolChromiumChromium Free nitrous acidFree nitrous acid EthylenediamineEthylenediamineNickelNickel Hexamethylene diamineHexamethylene diamineSilverSilver AnilineAnilineCobaltCobalt MonoethanolamineMonoethanolamineThiocyanateThiocyanateSodium cyanideSodium cyanideSodium azideSodium azideHydrazineHydrazineSodium cyanateSodium cyanatePotassium chromatePotassium chromate

Figure 9 Nitrogen Removal in a Septic Tank Recirculating Trickling Filter SystemAfter Oakley, et al. (1996).
0.0
10.0
20.0
30.0
40.0
50.0
60.0
70.0
0 20 40 60 80 100 120 140 160 180 200 220 240 260 280 300 320 340 360
Days in Operation
Nitr
ogen
Con
cent
ratio
n, m
g/L
as N
TKN
NO3-N
A carpet cleaningsolvent was introducedinto the system after120 days in operation.
Nitrification Inhibition

Biological NitrificationBiological Nitrification
Inhibitory Effects:Inhibitory Effects:
Since heterotrophic bacteria are much more resilient than Since heterotrophic bacteria are much more resilient than nitrifying bacteria, and because many of the inhibitory nitrifying bacteria, and because many of the inhibitory compounds are biodegradable organics, inhibitory effects can compounds are biodegradable organics, inhibitory effects can oftentimes be controlled by designing separateoftentimes be controlled by designing separate--stage stage nitrification systems. nitrification systems.
In separateIn separate--stage systems the CBOD is first removed along stage systems the CBOD is first removed along with any biodegradable inhibitory compounds; the nitrifying with any biodegradable inhibitory compounds; the nitrifying organisms, which are in effect protected in the second stage, organisms, which are in effect protected in the second stage, are then used to nitrify the loware then used to nitrify the low--CBOD, highCBOD, high--NHNH44
++--N effluent. N effluent.

Biological DenitrificationBiological Denitrification
Process Description:Process Description:Denitrification is a biological process that uses NODenitrification is a biological process that uses NO33
-- as the as the electron acceptor instead of Oelectron acceptor instead of O22 to oxidize organic matter to oxidize organic matter (heterotrophic denitrification) or inorganic matter such as (heterotrophic denitrification) or inorganic matter such as sulfur or hydrogen (autotrophic denitrification) under anoxic sulfur or hydrogen (autotrophic denitrification) under anoxic conditions.conditions.In the process NOIn the process NO33
-- is reduced to Nis reduced to N22 gas. gas. Because the principal biochemical pathway is a modification of Because the principal biochemical pathway is a modification of aerobic pathways (aerobic pathways (ieie., NO., NO33
-- is used as the electron acceptor is used as the electron acceptor instead of Oinstead of O22), the denitrification process is said to occur under ), the denitrification process is said to occur under anoxic conditions as opposed to anaerobic conditions (where anoxic conditions as opposed to anaerobic conditions (where obligate anaerobic organisms would be present). Denitrifying obligate anaerobic organisms would be present). Denitrifying bacteria, whether heterotrophic or autotrophic, are facultative bacteria, whether heterotrophic or autotrophic, are facultative aerobes and can shift between oxygen respiration and nitrate aerobes and can shift between oxygen respiration and nitrate respiration. respiration.

Biological DenitrificationBiological Denitrification
Process Description:Process Description:
For heterotrophic denitrification, the carbon source can come For heterotrophic denitrification, the carbon source can come from the original wastewater, bacterial cell material, or an from the original wastewater, bacterial cell material, or an external source such as methanol or acetate. external source such as methanol or acetate.
For autotrophic denitrification, which is common in water For autotrophic denitrification, which is common in water treatment but not wastewater treatment, the electron donor can treatment but not wastewater treatment, the electron donor can come from elemental sulfur or hydrogen gas. come from elemental sulfur or hydrogen gas.
The possible process configurations for heterotrophic The possible process configurations for heterotrophic denitrification are shown in Figure 10.denitrification are shown in Figure 10.


Biological DenitrificationBiological Denitrification
Heterotrophic Denitrification: Wastewater as the Carbon SourceHeterotrophic Denitrification: Wastewater as the Carbon Source
The following unbalanced equation illustrates the process The following unbalanced equation illustrates the process when wastewater or bacterial cell material is used as the when wastewater or bacterial cell material is used as the carbon source:carbon source:
HeterotrophicHeterotrophicaCOHNSaCOHNS + bNO+ bNO33
-- →→ cNcN22 + dCO+ dCO22 + eC+ eC55HH77OO22N + f OHN + f OH-- + gH+ gH22O + end productsO + end productsorganic Bacteria organic Bacteria bacterialbacterialmattermatter cellscells
Biological DenitrificationBiological Denitrification
Heterotrophic Denitrification: Wastewater as the Carbon SourceHeterotrophic Denitrification: Wastewater as the Carbon Source
The reduction of 1 mg of NOThe reduction of 1 mg of NO33-- is equivalent to 2.86 mg of Ois equivalent to 2.86 mg of O22..
Thus, for example, a wastewater with an ultimate BOD (BODThus, for example, a wastewater with an ultimate BOD (BODLL) ) of 200 mg/L could potentially reduce almost 70 mg/L of NOof 200 mg/L could potentially reduce almost 70 mg/L of NO33
----N N if the wastewater were used as the carbon source. if the wastewater were used as the carbon source.
This does not happen in practice, however, because a portion This does not happen in practice, however, because a portion of the organic carbon in the wastewater must be used for cell of the organic carbon in the wastewater must be used for cell synthesis and not nitrate reduction. synthesis and not nitrate reduction.

Biological DenitrificationBiological Denitrification
Heterotrophic Denitrification: Wastewater as the Carbon SourceHeterotrophic Denitrification: Wastewater as the Carbon Source
For complex organic matter such as wastewater, the For complex organic matter such as wastewater, the stoichiometric equivalency can range from 3.46stoichiometric equivalency can range from 3.46--5.07 mg 5.07 mg BODBODLL/mg NO/mg NO33
-- --N, with 4.0 mg BODN, with 4.0 mg BODLL/ mg NO/ mg NO33--
--N used as a rule N used as a rule of thumb. of thumb.
In terms of BODIn terms of BOD55, this amounts to 2.72 mg BOD, this amounts to 2.72 mg BOD55/ mg NO/ mg NO33-- --N for N for
k k (base e) = 0.23 d(base e) = 0.23 d--11..

Biological DenitrificationBiological Denitrification
Heterotrophic Denitrification: Wastewater as the Carbon SourceHeterotrophic Denitrification: Wastewater as the Carbon Source
Figure 11, which assumes the "rule of thumb" stoichiometric Figure 11, which assumes the "rule of thumb" stoichiometric equivalency of 4.0 mg BODequivalency of 4.0 mg BODLL/mg NO/mg NO33
-- N (2.72 mg BODN (2.72 mg BOD55/mg NO/mg NO33--
N), shows total nitrogen removal as a function of initial TKN N), shows total nitrogen removal as a function of initial TKN and wastewater BODand wastewater BOD55. .
In this figure it is assumed there is sufficient alkalinity for In this figure it is assumed there is sufficient alkalinity for nitrification, and that nitrification, and that kk = 0.23 d= 0.23 d--11. It is obvious from Figure 11 . It is obvious from Figure 11 that nitrogen removal by denitrification using wastewater as thethat nitrogen removal by denitrification using wastewater as thecarbon source is highly feasible for an initial TKN of 40 mg/L ocarbon source is highly feasible for an initial TKN of 40 mg/L or r less, but becomes more problematic as the initial TKN less, but becomes more problematic as the initial TKN increases in relation to BODincreases in relation to BOD55. .

Figure 11: Nitrogen Removal as a Function of Initial TKN and Wastewater BOD5 When Wastewater is Used as Carbon Source.
0
10
20
30
40
50
60
70
80
90
100
0 50 100 150 200 250
Wastewater BOD5, mg/L
Effl
uent
TN
, mg/
L a
s N
TKN = 20 mg/L
TKN = 40 mg/L
TKN = 60 mg/L
TKN = 80 mg/L
TKN = 100 mg/L
(It is assumed there is sufficient alkalinity, the initial TKN is nitrified, and that the stoichiometric equivalency is 4.0 mg BODL/ mg
NO3--N = 2.72 mg BOD5/mg NO3
--N for k = 0.23 d-1.)
Biological DenitrificationBiological Denitrification
Heterotrophic Denitrification: External Carbon SourceHeterotrophic Denitrification: External Carbon Source
Where there is insufficient CBOD left in the wastewater to serveWhere there is insufficient CBOD left in the wastewater to serveas an electron donor for denitrification, an external carbon as an electron donor for denitrification, an external carbon source must be supplied. source must be supplied.
Although there are many possibilities, methanol and acetate Although there are many possibilities, methanol and acetate have been studied the most and their stoichiometry is well have been studied the most and their stoichiometry is well known. known.

Biological DenitrificationBiological Denitrification
Heterotrophic Denitrification: External Carbon SourceHeterotrophic Denitrification: External Carbon Source
Methanol:Methanol:Heterotrophic Heterotrophic
NONO33-- + 1.08CH+ 1.08CH33OH + 0.24HOH + 0.24H22COCO33 →→ 0.47N0.47N22 + + 0.056C0.056C55HH77OO22N + HCON + HCO33
-- + 1.68H+ 1.68H22OOmethanol Bacteria methanol Bacteria bacterial cellsbacterial cells
Acetate:Acetate:
Heterotrophic Heterotrophic NONO33
-- + 0.87CH+ 0.87CH33COOCOO-- + H+ H++ →→ 0.46N0.46N22 + + 0.08C0.08C55HH77OO22N + 0.87HCON + 0.87HCO33-- + H+ H22O + 0.44COO + 0.44CO22
acetate Bacteria bacacetate Bacteria bacterial cellsterial cells

Biological DenitrificationBiological Denitrification
Heterotrophic Denitrification: Process MicrobiologyHeterotrophic Denitrification: Process Microbiology
The heterotrophic denitrifying bacteria are facultative The heterotrophic denitrifying bacteria are facultative aerobes that can use either oxygen or nitrate (under anoxic aerobes that can use either oxygen or nitrate (under anoxic conditions) as an electron acceptor for the oxidation of conditions) as an electron acceptor for the oxidation of organic matter. organic matter.
Denitrifiers are commonly found in nature and are Denitrifiers are commonly found in nature and are ubiquitous in wastewater. ubiquitous in wastewater.
Generally, denitrification processes perform similarly to Generally, denitrification processes perform similarly to aerobic processes designed for CBOD removal.aerobic processes designed for CBOD removal.

Biological DenitrificationBiological Denitrification
Heterotrophic Denitrification: Process MicrobiologyHeterotrophic Denitrification: Process Microbiology
When an adequate carbon source is available, the principal When an adequate carbon source is available, the principal problem associated with denitrification is the achievement of problem associated with denitrification is the achievement of anoxic conditions. anoxic conditions. The dissolved oxygen concentration controls whether or not The dissolved oxygen concentration controls whether or not the denitrifying bacteria use NOthe denitrifying bacteria use NO33
-- or Oor O22 as the electron as the electron acceptor. acceptor. Dissolved oxygen must not be present above certain maximum Dissolved oxygen must not be present above certain maximum levels or the denitrifying bacteria will preferentially use it flevels or the denitrifying bacteria will preferentially use it for or oxidation of organic matter rather than NOoxidation of organic matter rather than NO33
--. . As a result, the design of anoxic zones is one of the most As a result, the design of anoxic zones is one of the most important factors in denitrification processes.important factors in denitrification processes.

Biological DenitrificationBiological Denitrification
Heterotrophic Denitrification: pH and Alkalinity EffectsHeterotrophic Denitrification: pH and Alkalinity Effects
Theoretically, 3.57 mg of alkalinity as CaCOTheoretically, 3.57 mg of alkalinity as CaCO33 is produced for is produced for each mg of NOeach mg of NO33
----N reduced to NN reduced to N22 gas when the wastewater is gas when the wastewater is used as the carbon source. used as the carbon source.
Thus denitrification can recover approximately half of the Thus denitrification can recover approximately half of the alkalinity lost in nitrification and can help overcome pH drops alkalinity lost in nitrification and can help overcome pH drops in low alkalinity waters. Because denitrifying organisms are in low alkalinity waters. Because denitrifying organisms are heterotrophic, they normally will be affected by pH changes in heterotrophic, they normally will be affected by pH changes in the same way heterotrophic bacteria are affected.the same way heterotrophic bacteria are affected.

Biological DenitrificationBiological Denitrification
Heterotrophic Denitrification: Temperature EffectsHeterotrophic Denitrification: Temperature Effects
The data from the literature suggest that denitrification rates The data from the literature suggest that denitrification rates can be significantly affected by temperature drops below 20 can be significantly affected by temperature drops below 20 °°C, C, with the denitrification rate at 10 with the denitrification rate at 10 °°C ranging from 20% to 40% of C ranging from 20% to 40% of the rate at 20the rate at 20°°C. C.
It can be expected that this decrease is similar to that It can be expected that this decrease is similar to that encountered for heterotrophic organisms removing CBOD and encountered for heterotrophic organisms removing CBOD and should be taken into consideration for designs in cold climatesshould be taken into consideration for designs in cold climates

Biological DenitrificationBiological Denitrification
Heterotrophic Denitrification: Inhibitory EffectsHeterotrophic Denitrification: Inhibitory Effects
In general, denitrifiers are much more resilient than nitrifyingIn general, denitrifiers are much more resilient than nitrifyingorganisms. organisms.
Denitrifiers most likely exhibit the same characteristics as Denitrifiers most likely exhibit the same characteristics as heterotrophic bacteria for CBOD removal to inhibitory heterotrophic bacteria for CBOD removal to inhibitory compounds.compounds.

Biological DenitrificationBiological Denitrification
Autotrophic Denitrification:Autotrophic Denitrification:It is also theoretically possible to denitrify wastewaters usingIt is also theoretically possible to denitrify wastewaters usingautotrophic bacteria and elemental sulfur or Hautotrophic bacteria and elemental sulfur or H2 2 gas as the gas as the electron donor instead of carbon. electron donor instead of carbon.
Sulfur as Electron Donor:Sulfur as Electron Donor:AutotrophicAutotrophic
NONO33-- + 0.11CO+ 0.11CO2 2 + 0.94 S + 0.5H+ 0.94 S + 0.5H22O O →→ 0.5N0.5N22 + 0.02C+ 0.02C55HH77NONO22 + 0.94 SO+ 0.94 SO44
--22 + 0.83H+ 0.83H++
Sulfur Bacteria BacteSulfur Bacteria Bacterial Cellsrial Cells
HH22 as Electron Donor:as Electron Donor:AutotrophicAutotrophic
NONO33-- + 2.82H+ 2.82H2 2 + 0.14CO+ 0.14CO2 2 + H+ H++ →→ 0.49N0.49N22 + 0.03C+ 0.03C55HH77NONO22 + 3.22H+ 3.22H22OO
BacteriaBacteria Bacterial Cells Bacterial Cells

Biological DenitrificationBiological Denitrification
Autotrophic Denitrification:Autotrophic Denitrification:
Autotrophic denitrification, while somewhat common in Autotrophic denitrification, while somewhat common in drinking water treatment, is not commonly used in drinking water treatment, is not commonly used in conventional wastewater treatment, let alone onsite wastewater conventional wastewater treatment, let alone onsite wastewater treatment. treatment.
There is one example of elemental sulfur being tried in There is one example of elemental sulfur being tried in autotrophic denitrification for onsite systems in Suffolk Countyautotrophic denitrification for onsite systems in Suffolk County, , New York, but this attempt ended in failure. New York, but this attempt ended in failure.
Biological DenitrificationBiological Denitrification
Summary of Heterotrophic Denitrification Processes:Summary of Heterotrophic Denitrification Processes:
Table 5 summarizes the three processes for heterotrophic Table 5 summarizes the three processes for heterotrophic denitrification (which are shown in Figure 10) with their advantdenitrification (which are shown in Figure 10) with their advantages ages and disadvantages for onsite nitrogen removal. and disadvantages for onsite nitrogen removal.
In summary, organic carbon can be provided in the following waysIn summary, organic carbon can be provided in the following ways: : As an external carbon source to an anoxic reactor after nitrificAs an external carbon source to an anoxic reactor after nitrification;ation;As an internal source in the form of bacterial cells through a sAs an internal source in the form of bacterial cells through a sequential equential process of aerobic and anoxic zones; process of aerobic and anoxic zones; The influent wastewater can be used as the carbon source by recyThe influent wastewater can be used as the carbon source by recycling cling nitrified effluent to an anoxic reactor that precedes the aerobinitrified effluent to an anoxic reactor that precedes the aerobic nitrification c nitrification reactor, operating alternating aerobic/anoxic zones on one reactreactor, operating alternating aerobic/anoxic zones on one reactor or (sequencing batch reactor), or conveying the flow sequentially t(sequencing batch reactor), or conveying the flow sequentially through hrough alternating aerobic/anoxic zones. Denitrification reactors can balternating aerobic/anoxic zones. Denitrification reactors can be designed e designed as suspendedas suspended--growth or attachedgrowth or attached--growth processes. growth processes.

Biological DenitrificationBiological Denitrification
Table 5:Table 5: Onsite Processes for Heterotrophic DenitrificationOnsite Processes for Heterotrophic Denitrification
ProcessProcess AdvantagesAdvantages DisadvantagesDisadvantages
External Carbon SourceExternal Carbon Source High removal rates.High removal rates. Insufficient performance data for Insufficient performance data for Denitrification easilyDenitrification easily onsite systems. Operation and onsite systems. Operation and controlled.controlled. maintenance data lacking. Routine maintenance data lacking. Routine
monitoring required. Alkalinity lostmonitoring required. Alkalinity lostthrough nitrification may or may through nitrification may or may not be recovered, depending on not be recovered, depending on the carbon source used. the carbon source used.
Wastewater as Carbon Wastewater as Carbon Lower energy andLower energy and Insufficient performance data. Insufficient performance data. SourceSource chemical requirements.chemical requirements. Process difficult to control. RoutineProcess difficult to control. Routine
Fifty percent recoveryFifty percent recovery monitoring required. Operation and monitoring required. Operation and of alkalinity lost throughof alkalinity lost through maintenance data lacking.maintenance data lacking.nitrification. Fifty percentnitrification. Fifty percentreduction in Oreduction in O22 requirerequire--ments for CBOD removal.ments for CBOD removal.
Bacterial Cells as Carbon Bacterial Cells as Carbon Lower energy andLower energy and Insufficient performance dataInsufficient performance dataSourceSource chemical requirements.chemical requirements. Process difficult to control. RoutineProcess difficult to control. Routine
monitoring required. Operation and monitoring required. Operation and maintenance data lacking.maintenance data lacking.

Biological DenitrificationBiological Denitrification
Denitrification reactors can be designed as suspendedDenitrification reactors can be designed as suspended--growth growth or attachedor attached--growth processes. growth processes.
The lack of reliable performance data precludes a sound design The lack of reliable performance data precludes a sound design strategy for onsite denitrification, although much valuable strategy for onsite denitrification, although much valuable information exists for centralized treatment systems. information exists for centralized treatment systems.
In general, using wastewater as the carbon source has many In general, using wastewater as the carbon source has many potential advantages, such as recovery of alkalinity (potential advantages, such as recovery of alkalinity (≈≈ 50%) and 50%) and diminished oxygen requirements for CBOD removal since NOdiminished oxygen requirements for CBOD removal since NO33
--
is used as the electron acceptor. is used as the electron acceptor.

Process Design for Onsite Nitrogen RemovalProcess Design for Onsite Nitrogen Removal
Centralized Wastewater Treatment:Centralized Wastewater Treatment:
Nitrogen removal through biological nitrification/denitrificatioNitrogen removal through biological nitrification/denitrification, n, as practiced in centralized wastewater treatment, is generally as practiced in centralized wastewater treatment, is generally classified as an advanced treatment process. classified as an advanced treatment process. Detailed information on wastewater flows and characteristics is Detailed information on wastewater flows and characteristics is required for successful design, operation, and troublerequired for successful design, operation, and trouble--shooting shooting if nitrogen removal is to be successful. if nitrogen removal is to be successful. As a result, design and operational parameters, such as As a result, design and operational parameters, such as alkalinity requirements, organic loading rates necessary to alkalinity requirements, organic loading rates necessary to achieve nitrification, and stoichiometric equivalencies for achieve nitrification, and stoichiometric equivalencies for various reactions have been widely published in order to various reactions have been widely published in order to advance knowledge and improve design and operation. advance knowledge and improve design and operation.

Process Design for Onsite Nitrogen RemovalProcess Design for Onsite Nitrogen Removal
Onsite Wastewater Treatment SystemsOnsite Wastewater Treatment Systems
Much of the published literature does not report data in terms Much of the published literature does not report data in terms of parameters that can be used to rigorously assess systems, of parameters that can be used to rigorously assess systems, compare them to other sites, and improve design and compare them to other sites, and improve design and operation. operation. As an example, the loading rates on single pass sand filter (ISFAs an example, the loading rates on single pass sand filter (ISF) ) systems have been almost exclusively expressed in terms of systems have been almost exclusively expressed in terms of hydraulic loading rates; the most useful information in terms ofhydraulic loading rates; the most useful information in terms ofnitrification, however, would be organic loading rates. nitrification, however, would be organic loading rates. Alkalinity concentrations are also very rarely monitored in Alkalinity concentrations are also very rarely monitored in onsite wastewater treatment studies, but are fundamental in onsite wastewater treatment studies, but are fundamental in assessing the limits on nitrification.assessing the limits on nitrification.

Process Design for Onsite Nitrogen RemovalProcess Design for Onsite Nitrogen Removal
Onsite Wastewater Treatment Systems: Key Design FactorsOnsite Wastewater Treatment Systems: Key Design Factors
Wastewater FlowsWastewater FlowsRange of FlowratesRange of FlowratesDiurnal Variability of FlowratesDiurnal Variability of Flowrates
Wastewater CharacteristicsWastewater CharacteristicsOrganic Loadings (BODOrganic Loadings (BOD55))Alkalinity and pHAlkalinity and pHBODBOD55/TKN/TKNPresence of InhibitorsPresence of Inhibitors

Process Design for Onsite Nitrogen RemovalProcess Design for Onsite Nitrogen Removal
Technological Assessment and Design Considerations. Technological Assessment and Design Considerations.
Figures 12 and 13, which show nitrogen removal as a function Figures 12 and 13, which show nitrogen removal as a function of initial TKN, alkalinity, and BODof initial TKN, alkalinity, and BOD55, have been developed for the , have been developed for the range of BODrange of BOD55 values (100values (100--140 mg/L) reported for septic tank 140 mg/L) reported for septic tank effluents with an effluent filter. effluents with an effluent filter.
These figures can be used for an initial technical assessment ofThese figures can be used for an initial technical assessment ofpossible removal efficiencies and design considerations for a possible removal efficiencies and design considerations for a given wastewater. given wastewater.

Figure 12 Nitrogen Removal Using Wastewater as Carbon Source as a Function of TKN and Alkalinity
0.0
10.0
20.0
30.0
40.0
0.0 10.0 20.0 30.0 40.0 50.0 60.0 70.0 80.0 90.0 100.0Initial TKN, mg/L
Eff
luen
t TN
, mg/
L
Increasing Alkalinity
Alkalinity > 200 mg/L as CaCO3
BOD5 = 120 mg/L
(It is assumed the BOD5 = 120 mg/L, that 50% of the alkalinity lost by nitrification is recovered in denitrification, and that the stoichiometric equivalency is 4.0 mg BODL/mg NO3
--N = 2.72 mg BOD5//mg NO3--N for k = 0.23 d-1.)
Alkalinity = 50 mg/Las CaCO3
Alkalinity = 100 mg/Las CaCO3
BOD5 LIMITS N REMOVAL

Figure 13 Nitrogen Removal Using Wastewater as Carbon Source as a Function of TKN and Alkalinity
0.0
10.0
20.0
30.0
40.0
0.0 10.0 20.0 30.0 40.0 50.0 60.0 70.0 80.0 90.0 100.0Initial TKN, mg/L
Eff
luen
t TN
, mg/
L
Increasing Alkalinity
Alkalinity > 300 mg/Las CaCO3
BOD5 = 180 mg/L
(It is assumed the BOD5 = 180 mg/L, that 50% of the alkalinity lost by nitrification is recovered in denitrification,
the stoichiomitric equivalency is 4.0 mg BODL/mg NO3- -N = 2.72 mg BOD5/mg NO3
--N for k = 0.23 d-1.)
Alkalinity = 50 mg/Las CaCO3
Alkalinity = 100 mg/Las CaCO3
Alkalinity = 200 mg/Las CaCO3
BOD5 LIMITSN REMOVAL

Examples of Onsite Nitrogen Removal Examples of Onsite Nitrogen Removal TechnologiesTechnologies
Suspended Growth:Suspended Growth:Aerobic units w/pulse aerationAerobic units w/pulse aerationSequencing batch reactorSequencing batch reactor
Attached Growth:Attached Growth:Single Pass Sand Filters (SPSF)Single Pass Sand Filters (SPSF)Recirculating Sand/Gravel Filters (RSF)Recirculating Sand/Gravel Filters (RSF)Recirculating Textile FiltersRecirculating Textile FiltersRSF w/Anoxic FilterRSF w/Anoxic FilterRSF w/Anoxic Filter w/external carbon sourceRSF w/Anoxic Filter w/external carbon sourceRUCK systemRUCK system

Examples of Onsite Nitrogen Removal Examples of Onsite Nitrogen Removal TechnologiesTechnologies
SuspendedSuspended--Growth Systems (Figure 14)Growth Systems (Figure 14)
Aerobic Units with Pulse Aeration.Aerobic Units with Pulse Aeration. These units are, in principal, These units are, in principal, extended aeration activated sludge systems in which aeration is extended aeration activated sludge systems in which aeration is periodically stopped or pulsed to promote denitrification. Operaperiodically stopped or pulsed to promote denitrification. Operational data tional data on these systems is lacking although nitrogen removal efficiencion these systems is lacking although nitrogen removal efficiencies have es have been reported to be in the range of 25been reported to be in the range of 25--61 percent. 61 percent.
Sequencing Batch Reactor (SBR).Sequencing Batch Reactor (SBR). The SBR differs generally from The SBR differs generally from aerobic units in that fillaerobic units in that fill--andand--draw, and alternating aerobic and anoxic draw, and alternating aerobic and anoxic cycles, are created within a single reactor; during the anoxic pcycles, are created within a single reactor; during the anoxic phase hase sedimentation takes place and the sedimentation takes place and the supernatnantsupernatnant is pumped from the is pumped from the reactor. Both endogenous phase bacteria and influent wastewater reactor. Both endogenous phase bacteria and influent wastewater serve as serve as the carbon source. SBR technology has been demonstrated to be anthe carbon source. SBR technology has been demonstrated to be anexcellent nitrogen control technology for largeexcellent nitrogen control technology for large--scale systems, but there is scale systems, but there is a paucity of information for onsite systems. a paucity of information for onsite systems.


Examples of Onsite Nitrogen Removal Examples of Onsite Nitrogen Removal TechnologiesTechnologies
AttachedAttached--Growth Systems (Figure 15)Growth Systems (Figure 15)
Single Pass Sand Filters (SPSF).Single Pass Sand Filters (SPSF). SPSF technology is the most SPSF technology is the most studied of all proposed nitrogen removal technologies. The studied of all proposed nitrogen removal technologies. The mechanism of nitrogen removal includes a combination of CBOD mechanism of nitrogen removal includes a combination of CBOD removal and nitrification within the sand medium at low organic removal and nitrification within the sand medium at low organic loadings (low BODloadings (low BOD55/TKN ratio), and subsequent denitrification /TKN ratio), and subsequent denitrification within anoxic microenvironments in the sand. within anoxic microenvironments in the sand.
TotalTotal--N removal rates with SPSFs have been quoted in the N removal rates with SPSFs have been quoted in the literature as ranging from 8% to 50%.literature as ranging from 8% to 50%. The greatest advantage of The greatest advantage of ISF technology is in the achievement of nitrification. The ISF technology is in the achievement of nitrification. The percentage of TKN nitrification in SPSF systems has been reportepercentage of TKN nitrification in SPSF systems has been reported d to range between 75% to 96%. to range between 75% to 96%.


Examples of Onsite Nitrogen Removal Examples of Onsite Nitrogen Removal TechnologiesTechnologies
AttachedAttached--Growth Systems (Figure 15)Growth Systems (Figure 15)
Single Pass Sand Filters, Continued.Single Pass Sand Filters, Continued. Unfortunately, there is a Unfortunately, there is a paucity of sound design data for nitrification based on organic paucity of sound design data for nitrification based on organic loading rates. Most of the loading rates have been reported in loading rates. Most of the loading rates have been reported in terms of hydraulic loading rather than organic loading. Also, terms of hydraulic loading rather than organic loading. Also, accurate data on measured loadings per unit area based on the accurate data on measured loadings per unit area based on the type of distribution system used as opposed to calculated type of distribution system used as opposed to calculated loadings are difficult to come by.loadings are difficult to come by.
Assuming there is sufficient alkalinity for nitrification, it caAssuming there is sufficient alkalinity for nitrification, it can be n be expected that SPSF systems will always be denitrificationexpected that SPSF systems will always be denitrification--limited limited due to the lack of availability of both a carbon source and anoxdue to the lack of availability of both a carbon source and anoxic ic conditions. conditions.

Examples of Onsite Nitrogen Removal Examples of Onsite Nitrogen Removal TechnologiesTechnologies
AttachedAttached--Growth Systems (Figure 15)Growth Systems (Figure 15)
Recirculating Sand/Gravel Filters (RSF).Recirculating Sand/Gravel Filters (RSF). RSF technology is RSF technology is also very well studied in the literature. Totalalso very well studied in the literature. Total--N reduction has been N reduction has been reported to range from 15% to 84%. RSFs can achieve high reported to range from 15% to 84%. RSFs can achieve high nitrification rates and consistently higher denitrification ratenitrification rates and consistently higher denitrification rates than s than ISFs because the nitrified effluent can be recycled back to a ISFs because the nitrified effluent can be recycled back to a recirculation tank where it mixes with wastewater from the septirecirculation tank where it mixes with wastewater from the septic c tank, thus using the incoming wastewater as a carbon source. tank, thus using the incoming wastewater as a carbon source.
As with SPSF systems, the organic loading rates for RSF systems As with SPSF systems, the organic loading rates for RSF systems are poorly defined in the literature. The available data suggestare poorly defined in the literature. The available data suggest that that organic loading rates that promote nitrification typically are iorganic loading rates that promote nitrification typically are in the n the range of 0.002range of 0.002--0.008 lbs. BOD0.008 lbs. BOD55/ft/ft22--day. The extent of denitrification day. The extent of denitrification can be expected to vary widely since RSF systems have not can be expected to vary widely since RSF systems have not typically been designed and operated specifically for nitrogen typically been designed and operated specifically for nitrogen removal.removal.

Examples of Onsite Nitrogen Removal Examples of Onsite Nitrogen Removal TechnologiesTechnologies
AttachedAttached--Growth Systems (Figure 15)Growth Systems (Figure 15)
Recirculating Sand/Gravel Filters, Continued. Recirculating Sand/Gravel Filters, Continued.
There is no doubt RSF performance could be significantly There is no doubt RSF performance could be significantly improved for nitrogen removal with design and operational improved for nitrogen removal with design and operational changes. changes.
The recirculation tank is not generally configured to The recirculation tank is not generally configured to maximize the mixing of septic tank effluent with RSF maximize the mixing of septic tank effluent with RSF effluent or to optimize the formation of anoxic conditions for effluent or to optimize the formation of anoxic conditions for denitrification.denitrification.

Examples of Onsite Nitrogen Removal Examples of Onsite Nitrogen Removal TechnologiesTechnologies
AttachedAttached--Growth Systems (Figure 15)Growth Systems (Figure 15)
Recirculating Sand/Gravel Filters, Continued. Recirculating Sand/Gravel Filters, Continued. A better design A better design to enhance denitrification recycles the filter effluent to the ito enhance denitrification recycles the filter effluent to the inlet nlet side of an anoxic recirculation tank, or an anoxic rock filter,side of an anoxic recirculation tank, or an anoxic rock filter, where where it mixes with septic tank effluent; the final effluent for dischit mixes with septic tank effluent; the final effluent for discharge is arge is then taken from the filter. This type of system has been termed then taken from the filter. This type of system has been termed "classical predenitrification"classical predenitrification””. The rock filter fosters anoxic . The rock filter fosters anoxic conditions by preventing hydraulic shortconditions by preventing hydraulic short--circuiting and allows circuiting and allows denitrifying organisms to grow on the rock surfaces, although denitrifying organisms to grow on the rock surfaces, although there could be serious problems with maintenance due to sludge there could be serious problems with maintenance due to sludge accumulation. accumulation.
Systems using this type of design have been reported in the Systems using this type of design have been reported in the literature. While one system exhibited a mean Totalliterature. While one system exhibited a mean Total--N removal of N removal of 40% with a mean effluent concentration of 23 mg/L, another study40% with a mean effluent concentration of 23 mg/L, another studyreported Totalreported Total--N removals of 80 to 90% and effluent TotalN removals of 80 to 90% and effluent Total--N N concentrations ranging from 7concentrations ranging from 7--10 mg/L.10 mg/L.
Examples of Onsite Nitrogen Removal Examples of Onsite Nitrogen Removal TechnologiesTechnologies
AttachedAttached--Growth Systems (Figure 15)Growth Systems (Figure 15)
Recirculating Sand/Gravel Filters, Continued. Recirculating Sand/Gravel Filters, Continued. Operational Operational changes that could improve nitrogen removal include optimizing changes that could improve nitrogen removal include optimizing the recirculation ratio in order to i) minimize dissolved oxygenthe recirculation ratio in order to i) minimize dissolved oxygen in in the recirculation tank and ii) maximize denitrification. the recirculation tank and ii) maximize denitrification.
The recirculation ratio for The recirculation ratio for dentrificationdentrification must be at least 4:1 or must be at least 4:1 or greater in order to remove at minimum 80% of the NOgreater in order to remove at minimum 80% of the NO33
-- --N. Many N. Many RSFs in operation may be below this minimum since the range of RSFs in operation may be below this minimum since the range of recommended recirculation ratios is often 3:1 to 5:1. Also, veryrecommended recirculation ratios is often 3:1 to 5:1. Also, veryhigh recirculation ratios used to prevent filter drying during lhigh recirculation ratios used to prevent filter drying during lowow--flow periods can inhibit denitrification because they cause highflow periods can inhibit denitrification because they cause highdissolved oxygen concentrations in the recirculation tank. The dissolved oxygen concentrations in the recirculation tank. The optimization of the recirculation ratio for Totaloptimization of the recirculation ratio for Total--N removal has to be N removal has to be done on a sitedone on a site--specific basis. specific basis.

Examples of Onsite Nitrogen Removal Examples of Onsite Nitrogen Removal TechnologiesTechnologies
AttachedAttached--Growth Systems (Figure 15)Growth Systems (Figure 15)
Single Pass (ITF) and MultiSingle Pass (ITF) and Multi--Pass Textile Filters (RTF). Pass Textile Filters (RTF). Textile Textile filters are a relatively new technology. The design configuratiofilters are a relatively new technology. The design configurations ns and operational characteristics of single pass and multipleand operational characteristics of single pass and multiple--pass pass textile filters are essentially the same as for sand/gravel filttextile filters are essentially the same as for sand/gravel filters with ers with one important exception that has been reported in a refereed one important exception that has been reported in a refereed journal article: hydraulic and organic surface loading rates arejournal article: hydraulic and organic surface loading rates aremuch higher due to the specific surface area of the textile medimuch higher due to the specific surface area of the textile medium.um.((LeverenzLeverenz, H., , H., et al., et al., EvaluationEvaluation ofof HighHigh--PorosityPorosity MediumMedium in in IntermittentlyIntermittently DosedDosed, , MultiMulti--PassPass PackedPacked BedBed FiltersFilters forfor thetheTreatmentTreatment ofof WastewaterWastewater, , SmallSmall FlowsFlows QuarterlyQuarterly, Vol. 2, No. , Vol. 2, No. 2, pp. 282, pp. 28--35, 200135, 2001))

Examples of Onsite Nitrogen Removal Examples of Onsite Nitrogen Removal TechnologiesTechnologies
AttachedAttached--Growth Systems (Figure 15)Growth Systems (Figure 15)
Single Pass and MultiSingle Pass and Multi--Pass Textile Filters, Continued.Pass Textile Filters, Continued.Unfortunately, there are a paucity of data for textile filters iUnfortunately, there are a paucity of data for textile filters in n relation to both nitrification and Totalrelation to both nitrification and Total--N removal. One detailed N removal. One detailed study of study of MPTFsMPTFs showed that 83showed that 83--95% nitrification occurred with as 95% nitrification occurred with as much as 14much as 14--29% Total29% Total--N removal at an organic loading rate of 0.01 N removal at an organic loading rate of 0.01 lbs. BODlbs. BOD55/ft/ft22--day, and that only 59day, and that only 59--76% nitrification occurred with 76% nitrification occurred with from 17from 17--31% Total31% Total--N removal at an organic loading of 0.03 lbs. N removal at an organic loading of 0.03 lbs. BODBOD55/ft/ft22--day. day.
As with sand and gravel filters, more data are needed to As with sand and gravel filters, more data are needed to adequately characterize textile media in terms of design and adequately characterize textile media in terms of design and operational parameters for both nitrification and Totaloperational parameters for both nitrification and Total--N removal. N removal.

Examples of Onsite Nitrogen Removal Examples of Onsite Nitrogen Removal TechnologiesTechnologies
AttachedAttached--Growth Systems (Figure 15)Growth Systems (Figure 15)
Peat Filters.Peat Filters. Peat filters have been used in a manner similar to Peat filters have been used in a manner similar to intermittent sand filters, with similar hydraulic and organic lointermittent sand filters, with similar hydraulic and organic loading ading rates. The results of a very few studies show a potential for hirates. The results of a very few studies show a potential for high gh TotalTotal--N removal, but there is very little known about the N removal, but there is very little known about the mechanisms for adequate design. mechanisms for adequate design.
It can be assumed that the peat would serve as a carbon source fIt can be assumed that the peat would serve as a carbon source for or reduction of NOreduction of NO33
----N after nitrification has occurred in the filter. N after nitrification has occurred in the filter. Unfortunately, few detailed design and operational data are Unfortunately, few detailed design and operational data are available to adequately characterize the various peat media in available to adequately characterize the various peat media in terms of design and operational parameters for both nitrificatioterms of design and operational parameters for both nitrification n and Totaland Total--N removal. N removal.

Examples of Onsite Nitrogen Removal Examples of Onsite Nitrogen Removal TechnologiesTechnologies
AttachedAttached--Growth Systems (Figure 15)Growth Systems (Figure 15)
Recirculating Sand/Gravel Filters with Anoxic Filter and Recirculating Sand/Gravel Filters with Anoxic Filter and External Carbon Source. External Carbon Source. This system is similar to the RSF This system is similar to the RSF above with an anoxic rock filter except the anoxic rock filter nabove with an anoxic rock filter except the anoxic rock filter now ow follows the RSF and an external carbon source is added as shown follows the RSF and an external carbon source is added as shown in Figure 15. Part of the RSF effluent is recycled to the in Figure 15. Part of the RSF effluent is recycled to the recirculation tank, and another part is discharged to the anoxicrecirculation tank, and another part is discharged to the anoxicrock filter where the external carbon source is added. Totalrock filter where the external carbon source is added. Total--N N removal in this type of system has been reported to be very highremoval in this type of system has been reported to be very high. . One detailed study on pilot scale systems showed TotalOne detailed study on pilot scale systems showed Total--N N removals of from 74 to 80% with Totalremovals of from 74 to 80% with Total--N effluent concentrations N effluent concentrations ranging from 10ranging from 10--13mg/L.13mg/L.

Examples of Onsite Nitrogen Removal Examples of Onsite Nitrogen Removal TechnologiesTechnologies
AttachedAttached--Growth Systems (Figure 15 Continued)Growth Systems (Figure 15 Continued)
RUCK System.RUCK System. The RUCK system, which is shown in Figure 15, The RUCK system, which is shown in Figure 15, is a proprietary system that uses source separation for nitrificis a proprietary system that uses source separation for nitrification ation and denitrification. Separate collection systems are designed foand denitrification. Separate collection systems are designed for r greywater and blackwater, with each having its own septic tank. greywater and blackwater, with each having its own septic tank. The blackwater, which is comprised of wastewater from toilets, The blackwater, which is comprised of wastewater from toilets, showers and baths, is discharged to an SPSF for nitrification anshowers and baths, is discharged to an SPSF for nitrification and d then passes to an anoxic rock filter; the greywater, comprised othen passes to an anoxic rock filter; the greywater, comprised of f kitchen and laundry wastewater, passes from its septic tank kitchen and laundry wastewater, passes from its septic tank directly to the anoxic rock filter, where it serves as the carbodirectly to the anoxic rock filter, where it serves as the carbon n source.source.
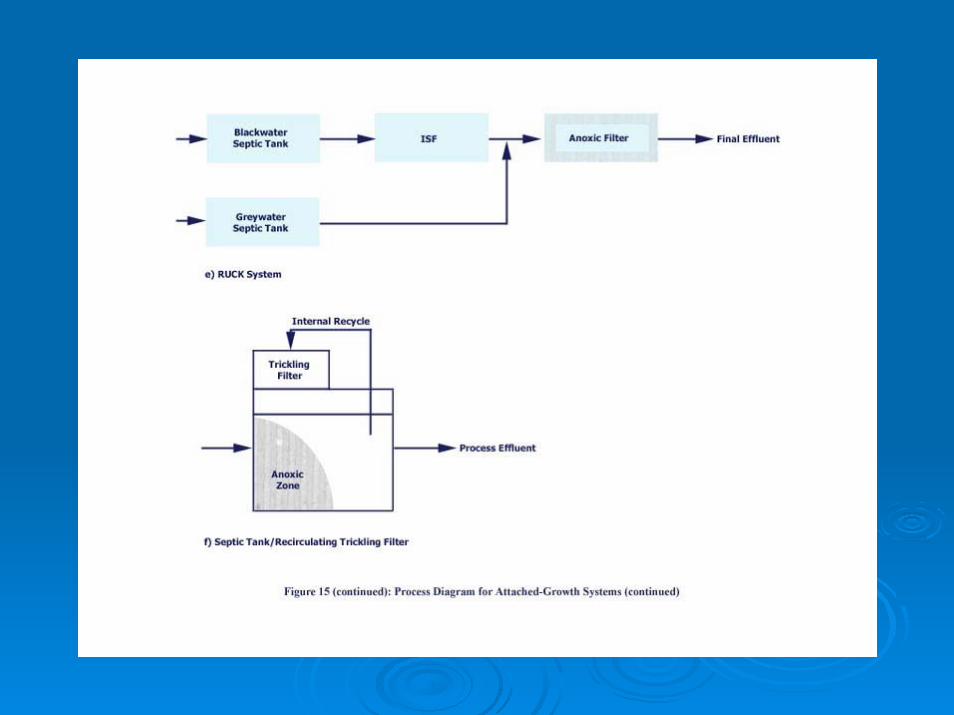
Examples of Onsite Nitrogen Removal Examples of Onsite Nitrogen Removal TechnologiesTechnologies
AttachedAttached--Growth Systems (Figure 15 Continued)Growth Systems (Figure 15 Continued)
RUCK System, Continued.RUCK System, Continued. While the RUCK system has While the RUCK system has often been cited in the literature as a potential technology foroften been cited in the literature as a potential technology fornitrogen removal, there is a paucity of performance data that hanitrogen removal, there is a paucity of performance data that have ve been published. While the process is intended to provide at leasbeen published. While the process is intended to provide at least t 80% Total80% Total--N removal, results from a few studies have shown much N removal, results from a few studies have shown much poorer removal rates of from 29poorer removal rates of from 29--54% Total54% Total--N removal.N removal.
The variability in nitrogen removal efficiency is no doubt due tThe variability in nitrogen removal efficiency is no doubt due to the o the complexity of the system, the variability of the quality of greycomplexity of the system, the variability of the quality of greywater, water, and the need to adjust the operation to siteand the need to adjust the operation to site--specific conditions. specific conditions. The RUCK system likely requires significant adjustment to The RUCK system likely requires significant adjustment to blackwater and greywater characteristics and site conditions to blackwater and greywater characteristics and site conditions to operate effectively.operate effectively.
Examples of Onsite Nitrogen Removal Examples of Onsite Nitrogen Removal TechnologiesTechnologies
Shallow Trench and Subsurface Drip Irrigation Systems.Shallow Trench and Subsurface Drip Irrigation Systems.
The use of either shallow trench or subsurface drip irrigation (The use of either shallow trench or subsurface drip irrigation (SDI) SDI) systems has been proposed as an alternative means to remove systems has been proposed as an alternative means to remove TotalTotal--N in the soil column. Both systems have the potential to N in the soil column. Both systems have the potential to promote nitrogen uptake by plant roots if effluent was dischargepromote nitrogen uptake by plant roots if effluent was discharged d directly within the root zone. directly within the root zone.
There is also a potential that both systems within the 'A' horizThere is also a potential that both systems within the 'A' horizon of on of the soil could promote denitrification of nitrified effluents ifthe soil could promote denitrification of nitrified effluents if there there was sufficient organic matter present, either naturally or addedwas sufficient organic matter present, either naturally or added, , and if the conditions were conducive for denitrification (and if the conditions were conducive for denitrification (ieie., ., anoxic). This type of denitrification has been demonstrated withanoxic). This type of denitrification has been demonstrated withthe use of a reactive porous media barrier using sawdust as a the use of a reactive porous media barrier using sawdust as a carbon source, which was used to denitrify nitrified septic tankcarbon source, which was used to denitrify nitrified septic tankeffluents percolating through the soil column.effluents percolating through the soil column.
Examples of Onsite Nitrogen Removal Examples of Onsite Nitrogen Removal TechnologiesTechnologies
Shallow Trench and Subsurface Drip Irrigation Systems.Shallow Trench and Subsurface Drip Irrigation Systems.
To date, the results on the use of shallow trenches or SDI systeTo date, the results on the use of shallow trenches or SDI systems ms for onsite nitrogen removal is mixed at best, with removal for onsite nitrogen removal is mixed at best, with removal efficiencies of Totalefficiencies of Total--N ranging from 0 to 40%. N ranging from 0 to 40%.
Coupling nitrogen loadings with plant uptake requires significanCoupling nitrogen loadings with plant uptake requires significant t operational monitoring and adjustment. operational monitoring and adjustment.
Denitrification, if it is desired, cannot be easily controlled wDenitrification, if it is desired, cannot be easily controlled within a ithin a trench system or the soil column as it can within a treatment trench system or the soil column as it can within a treatment reactor above ground. reactor above ground.
Monitoring of nitrogen removal in the soil column is also a Monitoring of nitrogen removal in the soil column is also a significant problem since lysimeter systems have to be used, andsignificant problem since lysimeter systems have to be used, andthey require some degree of sophistication in installation and they require some degree of sophistication in installation and sample collection.sample collection.


