Online Supplemental Materials - Springer Static …10.1186...Sherin Bakhashab1,3,4, Fahad W....
13
1 Online Supplemental Materials Metformin Improves the Angiogenic Potential of Human CD34 + Cells Co-incident with Downregulating CXCL10 and TIMP1 Gene Expression and Increasing VEGFA under Hyperglycemia and Hypoxia within a Therapeutic Window for Myocardial Infarction Sherin Bakhashab 1,3,4 , Fahad W. Ahmed 1,2 , Hans-Juergen Schulten 4 , Ayat Bashir 1 , Sajjad Karim 4 , Abdulrahman L. Al-Malki 3 , Mamdooh A. Gari 4 , Adel M. Abuzenadah 4 , Adeel G. Chaudhary 4 , Mohammed H. Alqahtani 4 , Sahira Lary 3 , Farid Ahmed 4 , Jolanta U. Weaver 1,2* 1 Institute of Cellular Medicine, Newcastle University, Newcastle Upon Tyne, UK 2 Queen Elizabeth Hospital, Gateshead, Newcastle Upon Tyne, UK 3 Biochemistry Department, King Abdulaziz University, Jeddah, Saudi Arabia 4 Centre of Excellence in Genomic Medicine Research, King Abdulaziz University, Jeddah, Saudi Arabia
-
Upload
truongthuan -
Category
Documents
-
view
225 -
download
5
Transcript of Online Supplemental Materials - Springer Static …10.1186...Sherin Bakhashab1,3,4, Fahad W....

1
Online Supplemental Materials
Metformin Improves the Angiogenic Potential of Human CD34+ Cells Co-incident with
Downregulating CXCL10 and TIMP1 Gene Expression and Increasing VEGFA under
Hyperglycemia and Hypoxia within a Therapeutic Window for Myocardial Infarction
Sherin Bakhashab1,3,4, Fahad W. Ahmed1,2, Hans-Juergen Schulten4, Ayat Bashir1, Sajjad
Karim4, Abdulrahman L. Al-Malki3, Mamdooh A. Gari4, Adel M. Abuzenadah4, Adeel G.
Chaudhary4, Mohammed H. Alqahtani4, Sahira Lary3, Farid Ahmed4, Jolanta U. Weaver1,2*
1Institute of Cellular Medicine, Newcastle University, Newcastle Upon Tyne, UK
2Queen Elizabeth Hospital, Gateshead, Newcastle Upon Tyne, UK
3Biochemistry Department, King Abdulaziz University, Jeddah, Saudi Arabia
4Centre of Excellence in Genomic Medicine Research, King Abdulaziz University, Jeddah,
Saudi Arabia
2
Supplementary Figure 1: Cell viability assay on HUVEC treated with sunitinib. HUVEC
(104 cells/ well) in 96 well plate were treated with increasing concentrations of sunitinib
(0.01, 0.1, 1.0, 10, and 100 µmol/L) in quadruplicates. After 6 hours CellTiter-Blue reagent
(Promega) was added to each well, and the cells were incubated for 2 hours prior to recording
fluorescence (560/590 nm). Results are presented as mean ± SEM. The mean of IC50 was
calculated as 16.6 µmol/L.

3
Supplementary Table 1: Effect of 3 hours hypoxia on biological functions involved in
CD34+ cells.
Functions
Annotation
p-Value Predicted
Activation
State
Activation
z-score
Molecules Number
of
Molecules
Inflammatory
Response
1.09E-11 Decreased -2.725 ↓AQP9, ↓C3, ↓CCL2,
↓CCL20, ↓CCL5, ↓CCR7, ↓CD14, ↓CXCL5, ↓FOS,
↓IL-1α, ↓IL-6, ↓IL-8,
↓mir-21, ↓PLA2G7, ↓PPBP, ↓RGS1,
↑S100A8, ↓TNFAIP6,
↓UTS2
19
Cellular
Movement
2.82E-11 Decreased -2.274 ↓AQP9, ↓C3, ↓CCL2,
↓CCL20, ↓CCL5, ↓CCR7,
↓CXCL5, ↓IL-1α, ↓IL-8,
↓PLA2G7, ↓PPBP, ↓RGS1, ↑S100A8, ↓UTS2
14
Cell-To-Cell
Signaling and Interaction
4.69E-11 Decreased -3.289 ↓C3, ↓CCL2, ↓CCL5,
↓CCR7, ↓CD14, ↓CLEC1B, ↓CTSL1,
↓CXCL5, ↓DUSP1,
↓FOS, ↓IL-1α, ↓IL-6, ↓IL-
8, ↓KRT18, ↓MET, ↓ mir-21, ↓MS4A1, ↓NCOR2,
↑PPBP, ↑S100A8
20
Cellular Growth and
Proliferation
3.92E-08 Decreased -2.195 ↓CCL2, ↓CCL5, ↓DUSP1, ↓FOS, ↓IL-1α, ↓IL-6, ↓IL-
8, ↓MET, ↓mir-21,
↓TFPI2, ↑TOB2, ↓UTS2
12
Gene list was generated by using IPA software. The activation z-score was used in the calculation of significant changes in gene expression in different samples and conditions. It is calculated from the dataset and indicates
activation or inhibition of the biological function as (+) indicates activation while (-) indicates inhibition. The
arrow ↑ indicates gene is upregulated and ↓ indicates gene is downregulated. Key: AQP9: aquaporin 9; C3:
complement component 3; CCL2: chemokine (C-C motif) ligand 2; CCR7: chemokine (C-C motif) receptor 7;
CD14: CD14 molecule; CLEC1B: C-type lectin domain family 1, member B; CTSL1: cathepsin L1; CXCL5:
chemokine (C-X-C motif) ligand 5; DUSP1: dual specificity phosphatase 1; FOS: FBJ murine osteosarcoma
viral oncogene homolog; IL-1α: interleukin 1 alpha; KRT18: keratin 18; MET: met proto-oncogene (hepatocyte
growth factor receptor); mir-21: microRNA 21; MS4A1: membrane-spanning 4-domains, subfamily A, member
1; NCOR2: nuclear receptor corepressor 2; PLA2G7: phospholipase A2, group VII (platelet-activating factor
acetylhydrolase, plasma); PPBP: pro-platelet basic protein (chemokine (C-X-C motif) ligand 7); RGS1:
regulator of G-protein signaling 1; S100A8: S100 calcium binding protein A8;TFPI2: tissue factor pathway inhibitor 2; TNFAIP6: tumour necrosis factor, alpha-induced protein 6; TOB2: transducer of ERBB2, 2; UTS2:
urotensin 2.

4
Gene Name Gene symbol FC Family
Activating transcription factor 2 ATF2 transcription regulator
BCL2/adenovirus E1B 19kDa interacting protein 3 BNIP3 1.51 other
Complement component 3 C3 -1.51 peptidase

5
Chemokine (C-C motif) ligand 2 CCL2 -2.25 cytokine
Chemokine (C-C motif) ligand 20 CCL20 -1.64 cytokine
Chemokine (C-C motif) ligand 5 CCL5 -2.29 cytokine
CD14 molecule CD14 -1.71 transmembrane receptor
C-type lectin domain family 1, member B CLEC1B -1.60 transmembrane receptor
Cathepsin L1 CTSL1 -1.67 peptidase
Chemokine (C-X-C motif) ligand 5 CXCL5 -1.68 cytokine
FBJ murine osteosarcoma viral oncogene homolog FOS -1.89 transcription regulator
Heparanase HPSE -1.44 enzyme
Interleukin 10 cytokine
Interleukin 1, alpha IL1A -4.67 cytokine
Interleukin 6 (interferon, beta 2) IL6 -2.50 cytokine
Interleukin 8 IL8 -2.43 cytokine
Interferon regulatory factor 4 IRF4 -1.14 transcription regulator
Integrin, beta 8 ITGB8 -1.52 other
Met proto-oncogene (hepatocyte growth factor
receptor)
MET -1.91 kinase
Membrane-spanning 4-domains, subfamily A, member
1
MS4A1 -1.50 other
Nuclear receptor corepressor 2 NCOR2 1.70 transcription regulator
Phospholipase A2, group VII (platelet-activating
factor acetylhydrolase, plasma)
PLA2G7 -1.59 enzyme
Pro-platelet basic protein (chemokine (C-X-C motif) ligand 7)
PPBP -1.74 cytokine
Regulator of G-protein signaling 1 RGS1 -1.81 other
S100 calcium binding protein A8 S100A8 1.52 other
Tumour necrosis factor cytokine
Urotensin 2 UTS2 -1.53 other
Vasohibin 1 VASH1 -1.55 other
Vascular endothelial growth factor A VEGFA growth factor
Supplementary Figure 2: Effect of metformin on euglycaemia-hypoxia treated CD34+
cells. CD34+ cells were treated with euglycaemia and hypoxia for 3 hours in the presence or
absence of metformin for 24 hours. A set of differentially expressed genes was generated by
comparing (A) euglycaemia and hypoxia versus euglycaemia or (B) euglycaemia and
metformin exposed to hypoxia versus euglycaemia and hypoxia without metformin. The
comprehensive network was created by IPA software. Green shades indicate downregulated,
red shades indicate upregulated genes and grey unchanged genes.
6
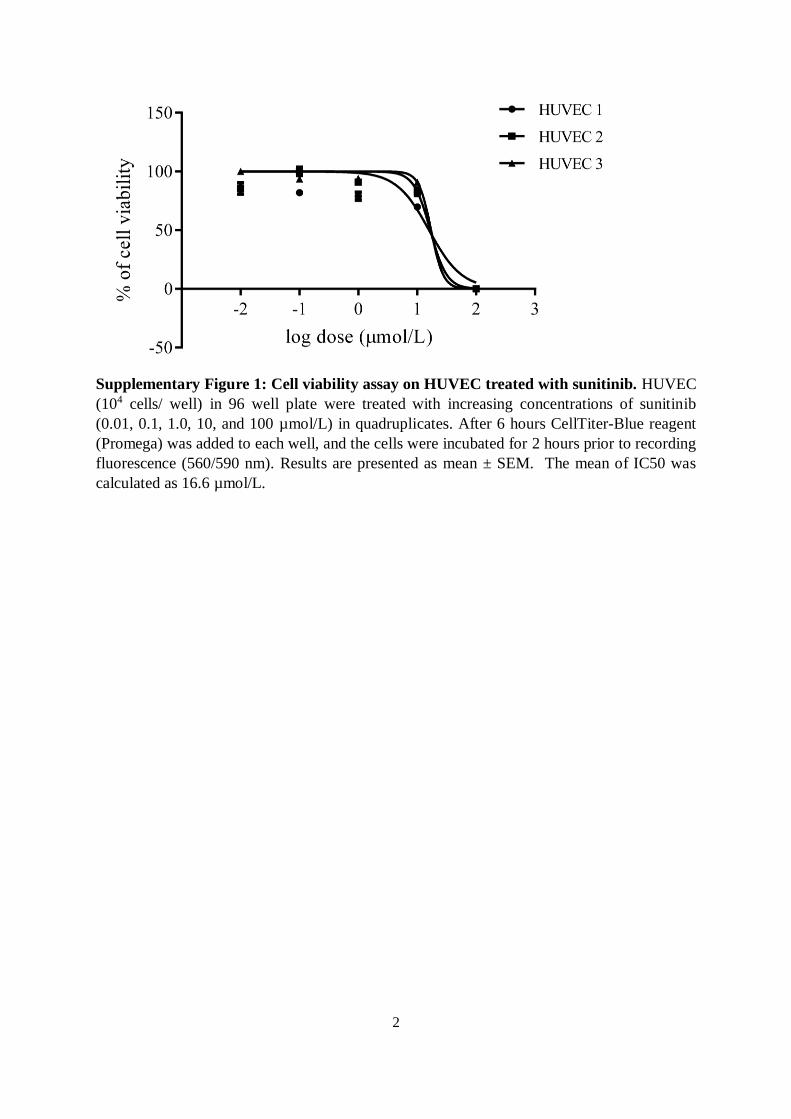
Supplementary Table 2: Top 30 differentially expressed genes in CD34+cells induced by
hyperglycaemia compared to control.
Gene Name Gene
Symbol
p-value FC
Lysine (K)-specific demethylase 5D KDM5D 2.32E-11 -3.56
Selectin P (granule membrane protein 140kDa, antigen CD62) SELP 3.27E-09 -5.01
Gamma-aminobutyric acid (GABA) A receptor, epsilon GABRE 3.31E-09 -2.76
Integrin, beta 3 (platelet glycoprotein IIIa, antigen CD61) ITGB3 3.71E-09 -6.70
Chromosome Y open reading frame 15B CYorf15B 3.74E-09 -5.06
Coagulation factor XIII, A1 polypeptide F13A1 4.77E-09 -3.50
Polycystic kidney and hepatic disease 1 (autosomal recessive)-l PKHD1L1 6.50E-09 -6.43
KIAA0087 KIAA0087 1.40E-08 2.48
Chromosome Y open reading frame 15A CYorf15A 2.26E-08 -4.54
DEAD (Asp-Glu-Ala-Asp) box polypeptide 3, Y-linked DDX3Y 2.29E-08 -4.16
Ubiquitously transcribed tetratricopeptide repeat gene, Y-linked UTY 2.94E-08 -3.89
Heparanase HPSE 3.39E-08 -2.81
Nexilin (F actin binding protein) NEXN 9.83E-08 -3.21
Major histocompatibility complex, class II, DQ beta 1 HLA-DQB1 1.03E-07 -7.01
Ubiquitin specific peptidase 9, Y-linked USP9Y 1.19E-07 -3.83
Major histocompatibility complex, class II, DQ beta 1 HLA-DQB1 1.44E-07 -8.74
Galectin-related protein HSPC159 1.55E-07 -5.74
Epithelial cell adhesion molecule EPCAM 2.04E-07 -2.96
Zinc finger protein, Y-linked ZFY 2.10E-07 -3.23
Dynamin 3 DNM3 2.35E-07 -2.06
Eukaryotic translation initiation factor 1A, Y-linked EIF1AY 3.09E-07 -4.85
Phosphodiesterase 3A, cGMP-inhibited PDE3A 3.98E-07 -2.52
Olfactory receptor, family 3, subfamily A, member 2 OR3A2 4.25E-07 2.31
Snail homolog 2 (Drosophila) SNAI2 4.51E-07 2.16
Glycoprotein Ib (platelet), alpha polypeptide GP1BA 6.25E-07 -2.70
Testis-specific transcript, Y-linked 10 (non-protein coding) TTTY10 6.58E-07 -2.58
Latent transforming growth factor beta binding protein 1 LTBP1 6.69E-07 -2.94
C-type lectin domain family 1, member B CLEC1B 1.06E-06 -4.25
Potassium channel, subfamily K, member 17 KCNK17 1.17E-06 2.55
Immunoglobulin lambda joining 3 IGLJ3 1.76E-06 2.31
The gene list was created by importing Affymetrix .CEL files to Partek Genomic Suite version 6.6. The data
were RMA normalized. Differentially expressed gene list was generated using one-way ANOVA, FDR-
unadjusted p-value < 0.05 with a fold change cutoff of 1.5 was applied.
7
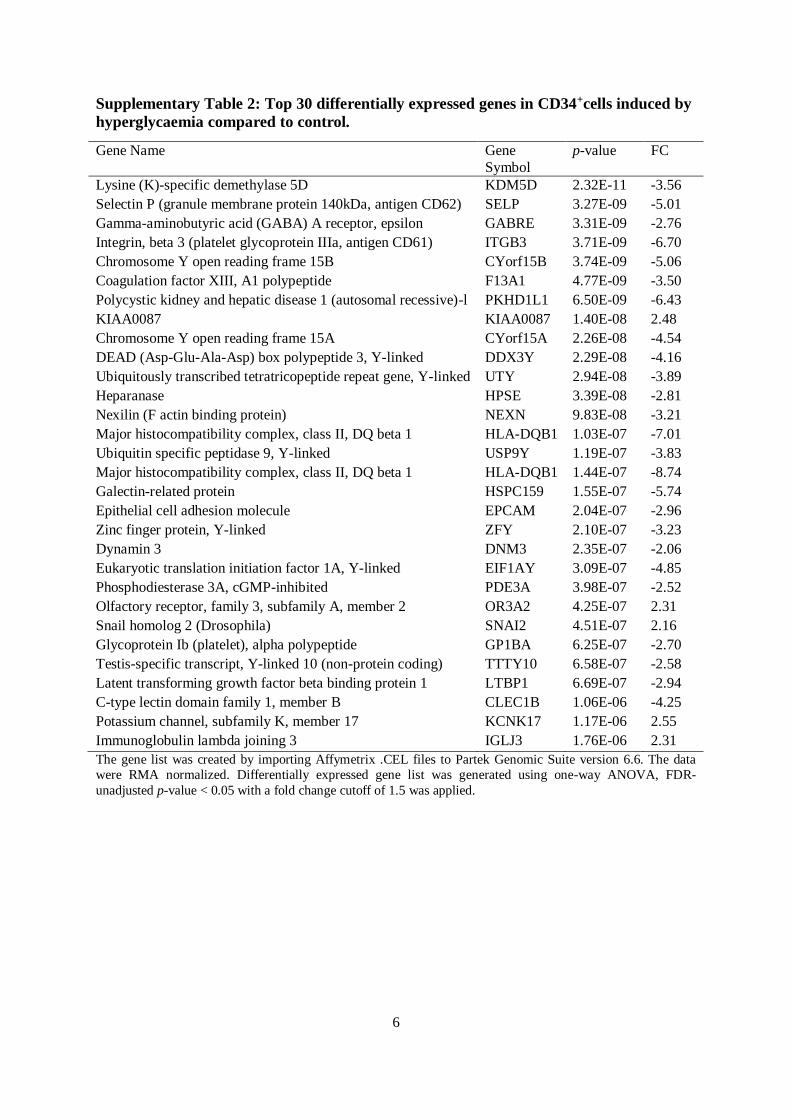
Supplementary Table 3: Top biological functions involved in CD34+cells cultured in
hyperglycaemia.
Functio
ns
p-V
alue
Pred
icted
Activ
ation
State
Activ
ation
z-score
Molecu
les
Num
ber o
f
Molecu
les
Cell-To-Cell
Signaling and
Interaction
1.80E-17 Decreased -2.27
↓AVPR1A, ↓BDNF, ↑BLNK, ↑BTLA, ↓CCL2,
↑CCR7, ↓CD14, ↓CD226, ↓CD24, ↓CD36,
↑CD3E, ↑CD79A, ↓CLEC1B, ↓CTSL1, ↓CXCL2, ↓FCER1A, ↓GP1BA, ↓GP5, ↓GP6,
↑HCK, ↓HLA-DQA1, ↓HLA-DQB1, ↓HPSE,
↑IGHM, ↑IGK, ↓IL-18, ↓IL-1α, ↓IL-6, ↓IL-8,
↑IRF4, ↓ITGA2B, ↓ITGB3, ↓VEGFR-2,
↓LTBP1, ↓MET, ↑MS4A1, ↑NCOR2, ↑NCR1,
↓NTS, ↓PF4, ↑PLD2, ↓PPBP, ↓PRKCA,
↓PROS1, ↓PTGS2, ↓PTPRJ, ↑S100A12,
↑S100A8, ↓SELP, ↑SH2D1A, ↑TCL1A,
↓THBS1, ↓TLR4, ↑TLR7, ↑TNFRSF17, ↓VIP,
↓VWF
57
Cellular
Growth and
Proliferation
1.21E-12 Decreased -1.40
↑BLNK, ↑BTLA, ↓CCL2, ↑CCR7, ↓CD14,
↓CD226, ↓CD24, ↓CD36, ↑CD3E, ↑CD79A,
↓CLECL1B, ↓CXCL2, ↓FYB, ↑HCK, ↓HLA-
DQA1, ↓HLA-DQB1, ↑IGHM, ↑IGKC, ↑IKZF3,
↓IL-18, ↓IL-1α, ↓IL-5RA, ↓IL-6,IL-8, ↓INHBA,
↑IRF4, ↓ITGA2B, ↓ITGB3, ↓LTBP1, ↑LY9, ↑MS4A1, ↓PDE5A, ↓PF4, ↓PTGS2, ↓PTPRJ,
↓RUNX1T1, ↑SH2D1A, ↑SNAI2, ↑TCL1A,
↓THBS1, ↓TLR4, ↑TLR7, ↑TNFRSF17, ↓VIP
44
Inflammatory
Response 1.59E-12 Decreased -1.18
↑BLNK, ↑BTLA, ↓CCL2, ↑CCR7, ↓CD14,
↓CD226, ↑CD3E, ↑CD79A, ↓CLEC1B, ↓CTSL1,
↑HCK, ↓HLA-DQA1, ↓HLA-DQB1, ↓HPSE,
↑IGHM, ↓IL-18, ↓IL-1α, ↓IL-6, ↓IL-8, ↑IRF4,
↓LTBP1, ↓MET, ↑NCOR2, ↑NCR1, ↓PF4,
↑PLD2, ↓PRKCA, ↓PROS1, ↓PTGS2, ↓PTPRJ,
↑S100A12, ↑S100A8, ↑SH2D1A, ↑TCL1A,
↓THBS1, ↓TLR4, ↑TLR7, ↑TNFRSF17, ↓VIP
39
Cellular
Movement 2.60E-11 Decreased -3.31
↓AQP9, ↓BDNF, ↑BTLA, ↓CCL2, ↑CCR7,
↓CD14, ↓CD226, ↑CD36, ↓CD3E, ↓CLEC1B,
↓CTTN, ↓CXCL2, F13A1, ↓FCER1A, ↓FYB,
↓GP1BA, ↓GP6, ↑HCK, ↓IL-18, ↓IL-1α, ↓IL-6,
↓IL-8, ↓INHBA, ↓ITGA2B, ↓ITGB3, ↓VEGFR-
2, ↓PF4, ↓PLA2G7, ↓PPBP, ↓PRKCA, ↓PTGS2,
↓PTPRJ, ↓S100A10, ↑S100A12, ↑S100A8,
↓SELP, ↑SH2D1A, ↓THBS1, ↓TLR4, ↑TLR7,
↑TNFSF8, ↓UTS2, ↓VIP, ↓VWF
44
The affected biological functions were generated by analysis of the gene list using IPA software. The activation
z-score was used in the calculation of significant changes in gene expression in different samples and
conditions. It is calculated from the dataset and indicates activation or inhibition of the biological function as (+)
indicates activation while (-) indicates inhibition. The arrow ↑ indicates gene is upregulated and ↓ indicates gene
is downregulated. Key: AQP9: aquaporin 9; AVPR1A: arginine vasopressin receptor 1A; BDNF: brain-derived
neurotrophic factor; BLNK: B-cell linker; BTLA: B and T lymphocyte associated; CCL2: chemokine (C-C motif)
ligand 2; CCR7: chemokine (C-C motif) receptor 7; CD14: CD14 molecule; CD226: CD226 molecule; CD3E:
CD3e molecule, epsilon (CD3-TCR complex); CD79A: CD79a molecule, immunoglobulin-associated alpha;
CLEC1B: C-type lectin domain family 1, member B; CTSL1: cathepsin L1; CXCL2: chemokine (C-X-C motif)
8
ligand 2; F13A1: coagulation factor XIII, A1 polypeptide; FCER1A: Fc fragment of IgE, high affinity I, receptor
for; alpha polypeptide; FYB: FYN binding protein; GP1BA: glycoprotein Ib (platelet), alpha polypeptide; GP5:
glycoprotein V (platelet); HCK: hemopoietic cell kinase; HLA-DQA1: major histocompatibility complex, class
II, DQ alpha 1; HPSE: heparanase; IGHM: immunoglobulin heavy constant mu; IGK: immunoglobulin kappa
locus; IKZF3: IKAROS family zinc finger 3 (Aiolos); IL-18: interleukin 18; INHBA: inhibin, beta A; IRF4:
interferon regulatory factor 4; ITGA2B: integrin, alpha 2b (platelet glycoprotein IIb of IIb/IIIa complex, antigen
CD41); ITGB3: integrin, beta 3 (platelet glycoprotein IIIa, antigen CD61); LTBP1: latent transforming growth
factor beta binding protein 1; LY9: lymphocyte antigen 9; MET: met proto-oncogene (hepatocyte growth factor
receptor); MS4A1: membrane-spanning 4-domains, subfamily A, member 1; NCOR2: nuclear receptor
corepressor 2; NCR1: natural cytotoxicity triggering receptor 1; NTS: neurotensin; PDE5A: phosphodiesterase
5A, cGMP-specific; PF4: platelet factor 4; PLA2G7: phospholipase A2, group VII (platelet-activating factor
acetylhydrolase, plasma); PLD2: phospholipase D2; PPBP: pro-platelet basic protein (chemokine (C-X-C motif)
ligand 7); PRKCA: protein kinase C, alpha; PROS1: protein S (alpha); PTGS2: prostaglandin-endoperoxide
synthase 2 (prostaglandin G/H synthase and cyclooxygenase); PTPRJ: protein tyrosine phosphatase, receptor
type, J; RUNX1T1: runt-related transcription factor 1; translocated to, 1 (cyclin D-related); S100A12: S100
calcium binding protein A12; SELP: selectin P (granule membrane protein 140kDa, antigen CD62); SH2D1A:
SH2 domain containing 1A; SNAI2: snail homolog 2 (Drosophila); TCL1A: T-cell leukemia/lymphoma 1A;
THBS1: thrombospondin 1; TLR4: toll-like receptor 4; TNFRSF17: tumour necrosis factor receptor superfamily,
member 17; UTS2: urotensin 2; VEGFR-2: vascular endothelial growth factor receptor-2; VIP: vasoactive
intestinal peptide; VWF: von Willebrand factor.
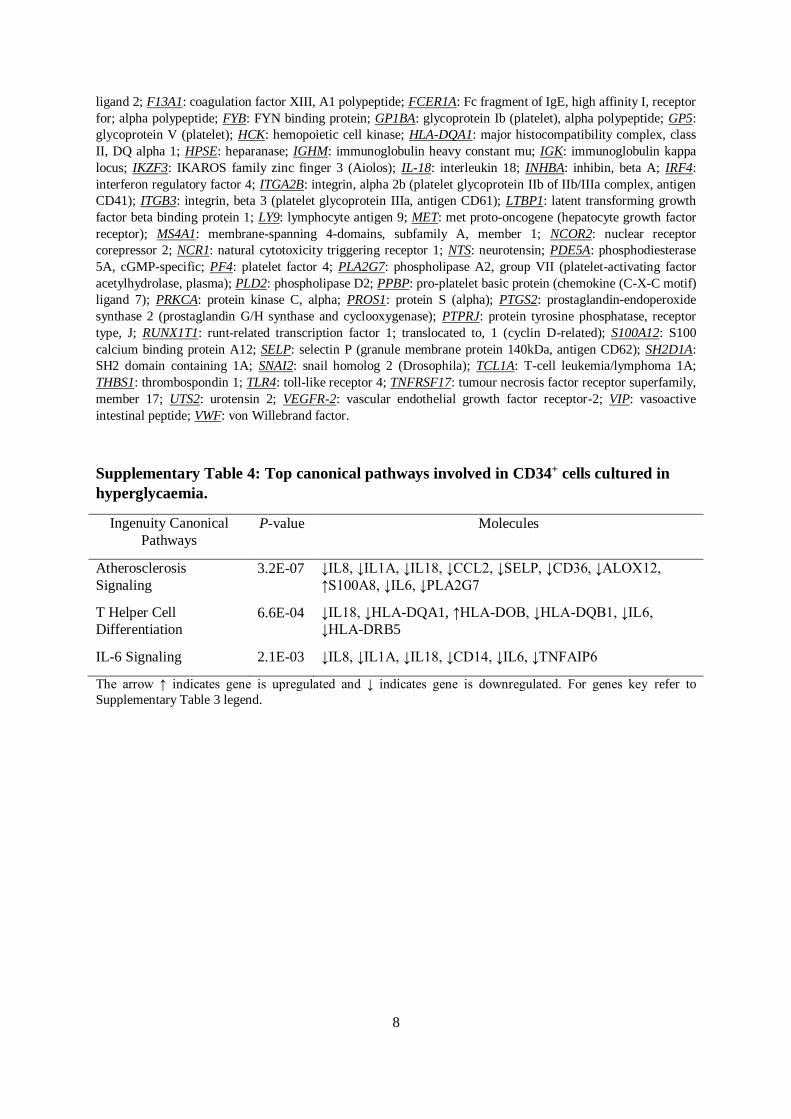
Supplementary Table 4: Top canonical pathways involved in CD34+ cells cultured in
hyperglycaemia.
Ingenuity Canonical
Pathways
P-value Molecules
Atherosclerosis
Signaling
3.2E-07 ↓IL8, ↓IL1A, ↓IL18, ↓CCL2, ↓SELP, ↓CD36, ↓ALOX12,
↑S100A8, ↓IL6, ↓PLA2G7
T Helper Cell
Differentiation 6.6E-04 ↓IL18, ↓HLA-DQA1, ↑HLA-DOB, ↓HLA-DQB1, ↓IL6,
↓HLA-DRB5
IL-6 Signaling 2.1E-03 ↓IL8, ↓IL1A, ↓IL18, ↓CD14, ↓IL6, ↓TNFAIP6
The arrow ↑ indicates gene is upregulated and ↓ indicates gene is downregulated. For genes key refer to
Supplementary Table 3 legend.
9
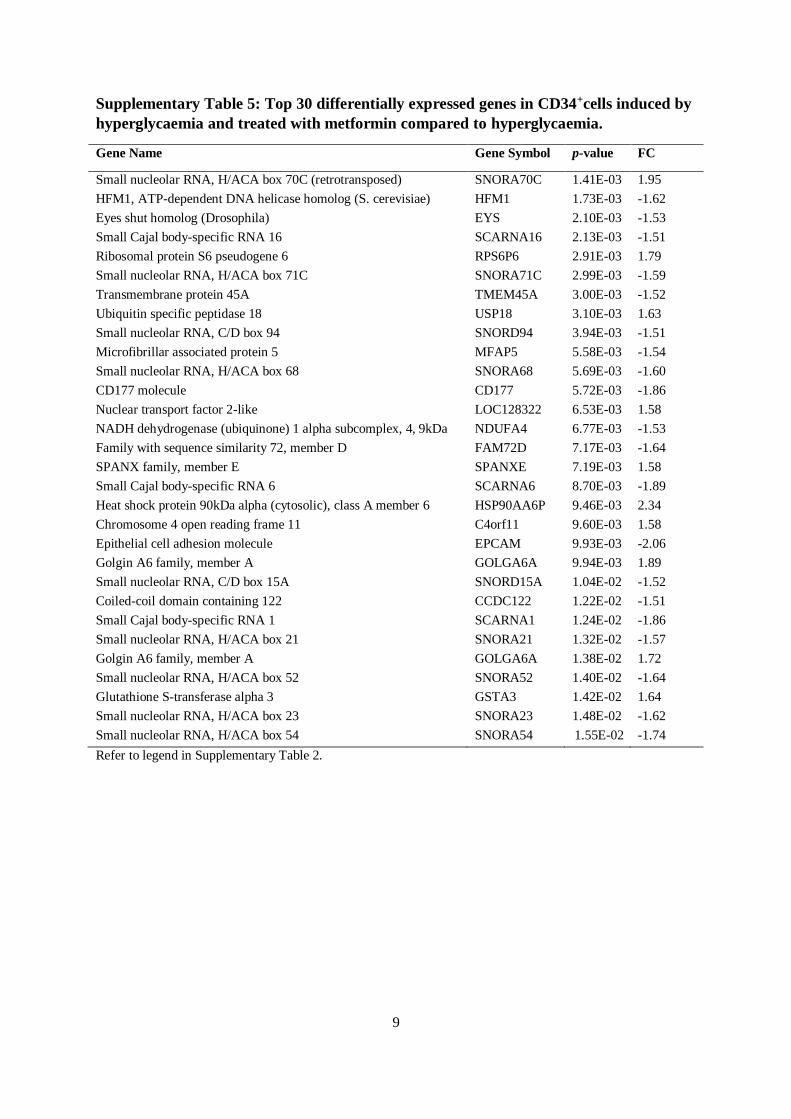
Supplementary Table 5: Top 30 differentially expressed genes in CD34+cells induced by
hyperglycaemia and treated with metformin compared to hyperglycaemia.
Gene Name Gene Symbol p-value FC
Small nucleolar RNA, H/ACA box 70C (retrotransposed) SNORA70C 1.41E-03 1.95
HFM1, ATP-dependent DNA helicase homolog (S. cerevisiae) HFM1 1.73E-03 -1.62
Eyes shut homolog (Drosophila) EYS 2.10E-03 -1.53
Small Cajal body-specific RNA 16 SCARNA16 2.13E-03 -1.51
Ribosomal protein S6 pseudogene 6 RPS6P6 2.91E-03 1.79
Small nucleolar RNA, H/ACA box 71C SNORA71C 2.99E-03 -1.59
Transmembrane protein 45A TMEM45A 3.00E-03 -1.52
Ubiquitin specific peptidase 18 USP18 3.10E-03 1.63
Small nucleolar RNA, C/D box 94 SNORD94 3.94E-03 -1.51
Microfibrillar associated protein 5 MFAP5 5.58E-03 -1.54
Small nucleolar RNA, H/ACA box 68 SNORA68 5.69E-03 -1.60
CD177 molecule CD177 5.72E-03 -1.86
Nuclear transport factor 2-like LOC128322 6.53E-03 1.58
NADH dehydrogenase (ubiquinone) 1 alpha subcomplex, 4, 9kDa NDUFA4 6.77E-03 -1.53
Family with sequence similarity 72, member D FAM72D 7.17E-03 -1.64
SPANX family, member E SPANXE 7.19E-03 1.58
Small Cajal body-specific RNA 6 SCARNA6 8.70E-03 -1.89
Heat shock protein 90kDa alpha (cytosolic), class A member 6 HSP90AA6P 9.46E-03 2.34
Chromosome 4 open reading frame 11 C4orf11 9.60E-03 1.58
Epithelial cell adhesion molecule EPCAM 9.93E-03 -2.06
Golgin A6 family, member A GOLGA6A 9.94E-03 1.89
Small nucleolar RNA, C/D box 15A SNORD15A 1.04E-02 -1.52
Coiled-coil domain containing 122 CCDC122 1.22E-02 -1.51
Small Cajal body-specific RNA 1 SCARNA1 1.24E-02 -1.86
Small nucleolar RNA, H/ACA box 21 SNORA21 1.32E-02 -1.57
Golgin A6 family, member A GOLGA6A 1.38E-02 1.72
Small nucleolar RNA, H/ACA box 52 SNORA52 1.40E-02 -1.64
Glutathione S-transferase alpha 3 GSTA3 1.42E-02 1.64
Small nucleolar RNA, H/ACA box 23 SNORA23 1.48E-02 -1.62
Small nucleolar RNA, H/ACA box 54 SNORA54 1.55E-02 -1.74
Refer to legend in Supplementary Table 2.

10
Supplementary Table 6: Effect of metformin on canonical pathways involved in CD34+
cells cultured in combined hyperglycaemia-hypoxia for 3 hours.
Canonical Pathways P-value Molecules
Mitochondrial Dysfunction 2.0E-03 ↓COX6B1, ↓ATP5D, ↓COX8A, ↑MAPK9,
↓NDUFA3, ↓CYB5A, ↓COX5B, ↓MT-ND2
Triacylglycerol Biosynthesis
7.1E-03 ↓GPAM, ↑AGPAT9, ↑ELOVL6
MAPK Signaling 7.9E-03 ↓CXCL10, ↓MAP2K7, ↓PLA2G10, ↑MAPK9
Type 1 Diabetes Mellitus Signaling 9.5E-03 ↓SOCS1, ↓MAP2K7, ↑IKBKG, ↓FCER1G,
↑MAPK9
IL-8 Signaling
2.3E-02 ↑IKBKG, ↓ICAM1, ↓RHOG, ↓VEGFB, ↑MAPK9, ↑IRAK4
The arrow ↑ indicates gene is upregulated and ↓ indicates gene is downregulated. Key: AGPAT9: 1-
acylglycerol-3-phosphate O-acyltransferase 9; ATP5D: ATP synthase, H+ transporting, mitochondrial F1
complex, delta subunit; COX5B: cytochrome c oxidase subunit Vb; COX6B1: cytochrome c oxidase subunit VIb
polypeptide 1 (ubiquitous); COX8A: cytochrome c oxidase subunit VIIIA (ubiquitous); CXCL10: chemokine (C-
X-C motif) ligand 10; CYB5A: cytochrome b5 type A (microsomal); ELOVL6: ELOVL Fatty Acid Elongase 6;
FCER1G: Fc fragment of IgE, high affinity I, receptor for; gamma polypeptide; GPAM: glycerol-3-phosphate
acyltransferase, mitochondrial; ICAM1: intercellular adhesion molecule 1, IKBKG: inhibitor of Kappa light
polypeptide gene enhancer in B-Cells, kinase gamma; IRAK4: interleukin-1 receptor-associated kinase 4;
MAPK9: mitogen-activated protein kinase 9; MAP2K7: mitogen-activated protein kinase 7; MT-ND2:
mitochondrially Encoded NADH Dehydrogenase 2; NDUFA3: NADH dehydrogenase (ubiquinone) 1 alpha
subcomplex, 3, 9kDa; PLA2G10: phospholipase A2, group X; RHOG: ras homolog gene family, member G (rho
G); SOCS1: suppressor of cytokine signaling 1; VEGFB: vascular endothelial growth factor B.
11
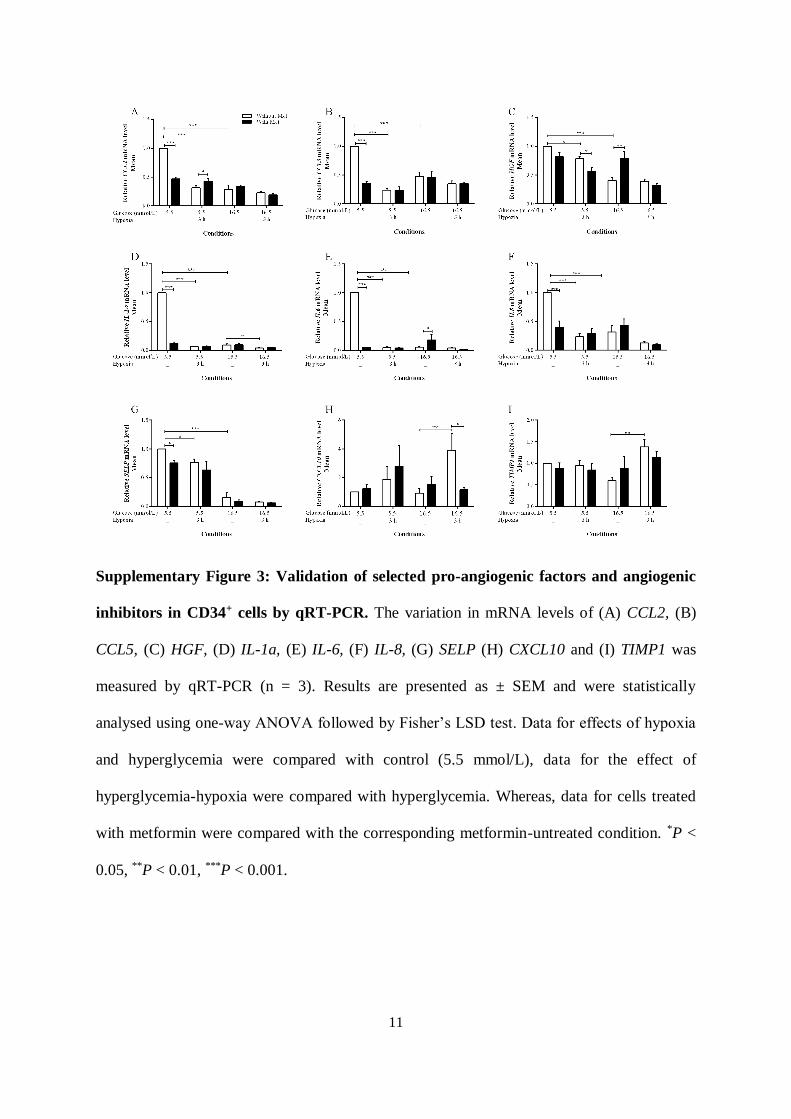
Supplementary Figure 3: Validation of selected pro-angiogenic factors and angiogenic
inhibitors in CD34+ cells by qRT-PCR. The variation in mRNA levels of (A) CCL2, (B)
CCL5, (C) HGF, (D) IL-1a, (E) IL-6, (F) IL-8, (G) SELP (H) CXCL10 and (I) TIMP1 was
measured by qRT-PCR (n = 3). Results are presented as ± SEM and were statistically
analysed using one-way ANOVA followed by Fisher’s LSD test. Data for effects of hypoxia
and hyperglycemia were compared with control (5.5 mmol/L), data for the effect of
hyperglycemia-hypoxia were compared with hyperglycemia. Whereas, data for cells treated
with metformin were compared with the corresponding metformin-untreated condition. *P <
0.05, **P < 0.01, ***P < 0.001.
12
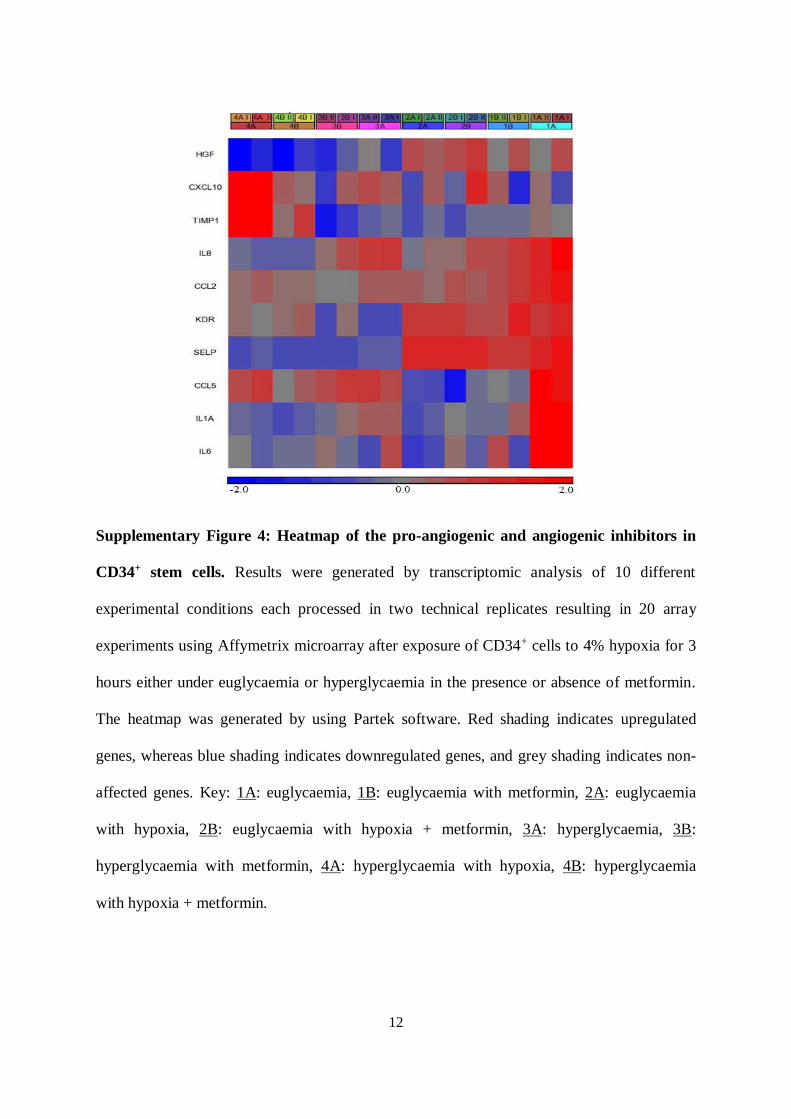
Supplementary Figure 4: Heatmap of the pro-angiogenic and angiogenic inhibitors in
CD34+ stem cells. Results were generated by transcriptomic analysis of 10 different
experimental conditions each processed in two technical replicates resulting in 20 array
experiments using Affymetrix microarray after exposure of CD34+ cells to 4% hypoxia for 3
hours either under euglycaemia or hyperglycaemia in the presence or absence of metformin.
The heatmap was generated by using Partek software. Red shading indicates upregulated
genes, whereas blue shading indicates downregulated genes, and grey shading indicates non-
affected genes. Key: 1A: euglycaemia, 1B: euglycaemia with metformin, 2A: euglycaemia
with hypoxia, 2B: euglycaemia with hypoxia + metformin, 3A: hyperglycaemia, 3B:
hyperglycaemia with metformin, 4A: hyperglycaemia with hypoxia, 4B: hyperglycaemia
with hypoxia + metformin.

13
Supplementary Table 7: Comparison of microarray and real-time PCR data on CD34+ cells treated with hypoxia, hyperglycaemia and
hyperglycaemia-hypoxia in the presence and absence of metformin.
Co
nd
ition
Euglycaemia + metformin
versus euglycaemia
Euglycaemia-hypoxia
versus euglycaemia
Euglycaemia-hypoxia +
metformin versus
euglycaemia + hypoxia
Hyperglycaemia versus
euglycaemia Hyperglycaemia +
metformin versus
hyperglycaemia
Hyperglycaemia-hypoxia
versus hyperglycaemia
Hyperglycaemia-hypoxia +
metformin versus
hyperglycaemia-hypoxia
Gene Microarray qRT-PCR Microarray qRT-PCR Microarray qRT-PCR Microarray qRT-PCR Microarray qRT-PCR Microarray qRT-PCR Microarray qRT-PCR
FC P FC P FC P FC P FC P FC P FC P FC P FC P FC P FC P FC P FC P FC P
CCL2 -1.7 3.2E-03 -2.1 < 0.001 -2.3 1.3E-04 -3.2 < 0.001 1.2 1.4E-01 1.3 3.7E-02 -2.1 2.5E-04 -3.4 < 0.001 -1.2 1.5E-01 1.2 3.6E-01 -1.1 5.7E-01 -1.2 2.3E-01 -1.3 6.9E-02 -1.2 5.2E-01
CCL5 -1.8 4.7E-04 -2.8 < 0.001 -2.3 3.1E-05 -4.2 < 0.001 1.0 8.2E-01 1.0 9.6E-01 -1.5 5.8E-03 -2.1 < 0.001 -1.0 7.6E-01 -1.0 8.3E-01 -1.0 8.4E-01 -1.3 8.5E-02 -1.2 2.5E-01 1.0 9.4E-01
HGF -1.1 7.2E-01 1.2 8.6E-02 1.0 8.9E-01 -1.3 4.5E-02 -1.0 8.9E-01 -1.3 3.9E-02 -1.3 3.7E-02 -2.5 < 0.001 -1.2 1.5E-01 1.7 1.0E-03 -1.6 2.3E-03 1.0 9.0E-01 1.1 4.2E-01 -1.3 4.7E-01
IL-1α -3.7 2.4E-05 -8.3 < 0.001 -4.7 5.2E-06 -16.7 < 0.001 1.1 6.5E-01 1.0 1.0E+00 -3.8 1.9E-05 -11.1 < 0.001 -1.2 3.1E-01 1.0 9.2E-01 -1.5 5.0E-02 -25.0 1.4E-02 1.1 7.6E-01 1.0 8.7E-01
IL-6 -2.2 1.7E-04 -20.0 < 0.001 -2.5 5.5E-05 -20.0 < 0.001 -1.0 9.6E-01 -1.1 9.1E-01 -2.1 2.5E-04 -16.7 < 0.001 1.1 7.5E-01 2.8 1.4E-02 -1.1 6.2E-01 -1.3 6.8E-01 1.0 8.4E-01 -2.8 6.1E-01
IL-8 -1.6 1.1E-02 -2.5 < 0.001 -2.4 9.5E-05 -4.3 < 0.001 1.2 1.8E-01 1.2 5.5E-01 -1.7 4.7E-03 -3.1 < 0.001 -1.3 1.5E-01 1.3 2.5E-01 -2.1 3.5E-04 -2.4 6.1E-02 -1.3 1.4E-02 -1.3 7.3E-01
SELP -1.4 4.2E-03 -1.3 2.5E-02 -1.2 1.3E-01 -1.3 3.2E-02 1.1 2.5E-01 -1.1 2.1E-01 -5.0 3.3E-09 -6.7 < 0.001 -1.1 1.5E-01 -1.1 5.5E-01 -1.1 4.9E-01 -1.3 4.6E-01 1.0 7.5E-01 -1.1 8.8E-01
CXCL10 1.1 6.4E-01 1.2 8.2E-01 1.2 5.4E-01 1.9 3.7E-01 1.4 2.1E-01 1.4 3.7E-01 1.6 6.9E-02 -1.1 9.4E-01 -1.4 1.7E-01 1.6 5.6E-01 1.9 2.0E-02 3.9 7.0E-03 -2.0 1.3E-02 -3.3 1.1E-02
TIMP1 1.2 7.4E-02 -1.1 5.7E-01 1.1 2.1E-01 -1.0 7.9E-01 -1.0 7.8E-01 -1.1 6.2E-01 1.1 5.1E-01 -1.6 5.6E-02 -1.2 1.6E-01 1.5 1.7E-01 2.4 6.3E-06 1.4 1.0E-03 -1.7 3.9E-04 -1.3 2.5E-01
The highlighted data showed non-concordance in gene expression between qRT-PCR and microarray. Although hyperglycaemia and metformin resulted in an increase of mRNA levels of
HGF and IL-6 this remained below normal level observed at euglycaemia.


![arXiv:2008.04753v1 [cs.CV] 11 Aug 2020 · 2020. 8. 12. · HydraMix-Net: A Deep Multi-task Semi-supervised Learning Approach for Cell Detection and Classi cation R.M. Saad Bashir1,](https://static.fdocuments.us/doc/165x107/60c1a15e7451a7456b649bb2/arxiv200804753v1-cscv-11-aug-2020-2020-8-12-hydramix-net-a-deep-multi-task.jpg)