Online Monitoring Technical Basis and Analysis Framework
57
The INL is a U.S. Department of Energy National Laboratory operated by Battelle Energy Alliance INL/EXT-12-27181 Online Monitoring Technical Basis and Analysis Framework for Large Power Transformers; Interim Report for FY 2012 Nancy J. Lybeck, Vivek Agarwal, Binh T. Pham, Heather D. Medema, Kirk Fitzgerald September 2012
Transcript of Online Monitoring Technical Basis and Analysis Framework

The INL is a U.S. Department of Energy National Laboratory operated by Battelle Energy Alliance
INL/EXT-12-27181
Online Monitoring Technical Basis and Analysis Framework for Large Power Transformers; Interim Report for FY 2012
Nancy J. Lybeck, Vivek Agarwal, Binh T. Pham, Heather D. Medema, Kirk Fitzgerald
September 2012

DISCLAIMER
This information was prepared as an account of work sponsored by an
agency of the U.S. Government. Neither the U.S. Government nor any
agency thereof, nor any of their employees, makes any warranty, expressed
or implied, or assumes any legal liability or responsibility for the accuracy,
completeness, or usefulness, of any information, apparatus, product, or
process disclosed, or represents that its use would not infringe privately
owned rights. References herein to any specific commercial product,
process, or service by trade name, trade mark, manufacturer, or otherwise,
does not necessarily constitute or imply its endorsement, recommendation,
or favoring by the U.S. Government or any agency thereof. The views and
opinions of authors expressed herein do not necessarily state or reflect
those of the U.S. Government or any agency thereof.
INL/EXT-12-27181
Online Monitoring Technical Basis and Analysis Framework for Large Power Transformers; Interim
Report for FY 2012
Nancy J. Lybeck, Vivek Agarwal, Binh T. Pham, Heather D. Medema, Kirk Fitzgerald
September 2012
Idaho National Laboratory Idaho Falls, Idaho 83415
http://www.inl.gov
Prepared for the U.S. Department of Energy Office of Nuclear Energy
Under DOE Idaho Operations Office Contract DE-AC07-05ID14517

iii
ABSTRACT
The Light Water Reactor Sustainability program at Idaho National
Laboratory (INL) is actively conducting research to develop and demonstrate
online monitoring capabilities for active components in existing nuclear power
plants. A pilot project is currently underway to apply these capabilities to
generator step-up transformers (GSUs) and emergency diesel generators (EDGs).
INL and the Electric Power Research Institute (EPRI) are working jointly to
implement the pilot project. The EPRI Fleet-Wide Prognostic and Health
Management (FW-PHM) Software Suite will be used to implement monitoring in
conjunction with utility partners: the Shearon Harris Nuclear Generating Station
(owned by Duke Energy Progress) for GSUs, and the Braidwood Generating
Station (owned by Exelon Corporation) for EDGs.
This report presents monitoring techniques, fault signatures, and diagnostic
and prognostic models for GSUs. GSUs are main transformers that are directly
connected to generators, stepping up the voltage from the generator output
voltage to the highest transmission voltages for supplying electricity to the
transmission grid. Technical experts from Shearon Harris are assisting INL and
EPRI in identifying critical faults and defining fault signatures associated with
each fault. The resulting diagnostic models will be implemented in the FW-PHM
Software Suite and tested using data from Shearon Harris. Parallel research on
EDGs is being conducted, and will be reported in an interim report during the
first quarter of fiscal year 2013.

iv

v
EXECUTIVE SUMMARY
The Light Water Reactor Sustainability Program is a research, development,
and deployment program sponsored by the U.S. Department of Energy Office of
Nuclear Energy. The program is operated in collaboration with the Electric
Power Research Institute’s (EPRI’s) research and development efforts in the
Long-Term Operations (LTO) Program. The LTO Program is managed as a
separate technical program operating in the Plant Technology Department of the
EPRI Nuclear Power Sector with the guidance of an industry advisory Integration
Committee. Because both the Department of Energy Office of Nuclear Energy
and EPRI conduct research and development in technologies that have
application to establishing the feasibility of operating commercial light water
reactors (LWRs) beyond the current 60-year license limits, it is important that the
work be coordinated to the benefit of both organizations.
The Light Water Reactor Sustainability and LTO Programs are working
closely with nuclear utilities to develop instrumentation and control technologies
and solutions to help ensure the safe life extension of current reactors. One of the
main areas of focus is centralized online monitoring (OLM), which has two
subprojects: online monitoring of active components and online monitoring of
passive components. The research activities associated with online monitoring of
active components are presented here. The current fleet of nuclear power plants
(NPPs) performs periodic or condition-based maintenance of their active
assets/components. The objective of centralized OLM is to implement predictive
online monitoring techniques that would enable NPPs to diagnose incipient
faults, perform proactive maintenance, and estimate the remaining useful life
(RUL) of the asset.
To demonstrate the value of predictive online monitoring, EPRI has
developed a Web-based Fleet-wide Prognostic and Health Management (FW-
PHM) Software Suite (Beta Version 1.1). The framework of the FW-PHM
software consists of four main components: Diagnostic Advisor; Asset Fault
Signature (AFS) Database; RUL Advisor; and RUL Signature Database. Idaho
National Laboratory (INL) is responsible for performing beta testing of the
software. This work includes installation and configuration process evaluation;
content-based testing; data synchronization; and a human factors evaluation.
Part of the long-term strategic goal of centralized OLM of active components
is to enable industry to implement online monitoring using the FW-PHM
software on selected active components. Generator Step-Up Transformers
(GSUs) and Emergency Diesel Generators (EDGs) are two specified active
components for which monitoring techniques, diagnostic and prognostic models
will be developed in the software. INL and EPRI have identified a partner utility
for each active component. Braidwood Generating Station (owned by Exelon
Corporation) and Shearon Harris Nuclear Generating Station (owned by Duke
Energy Progress) are partner utilities for EDGs and GSUs respectively.
Along with beta testing of the FW-PHM software, INL is working with the
partner utilities to identify and characterize critical faults that lead to catastrophic
failures in both GSUs and EDGs. This will allow INL to populate the AFS
database of the FW-PHM software. The AFS database captures details about
asset type, source of the fault information, different fault signatures, causes,

vi
remedies, and consequences. Based on the identified fault signatures and failure
modes, the Diagnostic Advisor is used to diagnose fault conditions.
INL will research diagnostic and prognostic models for GSUs and EDGs
over the next two years. These models will be used to populate the RUL database
and to make component life predictions using the RUL advisor. The resulting
models will be used with data from the utility partners to demonstrate the use of
predictive OLM in NPPs. The FW-PHM software is unique in the sense that it
standardizes the diagnostic and prognostic approach across assets based on fault
signatures and fault features, generates a comprehensive diagnosis report, and
allows information sharing between different NPPs via a master database. These
capabilities do not currently exist in NPPs, and are expected to support safer long
term operation of the NPPs.

vii
ACKNOWLEDGEMENTS
The authors thank Rick Rusaw (EPRI) for providing the FW-PHM Software
Suite (Beta Version 1.1) and recognize his efforts to identify and establish
collaboration with partner utilities. They are grateful to Randy Bickford (Expert
Microsystem Inc.) for providing technical support and training on the software.
They also thank Gary Deck (System Engineer at Braidwood Generating Station),
Greg Young (System Engineer at Shearon Harris Nuclear Generating Station),
and Michael A. Bodnar (Lead Engineer, at Duke Energy Progress) for their
hospitality and for and participating in the initial development of monitoring
information for GSUs.

viii

ix
CONTENTS
ABSTRACT ................................................................................................................................................. iii
EXECUTIVE SUMMARY .......................................................................................................................... v
ACKNOWLEDGEMENTS ........................................................................................................................ vii
ACRONYMS .............................................................................................................................................. xii
1. INTRODUCTION ................................................................................................................................. 1
2. GENERATOR STEP-UP TRANSFORMERS...................................................................................... 3
2.1 Major Components of Transformers ......................................................................................... 3
2.2 Conditions Leading to Failure ................................................................................................... 4
2.2.1 Paper Insulation Breakdown ........................................................................................ 5
2.2.2 Oil Contamination ....................................................................................................... 5
2.2.3 Moisture ....................................................................................................................... 6
2.2.4 Overloading ................................................................................................................. 6
2.2.5 Loose Connections ....................................................................................................... 6
2.2.6 External Factors ........................................................................................................... 6
2.2.7 Design and Materials ................................................................................................... 6
2.3 Transformer Faults Types ......................................................................................................... 6
2.4 Transformer Diagnosis Using Online Monitoring .................................................................... 7
2.4.1 Key Gases .................................................................................................................... 7
2.4.2 Gas Ratios .................................................................................................................. 10
2.4.3 CO2/CO Ratio ........................................................................................................... 12
2.4.4 O2/N2 Ratio ................................................................................................................ 13
2.4.5 C2H2/H2 Ratio ............................................................................................................ 14
2.5 Deenergized Transformer Testing ........................................................................................... 14
2.6 Diagnostic Techniques for Fault Classification ...................................................................... 15
2.7 Transformer Prognosis ............................................................................................................ 15
3. FW-PHM SOFTWARE SUITE .......................................................................................................... 17
3.1 Software Description ............................................................................................................... 17
4. BETA TESTING APPROACH ........................................................................................................... 19
4.1 Installation and Configuration ................................................................................................. 19
4.2 Content-Based Testing ............................................................................................................ 19
4.3 Data Synchronization .............................................................................................................. 19
4.4 Human Factors Usability Analysis .......................................................................................... 19
4.4.1 Learnability ................................................................................................................ 19
4.4.2 Ease of Use ................................................................................................................ 19
4.4.3 Accessibility .............................................................................................................. 20
4.4.4 Intuitiveness ............................................................................................................... 20
4.4.5 Efficiency ................................................................................................................... 20
4.4.6 Simplicity ................................................................................................................... 20
4.4.7 Consistency ................................................................................................................ 20

x
5. DIAGNOSTIC PATHWAY SPECIFICATIONS FOR GSUs ............................................................ 21
5.1 Asset Type Definition ............................................................................................................. 22
5.2 Fault Type Definition .............................................................................................................. 22
5.3 Fault Feature Definition .......................................................................................................... 23
5.4 Diagnosis Example .................................................................................................................. 24
5.5 Benefits ................................................................................................................................... 25
6. PILOT PROJECT STATUS ................................................................................................................ 26
7. SUMMARY AND FUTURE PLANS ................................................................................................. 27
8. REFERENCES .................................................................................................................................... 28
Appendix A ................................................................................................................................................. 30
FIGURES
Figure 1. Frequency and severity of transformer failure in terms of cost [Bartley 2003]. ............................ 5
Figure 2. Gas composition for partial discharge and arcing faults [EPRI 2006b]. ....................................... 9
Figure 3. Characteristic composition of gases generated because of overheating of oil and paper,
corona, and arcing (Morgan Schaffer Systems). ........................................................................... 9
Figure 4. Duval triangle chart [Duval 2002]. .............................................................................................. 13
Figure 5. Data flow in the EPRI software suite [EPRI 2011b]. .................................................................. 17
Figure 6. EPRI master database and user local database aggregation and periodic master database
updates [EPRI 2011b]. ................................................................................................................ 18
Figure 7. Different Attributes of fault signature [EPRI 2012]. ................................................................... 21
Figure 8. Steps involved in gathering fault signature [EPRI 2012]. ........................................................... 21
Figure 9. List of fault features for oil pump motor fault types.................................................................... 24
Figure 10. Possible diagnosis of oil motor pump using the FW-PHM. ...................................................... 25
TABLES
Table 1. Concerns associated with major components of transformers. ....................................................... 4
Table 2. Fault types in transformers .............................................................................................................. 7
Table 3. Key gases and associated fault types. ............................................................................................. 8
Table 4. Gas generation at different temperature [EPRI 2006b]. ............................................................... 10
Table 5. The values are derived from information provided within [IEEE 1978]. ..................................... 10
Table 6. Possible fault indicators [Pamuk 2010]. ....................................................................................... 12
Table 7. Ranges for Doernenberg and Rogers ratios [Hamrick 2010]. ....................................................... 13
Table 8. Failure modes and contributing fault types considered. ............................................................... 22
Table 9. Summary of fault features used to diagnose fault types considered. ............................................ 23
xi
Table A1. Winding Insulation Degradation Fault Signature – General Specification. . ............................. 29
Table A2. Operating at High Temperature for Long Period. Technology: Operating History. ................. 31
Table A3. Insulation Oil Degradation Fault Signature – General Specification. ........................................ 32
Table A4. Loss of Dielectric Strength Oil Fault Feature – Technology: Oil analysis. ............................... 33
Table A5. Insulation Oil Acidity Fault Signature – General Specification. ............................................... 34
Table A6. Acidity of Oil Fault Feature – Technology: Oil analysis. .......................................................... 35
Table A7. Insulation Oil Contamination Fault Signature – General Specification. .................................... 36
Table A8. Interfacial Tension of Oil Fault Feature – Technology: Oil analysis. ........................................ 37
Table A9. Table A1. Loss of Dielectric Strength of Bushing Fault Signature – General
Specification. .............................................................................................................................. 38
Table A10. Doble Capacitance Fault Feature – Technology: Doble Analysis. .......................................... 39
Table A11. Oil Pump Motor Performance Loss – General Specification. .................................................. 40
Table A12. Motor Current Abnormal Value: Fault Feature. ...................................................................... 41
Table A13. Motor Insulation Resistance Megger Inspection: Fault Feature. ............................................. 42

xii
ACRONYMS
ANSI American National Standards Institute
AE Acoustic Emission
AFS asset fault signature
ASTM American Society for Testing and Materials
CBM condition based monitoring
CPT The Center for Photonics Technology
DGA dissolved gas analysis
DETC deenergized tap changer
DP degree of polymerization
EDG emergency diesel generator
EPRI Electric Power Research Institute
FW-PHM fleet-wide prognostic and health monitoring
GSU generator step-up transformer
IEC International Electrotechnical Commission
IEEE Institute of Electrical and Electronics Engineer
IFT interfacial tension
INL Idaho National Laboratory
KISS keep it simple stupid
K-NN k-nearest neighbors
LWR light water reactor
LTC load tap changer
LTO Long-Term Operations (Program)
NPP nuclear power plant
OLM online monitoring
PDC polarization/depolarization current
RUL remaining useful life
UHF ultra-high frequency

1
Online Monitoring Technical Basis and Analysis Framework for Large Power Transformers; Interim
Report for FY 2012
1. INTRODUCTION
The Light Water Reactor Sustainability Program is a research, development, and deployment program
sponsored by the U.S. Department of Energy Office of Nuclear Energy. The program is operated in
collaboration with the Electric Power Research Institute’s (EPRI’s) research and development efforts in
the Long-Term Operations (LTO) Program. The LTO Program is managed as a separate technical
program operating in the Plant Technology Department of the EPRI Nuclear Power Sector, with the
guidance of an industry advisory integration committee. Because both the Department of Energy Office
of Nuclear Energy and EPRI conduct research and development in technologies that have application to
establishing the feasibility of operating commercial light water reactors (LWRs) beyond the current
60-year license limits, it is important that the work be coordinated to the benefit of both organizations.
The Light Water Reactor Sustainability and LTO Programs are working closely with nuclear utilities
to develop instrumentation and control technologies and solutions to help ensure the safe life extension of
current reactors. One of the main areas of focus is centralized online monitoring (OLM). The centralized
OLM project has two subprojects: online monitoring of active components and online monitoring of
passive components.
Within the OLM of active components pilot project, generator step-up transformers (GSUs) and
emergency diesel generators (EDGs) are the two active components selected for which fault signatures,
diagnostic models, and prognostic models will be developed and implemented in existing nuclear power
plants (NPPs). The interim status of research activities associated with OLM for GSUs is presented in this
report. Parallel research on EDGs is being conducted and will be summarized in a separate interim report
during first quarter of FY 2013.
The current fleet of NPPs mostly performs periodic or condition based maintenance of their
transformers. The disadvantage of periodic health assessment is that the time interval between two
consecutive maintenance activities is not always sufficient to identify developing issues prior to failure.
Periodic maintenance is often performed when the transformer is not in service or the plant is in outage.
Moreover, the actual state of the transformer with respect to time and plant operation condition is often
not available for diagnosis. Periodic maintenance also frequently results in the maintenance of healthy
transformer components, increasing maintenance costs, and the possibility of human error.
Another technique used for assessing transformer health is condition based monitoring (CBM), a
reactive regime in which transformer maintenance is performed when a fault is identified based on
monitored parameters and state knowledge. CBM has been shown to reduce maintenance costs by
reducing the number of maintenance operations and the resulting possibility of human error.
The long-term objective of the OLM pilot project for active components is to implement predictive
online monitoring techniques that would enable NPPs to diagnose incipient faults, perform proactive
maintenance, and estimate the remaining useful life (RUL) of their active assets. Predictive or proactive
maintenance involves predicting future parameter values (or the actual state of the transformer). This
allows maintainers to take timely or proactive action before the occurrence of a catastrophic failure and to
estimate and optimize future maintenance costs.
EPRI is leading the effort to achieve the project objective in collaboration with Idaho National
Laboratory (INL). EPRI has developed the Fleet-Wide Prognostic and Health Monitoring (FW-PHM)
Software Suite (Beta Version 1.1) for predictive online monitoring of active assets. The open-architecture
integrated FW-PHM software has four main components:
2
• Diagnostic Advisor. Identifies impending failures by comparing asset fault signatures (AFS) with
operating data
• AFS Database. Organizes asset fault signatures collected from across the industry
• RUL Advisor. Estimates how long an aging or faulty asset will continue to provide reliable service
• RUL Signature Database. Organizes asset remaining life signatures collected from across the
industry.
Part of the long-term objective of the OLM of active components pilot project is to enable the nuclear
industry to implement online monitoring using the FW-PHM software on selected active components
such as GSUs. Prior to the implementation of the software by the industry, INL is performing beta testing
of the FW-PHM Software Suite. Beta testing will encompass installation and configuration, content-based
testing, data synchronization, and a human factors usability analysis.
GSUs are the main transformers that are directly connected to generators, stepping up the voltage
from the generator output voltage to the highest transmission voltages for supplying electricity to the
transmission grid. Identification and classification of different fault types in GSUs is a challenging task
because there are several factors that contribute to transformer degradation that may eventually lead to
catastrophic failure. These factors are associated with transformer age, operating conditions, and stressors
acting on the transformers. Dissolved gas analysis (DGA) has been found to be one of the most effective
online diagnostic tools. The information collected via DGA can also be used to estimate the RUL of
transformers. Implementation of OLM on GSUs based on DGA will enable utilities to diagnose incipient
faults, perform proactive maintenance, prevent unexpected catastrophic failure, minimize maintenance
cost, and improve plant economic competitiveness.
INL and EPRI have identified Shearon Harris Nuclear Generating Station (owned by Duke Energy
Progress) as a utility partner for GSUs. The monitoring information from the plant GSUs will be used to
define fault signatures associated with common fault types. These fault signatures will be entered in the
AFS database and will be used by the Diagnostic Advisor of the FW-PHM software to identify impending
failures.
This report is organized as follows. Background information on GSUs is introduced in Section 2,
including faults types, diagnostic techniques, and prognostic models. Section 3 briefly describes the FW-
PHM software suite. An overview of the beta testing process is presented in Section 4. Diagnostic fault
signatures for GSUs are presented in Section 5. The status of the pilot project and progress made with
partner utilities is provided in Section 6. The current state of research and future plans are summarized in
Section 7.

3
2. GENERATOR STEP-UP TRANSFORMERS
There are many different types of transformers. The basic principles of design, operation, and
maintenance apply across all transformer types, but there are significant differences in some areas,
particularly in application. EPRI has compiled a guidebook based on accumulated knowledge of
transformer design principles, operations, maintenance, and performance [EPRI 2011a]. This section
focuses on online monitoring of GSUs (also known as unit transformers or main transformers).
GSUs, which are directly connected to generators, step up the voltage from the generator output
voltage (on the order of 24 kV) to the highest transmission voltages for supplying electricity to the
transmission grid. The GSUs are physically the largest transformers in the system and are available in
single-phase or three-phase units. The primary winding (generator voltage) is connected in delta to
minimize the coil current and provide winding stabilization, and the secondary winding (grid voltage) is
connected in wye to minimize the coil voltage. The primary winding current can be as much as 40 kA,
and many special considerations in design and manufacture are required. The GSU generally will not
have a load tap changer (LTC) because regulation can be achieved at the generator, although some
utilities do require their GSUs to be equipped with LTCs. Most utilities, however, will require the GSU to
be equipped with deenergized tap changers (DETCs). GSUs used in nuclear and large coal fired power
plants are usually operated continuously at a constant load near the full rating. This means that they are
generally operated at rated temperature and therefore age more quickly than most other transformers.
GSUs often are not protected by a circuit breaker, meaning fault currents can be sustained longer than for
other transformers and large over voltages can occur from generator loss of load. When generator
breakers or disconnects are present, the GSUs can also be used to power auxiliary systems from the grid.
2.1 Major Components of Transformers
Most transformers consist of the following basic components:
1. Core. Transformer cores are built up of many thin laminations of cold-rolled, grain-oriented, silicon
steel (typically .009 to .014 in. thick) to minimize eddy loss. Rectangular and cruciform are two types
of core construction.
2. Winding. The basic winding conductors are rectangular in shape. Each individual winding conductor
is known as a strand, and is insulated by cellulose paper. There are three basic categories of winding
designs used in core form transformers (helical, disk, and layer), but there are many variations within
these basic categories. Some portion of the winding is used to increase or decrease the turns, so that
the output voltage can be regulated. This portion of winding is known as the tap winding.
3. Main Oil Tank. Tanks are designed differently for core-type and shell-type transformers. All tanks are
designed to withstand full vacuum and 15 psi internal pressure to facilitate proper processing of the
core and coil assemblies, and are filled with oil under vacuum at the time of installation. They must
also withstand the maximum operating pressure under all operating conditions plus the weight of the
oil column inside the tank.
4. Load tap changer.a The LTC is a switching device equipped with current-carrying contacts that are
connected to the regulating winding (frequently called a tap winding) of a transformer. Its purpose is
to change the transformer turn ratio and, thereby, the voltage while under load without interruption to
the power flow. The turn ratio is changed by either adding to or subtracting from turns of the
regulating winding.
5. Deenergized tap changer. The DETC is commonly called a no-load tap changer (a misnomer,
because this type of tap changer can only be operated when the transformer is deenergized, not just
a LTC is optional in GSUs.

4
operating at no load). The purpose of a DETC is to be able to change the output voltage by changing
the transformer turn ratio. A standard DETC has five positions, including the neutral position.
6. Bushings. The two most common types of bushings are solid porcelain bushings on smaller
transformers and oil-filled bushings on larger transformers such as GSUs. Bushings are a critical link
between the windings and the outside power delivery system. For high-voltage applications, like
GSUs, bushings are generally the oil-filled capacitance graded type. This type of bushing has a
central conductor surrounded by an oil impregnated capacitance graded core, which is encased by
upper and lower insulators and a metal flange assembly.
7. Cooling equipment. Transformers in general have a self-cooled rating (cooling because of convection
and radiation) and a forced-cooled rating (fans and/or pumps). GSUs do not have a self-cooled rating
as they are operated fully loaded most of the time. The cooling process within the transformer is
accomplished by the flow of oil out of the top of the transformer, through the heat exchanger, through
the pump, and into the bottom of the transformer.
Monitoring the operating condition (health) of the above-mentioned components contributes to the
overall health of the transformer. Each component has its own individual concerns that may result in its
failure. The concerns listed in Table 1 require special attention in aging transformers. The observations or
parameters associated with these concerns, and techniques to measure them, are discussed in Section 2.2.
Table 1. Concerns associated with major components of transformers.
Components Concerns
Core Loose core lamination; general core heating; unintentional core grounding
Windings Insulation deterioration; dielectric failure; static electrification; local heating
Main oil tank Oil contamination; loss of dielectric strength; corrosive sulfur; oil level
Oil filled bushing Insulation overheating; loss of seal/moisture ingress; delamination; surface
tracking; oil leaks
LTC/DETC Contact wear, bending, and overheating; oil deterioration; in-tank LTC oil leakage;
improper operation; excessive voltage swings
Cooling equipment Excessive wear of bearing; physical damage; temperature
2.2 Conditions Leading to Failure
As transformers age their ability to sustain the impact of stressors such as loading, increase in
operating temperature, etc., decreases, making them more susceptible to failure. There are several factors
that contribute to the degradation of transformer performance, and may eventually lead to failure. Some
of the common causes include paper insulation breakdown; oil contamination; moisture; overloading;
loose connections; external factors such as lighting, fire, flood; and design and material flaws.
The consequences of transformer failure in terms of cost can be understood from the scatter plot
shown in Figure 1. Paper insulation failure has the highest frequency and cost impact, followed by
design/material. Interestingly, unknown failure modes are the third largest contributor in terms of both
frequency and cost.

5
Figure 1. Frequency and severity of transformer failure in terms of cost [Bartley 2003].
2.2.1 Paper Insulation Breakdown
The severity of paper insulation degradation is difficult to estimate. The mechanical and dielectric
strengths of the paper insulation naturally reduce with age. Two major types of transformer paper
insulation are Kraft paper and pressboard. Insulation between individual windings, designed to protect
against discharge between transformer coils, is made of Kraft paper. Insulation around the entire
transformer coil itself is usually made of pressboard.
Many factors contribute to paper insulation degradation that may eventually lead to its failure. These
include but are not limited to: heat, oxidation, acidity, moisture, mechanical forces, voltage stressing, and
bubble formation [Bartley 2003; EPRI 2007]. Paper insulation is subjected to thermal stress because of
heat induced by the current carried through the winding and to chemical stress because of reactions
occurring within the material. These mechanisms reduce the material and dielectric strengths of the paper
insulation, subsequently weakening the overall health of the winding to an extent that a fault can cause
failure.
2.2.2 Oil Contamination
In oil-filled transformers, oil contamination is another aging and degradation concern. The two major
causes for oil contamination are humidity/moisture and particles/contamination. Moisture in oil can lead
to bubble formation during operation. These bubbles cause oxidation and reduce the dielectric strength of
the oil. Dirt and other particle contaminants can also collect in the insulating oil, thereby decreasing the
dielectric strength of the oil and forming sludge in the tank. Additionally, because of other electrical and
thermal discharges occurring inside the transformer, the hydrocarbon molecules of the oil decompose,
further reducing the dielectric strength of the oil. By measuring the levels of specific gases, other types of
internal degradation can be identified.

6
2.2.3 Moisture
Increased moisture in the oil tank is an indication that the seal between the high voltage terminal and
the bushing cap is compromised, allowing leakage between the fitting and the roof. Assessing the
moisture content in the oil should also take into consideration the moisture content in the insulation paper.
This assessment is usually deduced from a moisture equilibrium chart.
2.2.4 Overloading
Overloading represents a condition in which a transformer is subjected to higher-than nameplate
specified load for extended periods of time. This induces thermal and electric stress on the transformer,
thereby degrading its health. The degradation is accelerated in aged transformers.
2.2.5 Loose Connections
Loose connections can be caused by the improper mating of dissimilar metals and improper torquing
of bolted connections. Loose connections create thermal stress and vibration that can lead to debris in oil.
2.2.6 External Factors
External factors such as lighting, fire, and flood can cause catastrophic damage to transformers. These
factors cannot be accounted for in the design of monitoring techniques; having lighting arrestors and good
fire and flood protection systems can minimize the damage caused by these external factors.
2.2.7 Design and Materials
There are many factors that can arise from poor design or the use of low-quality materials, including
loose or unsupported leads, loose blocking, poor brazing, inadequate core insulation, inferior short circuit
strength, and foreign objects left in the tank.
2.3 Transformer Faults Types
To develop an online monitoring system, it is important to identify and understand fault types that
might occur because of aging and degradation. In the case of transformers, fault types can be broadly
classified as electrical, thermal, mechanical, and chemical fault types, as shown in Table 2.
There are different parameters associated with each fault type. An accurate diagnosis of a particular
fault using measured parameters is a challenging task because of significant overlap between different
fault types in the observed parameter space. In addition, lack of knowledge of the location of these faults
inside the transformer makes diagnosis an even more challenging problem.

7
Table 2. Fault types in transformers
Classification Faults
Electrical Partial discharge
Arcing
Static electricity
Floating potential
Electrical tracking
Dielectric breakdown
Mechanical Particles in oil
Insulation deterioration
Core and coil vibration
Oil pump bearing wear
Oil and air leak
Cracked LTC barrier board
Thermal Hot spots above 500ºC
Cellulose overheating
Lightning strikes
Moisture bubbling
Chemical Steel rusting
Water in contact with zinc coating
Moisture in oil
Sludge and acid formation
Depolymerization of cellulose
2.4 Transformer Diagnosis Using Online Monitoring
Online monitoring of transformers allows utilities to collect and correlate data while the transformer
is in service. Utilities can use the collected data to perform predictive maintenance, diagnose incipient
faults, and estimate RUL. Some of the key parameters collected from different locations within the
transformer include dissolved gases in oil, moisture in oil, top oil temperature, bottom oil temperature,
ambient temperature, cooling fan and pump status, load current, and tap changer information (when
applicable).
Transformer oil sample analysis is a useful maintenance tool for determining transformer internal
health. Along with the oil sample quality tests, performing a DGA of insulating oil is useful in evaluating
transformer health [Dong 2002]. The breakdown of electrical insulating materials and components inside
a transformer generates gases within the transformer. The identity of the gases being generated can be
very useful information in any maintenance program; predictive maintenance is further enhanced by
knowledge of the rate of gas generation. Of the several techniques used to detect gases generated inside
transformers, DGA is recognized as the most informative method. DGA can be performed both online
and offline.
2.4.1 Key Gases
All transformers generate gases to a certain extent at normal operating temperatures, but the two
principal causes of gas formation within an operating transformer are electrical disturbances and thermal

8
decomposition. Insulating mineral oils for transformers are a mixture of many different hydrocarbon
molecules, and the decomposition process of these hydrocarbons in thermal or electrical faults is
complex. The fundamental chemical reactions involve the breaking of carbon-hydrogen (C-H) and
carbon-carbon (C-C) bonds. These fragments can combine with each other to form the key gases:
hydrogen (H2), methane (CH4), acetylene (C2H2), ethylene (C2H4), and ethane (C2H6). When cellulose
insulation is involved, thermal decomposition or electric faults produce methane (CH4), hydrogen (H2),
carbon monoxide (CO), and carbon dioxide (CO2). The gases generated are measured in parts per million
by volume (ppm v/v).
The key gases mentioned above are combustible gases. The total of all combustible gases may
indicate the existence of any one or a combination of thermal, electrical, or corona faults. The primary
faults associated with each of the key gases are presented in Table 3. In addition to the key gases, Oxygen
(O2) and nitrogen (N2) are also generated, even under normal operating conditions; a low O2/N2 ratio
indicates excessive heating inside transformer.
Table 3. Key gases and associated fault types.
Gas (ppm v/v) Fault (Type)
H2 Partial discharge (electrical)
CO and CO2 Cellulose degradation breakdown (thermal)
CH4 and C2H6 Low temperature oil decomposition (thermal)
C2H4 High temperature oil decomposition (thermal)
C2H2 Arcing (electrical)
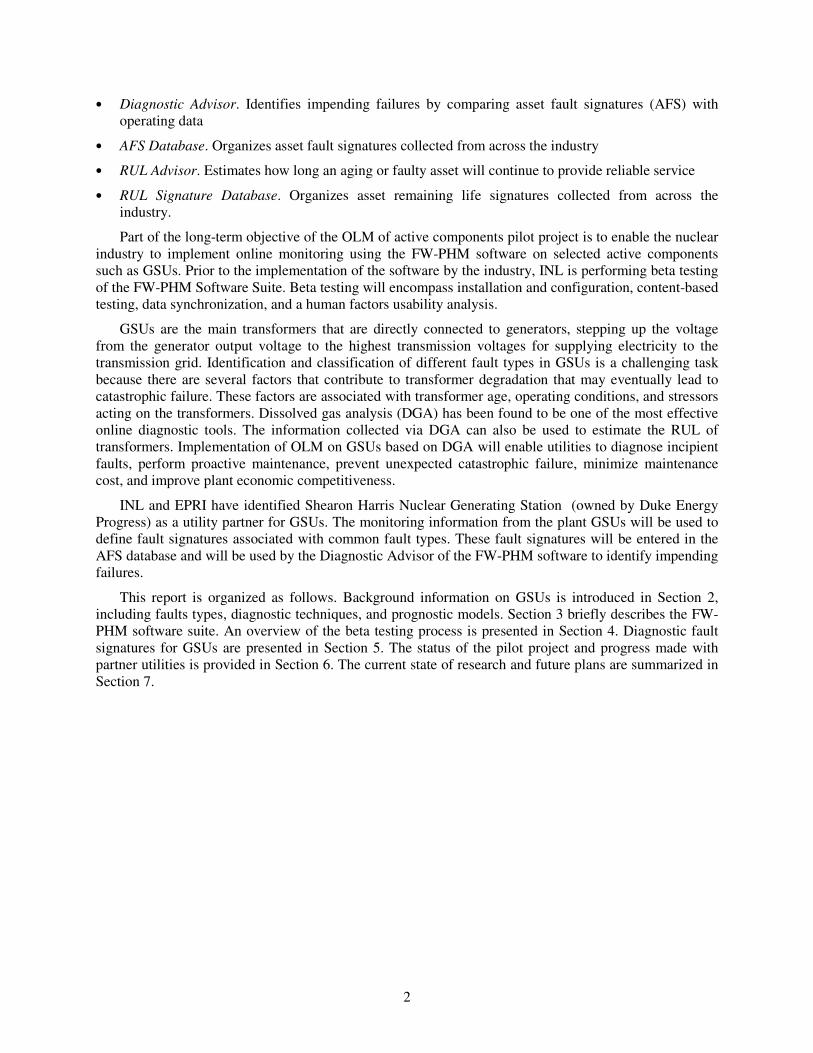
DGA can distinguish between partial discharge and arcing. Partial discharges produce mostly H2 in
the oil, with very small amounts of other hydrocarbon gases and no C2H2. Arcing, from the largest power
breakdown to the tiniest discharges, produces C2H2 along with hydrogen and other hydrocarbons, which
can be tested as described in the American Society for Testing and Materials (ASTM) D1816 standard.
As a result, the discovery of C2H2 is a strong indicator that arcing has taken place. Partial discharge takes
place in gas bubbles or voids where voltage stress is sufficient to initiate electron avalanches and more
extensive oil ionization. Prolonged corona activity in oil produces transformer wax and large amounts of
hydrogen, but practically no carbon. Typical gas composition for these two types of faults is shown in
Figure 2.
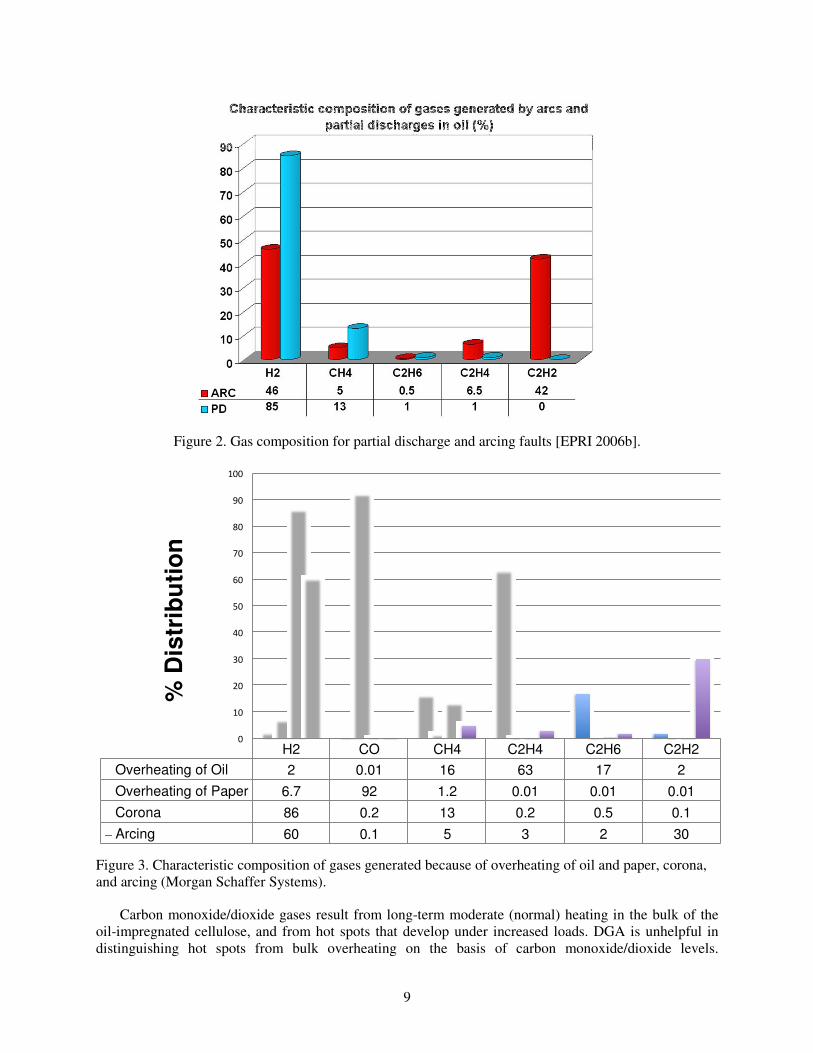
The characteristic composition of gases due to overheating of oil and paper, corona, and arcing are
shown in Figure 3. The percentage of distribution of gases can vary depending upon the volume of oil and
temperature. Therefore, establishing a nominal value of these gases for different transformer types, size,
and application is a challenge. Figure 3 shows that both corona and arcing generate a large percentage of
H2, but arcing results in higher percentage of acetylene generation as compared to corona.
DGA can differentiate thermal faults in oil from those in oil-impregnated paper based on the levels of
hydrocarbon gases compared to carbon monoxide/dioxide. Significant production of hydrocarbon gases
requires very high temperatures (>400°C). The production of carbon monoxide/dioxide from paper
requires only moderately elevated temperatures (>150°C). The high temperatures required to thermally
decompose oil result primarily from direct contact with a hot metal surface. In transformers, these
conditions are typically produced by overheated joints between conductors, excessive circulating currents,
and core overheating. Elevated ethylene levels and only trace amounts of acetylene are strong indicators
of thermally decomposing oil. This may occur at overheated joints at the top of bushings.
9
Figure 2. Gas composition for partial discharge and arcing faults [EPRI 2006b].
Figure 3. Characteristic composition of gases generated because of overheating of oil and paper, corona,
and arcing (Morgan Schaffer Systems).
Carbon monoxide/dioxide gases result from long-term moderate (normal) heating in the bulk of the
oil-impregnated cellulose, and from hot spots that develop under increased loads. DGA is unhelpful in
distinguishing hot spots from bulk overheating on the basis of carbon monoxide/dioxide levels.
H2 CO CH4 C2H4 C2H6 C2H2
Overheating of Oil 2 0.01 16 63 17 2
Overheating of Paper 6.7 92 1.2 0.01 0.01 0.01
Corona 86 0.2 13 0.2 0.5 0.1
Arcing 60 0.1 5 3 2 30
0
10
20
30
40
50
60
70
80
90
100
% D
istr
ibu
tio
n

10
Moderately heated oil-impregnated cellulose will also produce minor amounts of hydrogen, methane,
ethane, and ethylene but no acetylene. Hydrocarbon gases typically come from the oil, however the
additional presence of high levels of hydrogen implicates cellulose degradation.
The rate at which key gases are generated depends on the temperature and on the volume of insulation
oil at that temperature. Table 4 shows the effects of temperature on key gas generation. Because of the
volume effect, a large, heated volume of insulation at moderate temperature will produce the same
quantity of gas as a smaller volume at a higher temperature. It is recommended that values of the key
gases be trended over time so that the rate-of-change of the various gas concentrations can be evaluated.
Any sharp increase in key gas concentration is an indication of a potential problem within the
transformer. There are many threshold levels recommended by various organizations such as Institute of
Electrical and Electronics Engineer (IEEE), International Electrotechnical Commission (IEC), Powertech
Labs Inc., etc. based on the type of transformer and its operating condition.
Table 4. Gas generation at different temperature [EPRI 2006b].
Paper Temperature
(°C)
Rates of gas formation from paper, in ppm/year/Kg of paper/50,000 l of oil
C2H2 H2 CH4 C2H4 C2H6 CO CO2 CO2/CO Ref.
125 0 0.4 0.3 — — 4 220 50 a
135 0 0.3 0.4 — — 5 230 42 a
160 0 40 12 3 3 122 1830 15 b,c
250/300 0 123 200 85 38 23400 78000 3.5 a
a B. Noirhomme, Hydro Quebec.
b M. Martins, Labelec.
c H. Foschum, Va Tech.
Based on the normal levels defined by IEC and Powertech Labs Inc., EPRI developed five condition
diagnosis codes for transformers; for details on the condition codes, see [EPRI 2006b]. If the key gas
concentration levels rapidly rise above normal levels, it is advisable to perform a confirmatory test by
performing other analysis, such as gas ratio analysis.
Table 5. The values are derived from information provided within [IEEE 1978].
Gas Description
Key Gas Concentration (ppm)
Normal Limit
(<)
Action Limits
(>) Potential Fault Type
Hydrogen H2 150 1000 Corona, arcing
Methane CH4 25 80 Sparking
Acetylene C2H2 15 70 Arcing
Ethylene C2H4 20 150 Severe overheating
Ethane C2H6 10 35 Local overheating
Carbon monoxide CO 500 1000 Severe overheating
Carbon dioxide CO2 10,000 15,000 Severe overheating
Total Combustibles TDCG 720 4630
2.4.2 Gas Ratios
Note in Table 5 that if C2H4, CO, and CO2 levels exceed the action limits, the potential fault type is
severe overheating; it is not clear whether the overheating caused cellulose decomposition. Other analysis
11
techniques are needed to resolve this question. Some of the most commonly used techniques include the
application of IEEE C57.104-1991, Doernenburg ratios, Rogers ratios, IEC 60599, and Duval’s Triangle
Model [Duval 2002].
Doernenberg ratios and Rogers ratios are recognized in the ANSI/IEEE C57.104 [IEEE 1978] and are
equivalent to the Basic Gas ratios in the IEC standards. The evaluation method applied for Doernenberg
ratios and Rogers ratios utilizes the following gas ratios: CH4/H2, C2H2/C2H4, C2H2/CH4, C2H6/C2H2 and
C2H4/C2H6. The use of ratios is warranted because of the varying rates of the combustible gas generation
with temperature and energy variations for different fault modes. They are also warranted because gases
dissolve into the mineral oil at different rates. Fault diagnosis is accomplished via a simple scheme based
on ranges of the ratios. Different failure modes and associated ranges are listed in Tables 6 and 7
respectively.
The Duval Triangle method, developed by Michel Duval [Duval 2002] uses the concentration (in
ppm) of methane (CH4), ethylene (C2H4), and acetylene (C2H2), expressed as percentages of the total to
diagnose the fault. A point (value) corresponding to the percentage of three gases are plotted on a
triangular chart, which has different fault zones. The fault zone boundaries are determined empirically
based on large amounts of fault data collected over 60 years. The Duval triangle chart is shown in
Figure 4. The triangle coordinates are calculated as:
%���� =100
+ � + � ��ℎ = [����]
%���� =100�
+ � + � ��ℎ� = [����]
%���� =100z
+ � + � ��ℎz = [���].
Other ratios used in the diagnosis include: CO2/CO ratio; O2/N2 ratio; and C2H2/H2 ratio.

12
Table 6. Possible fault indicators [Pamuk 2010].
Failure
Mode
Definition of
Failure Description
PD Partial discharge Gas-filled cavities are caused by inadequate impregnation, excess
moisture in the paper, excessive saturated oil, oil vacancy, and X-wax in
the cavity formed by the line conductor discharges where it occurred.
D1 Discharge at low
energy
Have different potential in a bad connection, display public, in toroid,
winding or conductor adjacent to the disc, broken in welding or soldering,
core in the closed lip and arc occurring.
Fittings, bushing-tank, high-voltage, and line-to-earth (core, tank, yoke)
between the discharges.
Board materials, adhesives and insulation between the windings formed
on the dielectric discharges occurring on roads.
Oil drilling, under LTC selector switch and cutting current.
D2 Discharge at high
energy
Jumps, ways of conducting discharge, high energy and their power in
local arc to continue.
Low-voltage-to-ground, bushing-tank, winding-core, copper bar between
the tank link, coils in the oil ducts and pipes caused in short-circuit.
Insulation between conductors, core insulation of the screws holding the
arm and the core of the metal ring around the magnetic fluxes occurrence.
T1 Thermal faults T
< 300°C
The work overload of the transformer in case of emergency.
Flux between the windings and oil reduction of blockages.
The uneven pressure iron yoke leakage flux.
T2 Thermal faults
300 < T < 700°C
Selector switch positions in the bolted connections between the contacts
are damaged badly in contact, the contact shifts in the carbon formation,
bad contacts in the cable and bushing connection.
Connection between the yoke and bolts and connections between the hair,
grounding wire, the magnetic screen or in the worst sources connection
(in print) caused by circulating currents.
Side-by-side between the windings of the parallel conductors in the
insulating material wears.
T3 Thermal faults T
> 700°C
Tank and a large circulating current in the core.
Unbalanced high magnetic fields, a smaller tank that was caused by
currents in the wall.
Short circuits that occur in the core.
2.4.3 CO2/CO Ratio
The ratio of CO2/CO is sometimes used as an indicator of the thermal decomposition of cellulose. The
rate of generation of CO2 typically runs 7 to 20 times higher than CO. It is therefore considered normal if
the CO2/CO ratio is above 7. A CO2/CO ratio less than 5 is indicative of a problem. If cellulose
degradation is the problem, CO, H2, CH4, and C2H6 will also be increasing significantly. At this point, it is
recommended that additional furan testing be performed. If the CO2/CO ratio is 3 or under with increased
furans, severe and rapid deterioration of cellulose is occurring and consideration should be given for
taking the transformer out of service for further inspection.

13
Table 7. Ranges for Doernenberg and Rogers ratios [Hamrick 2010].
Fault Type
T1 T2 T3 D1 D2
Ratio Description Gas Ratio Thermal Fault
< 300°C
Thermal
Fault
300–700°C
Thermal
Fault
> 700°C
Low
Energy
Discharge
High
Energy
Discharge
Doernenberg Ratios
R1 – Methane/Hydrogen
R2 – Acetylene/Ethylene
R3 – Acetylene/Methane
R4 – Ethane/Acetylene
CH4/H2
C2H2/C2H4
C2H2/CH4
C2H6/C2H2
1.0 < R1
R2 < .75
R3 < 0.3
R4 < 0.4
R1 < 0.1
R3 < 0.3
0.4 < R4
0.1 < R1 <1.0
0.75 < R2
0.3 < R3
R4 < 0.4
Rogers Ratios
R1 – Methane/Hydrogen
R2 – Acetylene/Ethylene
R5 – Ethylene/Ethane
CH4/H2
C2H2/C2H4
C2H4/C2H6
1.0 < R1
R2 < 0.1
1.0 < R5 < 3.0
1.0 < R1
R2 < 0.1
1.0 <R5 <3.0
< R1
R2 < 0.1
3.0 < R5
R1 < 0.1
R2 < 0.1
R5 < 1.0
0.1 < R1 <1.0
1.0 < R2 < 3.0
3.0 < R5
Figure 4. Duval triangle chart [Duval 2002].
2.4.4 O2/N2 Ratio
During the breakdown of C-H and C-C bonds to form key gases, nitrogen and oxygen gases are also
generated but are not used individually as the guide gases for fault diagnosis. Excessive pressure in the
system provides useful information on leaks and temperature changes. Oxygen is the gas responsible for
the deterioration of cellulose material and the oil, hence oxygen level needs to be as low as possible. The
rapid decline of oxygen levels indicates changing oil properties; the formation of other gases indicates
overheating. Temperature changes in gas-insulated systems affect the amount of nitrogen. When the
insulation oil is heated and cooled, the nitrogen gas pressure fluctuates. These fluctuations change the
concentration of nitrogen relative to other gases. The O2/N2 ratio in healthy transformers should be
near 0.5. When this ratio falls below 0.3, the insulating oil is subjected to oxidation.

14
2.4.5 C2H2/H2 Ratio
The operation of tap changers creates low-energy discharges, resulting in gas formation. As the
C2H2/H2 ratio in the main tank approaches a threshold limit, it indicates that the level tank pollutes the
main tank. However, the C2H2/H2 rate and the amount of acetylene formed are dependent on the number
of tap changer operation, and the contamination level depends on the size of the main transformer.
Water in the electrical equipment should always be maintained at the lowest possible level. Water
found in a free state (dissolved in oil or insulating paper) always has a negative impact on the equipment.
Hydrated cellulose materials are subjected to corona. Increased water temperature yields higher levels of
hydrogen in the core, causing the release of air and leading to unwanted electrolysis events.
When cellulose insulation decomposes because of overheating, furanic compounds are released and
dissolved into the oil, along with CO and CO2. In healthy transformers, there are no detectable furans in
the oil (<100 ppb). As the cellulose degrades, the furan levels will increase. Furan levels of 500–1000 ppb
are indicative of accelerated cellulose aging, with furan levels >1500 ppb indicating a high risk of
insulation failure.
2.5 Deenergized Transformer Testing
NPPs perform routine maintenance and testing of deenergized transformers, often during plant
outages. This work includes: power factor testing, infrared testing, transformer turn ratio testing, oil
moisture testing, interfacial tension (IFT) testing, dielectric breakdown testing, and degree of
polymerization (DP) testing.
Power factor testing, also known as doble testing, is an effective way to detect defective electrical
equipment insulation, contaminants, and, to an extent, moisture in the transformer winding. The power
factor is the ratio of the capacitive or charging current to resistive or leakage current. Power factor values
close to unity are preferred.
Infrared testing is used to identify hot spots both inside and outside a transformer, and can also be
used to check the effectiveness of the cooling system.
Transformer turn ratio testing is performed to detect impending breakdown in windings or insulation.
The direct correlation between numbers of turns (both primary and secondary side) to the voltage is used
to deduce the breakdown. The extent of voltage deviation from nameplate values is a direct indication of
winding degradation.
Oil testing involves collecting oil samples and then sending the samples for laboratory testing to
measure the dissolved gas concentration (this is equivalent to offline DGA). Oil sampling enables
maintenance personnel to deduce moisture level, IFT, and dielectric breakdown. An increase in oil
contamination and moisture level reduces the IFT. The color of the collected oil sample is also often a
good indication of the dielectric strength of the oil.
The DP test is another means for assessing insulation aging. This test is performed on paper samples.
The DP test provides an estimate of the average polymer size of the cellulose molecules in materials such
as paper and pressboard. Paper in new transformers generally has a DP near 1000. Aged paper with a DP
of 150 to 200 has little remaining mechanical strength, and therefore makes windings more susceptible to
mechanical damage during movement, particularly during extreme events such as through-faults. As
insulation aging in transformers can be uneven because of thermal, moisture, oxygen, and byproduct
concentration, gradients samples from various locations are needed to provide the best diagnosis of the
overall insulation condition.

15
2.6 Diagnostic Techniques for Fault Classification
Paper insulation failure is the most common and frequent type of failure. The primary cause of paper
insulation degradation is electrical discharge—partial discharge and arcing. DGA is one of the most
effective tools to detect electrical discharges, hot spots, and other types of faults inside transformers by
measuring the level of dissolved gases. Saha [2003] provides a review of techniques used to diagnose the
condition of insulation in aging transformers using DGA. Statistical learning techniques can be used to
classify these faults and assess the condition of transformers. Shintemirov et al. [2009] used a
bootstrapping technique to resample faulty samples and extract classification features using genetic
programming. The resulting features were used as the inputs to artificial neural network, support vector
machines, and K-nearest neighbors (K-NN) classifiers to perform multiclass fault identification. Ma et al.
[2012] use DGA and polarization/depolarization current (PDC) information independently and in
combination to extract features that are used as an input to support vector machines. PDC information can
also be used to assess the paper insulation condition in transformers [Bhumiwat 2004]. DGA is also used
to assess condition of oil filled bushing [EPRI 2006b]. Lin et al. [1993] developed an expert system based
on fuzzy set concept to diagnose faults in transformers.
One of the limitations of DGA is its inability to deduce the location of electrical discharge inside the
transformer. Therefore, there has been a wide interest in developing sensors that can be placed inside
transformers to monitor dissolved gases and use acoustic waves to identify the location of discharges. An
electric discharge results in the generation of acoustic waves.
EPRI, in collaboration with The Center for Photonics Technology at Virginia Tech, has developed an
acoustic fiber-optic sensor intended for locating and detecting electrical discharge (partial discharge in
particular) based on acoustic emission (AE) [EPRI 2005; EPRI 2007]. Fiber-optic sensors made from
dielectric materials, such as fused-silica glass and sapphire, are inherently immune to electromagnetic
interference. Based on the AE data collected from different transformer locations, the NOESIS® software
was developed based on the Learning Vector Quantizer, a Kohonen unsupervised neural network [EPRI
2005, EPRI 2007]. The Learning Vector Quantizer classifier was trained on a data set collected from a
gassing unit.
EPRI also developed a sensor highway system that combined AE and vibration signals for fault
diagnosis in LTCs [EPRI 2006a]. EPRI, in collaboration with The Center for Photonics Technology, has
also developed fiber-optic sensors to measure hydrogen and acetylene concentration [EPRI 2006a].
Judd et al. [2004] showed that ultra-high frequency (UHF) monitoring can be used to isolate partial
discharge arcing; at least three sensors are required to determine the actual location of the partial
discharge arcing. UHF sensors may be mounted external to the transformer through dielectric windows,
which would be straight forward to install during manufacturing and may be possible to retrofit to
existing transformers in service [Judd et al. 2004]. One drawback of UHF testing is the shear amount of
data that is generated [Catterson 2008]. In addition to detecting partial discharge, UHF sensors can be
used for active interrogation of the mechanical structure to detect displacement. After potentially
damaging events, such as through faults, harsh loading, or physical deformation, the same UHF sensors
installed for partial discharge monitoring could be used to determine if the internal structure of the
transformer has been permanently altered or has returned to its original state [Judd 2004].
Utilization of different monitoring techniques, different forms of information, and knowledge about
transformer current age and operating condition will enable maintenance personnel to perform predictive
diagnosis and prognosis.
2.7 Transformer Prognosis
There has been a wide interest across different industries to accurately estimate the RUL of
transformers, especially GSUs. Accurately estimating RUL would reduce maintenance cost and prevent

16
unplanned outages, which are highly undesirable because they are the key links between the power
generating station and the transmission grid.
An accurate estimation of transformer RUL is affected by a number of operating factors, including
transformer load, ambient temperature, moisture in the oil, oxygen content in the oil, oil level, the
condition of the cooling system, and oil contamination. Many studies have observed that an estimate of
transformer insulation RUL is sufficient to estimate the transformer RUL, as paper insulation failure, the
most frequent failure mode for transformers, can be catastrophic [Muthanna 2006; Pradhan 2005].
Muthanna et al. [2006] simulated and modeled the time of failure of the insulation of GSUs given the
operating history of the transformer. The simulation to predict the transformer insulation life took into
consideration the actual load variations per hour, ambient temperature, and average load variation per
year. The IEEE Life model was used to model the thermal aging of insulation and to predict the
transformer insulation life. An alternative approach to predict transformer insulation life based on
statistical renewal theory was proposed. Interesting reliability metrics were calculated using renewal
theory, including time taken to consume x% of design life and the probability of lasting X years.
Pradhan et al. [2005] developed a semiempirical expression to estimate the loss of life in transformers
by analyzing the gas content and the concentration of furfural dissolved in the insulating oil. Hong et al.
[2009] applied standard statistical techniques to the left-truncated, right-censored transformer lifetime
data for transformers in service from 1980 to 2008. The authors divide transformers into old and new
transformers (transformers put into service prior to and after 1987) to account for the shift in transformer
reliability during this time.
Coble et al. [2011] and Strong et al. [2011] simulated ambient temperature, DP, water contamination
in paper insulation, furan concentration, winding temperature, and oil contamination. Different prognostic
techniques, including general path models, neural networks, and kernel regression, were used to estimate
the RUL of transformer based on simulated data.

17
3. FW-PHM SOFTWARE SUITE
The FW-PHM is an integrated suite of Web-based diagnostic and prognostic tools and databases,
developed for EPRI by Expert Microsystems, specifically designed for use in the commercial power
industry (both nuclear and fuel). FW-PHM serves as an integrated health management framework, as
shown in Figure 5, managing the functionality needed for a complete implementation of diagnostics and
prognostics [Lybeck 2011]. As part of this pilot project, INL is beta-testing the software, along with other
EPRI members.
Figure 5. Data flow in the EPRI software suite [EPRI 2011b].
3.1 Software Description
FW-PHM is built with an open architecture, and is based on a reference database of power industry
asset types, fault types, and technology examination types. There are four modules that provide the key
functionality of the software. The Diagnostic Advisor identifies impending failures by comparing fault
signatures with operating data. The AFS Database organizes fault signatures collected across the industry.
The Remaining Life Advisor estimates how long an aging or faulty asset will continue to provide reliable
service. The Remaining Useful Life Database organizes asset RUL models collected across the industry.
EPRI Report [EPRI 2011b] includes a product summary.
The software suite is designed to run on both 32-bit and 64-bit versions of Windows Server 2003,
Windows Server 2008, and Windows 7 Operating Systems. The Web Client is designed to run from
Internet Explorer 6, 7, and 8 on any windows operating system newer than Windows XP Service Pack 3.
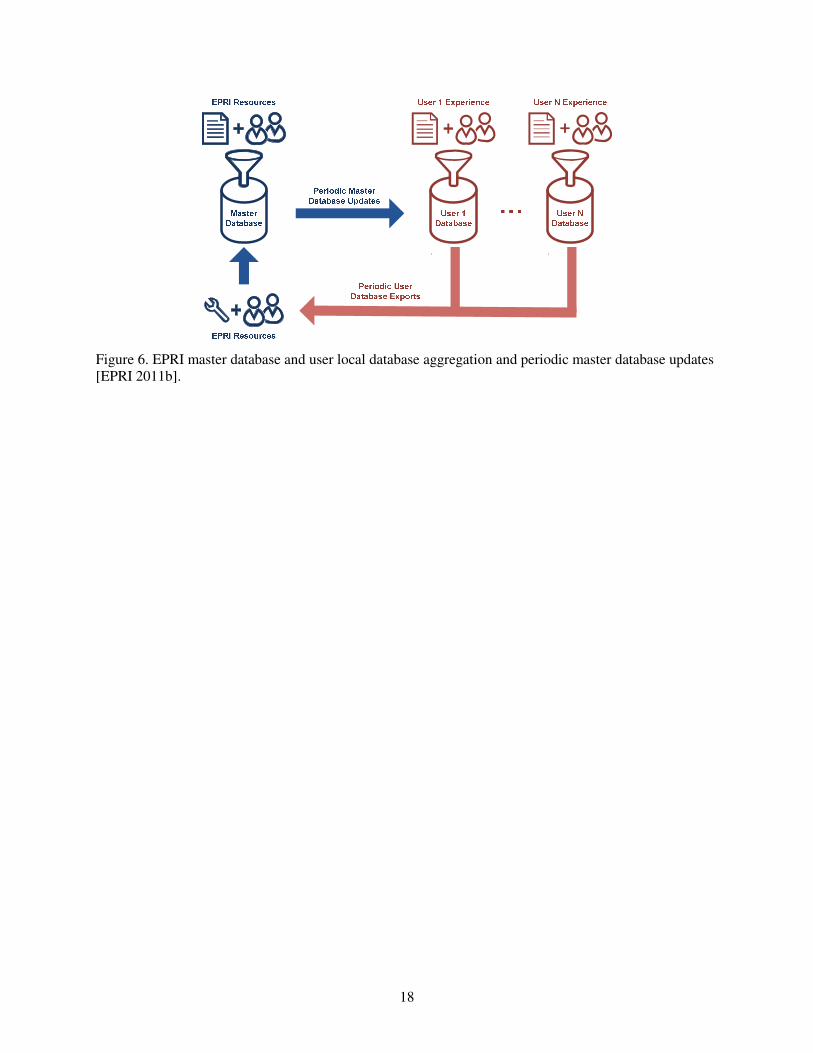
Each implementation of the FW-PHM consists of the EPRI master database and a local user-
developed database. Users may choose to periodically export their databases for inclusion in the EPRI
database as shown in Figure 6. EPRI will evaluate new information for inclusion in the master database,
and periodically publish updates to the master database.
18
Figure 6. EPRI master database and user local database aggregation and periodic master database updates
[EPRI 2011b].

19
4. BETA TESTING APPROACH
Beta testing is currently in progress. The information presented here describes the general approach to
beta testing; full results will be presented to EPRI at the conclusion of testing. Beta testing will
encompass installation and configuration, content-based testing, data synchronization, and a human
factors usability analysis.
4.1 Installation and Configuration
The software has been installed and configured for use at INL. All components were installed on a
single Virtual Machine with a Windows Server 2008 R2 Operating System. The database technology
deployed was Oracle 11g. The software has been configured for multiple users.
4.2 Content-Based Testing
The primary goal of beta-testing at INL is content-based testing. Tests will be based on the GSU
Transformer and the EDG systems. Based on research and input from industry, several fault modes of
interest will be identified and entered into the AFS database, along with the associated fault signatures.
Appropriate technical examinations will then be defined and entered into the database. Test scenarios will
be developed and implemented to evaluate and document the ability of the software to offer the most
appropriate diagnosis (or diagnoses) for an incomplete set of symptoms.
Additionally, a real-life prognostic model (not necessarily directly applicable to the GSU Transformer
or the EDGs) will be implemented in the RUL database. The model will be implemented using several
test scenarios in the RUL advisor to ensure correct implementation and functionality.
4.3 Data Synchronization
INL has already tested the procedure to install an updated version of the master EPRI database. As
part of continued testing, the INL local database will be exported and sent to EPRI to evaluate the data
synchronization process.
4.4 Human Factors Usability Analysis
Usability can be defined as the science of making technology work for people. Analyzing novel
software applications from a Human Factors perspective significantly contributes to a user-centered or
user-friendly design—a design that meets the goals, needs, and limitations of the software user. Failing to
focus on the user early in the design process is a critical and common error with Human Factors
professionals brought in at the eleventh hour to provide a detailed usability review or sign off on a
finished product. Increased attention to the user from the beginning contributes significantly to a better
product in terms of cost and efficiency. Indeed, rich functionality is worth little if it cannot be accessed by
the very user for which it is intended [Human Factors International].
A Human Factors usability analysis examines a number of features relating to software applications.
Among these are: learnability, ease of use, accessibility, intuitiveness, efficiency, simplicity, and
consistency. These seven aspects of usability will be employed to evaluate the EPRI On-Line Monitoring
software application.
4.4.1 Learnability
Learnability refers to the ease by which a user learns to use a software interface.
4.4.2 Ease of Use
Ease of Use refers to the ease by which a user manipulates controls or displays within the software
interface.

20
4.4.3 Accessibility
Accessibility focuses on a number of navigation tools within an interface. The speed by which a site
loads may significantly affect a user’s perception of the software. Waiting extended periods of time for
the site to load creates impatience in the user, which may lead to resistance in using the tool. Main menu
navigation is another critical component of an accessible user interface. Forcing the user to rely on back
and forward arrows or clicking to “x out” of a page to return to the Main Menu may increase frustration
levels and reduce levels of patience in users. Rather, a prominent icon displayed consistently throughout
the interface allows the user to return time and again to the Main Menu, saving time and increasing
accessibility. It is critical that an interface feature a prominent site search tool as well as a prominent help
tool. It is best that each be represented by easily identifiable icons commonly used to represent these
tools, such as a magnifying glass or search box for the search tool and a question mark for the help tool.
4.4.4 Intuitiveness
Intuitiveness refers to information provided to the user when accessing the software interface. Users
may ask two questions of the interface: Does the technology do what the user expects it to do? Does the
technology provide enough information to indicate the functions it provides?
4.4.5 Efficiency
Efficiency refers to the means by which the user learns the interface and how quickly thereafter the
user can carry out the tasks intended.
4.4.6 Simplicity
A well known design principle acronym coined by Lockheed Engineer Kelly Johnson is KISS (keep it
simple stupid). The KISS principle states that most systems work best if the key goal is simplicity,
eschewing complexity at every opportunity. Example of KISS would be adherence to a favorable, yet
simple approach to text/ background contrasts. Despite the multitude of options available, the merits of a
classic black font on a white background cannot be disputed. This display reduces visual clutter and
enhances readability.
4.4.7 Consistency
Along with the merits of simplicity, consistency throughout an interface is critical to a well-designed
software interface. Consistent layouts, headings, style, and color throughout link the contents of the
interface and add to the overall effect while too many font styles, sizes, graphics, and colors create a
chaotic, choppy effect.

21
5. DIAGNOSTIC PATHWAY SPECIFICATIONS FOR GSUs
The steps followed in EPRI [2012] to develop diagnostic fault signature information for large motor
driven pumps are also followed here to develop fault signature information for GSUs. A diagnostic fault
signature for GSUs is elicited from Shearon Harris Nuclear Generating Station experts and stored in the
AFS database. As defined in [EPRI 2012], a fault signature is a structured representation of the
information that an expert would use to first detect and then verify the occurrence of a specific type of
fault. A fault describes a particular mode of degradation that can be detected by analysis of plant
information before the asset condition reaches the point of failure to meet a service requirement. Implied
is an assumption that the fault is detectable by analysis of plant information and that the analysis can be
performed in time to prevent or otherwise remedy the fault condition before it becomes a failure
condition.
A fault signature has three information attributes: Asset Type; Fault Type; and Fault Features, as
shown in Figure 7. The steps followed to populate the AFS database with different fault signatures are
shown in Figure 8.
Figure 7. Different Attributes of fault signature [EPRI 2012].
Figure 8. Steps involved in gathering fault signature [EPRI 2012].
Asset Type
– Attributes
• Values
– Subtype
Fault Type
– Attributes
• Values
Tech Exam Type
– Location
– Result Type
– Attributes
• Values
Fault Feature
– Tech Exam Type
– Result Value
– Effectiveness
Fault Signature
– Asset Type
– Fault Type
– Fault Feature(s)

22
5.1 Asset Type Definition
Diagnostic fault signature information will often be uniquely applicable to a specific type of asset.
Although fault signatures are developed and organized with reference to a specific type of asset, it is
desirable to specify fault signatures to apply as broadly as possible. The fault signatures detailed in this
section are defined with reference to a particular configuration of a GSU transformer used in a nuclear
plant service environment. However, many of the fault signatures defined in this section might be applied
to similar assets used in similar service environments. The applicability of the following fault signatures
is limited to:
• Plant Types: Nuclear steam type
• Unit Types: Pressurized water reactor
• System Types: Electrical system
• Equipment Type: GSUs
• Component Types: Winding insulation, insulation oil, LTCs, bushings, cooling fans, pumps
5.2 Fault Type Definition
Objectives for the initial meeting with Duke Energy Progress were to elicit several diagnostic fault
signatures for GSU transformers; this knowledge will subsequently be captured in the AFS database.
The failure modes addressed during the meeting are listed in Table 8. Each failure mode listed in Table 8
can result from one or more fault conditions progressing to the listed failure condition. A primary purpose
of this document is to capture and report the results of an elicitation of diagnostic signatures for the
primary types of faults known to progress to these failure modes in GSUs.
Table 8. Failure modes and contributing fault types considered.
Failure Mode Contributing Fault Types
Insulating Oil Breakdown Loss of dielectric strength of insulating oil
Insulating Oil Acidity
Insulating Oil Contaminated
Winding Insulation Degradation
Acidity level of the insulating oil
Water ingress in the insulating oil
Thermal degradation of winding insulation
Particulate contamination of oil
Loss of dielectric strength of winding insulation
Damage of winding insulation while maintenance activity
Water ingress into the oil
History of operation at high temperature for sustained period
Bladder tank leak in the conservator
Bushing Degradation Loss of bushing dielectric strength
Water ingress in the bushing
Cooling System Failure Oil pump motor performance
Loss of electric power
Bad breaker
Oil pump fan

23
5.3 Fault Feature Definition
A fault feature describes a characteristic of plant information that can be used to detect and verify that
a specific type of fault is occurring. Determining the presence of a fault feature typically involves an
analysis of plant data. For example, plant data might include a temperature reading of 100°C and an
analysis of that data might determine that the data is Low, Normal, or High in the operating context of the
asset. A fault feature might then be expressed by stating that a High value of this particular type of
temperature measurement is an indicator that a particular fault type is occurring for the asset associated
with the temperature measurement. Data analysis can be used to determine the thresholds for Normal or
Abnormal; abnormal values can be low or high depending on the type of data.
The fault features listed in Table 9. are used to diagnose the fault types considered for the failure
modes listed in Table 8.
Table 9. Summary of fault features used to diagnose fault types considered.
Feature Type Location Possible Values
Inspection: Oil Level Main Oil Tank
Normal
Low
Inspection: Top Oil Temperature Main Oil Tank
Normal
Marginal
High
DGA: Oil Moisture Main Oil Tank
Normal
Abnormal
DGA: Oil Gas Main Oil Tank
Normal
Marginal
High
Oil Analysis: Particle Count Main Oil Tank
Normal
Abnormal
Maintenance Action: Oil Replacement Insulating oil supply: Reservoir
Normal
Recent
Very Recent
Inspection: Oil Color Change Main Oil Tank
Normal
Abnormal
Loss of dielectric strength Insulation Winding
Oil Analysis: Interfacial Tension Main Oil Tank Normal
Abnormal
Doble Analysis: Doble Capacitance Bushing Normal
Abnormal

24
Feature Type Location Possible Values
Current Transformer: Motor Current Motor Lead Current Probe Normal
Abnormal
Megger Inspection: Motor Insulation Resistance Pump Motor
Fan Motor
Normal
Abnormal (low)
Power Transformer Potential: Motor Ground
Potential Motor Control Center
Normal
Abnormal
Doble: Sweep Frequency Response Main Oil Tank Normal
Abnormal
Preliminary specifications of fault signatures and associated faults features, collected at the Sheaon Harris
Nuclear Generating Station, are presented in Appendix A. These fault signatures and fault features will be
used to populate the AFS database of the FW-PHM Software Suite.
5.4 Diagnosis Example
The following discussion presents an example of diagnosis performed on an oil pump motor. Figure 9
shows a screen shot from the Diagnostic Advisor showing the different technologies and fault features
that can be used to assess the health of an oil pump motor. Figure 10 shows the diagnosis result based on
the selected inputs. The score column in Figure 10 indicates the likelihood of each possible fault
diagnosis.
Figure 9. List of fault features for oil pump motor fault types.

25
Figure 10. Possible diagnosis of oil motor pump using the FW-PHM.
5.5 Benefits
The current approach to assessing asset health is based on a series of testing and interpretation of
results by subject matter experts. The FW-PHM software provides automated diagnosis and prognosis
capabilities that are meant to streamline the diagnosis process. The software is unique in the sense that it
standardizes the diagnostic and prognostic approach across assets based on fault signatures and fault
features, generates a comprehensive diagnosis report, and allows information sharing between different
NPPs via a master database.
The FW-PHM Diagnostic Advisor performs diagnosis based not only on the current value of the
system, but also on historical records, plant operating conditions, and expert opinions. Based on the level
of significance associated with each fault feature, the Diagnostic Advisor returns a set of possible faults
along with a degree of confidence. This allows maintenance personnel to assess different fault
possibilities. In addition, the software maintains online records including asset type, fault, diagnosis, and
day of occurrence, which can be used to generate an asset health report.
Additionally, the FW-PHM RUL database and RUL advisor facilitate estimation of asset RUL. The
initial set of prognostic models in the RUL database range from simple linear models to more advanced
general path models. Based on the type of information available, RUL models can be selected to obtain an
accurate estimate of asset RUL.

26
6. PILOT PROJECT STATUS
EPRI and INL are teaming with Exelon Corporation to demonstrate the use of the FW-PHM Suite to
monitor EDGs at the Braidwood Generating Station. Mohammed Yousuf, the Exelon Monitoring
Program Manger, is serving as project coordinator for Exelon. Gary Deck, the Braidwood EDG System
Engineer, is serving as a technical advisor. Team members from EPRI, INL, and Expert Microsystems
travelled to Braidwood for a team meeting on September 6, 2012, to define the initial fault signatures for
implementation. The EDGs installed at Braidwood are Cooper-Bessemer KSV 20-cylinder generators.
16-and 20-cylinder Cooper-Bessemer EDGs are installed in 31 plants at eight sites in the United States.
EPRI and INL are teaming with Duke Energy Progress to demonstrate the use of the FW-PHM Suite
to monitor EDGs at the Shearon Harris Nuclear Generating Station. Greg Young, a nuclear monitoring
program engineer, is serving as project coordinator from Duke Energy Progress. Mike Bodnar, the
Shearon Harris GSU Transformer System Engineer, is serving as a technical advisor. Team members
from EPRI, INL, and Expert Microsystems travelled to Shearon Harris for a team meeting on September
19, 2012. Shearon Harris is in the process of installing new GSU transformers, with built-in monitoring
capabilities.

27
7. SUMMARY AND FUTURE PLANS
This report presents the interim research activities associated with OLM of GSU Transformers. The
different fault types in GSUs and features associated each fault type are identified and discussed. DGA
and oil analysis are the primary technologies used to identify different fault types. EPRI and INL
interacted with transformer experts from the Shearon Harris Nuclear Generating Station to capture
multiple fault signatures based on DGA, laboratory testing, and oil analysis.
In FY-13, INL will continue to work with the Shearon Harris Nuclear Generating Station to populate
the AFS database with GSU fault signatures. Different test scenarios will be developed and implemented
to evaluate the ability of the Diagnostic Advisor in the FW-PHM Software Suite to identify the most
relevant faults based on both complete and incomplete information. INL and EPRI will also assist the
Shearon Harris Nuclear Generating Station with the implementation of the software. INL will initiate
review of prognostic techniques to estimate the RUL of GSUs.

28
8. REFERENCES
Bartley, W. H., (2003). Analysis of Transformer Failures. Proceedings of the 36th Annual Conference on
International Association of Engineering Insurers.
Bhumiwat, S. A., (2004). Insulation Condition Assessment of Transformer Bushings by means of
Polarisation/Deploarisation Current Analysis. In Proceedings of IEEE International Symposium on
Electrical Insulation, Indianapolis, USA.
Catterson, V.M., McArthur, S.D.J., Judd, M.D., and Zaher, A.S., (2008). Managing Remote Online
Partial Discharge Data. IEEE Transactions on Power Delivery, vol. 23, no. 4, pp. 1754 – 1762.
Coble, J., Strong, E., O’Reilly, S., and Hines, W., (2011). Prognosis of Remaining Useful Life for Large,
Oil-Filled Transformers. ANS Winter Meeting, 2011.
Dong, X., (2002). Study of Power Transformer Abnormalities and IT Application in Power Systems. PhD
Dissertation. Virginia Polytechnic Institute and State University, Virginia.
Duval, M., (2002). A Review of Faults Detectable by Gas-in-Oil Analysis in Transformers. IEEE
Electrical Insulation Magazine, vol. 18, no. 3, 2002.
Electric Power Research Institute, (2005). Development of a New Acoustic Emission Technique for the
Detection and Location of Gassing Sources in Power Transformers and LTCs. EPRI 1011708, Palo
Alto, CA.
Electric Power Research Institute, (2006). Development and Testing of an On-line AE (Acoustic
Emission)/Vibration Instrument. EPRI 1012344, Palo Alto, CA.
Electric Power Research Institute. (2006). Condition Monitoring and Diagnostics of Bushings, Current
Transformers, and Voltage Transformers by Oil Analysis. EPRI 1012343, Palo Alto, CA.
Electric Power Research Institute. (2007). Condition Assessment Tools for Transformers: Development
of Monitoring Systems. EPRI 1013929, Palo Alto, CA.
Electric Power Research Institute, (2011). EPRI Power Transformer Guidebook Development: The
Copper Book. EPRI 1021892, Palo Alto, CA.
Electric Power Research Institute. (2011). Guideline for Online Monitoring of Nuclear Power Plants:
Volume 2. EPRI 1023031, Palo Alto, CA.
EPRI, (2012) “Asset Fault Signature Requirements,” Software manual, 2012.
Hamrick, L., (2010). Dissolved Gas Analysis for Transformers. International Engineering Testing
Association (NETA) World.
Hong, Y., Meeker, W.Q., and McCalley, J.D., (2009). Prediction of Remaining Life of Power
Transformers based on Left Truncated and Right Censored Lifetime Data. The Annals of Applied
Statistics, vol. 3, no. 2, pp. 857-879.
Human Factors International, www.hfi.com.
IEEE Standards, IEEE C57.104 (1978). IEEE Guide for the Detection and Determination of Generated
Gases in Oil-Immersed Transformers and Their Relation to the Serviceability of the Equipment.
Judd, M.D., Yang, L., Bennoch, C.J., and Hunter, I.B.B., (2004). UHF Diagnostic Monitoring Techniques
for Power Transformers. EPRI Substation Equipment Diagnostics Conference, New Orleans.
Lin, C.E., Ling, J.M., and Huang, C.L., (1993). An Expert System for Transformer Fault Diagnosis using
Dissolved Gas Analysis. IEEE Transactions on Power Delivery, vol. 8, no. 1, pp. 231-238.

29
Lybeck, N.J., Coble, J., Tawfik, M., and Bond, L.J., (2011). An Assessment of Integrated Health
Management (IHM) Frameworks. 3rd
International Conference on NPP Life Management (PLiM) for
Long Term Operations (LTO), IAEA-CN-194-031.
Ma. H., Saha, T.K., and Ekanayake, C., (2012). Statistical Learning Techniques and Their Applications
for Condition Assessment of Power Transformers. IEEE Transactions on Dielectrics and Electrical
Insulation, vol. 19, no.2, pp. 481-489.
Muthanna, K.T., Sarkar, A., Das, K., and Waldner, K., (2006). Transformer Insulation Life Assessment,
IEEE Transactions on Power Delivery, vol. 21, no. 1, pp. 150-156.
Pamuk, N., and Uyaraglu, Y., (2010). The Analysis of Electrical and Mechanical Faults in
PowerTransformers by Fuzzy Expert System. Scientific Research and Essays, vol. 5, no. 23, pp.
4018-4027.
Pradhan, M.K., and Ramu, T.S., (2005). On the Estimation of Elapsed Life of Oil-Immersed Power
Transformers. IEEE Transactions on Power Delivery, vol. 20, no. 3, pp. 1962-1969.
Saha, T.K., (2003). Review of Modern Diagnostic Techniques for Assessing Insulation Condition in
Aged Transformers. IEEE Transactions on Dielectrics and Electrical Insulation, vol. 10, no.5, pp.
903-917.
Shintemirov, A., Tang, W., and Wu, Q.H., (2009). Power Transformer Fault Classification Based on
Dissolved Gas Analysis by Implementing Bootstrap and Genetic Programming. IEEE Transactions on
Systems, Man, and Cybernetics – Part C: Applications and Reviews, vol. 39, no. 1, pp. 69-79.
Strong, E., Coble, J., O’Reilly, S., and Hines, W., (2011). Feasibility of Prognostics for Transformer
Remaining Useful Life Predictions. MFPT: The Applied Systems Health Management Conference,
Virginia.

30
Appendix A
GSU Fault Signatures
Winding Insulation Degradation
Table A2. Winding Insulation Degradation Fault Signature – General Specification.
Describe in detail the asset type for which this fault signature is applicable.
GSU Transformers Winding Insulation Degradation
Describe the sources of the information used to specify this fault signature.
GSU Diagnostic Workshop at Shearon Harris Nuclear Generating Station, Raleigh, NC, September
19, 2012
Name or briefly describe the fault type for this fault signature.
Loss of dielectric strength of the winding insulation
Describe the condition and/or mechanism of the fault and provide reference information.
Increase in oil moisture/acidity causes loss of dielectric strength, depolymerization of the paper, or
reduction in oil dielectric strength
Describe any limitations on the applicability or relevance of this fault signature.
Winding insulation in all kinds of oil filled transformers using paper insulation
List the fault features indicating for the fault and attach a Fault Feature Specification for each.
Dissolved Gas Analysis: H2 level, C2H2 level, CO2/CO ratios
Oil Analysis: Measuring the KOH level of the oil. Dielectric strength of oil. Acidity and furans are
products of degrading paper. Moisture in paper causes degradation but does not indicate for it.
Operating History: Over Temperature for long period.
Describe other faults that can cause this fault to occur.
Damage of winding insulation during maintenance activity
Water ingress into the oil, bladder tank leak in the conservator
History of over temperature for sustained period

31
Describe other faults that can be caused by this fault.
Turn to turn shorts
Partial discharge and Arcing
Gassing
Describe the corrective actions that might remedy this fault.
Rebuild or replace
Provide contact information for the persons who prepared this fault signature.
Richard Rusaw, EPRI Project Manager: [email protected]

32
Table A3. Operating at High Temperature for Long Period. Technology: Operating History.
Describe the application of the fault feature for detecting the fault condition.
A history of high temperature operation indicates for the degradation of paper insulation
Describe the asset location where the data for assessing the fault feature is acquired initially.
GSU Transformer
Describe the technology used to acquire the data for assessing the fault feature.
Operating History Record
Describe the examination of the data that indicates whether or not the fault is present.
Time in Over temperature Operation
List all possible outcomes of the examination of the data (outcomes should be mutually exclusive).
Normal
Abnormal
Describe the effectiveness of this fault feature for detecting the fault condition. ☐ Very High; ☐ High; ☒ Medium; ☐ Low; ☐ Very Low
Provide reference information and examples for this fault feature.
Winding temperature more than 110 C for time in excess of 24 hours; 8 hour 120 C; 1 hour 130 C
Top oil temperature more than 90 C for time in excess of 24 hours; 8 hour 100 C; 1 hour 110 C

33
Insulation Oil Degradation
Table A4. Insulation Oil Degradation Fault Signature – General Specification.
Describe in detail the asset type for which this fault signature is applicable.
GSU Transformer Oil Degradation
Describe the sources of the information used to specify this fault signature.
GSU Diagnostic Workshop at Shearon Harris Nuclear Generating Station, Raleigh, NC, September
19, 2012
Name or briefly describe the fault type for this fault signature.
Loss of dielectric strength of insulating oil
Describe the condition and/or mechanism of the fault and provide reference information.
Oil loses dielectric strength over time due to water and particulates contaminants, possibly thermal
aging.
Describe any limitations on the applicability or relevance of this fault signature.
Insulating oil in transformers
List the fault features indicating for the fault and attach a Fault Feature Specification for each.
Oil analysis: dielectric strength value
Describe other faults that can cause this fault to occur.
NA
Describe other faults that can be caused by this fault.
Loss of the dielectric strength of the winding insulation
Describe the corrective actions that might remedy this fault.
Reclaimed or replace oil
Provide contact information for the persons who prepared this fault signature.
Richard Rusaw, EPRI Project Manager: [email protected]

34
Table A5. Loss of Dielectric Strength Oil Fault Feature – Technology: Oil analysis.
Describe the application of the fault feature for detecting the fault condition.
The dielectric strength of oil is determined directly by laboratory analysis
Describe the asset location where the data for assessing the fault feature is acquired initially.
Oil sampled from main oil tank
Describe the technology used to acquire the data for assessing the fault feature.
Oil Analysis
Describe the examination of the data that indicates whether or not the fault is present.
Measure of dielectric strength of the oil.
List all possible outcomes of the examination of the data (outcomes should be mutually exclusive).
Normal
Abnormal
Describe the effectiveness of this fault feature for detecting the fault condition. ☒ Very High; ☐ High; ☐ Medium; ☐ Low; ☐ Very Low
Provide reference information and examples for this fault feature.
ASTM D1816. Ref. FIST 3-31 gives threshold based on transformer rating

35
Insulating Oil Acidity
Table A6. Insulation Oil Acidity Fault Signature – General Specification.
Describe in detail the asset type for which this fault signature is applicable.
GSU Transformer Oil Acidity
Describe the sources of the information used to specify this fault signature.
GSU Diagnostic Workshop at Shearon Harris Nuclear Generating Station, Raleigh, NC, September
19, 2012
Name or briefly describe the fault type for this fault signature.
High acidity of insulating oil
Describe the condition and/or mechanism of the fault and provide reference information.
Oil is acidified over time due to water, aging and degradation of cellulose insulation
Describe any limitations on the applicability or relevance of this fault signature.
Insulating oil in transformers
List the fault features indicating for the fault and attach a Fault Feature Specification for each.
Oil analysis: dielectric strength value
Describe other faults that can cause this fault to occur.
Water ingress into oil; thermal degradation of winding insulation
Describe other faults that can be caused by this fault.
Loss of the dielectric strength of the winding insulation
Formation and precipitation of sludge on transformer internals (if >0.4 mg KOPH/g)
Describe the corrective actions that might remedy this fault.
Reclaim or replace oil
Provide contact information for the persons who prepared this fault signature.
Richard Rusaw, EPRI Project Manager: [email protected]

36
Table A7. Acidity of Oil Fault Feature – Technology: Oil analysis.
Describe the application of the fault feature for detecting the fault condition.
The acidity of oil is determined directly by laboratory analysis
Describe the asset location where the data for assessing the fault feature is acquired initially.
Oil sampled from tank
Describe the technology used to acquire the data for assessing the fault feature.
Oil Analysis
Describe the examination of the data that indicates whether or not the fault is present.
The level of KOPH is measured.
List all possible outcomes of the examination of the data (outcomes should be mutually exclusive).
Normal
Abnormal
Describe the effectiveness of this fault feature for detecting the fault condition. ☒ Very High; ☐ High; ☐ Medium; ☐ Low; ☐ Very Low
Provide reference information and examples for this fault feature.
Ref. 5 of FIST 3-31. 0.2 mg KOH/g is the upper limit. Reclaim or replace oil that reaches this level

37
Insulating Oil Contamination
Table A8. Insulation Oil Contamination Fault Signature – General Specification.
Describe in detail the asset type for which this fault signature is applicable.
GSU Transformer Oil contamination with particulates
Describe the sources of the information used to specify this fault signature.
GSU Diagnostic Workshop at Shearon Harris Nuclear Generating Station, Raleigh, NC, September
19, 2012.
Name or briefly describe the fault type for this fault signature.
Particulate contamination of oil
Describe the condition and/or mechanism of the fault and provide reference information.
Particulates accumulate in oil over time
Describe any limitations on the applicability or relevance of this fault signature.
Insulating oil in transformers
List the fault features indicating for the fault and attach a Fault Feature Specification for each.
Oil analysis: interfacial tension test
Describe other faults that can cause this fault to occur.
Pump bearings, maintenance, paint, degradation of paper
Describe other faults that can be caused by this fault.
Loss of the dielectric strength of the winding insulation
Describe the corrective actions that might remedy this fault.
Reclaim or replace oil
Provide contact information for the persons who prepared this fault signature.
Richard Rusaw, EPRI Project Manager: [email protected]

38
Table A9. Interfacial Tension of Oil Fault Feature – Technology: Oil analysis.
Describe the application of the fault feature for detecting the fault condition.
The interfacial tension of oil is determined directly by laboratory analysis
Describe the asset location where the data for assessing the fault feature is acquired initially.
Oil sampled from tank
Describe the technology used to acquire the data for assessing the fault feature.
Oil Analysis
Describe the examination of the data that indicates whether or not the fault is present.
Measure the interfacial tension of the oil.
List all possible outcomes of the examination of the data (outcomes should be mutually exclusive).
Normal
Abnormal
Describe the effectiveness of this fault feature for detecting the fault condition. ☒ Very High; ☐ High; ☐ Medium; ☐ Low; ☐ Very Low
Provide reference information and examples for this fault feature.
Ref. 5 of FIST 3-31. 25 dynes/cm is the upper limit. Reclaim or replace oil that reaches this level

39
Loss of Dielectric Strength of Bushing
Table A10. Loss of Dielectric Strength of Bushing Fault Signature – General Specification.
Describe in detail the asset type for which this fault signature is applicable.
GSU Transformer Bushing
Describe the sources of the information used to specify this fault signature.
GSU Diagnostic Workshop at Shearon Harris Nuclear Generating Station, Raleigh, NC, September
19, 2012.
Name or briefly describe the fault type for this fault signature.
Loss of bushing dielectric strength
Describe the condition and/or mechanism of the fault and provide reference information.
Loss of oil, ingress of water, damage to the porcelain, contaminants on the porcelain
Describe any limitations on the applicability or relevance of this fault signature.
Bushings in transformers
List the fault features indicating for the fault and attach a Fault Feature Specification for each.
Doble capacitance; Doble power factor; tap capacitance; tap current magnitude; tap current phase
angle; Inspection for contaminant; Inspection for oil leaks; Inspection for oil level
Describe other faults that can cause this fault to occur.
NA
Describe other faults that can be caused by this fault.
Arcing and possibly transformer damage
Describe the corrective actions that might remedy this fault.
Refurbish or replace the bushing
Provide contact information for the persons who prepared this fault signature.
Richard Rusaw, EPRI Project Manager: [email protected]

40
Table A11. Doble Capacitance Fault Feature – Technology: Doble Analysis.
Describe the application of the fault feature for detecting the fault condition.
The capacitance from the lead to the ground
Describe the asset location where the data for assessing the fault feature is acquired initially.
Bushing lead and ground connectors
Describe the technology used to acquire the data for assessing the fault feature.
Doble measurement of Intelligent Diagnostic Device (IDD) online system
Describe the examination of the data that indicates whether or not the fault is present.
Measure capacitance during operation
List all possible outcomes of the examination of the data (outcomes should be mutually exclusive).
Normal
Doble condition codes for Abnormal dielectric strength
Describe the effectiveness of this fault feature for detecting the fault condition. ☐ Very High; ☒ High; ☐ Medium; ☐ Low; ☐ Very Low
Provide reference information and examples for this fault feature.
IDD Bushing User Guide.

41
Oil Pump Motor Performance Loss
Table A12. Oil Pump Motor Performance Loss – General Specification.
Describe in detail the asset type for which this fault signature is applicable.
GSU Insulating Oil Pump Motor (pump and motor? Or pump/motor combination?)
Describe the sources of the information used to specify this fault signature.
GSU Diagnostic Workshop at Shearon Harris Nuclear Generating Station, Raleigh, NC, September
19, 2012.
Name or briefly describe the fault type for this fault signature.
Oil pump motor is not running or not running to service specifications
Describe the condition and/or mechanism of the fault and provide reference information.
The pump motor is not running or not running to service specifications
Describe any limitations on the applicability or relevance of this fault signature.
Oil pump motor on transformers. 480 V 3 phase AC
List the fault features indicating for the fault and attach a Fault Feature Specification for each.
Ground Fault (alarm) (can apply to pump and fan motors)
Motor current: No, low or high current (alarm) (can apply to pump and fan motors)
Temperature: Top Oil Temperature
Temperature: Winding
Inspection: Motor Condition(can apply to pump and fan motors)
Gassing and Vibration
Describe other faults that can cause this fault to occur.
Loss of electric power; bad breaker
Describe other faults that can be caused by this fault.
Overheating of oil and windings; pressure increase in tank
Describe the corrective actions that might remedy this fault.
Restore power; repair or replace motor
Provide contact information for the persons who prepared this fault signature.
Richard Rusaw, EPRI Project Manager: [email protected]
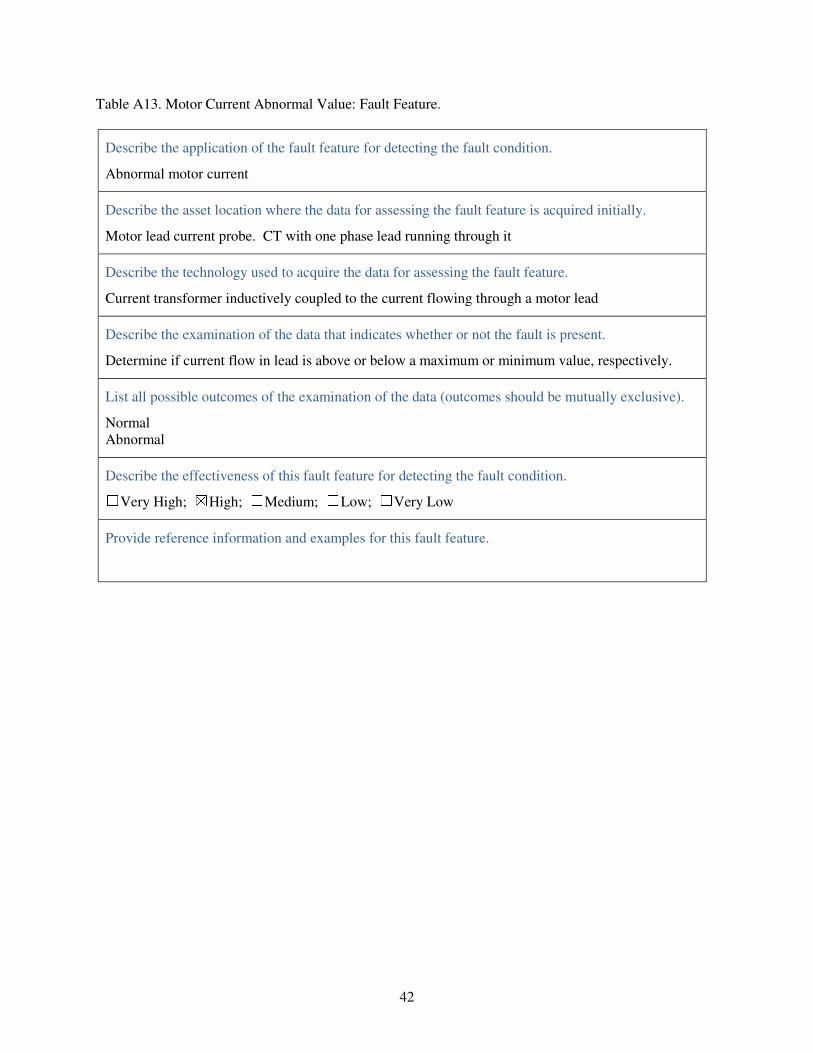
42
Table A13. Motor Current Abnormal Value: Fault Feature.
Describe the application of the fault feature for detecting the fault condition.
Abnormal motor current
Describe the asset location where the data for assessing the fault feature is acquired initially.
Motor lead current probe. CT with one phase lead running through it
Describe the technology used to acquire the data for assessing the fault feature.
Current transformer inductively coupled to the current flowing through a motor lead
Describe the examination of the data that indicates whether or not the fault is present.
Determine if current flow in lead is above or below a maximum or minimum value, respectively.
List all possible outcomes of the examination of the data (outcomes should be mutually exclusive).
Normal
Abnormal
Describe the effectiveness of this fault feature for detecting the fault condition. ☐ Very High; ☒ High; ☐ Medium; ☐ Low; ☐ Very Low
Provide reference information and examples for this fault feature.

43
Table A14. Motor Insulation Resistance Megger Inspection: Fault Feature.
Describe the application of the fault feature for detecting the fault condition.
Megger Inspection of motor
Describe the asset location where the data for assessing the fault feature is acquired initially.
Pump motor (can apply to fan motor)
Describe the technology used to acquire the data for assessing the fault feature.
Inspection of motor using Megger tester.
Describe the examination of the data that indicates whether or not the fault is present.
Value of insulation resistance lower than specification
List all possible outcomes of the examination of the data (outcomes should be mutually exclusive).
Normal
Abnormal (low)
List in order of increasing confidence the outcomes of the examination that indicate for this fault.
Abnormal
Describe the effectiveness of this fault feature for detecting the fault condition. ☐ Very High; ☒ High; ☐ Medium; ☐ Low; ☐ Very Low
Provide reference information and examples for this fault feature.
Megger Company User guide or maintenance guide