Online HD monitoring - swissnephrology.ch · Online HD monitoring ... • Ultrafiltration induces...
65
Nephrologie Online HD monitoring (BVM, OCM, BTM, etc.): Useful tools or fancy toys? Patrice Ambühl Basics in Nephrology SSN/SGN Meeting, December 4 2013 [email protected]
-
Upload
truongngoc -
Category
Documents
-
view
219 -
download
0
Transcript of Online HD monitoring - swissnephrology.ch · Online HD monitoring ... • Ultrafiltration induces...

Nephrologie
Online HD monitoring(BVM, OCM, BTM, etc.):Useful tools or fancy toys?
Patrice AmbühlBasics in NephrologySSN/SGN Meeting, December 4 2013 [email protected]

Nephrology
Therapeutical dilemma
High interdialyticvolume increase Mortality ↑
Ultrafiltra on ↑Volume reduc on ↑
IntradialyticHypotension

Nephrology
Technical solution?
High interdialyticvolume increase Mortality ↑
Ultrafiltra on ↑Volume reduc on ↑
IntradialyticHypotension
BiofeedbackMonitoring

Nephrology
Technique
Validity
Biologic Effect
Clinical Outcome ?
?
?
?
Nephrology
Pathomechanism of intradialytic hypotension
• Ultrafiltration induces blood pressure instability, usually hypotension
ICV/ECV IVV
Refilling
Ultrafiltration
ICV/ECV IVV
Refilling < Ultrafiltration

Nephrology
”The true miracle is that these very primitive devices are able to provide several decades of survival time for the patients…” Claude Jacobs NDT 1999

Nephrology
What is actually „intradialytic hypotension?“…
• A critical threshold of blood volume decrease below which a relevant drop in blood pressure predictably occurs can not be defined
• Symptomatic intradialytic hypotension occurs individually and is multifactorial in nature, and not simply dependent of blood volume reduction
Nephrology P. Kuhn, FMC

Nephrology

Nephrology
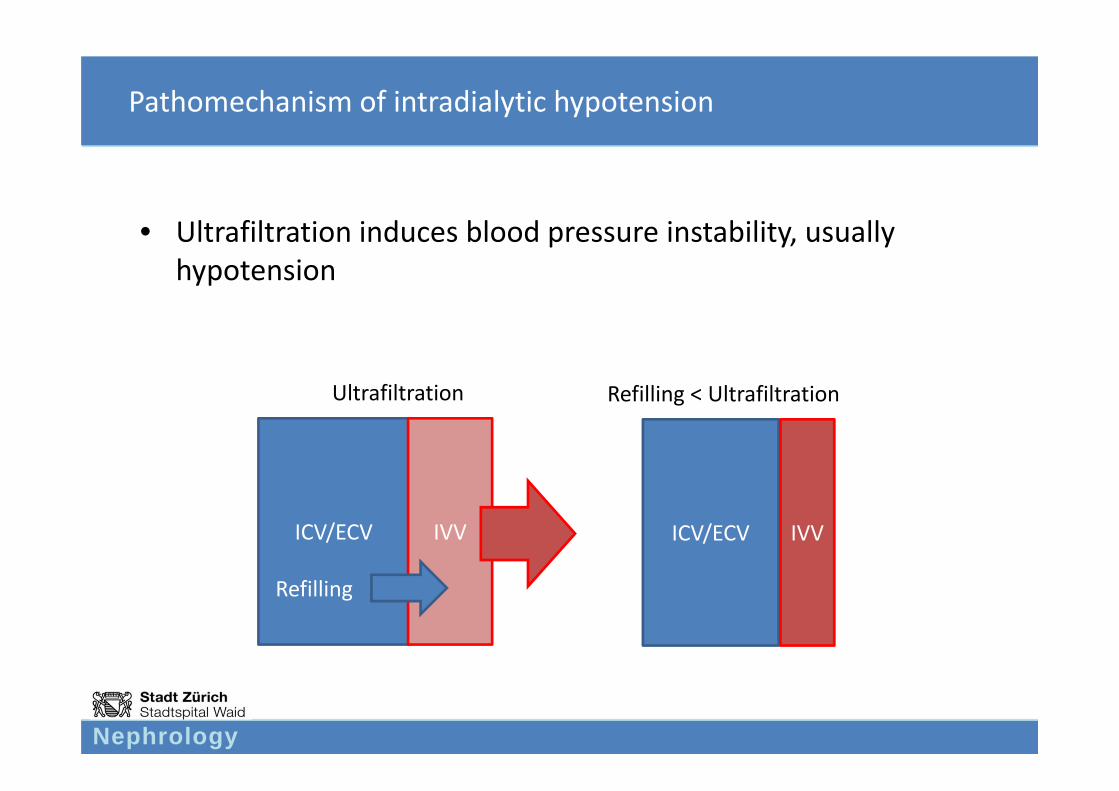
BLOOD VOLUME MONITORING

Nephrology
Gold standard of blood volume measurement
• 51Cr‐labeled erythrocytes, or 131I‐labeled human albumin– Expensive– Cumbersome– Not feasible in daily practice
Nephrology
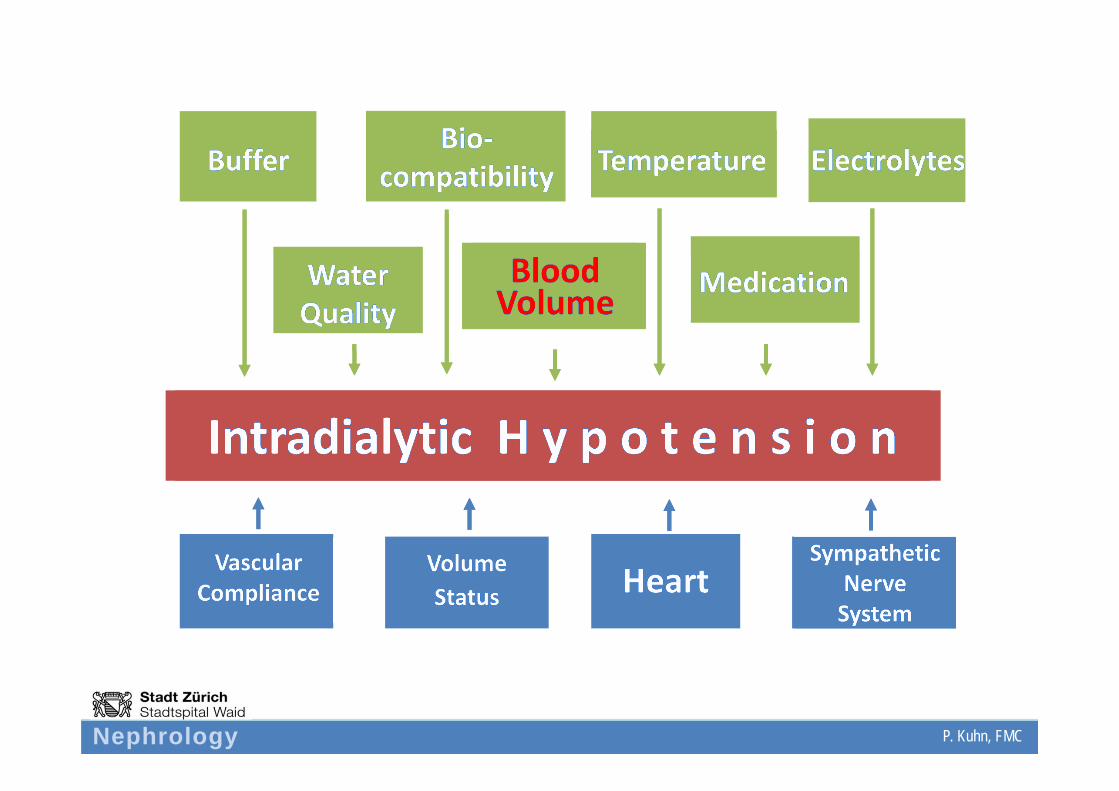
Non‐invasive continuous blood volume determination
• Measurement of relative blood volume (RBV) in real‐time• Principle: Preservation of mass (erythrocytes/Hk, protein)• RBV change (in %) = ((C0/Ct) – 1) × 100
– C0 and Ct : concentration of measured blood parameters at start and during HD
ICV/ECV IVV ICV/ECV IVV

Nephrology
Ultrasound
Send
er
Receiver
Blood
Light beam
Send
er
Receiver
Pros: Simple calibrationTemperature sensitive
Cons: Sensitive to changes in osmolarityPrecision?Additional module in blood lines required
Pros: Very preciseUnsensitive to changes inosmolarity
Cons: Cumbersome calibrationTemperature compensationAdditional module in blood linesrequired
Physical methods to measure density of blood
P. Kuhn, FMC
Blood

Nephrology
Sonic velocity in m/s1620
1600
1580
1560
1540
1520
1500
HKT 50%
HKT 40%
HKT 30%
HKT 20%
HKT 10%
NaCl 0,9%
Water
25° 30° 35° 40° 45°Temperature °C
Blood
Sonic velocity, temperature, hematocrit
P. Kuhn, FMC
Nephrology
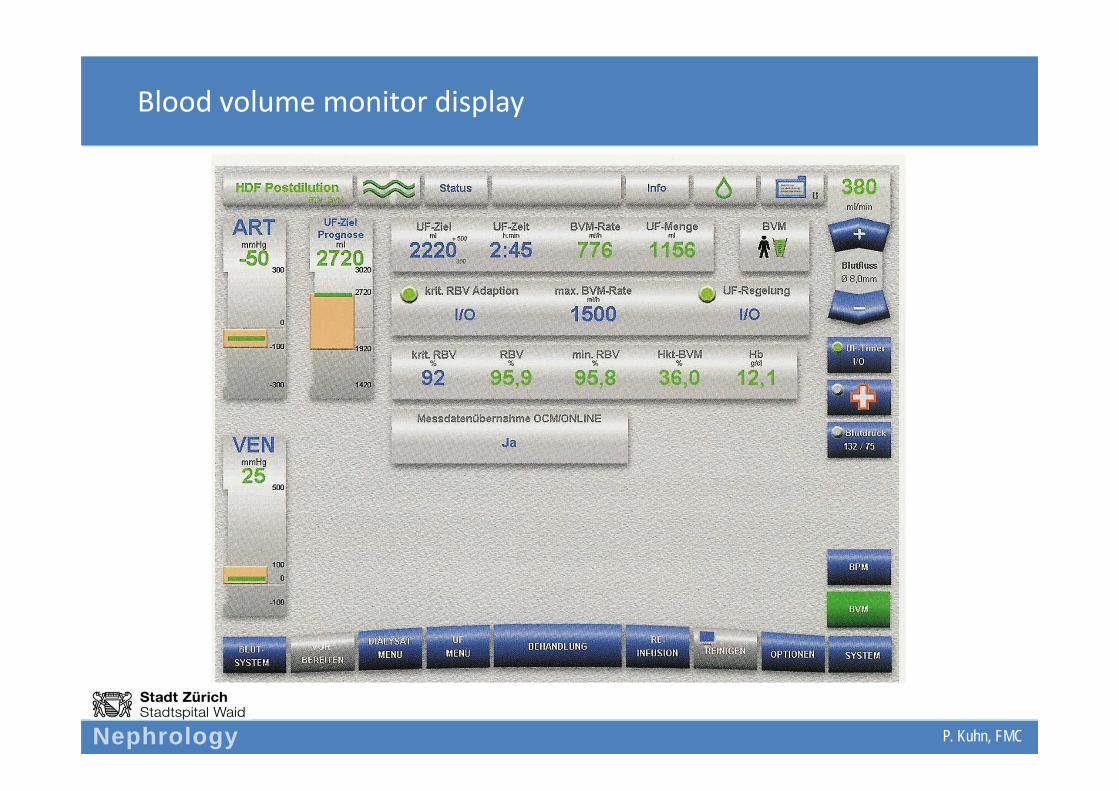
Blood volume monitor display
P. Kuhn, FMC
Nephrology
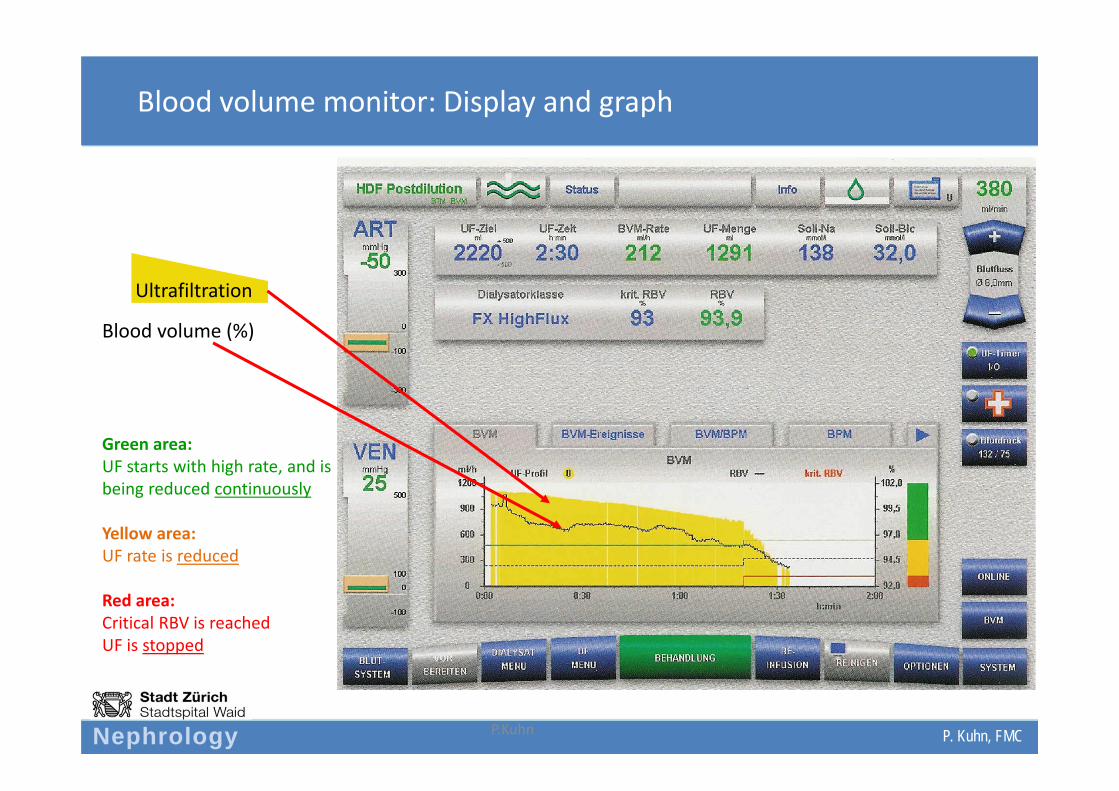
Blood volume monitor: Display and graph
P.Kuhn
Blood volume (%)
Green area:UF starts with high rate, and is being reduced continuously
Yellow area:UF rate is reduced
Red area:Critical RBV is reachedUF is stopped
Ultrafiltration
P. Kuhn, FMC
Nephrology
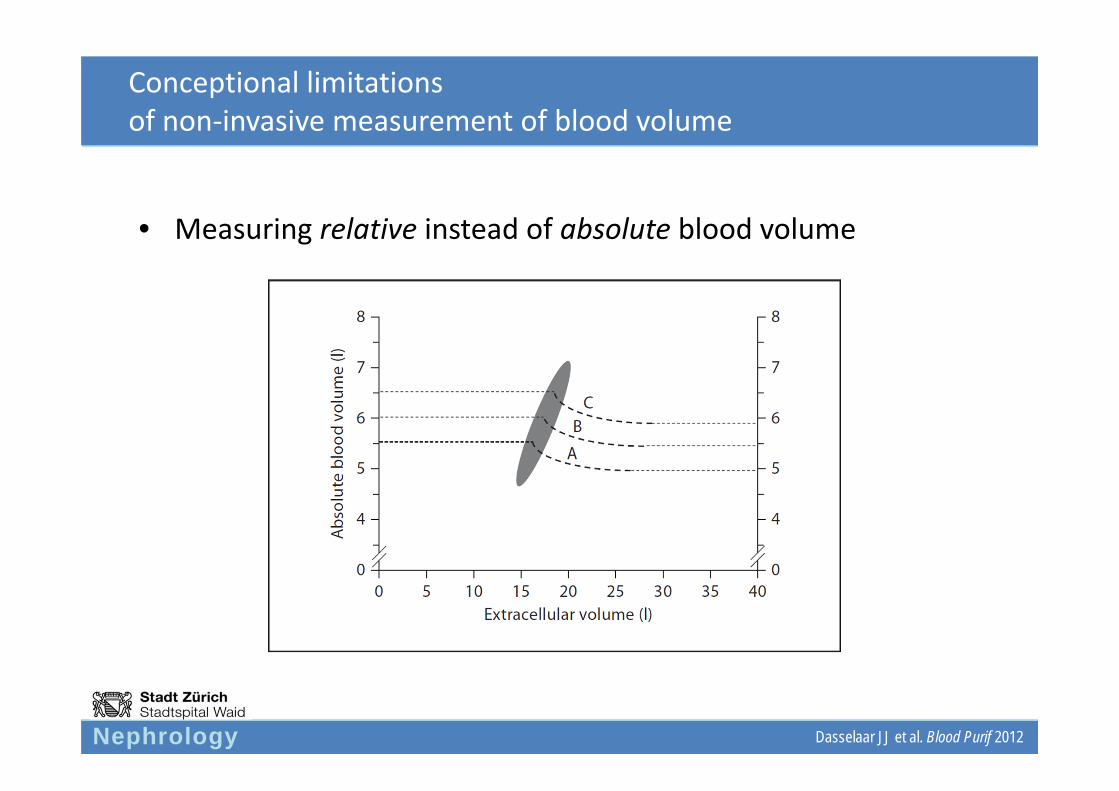
Conceptional limitationsof non‐invasive measurement of blood volume
• Measuring relative instead of absolute blood volume
Dasselaar JJ et al. Blood Purif 2012

Nephrology
Discrepancy between total (TBV) and relative blood volume (RBV)
RBV overestimates TBV
RBV underestimates TBV TBV RBV
Dasselaar JJ et al. CJASN 2007
For a „dry“patient: a biger change (drop) in RBV results Overestimation of TBV
N = 7 pts.

Nephrology
Factors affecting BVM
• Volume and hydratation status
• Blood homogeneity:– Hematocrit is not the same in all vasculature compartments (arteries,
veins, capillaries, venules, …) Fahraeus effect/F cell ratio
– Relevant in case of a change in F ratio during dialysis:
• Physical activity, temperature, upright position
Results in a volume shift into the arterial compartment to maintain circulation
Underestimation of RBV reduction from volume removal(= ultrafiltration) during dialysis

Nephrology
Change in F cell ratio during dialysis
Dasselaar JJ et al. CJASN 2007

Nephrology
Factors affecting BVM
• Volume and hydratation status
• Blood homogeneity
• Eating
• Intradialytic physical activity or training
• Intravenous infusion of packed red cells or solutions containing albumin during HD

Nephrology
Not all systems/devices are equal… (in measuring RBV)
Comparison of measurement with BVM modul vs. measurment of Hb by laboratoy method: after 2 hrs. HD; after 4 hrs. HD
Crit‐Line BVM (Fresenius)Hemoscan (Gambro)
Dasselaar JJ et al. Hemodial Intl 2007

Nephrology
CLINICAL STUDIESBlood volume monitoring
Nephrology
Warning!
• No controlled studies exist examining the correlation
of blood volume monitoring with intradialytic
hypotension clinical outcomes (morbidity/
mortality)!

Nephrology
Steuer RR et al, ASAIO J, 1994
Hematocrit as an indicator of blood volume and a predictor of intradialytic morbid events
• Question– Correlation of mean arterial blood pressure (MAP) with change in blood
volume and hematocrit (Hk)?– Correlation between dialysis induced intravascular volume depletion and
intradialytic complications (cramps, vertigo)?
• Methodology– Continuous optical measurement of hematocrit in 16 patients

Nephrology
Steuer RR et al, ASAIO J, 1994
Hematocrit as an indicator of blood volume and a predictor of intradialytic morbid events
• Results– MAP decrease correlates with increase in Hk in 10 of 16 patients (P < 0.05)
– Low interindividual correlation between MAP and Hk
– HD without complications was associated with lesser degree in blood volume changes (5.6 +/‐ 3.6 %/hr) versus treatments with consecutive complications (12.2 +/‐ 5.5 %/hr, P < 0.001)
– Repeated complications occurred in 12 of 16 patients at a specific Hk(intraindividual correlation)
Nephrology
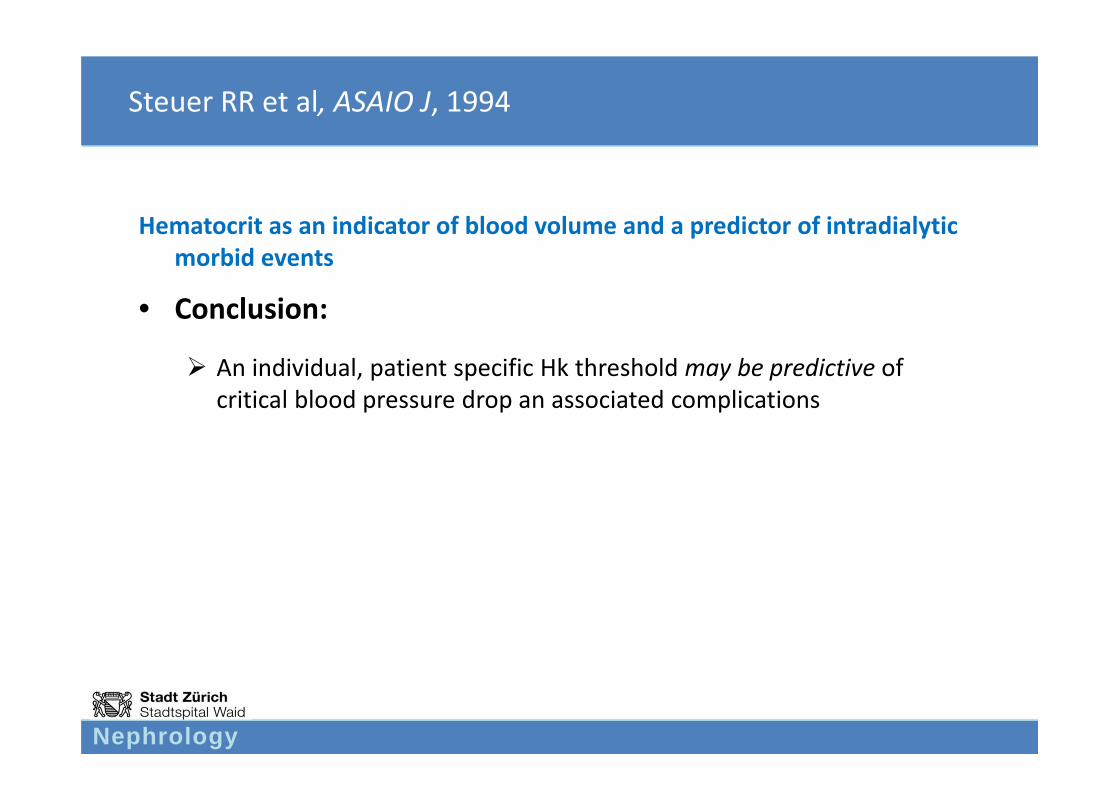
Steuer RR et al, ASAIO J, 1994
Hematocrit as an indicator of blood volume and a predictor of intradialytic morbid events
• Conclusion:
An individual, patient specific Hk threshold may be predictive of critical blood pressure drop an associated complications
Nephrology
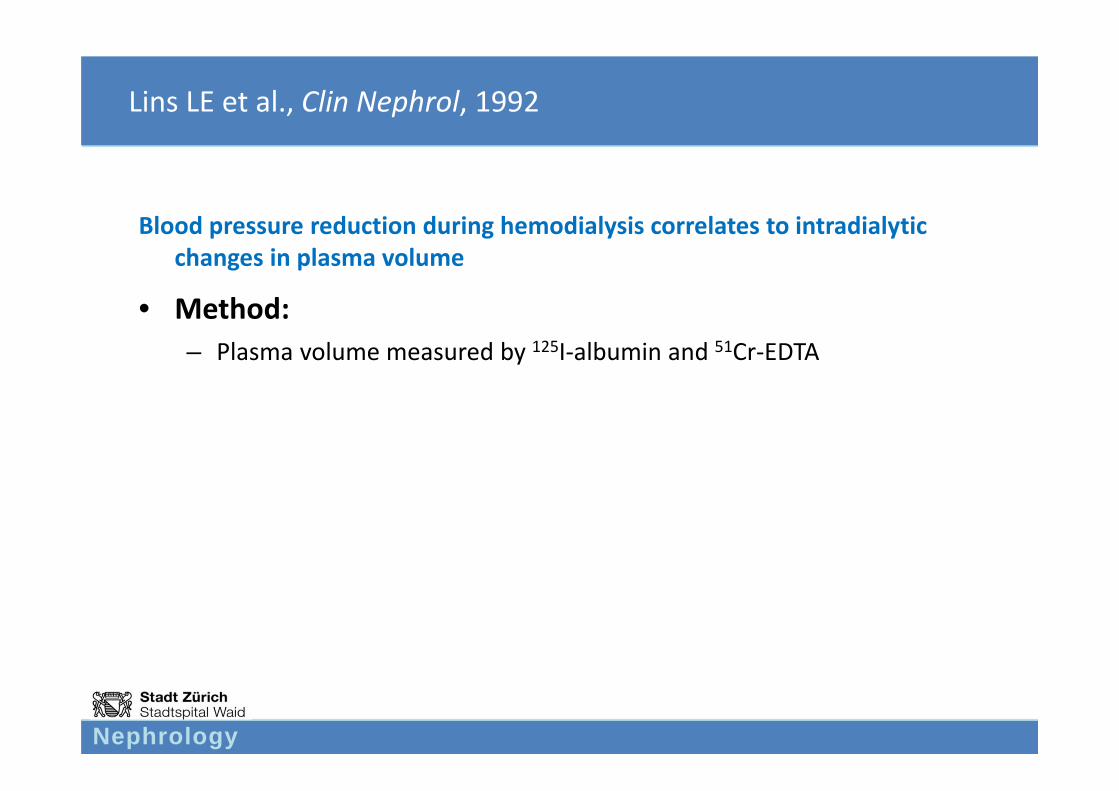
Lins LE et al., Clin Nephrol, 1992
Blood pressure reduction during hemodialysis correlates to intradialytic changes in plasma volume
• Method:– Plasma volume measured by 125I‐albumin and 51Cr‐EDTA
Nephrology
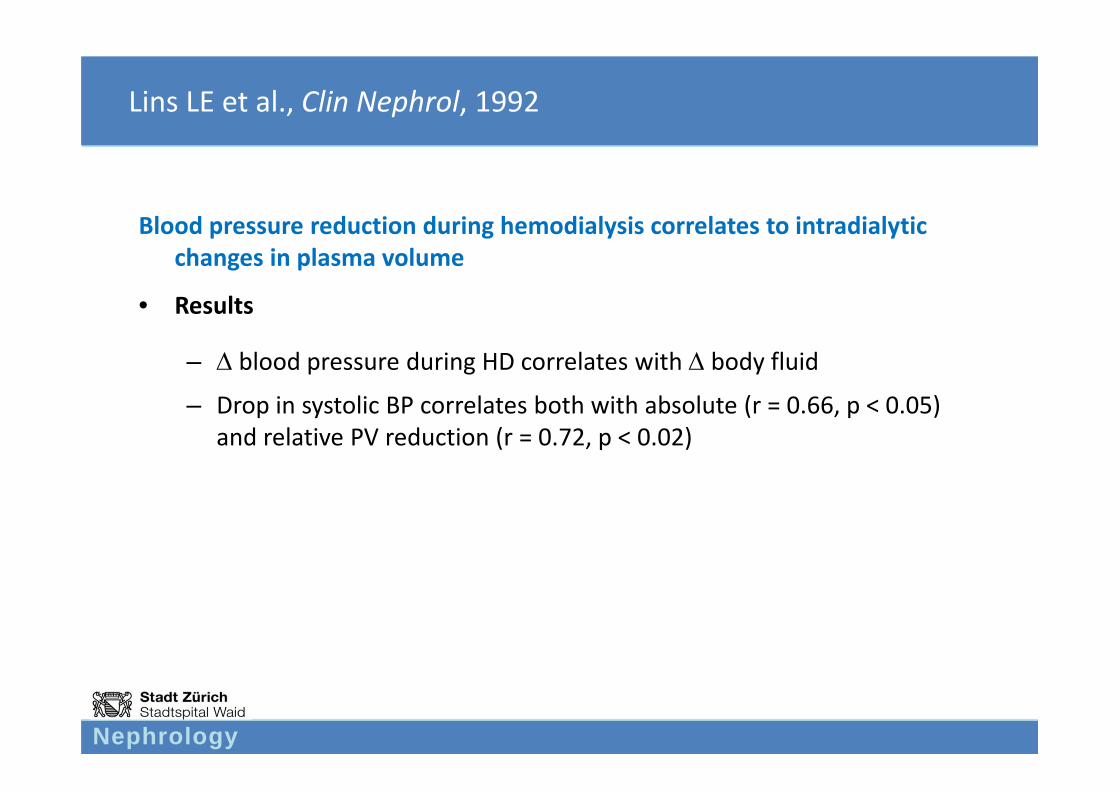
Lins LE et al., Clin Nephrol, 1992
Blood pressure reduction during hemodialysis correlates to intradialytic changes in plasma volume
• Results
– blood pressure during HD correlates with body fluid
– Drop in systolic BP correlates both with absolute (r = 0.66, p < 0.05) and relative PV reduction (r = 0.72, p < 0.02)

Nephrology
Lins LE et al., Clin Nephrol, 1992
Blood pressure reduction during hemodialysis correlates to intradialytic changes in plasma volume
• Conclusion:
Plasma volume monitoring may be helpful for improvement of intradialytic hemodynamic control

Nephrology
Stiller S et al, ASAIO Trans, 1991
Less symptomatic hypotension using blood volume controlled ultrafiltration
• Methods– Ultrafiltration rate based on predefined blood volume profil– Control conditions
• Constant drop in relative blood volume (BV)• Faster decrease in BV during the first 60 minutes of dialysis• UF rate as high as possible• Reaching defined dry weight within (predefined) regular treatment time• 10 patients

Nephrology
Stiller S et al, ASAIO Trans, 1991
Less symptomatic hypotension using blood volume controlled ultrafiltration
• Results– Significantly lesser hypotensive episodes and muscle cramps versus
conventional/constant UFR
• Conclusion– BV controlled UF is an important step towards optimized dialysis
therapy
Nephrology
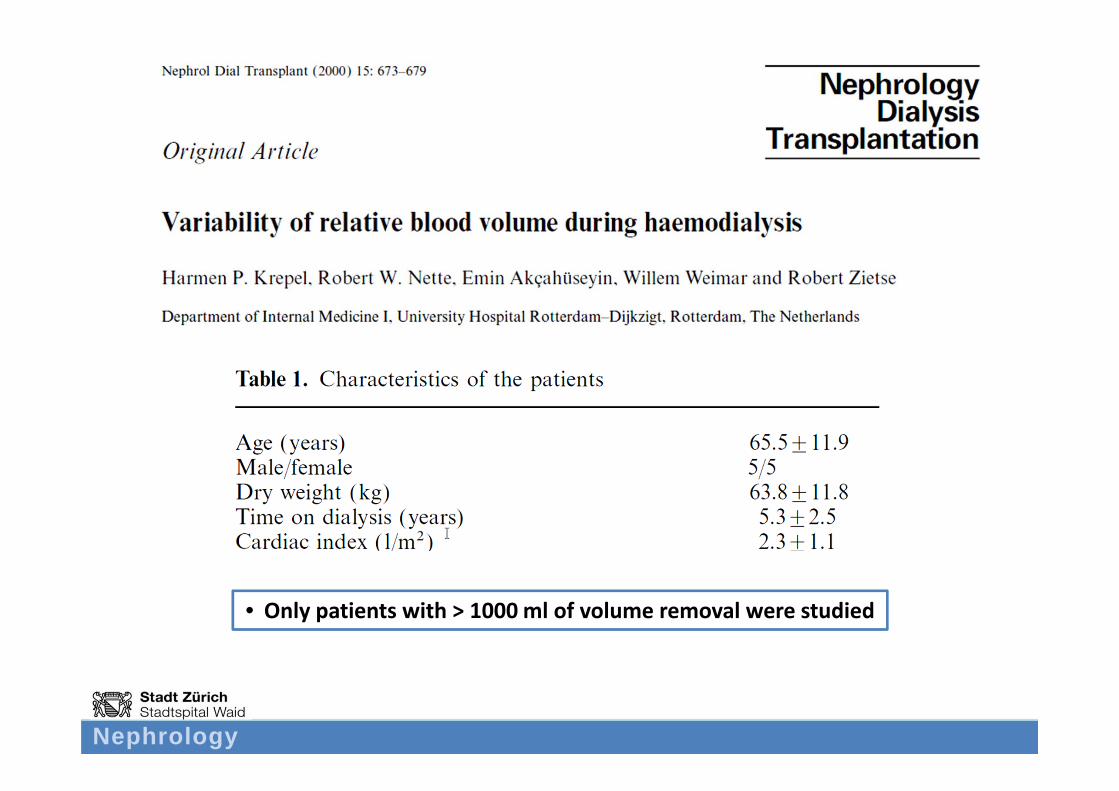
• Only patients with > 1000 ml of volume removal were studied

Nephrology
Results
ICV: Vena cava inferiorICVD: V. cava inf. diameter
Krepel HP et al. NDT 2000

Nephrology Krepel HP et al. NDT 2000

Nephrology
Individual RBV patterns over time
Krepel HP et al. NDT 2000
Nephrology
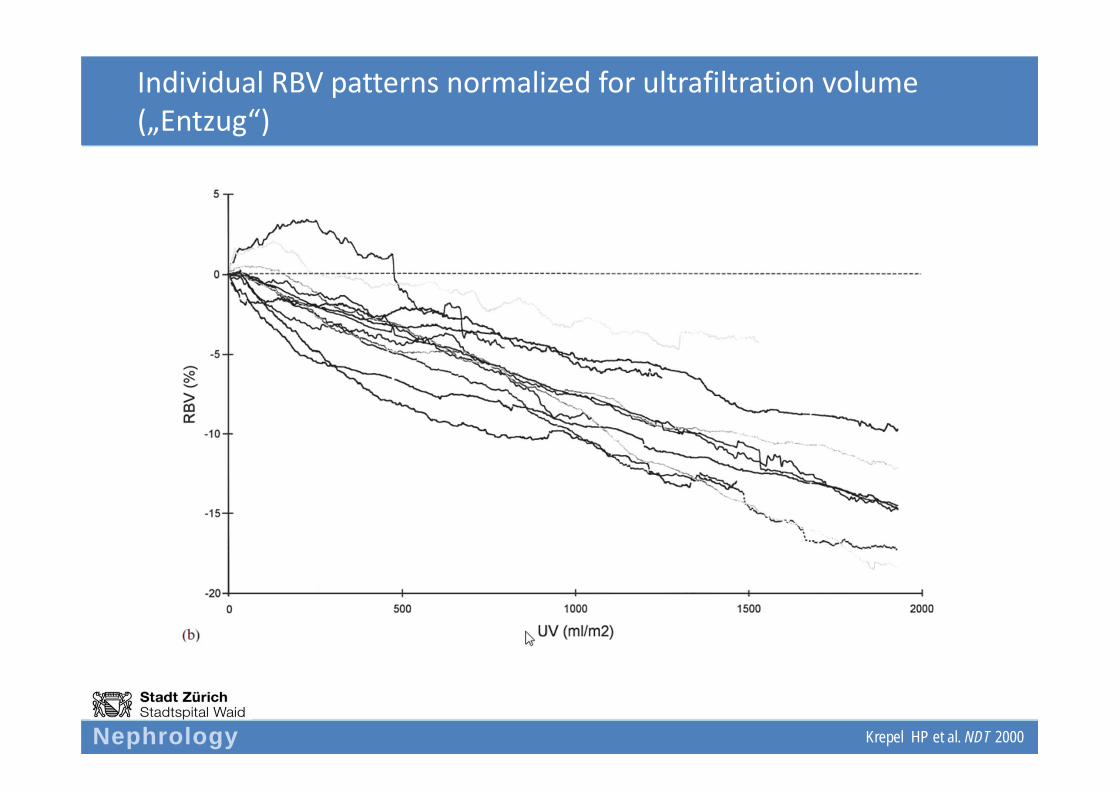
Individual RBV patterns normalized for ultrafiltration volume („Entzug“)
Krepel HP et al. NDT 2000

Nephrology
Correlation with relative blood volume
Krepel HP et al. NDT 2000

Nephrology
Correlation with relative blood volume
Krepel HP et al. NDT 2000
V. cava inf. diameter

Nephrology
Incidence of hypotensive episodes
• Hypotension occurred in 7 HD treatments (2 patients)
• Intraindividual variability in RBV during hypotensive episodes was high in both pa ents (pa ent 1: −9.2 to −16.0%; pa ent 7: −1.4 to −16.5%)
Krepel HP et al. NDT 2000

Nephrology
Conclusion
• RBV monitoring is of limited use in prevention of intradialytic hypotension
Krepel HP et al. NDT 2000

Nephrology
Nephrology
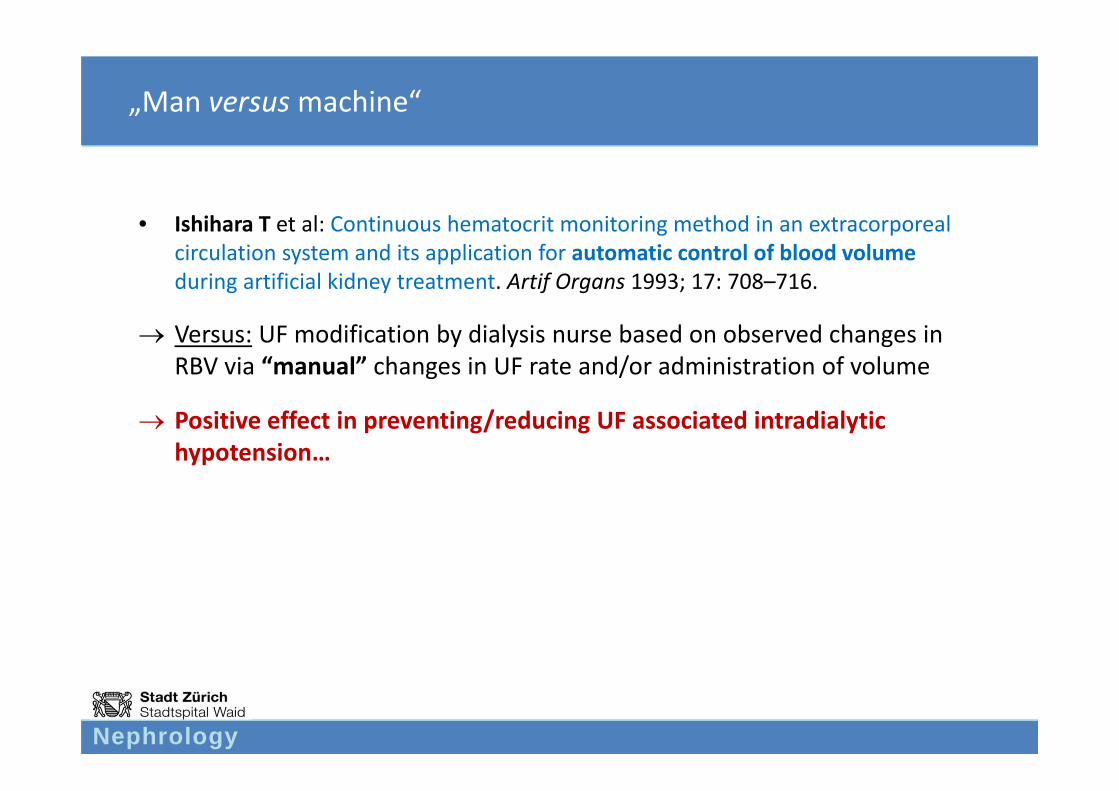
„Man versusmachine“
• Ishihara T et al: Continuous hematocrit monitoring method in an extracorporeal circulation system and its application for automatic control of blood volume during artificial kidney treatment. Artif Organs 1993; 17: 708–716.
Versus: UF modification by dialysis nurse based on observed changes in RBV via “manual” changes in UF rate and/or administration of volume
Positive effect in preventing/reducing UF associated intradialytic hypotension…

Nephrology
CONDUCTIVITY MEASUREMENT

Nephrology
Online conductivity measurement
• Multifunctional, measuring:– Dialysis dose (online‐KtV)
– Shunt volume (vascular access blood flow)

Nephrology
Babb AL, Maurer CJ, Fry DL, Popovich RP, McKee RE :
The determination of membrane permeabilities and solute diffusivities with applications to hemodialysisChem. Eng. Progr. Symp. Ser. 84,64 (1968) 59‐68
Diffusion coefficient at 37° C
UreaNa+
1,94 × 10‐5 2,20 × 10‐5
Steil H, et.al. ASAIO Trans 1993;39:M348‐52
Electrolyte Clearance versus Urea Clearanceaqueous solutions
0 50 100 150 200 250 300 350 400
urea clearance [ml/min]
0100
200
300
400
electrolyteclearance[m
l/min]
Concordance in electrolyte (Na+) and urea clearance
P. Kuhn, FMC
Nephrology
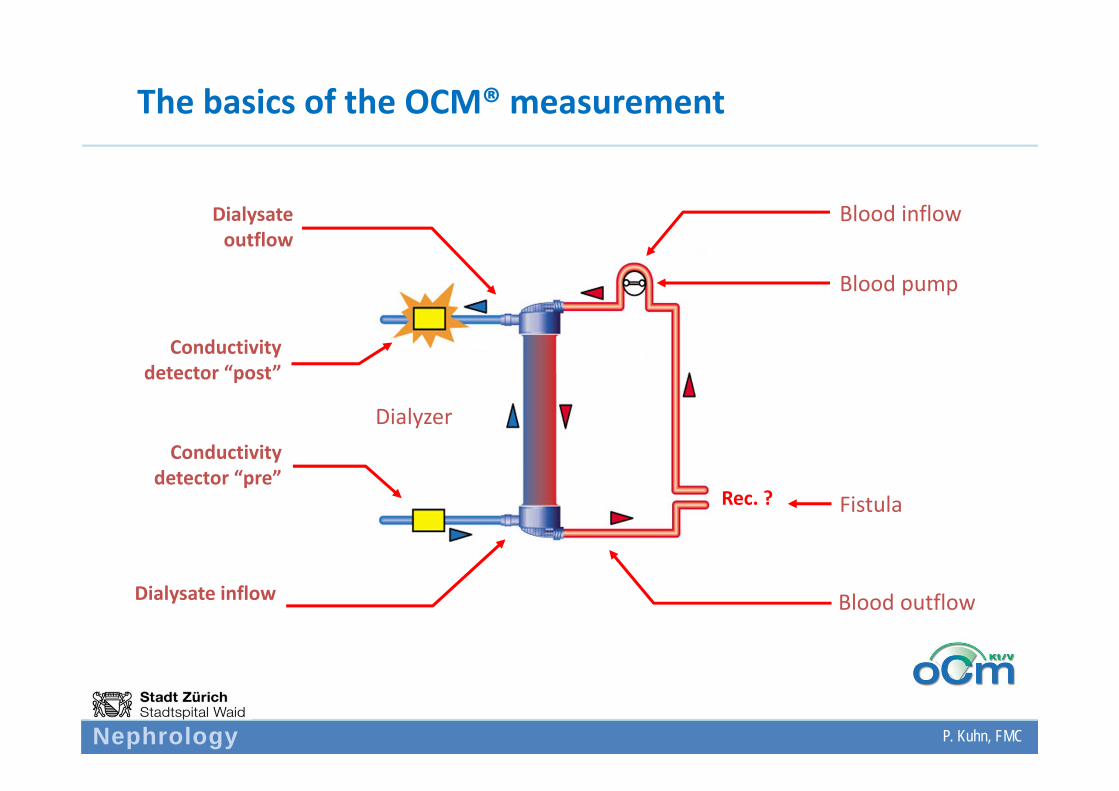
The basics of the OCM® measurement
Cd in
Cd out
New: Dynamic elektrolyte variation
Rec. ?
Dialysate outflow
Dialysate inflow
Conductivity detector “pre”
Conductivity detector “post”
Dialyzer
Blood pump
Blood inflow
Fistula
Blood outflow
P. Kuhn, FMC
Nephrology
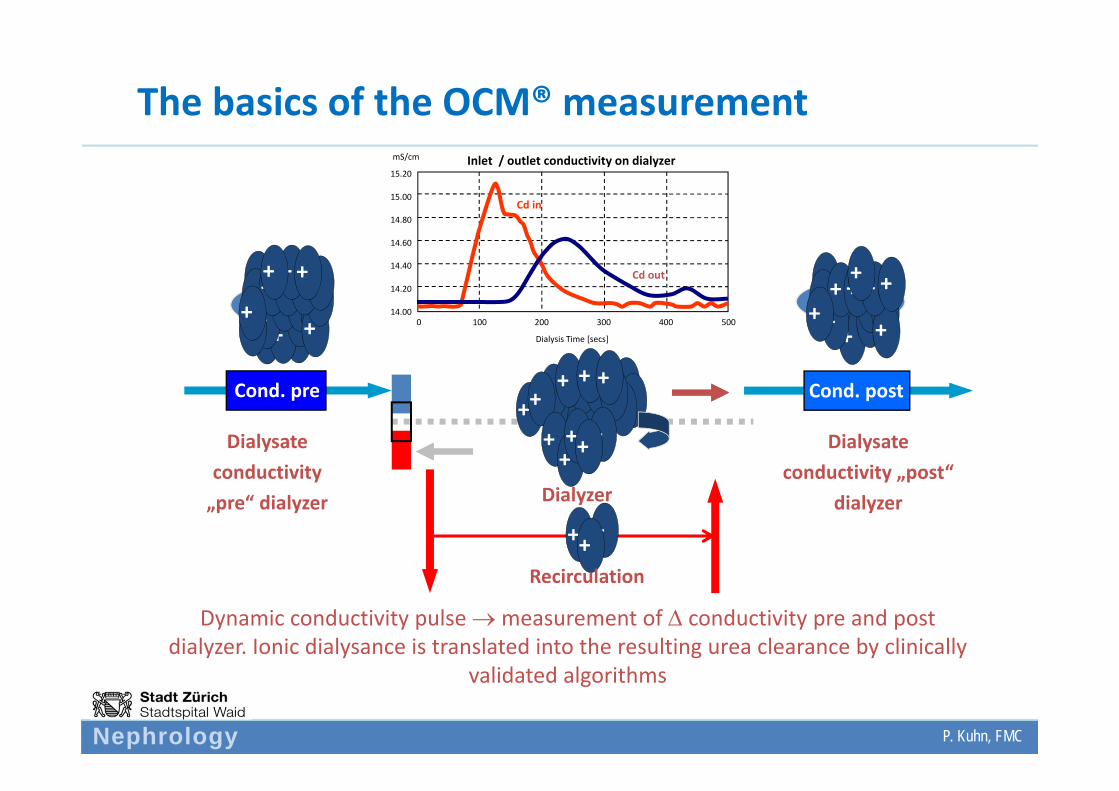
Dialysate conductivity „post“
dialyzer
Cond. post
+
++++
++++
+ + + ++
++
The basics of the OCM® measurement
++ ++++++++ +++
+++ +
++++
+++Dialysate
conductivity „pre“ dialyzer
+
+ ++++
+++ ++
+++ + + +
++
+++ +
Cond. pre
Dialyzer
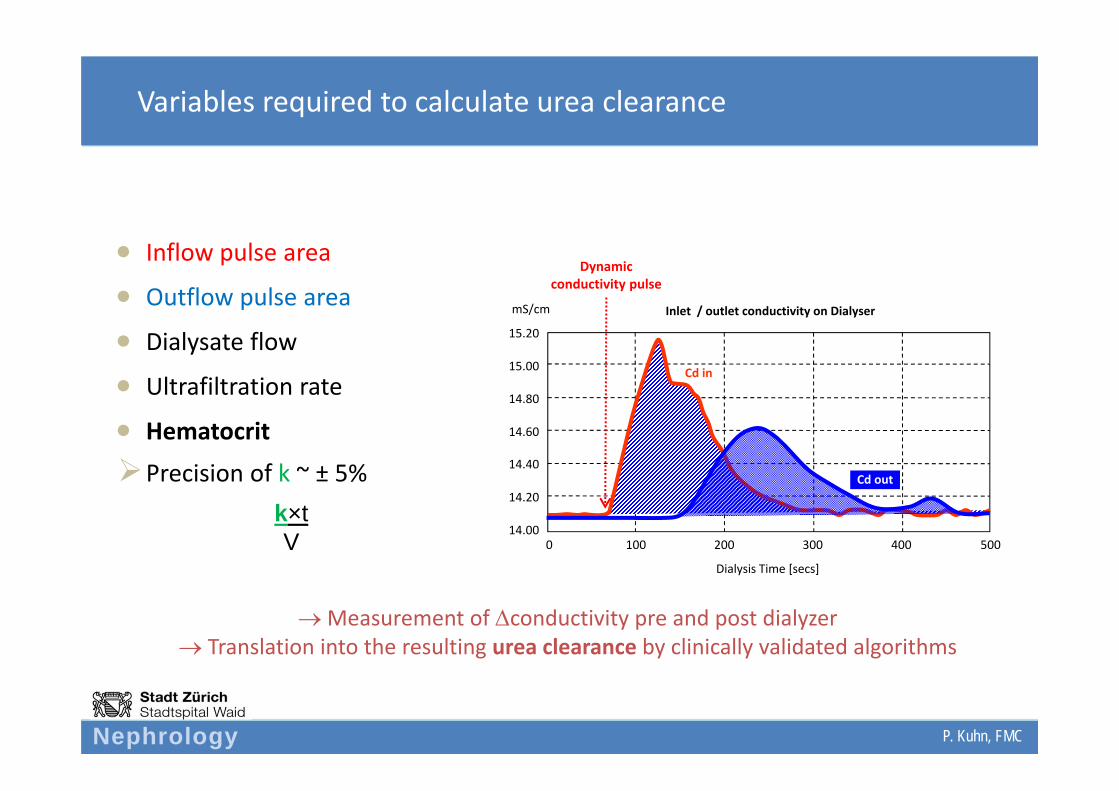
Dynamic conductivity pulse measurement of conductivity pre and post dialyzer. Ionic dialysance is translated into the resulting urea clearance by clinically
validated algorithms
+++Recirculation
14.00
14.20
14.40
14.60
14.80
15.00
15.20
0 100 200 300 400 500
Dialysis Time [secs]
Inlet / outlet conductivity on dialyzermS/cm
Cd in
Cd out
P. Kuhn, FMC
Nephrology
14.00
14.20
14.40
14.60
14.80
15.00
15.20
0 100 200 300 400 500
Dialysis Time [secs]
Inlet / outlet conductivity on DialysermS/cm
Cd in
Cd out
Inflow pulse area
Outflow pulse area
Dialysate flow
Ultrafiltration rate
Hematocrit
Precision of k ~ ± 5%
Variables required to calculate urea clearance
P. Kuhn, FMC
Measurement of conductivity pre and post dialyzer Translation into the resulting urea clearance by clinically validated algorithms
Dynamicconductivity pulse
k×tV

Nephrology
The OCM display
P. Kuhn, FMC
Nephrology
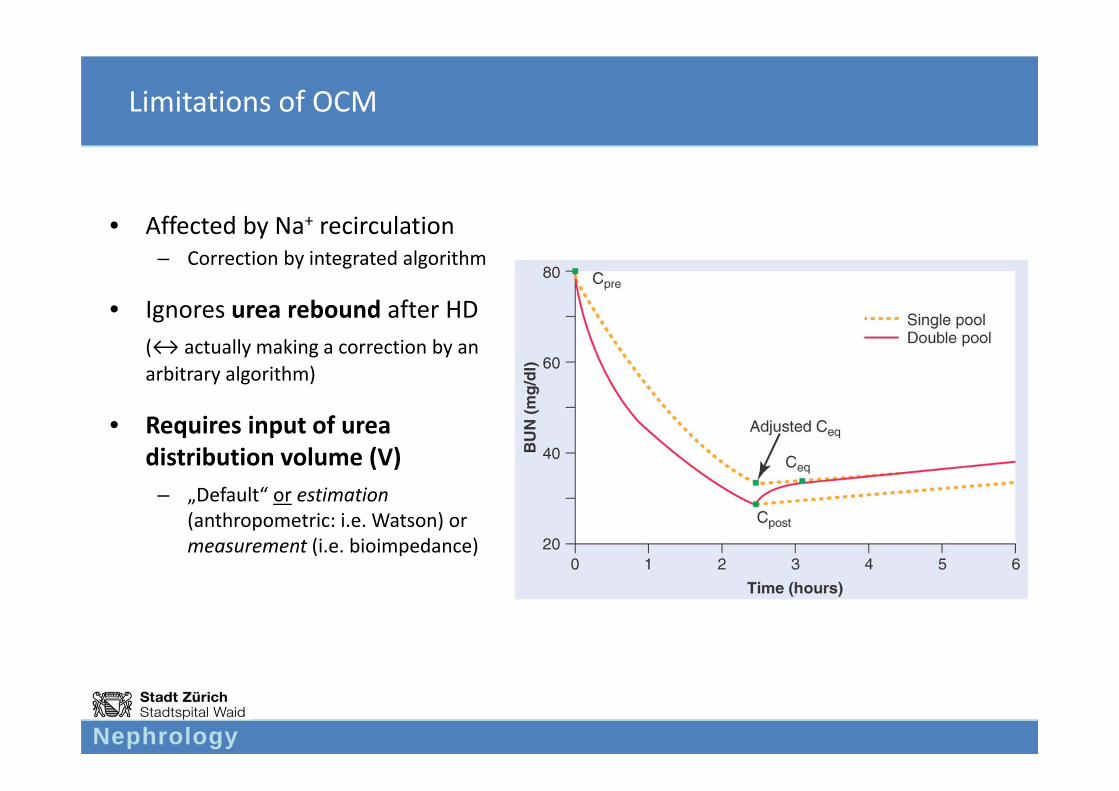
Limitations of OCM
• Affected by Na+ recirculation– Correction by integrated algorithm
• Ignores urea rebound after HD(↔ actually making a correction by an arbitrary algorithm)
• Requires input of urea distribution volume (V)
– „Default“ or estimation(anthropometric: i.e. Watson) or measurement (i.e. bioimpedance)

Nephrology
Validation of OCM based KtV determination
Lindley EJ et al. NDT 2009
Bioimpedance spectroscopy
Class. ureakinetic
modelling
Simplified ureakinetic
modelling
Underestimation of real KtV

Nephrology
Validation of OCM based KtV determination
High interindividual variability
Lindley EJ et al. NDT 2009
Nephrology
Benefits of online conductivity measurements (i.e. OCM FMC)
• Simple, free, non‐invasive
• Helpful in determining the quantity/quality of the individual treatment session as well as changes over time
Helpful in monitoring intraindividual changes

Nephrology
BLOOD TEMPERATURE MONITORING
Circulatory stabilityShunt recirculation

Nephrology
BTM module Fresenius
Heater
BTM inside
BTM outside
Blood lines
Temperature sensor
P. Kuhn, FMC

Nephrology
Recirculation measurement
T / C°
37°
36°
35°
34°
t/min 0 2 4 6 8 10 12
T: Dialysate
T: Venous blood
T: Arterial blood
Rec. start
Result
P. Kuhn, FMC

Nephrology
Use of BTM module
• Lowering body temperature improves blood pressure stability mainly in hypothermic patients– Dialysate temperature should be tailored to the predialysis body
temperature
• Measurement of shunt recirculation

Nephrology
Usefulness of blood temperature regulation in the outcome of acute kidney injury
CONCLUSIONS: These results suggest that both actively controlled body temperature and UF profiled by online monitoring systems have no significant impact on the incidence of intradialytic hypotension in the ICU setting. Further research is needed before the use of these new sophisticated automatic methods can be applied routinely to the ICU setting.
Nephrology
SUMMARY & RECOMMENDATIONS

Nephrology
Technique
Validity
Biologic Effect
Clinical Outcome
()
???

Nephrology
Personal recommendations
• Conductivity measurement: helpful to monitor dialysis quality and quantity (Kt/V) individually and over time
• Blood temperature measurement: helpful for timely detection of shunt recirculation
• Altogether probably not very helpful to reduce clinical endpoints (cardiovascular stability)
• No clinical outcome data available


Nephrology
“Nephrologists have an ethical responsibility not to lose interest in developing new technology”… James Tattersal, 2001