
Online Data Analysis for Librarians using SDA and the General Social Survey
29
Online Data Analysis for Librarians Maine Academic Libraries Day 2015 Celia Emmelhainz Colby College Christine Murray Bates College
-
Upload
celia-emmelhainz -
Category
Data & Analytics
-
view
29 -
download
0
Transcript of Online Data Analysis for Librarians using SDA and the General Social Survey

Online Data Analysis for Librarians
Maine Academic Libraries Day 2015
Celia Emmelhainz
Colby CollegeChristine Murray
Bates College

Goals of this Training
At the end of this session, you should:• know your online data analysis options
• create a simple table from data• be able to use SDA and the General Social Survey to answer a reference question
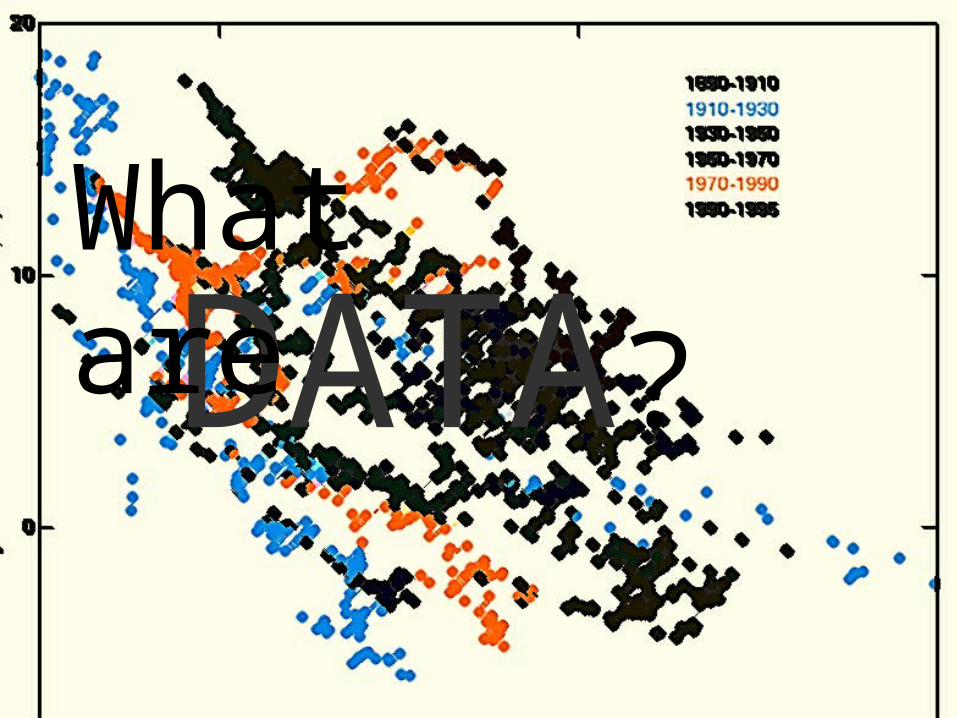
DATA?What are

o Numbers
o Quoteso Texto GPS
Pointso Materials

Social Science Data
“…the digital resources out of which social and economic statistics are produced. The data do not spontaneously spring into existence but are produced from an intentional research methodology.”
Geraci, D., Humphrey, C., Jacobs J. (2012) Data Basics. http://3stages.org/class/2012/pdf/data_basics_2012.pdf

Microdata Aggregate dataValues for individual observations
Summarized by geography, groups, etc.
Source: US Census Bureau, 2005 PUMS data sample; PUMS estimates
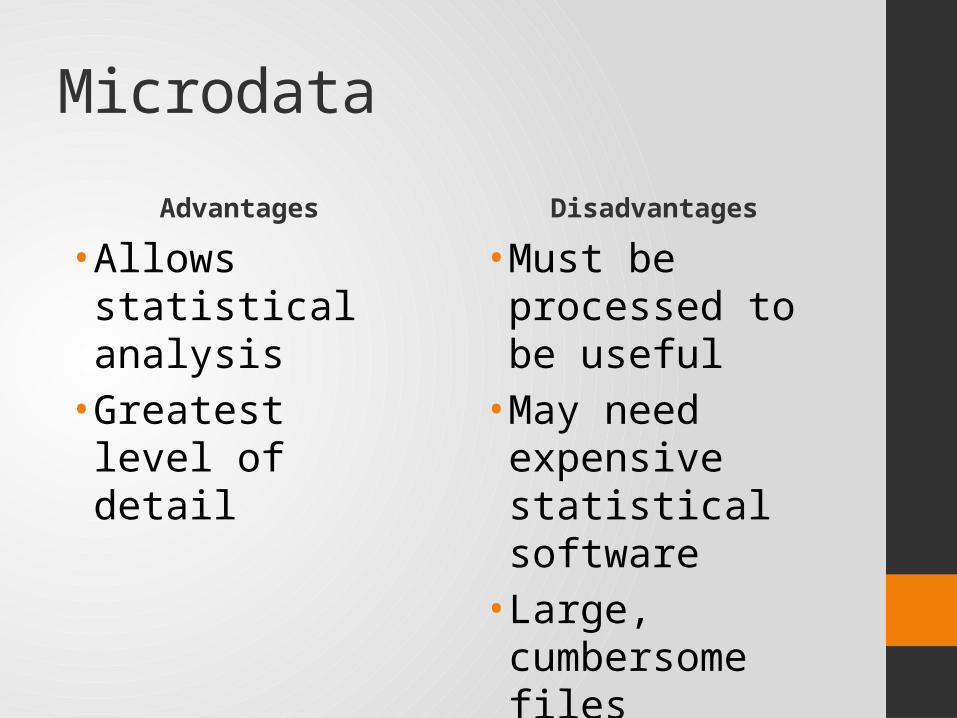
Microdata
Advantages
• Allows statistical analysis
• Greatest level of detail
Disadvantages
• Must be processed to be useful
• May need expensive statistical software
• Large, cumbersome files

Advantages of Online Data Analysis• Pedagogical tool• No assembly required• No need for statistical software• Do need to understand what data ‘mean’

What is SDA?
• Survey Documentation and Analysis, at http://sda.berkeley.edu/archive.htm
• Web interface for analyzing data, creating tables, and even some statistical analysis
• Berkeley archive contains General Social Survey, National Election Survey, and others
• Also used by other data archives (e.g. ICPSR)

Published statistics vs. do it yourself
Many data sources will publish ready-made tables of statistics that you can find online.
But what if it doesn’t have the information that you need?
http://www.norc.org/PDFs/GSS%20Reports/GSS_Trends%20in%20Gun%20Ownership_US_1972-2014.pdf

General Social Survey
a walkthrough
What is the GSS?
• Long-running opinion survey (since 1972)• U.S. national sample• Wide variety of attitudes on social issues,
plus some demographic info• Useful for trends in public opinion• Free to download or analyze online!

Making a table
Q: Are younger people more or less likely to be concerned about racial issues?

1. Select variables
Here, AGE copied to Row:

2. View variable details in SDA
• Question wording
• Frequency table
Christine Murray
At this point, I would ask, "Is this a great variable to use to answer my question?" Since the N for Yes values is so small

3. Pull up a table in SDA
BUT… each age is separated!

4: Recode (group) responses
Solution: recode the
variable and re-run!

5a: Interpreting the results

5b: Interpreting the results
Interesting, but…
why so many missing cases?

5c: Check the year!
Look up variable in ‘Codebook by Year’
Result: this question was only asked in one year.

Trends
Q: Have Americans become more accepting of working mothers?

Multi-Year: Trends Over Time
Same steps as in the Tables exercise, but using the YEAR variable

SDA: Charts
Chart Options allows you to create a simple line graph.

Comparing Means
Q: Are people with higher income less likely to support redistributive government policies?

SDA: Comparing Means
“Means” tab lets you compare mean of e.g. income to how a question is answered.

Other suggested exercises

Try Out the GSS yourself!Play with any variables, or try to answer these:• Are those who served longer in the military
(VETYEARS) more likely to support the DRAFT? • Does your ZODIAC sign relate to your MARITAL
status?• Does your REGION impact your thoughts on gun
control (GUNLAW)? • Does household size (HOMPOP) relate to how
rushed you feel in life (RUSHED)? • Does job satisfaction (SATJOB) vary according to
college DEGREE, SEX or RACE?

Questions?Comments?