Online College Students 2012 - University of Delaware · in the online learning environment. Online...
36
Online College Students 2012 Comprehensive Data on Demands and Preferences A Joint Project of The Learning House, Inc. and Aslanian Market Research Carol B. Aslanian David L. Clinefelter
Transcript of Online College Students 2012 - University of Delaware · in the online learning environment. Online...

Online College Students 2012Comprehensive Data on Demands and Preferences
A Joint Project of The Learning House, Inc. and Aslanian Market Research
Carol B. AslanianDavid L. Clinefelter

page | 2Online College Students 2012: Comprehensive Data on Demands and Preferences
Online College Students 2012: Comprehensive Data on Demands and Preferences
A number of individuals contributed to the project. Carol B. Aslanian, principal author, led the Aslanian Market Research team, which included Scott Jeffe, Susan Baer, and Steven Fischer. David Clinefelter led the Learning House team, which included Todd Zipper, Wendy Parrish, Sara Ekart, Sam Stefanova, Allison Lutes, Jennifer Thompson, and Emily Wheeler.
Suggested Citation: Aslanian, C. B., & Clinefelter, D. L. (2012). Online college students 2012: Comprehensive data on demands and preferences. Louisville, KY: The Learning House, Inc.
July 2012
Copyright ©2012 by The Learning House, Inc. and EducationDynamicsAll rights reserved. Published 2012.

page | 3Online College Students 2012: Comprehensive Data on Demands and Preferences
Table of Contents
INTRODUCTION: ONLINE LEARNING IN AMERICAN HIGHER EDUCATION 4
KEY FINDINGS AND OBSERVATIONS 5Primary Motivation to Study: It’s All About Careers 7
Trigger Events That Prompt College Study: The Economy and Jobs 8
Intended Credential: Degrees Dominate but Certificates Show Clout 9
Field of Study: Business As Usual 10
Type of Institution: Nonprofit Institutions Dominate 11
Location: Proximity Makes a Difference 13
Full- or Part-Time Study: Both in Demand 13
Undergraduate Credits Prior to Enrollment: Saving Time and Money 14
Preferred Length of Course: Shorter Is Better 14
Preferred Online Study Model: Self-Direction and Guided Instruction 15
Reason for Enrolling in Online Education: Have It Your Way 16
Most Positive Features of Online Education: Self-Direction and Independence 17
Less Positive Features of Online Education: Uninvolved Instructors 18
Concerns About Online Education: Length, Quality, and Cost 19
Institutional Choice: The Importance of Brand and Cost 20
Student Services: 24/7 Online Access 21
Choosing a Program: The Impact of Web Sites 22
Effectiveness of Electronic and Off-Line Advertising: Both Work 23
Online and Off-line Research Methods: Dominance of the Internet 24
Most Important Information on Institution Web Sites: Don’t Hide Your Costs 25
Length of Time and Frequency of Institutional Contact: Stay in Touch 25
Social Networking Profiles: A Connected Population 26
Mass Media Behavior: Tradition Continues 27
Online Behavior: Totally Connected 28
DEMOGRAPHIC PROFILE OF ONLINE STUDENTS 29
METHODOLOGY 34
REFERENCES 35
PARTNERS 36

page | 4Online College Students 2012: Comprehensive Data on Demands and Preferences
Higher education institutions today face many challenges. Administrators, staff, and faculty members must make difficult decisions, including reevaluating the very foundation of higher education: the classroom.
In a recent op-ed piece about institutions moving toward online delivery, David Brooks (2012) quotes the president of Stanford University as saying, “There is a tsunami coming [to higher education].” Similarly, according to Clayton Christensen and Henry Eyring (2011), American higher education now faces the first major “disruptive innovation” since the invention of the printed textbook. They define disruptive innovation as technology that forces an industry to reinvent the way it does business. What is higher education’s latest disruptive innovation? Online education.
Online courses have been available for more than 25 years, but only recently has technology caught up with online students’ desire to feel a sense of individuality in the online learning environment. Online learning not only allows institutions to serve more students at a lower expense, but it also improves teaching methodologies, enhances the learning experience, and increases interaction among students and instructors, sometimes even beyond the interaction possible in a traditional classroom. This ability to offer “mass personalization,” as Richard DeMillo calls it in his book Abelard to Apple (2011), has provided the tipping point to advance online learning. In a 2012 article in The Chronicle of Higher Education, DeMillo states:
Technology [can] deliver personalized experiences on a massive scale. [It] has already fomented revolutions in health care, government, manufacturing, marketing…and it would be a strange quirk of the universe if somehow education were exempt. …The rapid appearance of massive [numbers of] online courses, online-learning communities, and open courseware points to a renewed quest for a more tailored, individualized approach to higher education. These are all developments that undermine the idea of the university as a factory.
Online education has skyrocketed in the last decade. Eduventures estimates that in fall 2010, 2.78 million students enrolled in a fully online program, which represents 14% of all higher education enrollments (Silber & Condra, 2011). Furthermore, the Sloan Consortium reports that 1.6 million students enrolled in at least one online course in 2002, whereas 6.1 million students enrolled in fall 2010 (representing 31% of all students enrolled in higher education) (Allen & Seaman, 2011).
Introduction: Online Learning in American Higher Education

page | 5Online College Students 2012: Comprehensive Data on Demands and Preferences
In spring 2012, Aslanian Market Research and The Learning House, Inc. conducted surveys with 1,500 individuals nationwide who were at least 18 years of age and were recently enrolled, currently enrolled, or planned to enroll in a fully online undergraduate or graduate degree, certificate, or licensure program.
The surveys collected information on motivation for study; type, level, and field of study; provider institution; preferred schedules; needed services; strengths and weaknesses of the online format; effective promotional strategies and advertising methods; and a variety of other topics. Surveys also gathered information on the personal characteristics and circumstances of online students at the time they took their most recent undergraduate or graduate course.
Given the recent trend of rapid enrollment growth in online higher education and strong projections for future growth, we intend to supply information to colleges and universities that seek to serve online students.
Our findings include the following key observations for institutions to consider as they work toward building online enrollments:
• Individuals of all ages participate in online education. About 40% of online students are younger than the age of 30; in fact, approximately one out of every five online students is younger than the age of 25. We expect this segment to grow steadily as increased numbers of secondary school and traditional-age college students gain experience with online courses.
• For-profit institutions do not dominate online education. About two-thirds of online students attend not-for-profit institutions, and we predict that percentage will increase as more not-for-profit institutions begin offering online programs.
• Students who enroll in not-for-profit and for-profit institutions are more alike than different, particularly in regard to field of study, desired credentials, and their goals and motivation to pursue online education. With the exception of age and ethnic background, they share similar key demographic characteristics such as gender, income, employment status, and method of tuition payment.
• Although the large majority of online students enroll in degree programs, certificates attract 20% of the market, and we predict online certificate programs will steadily grow.
• Institutions that have a near-by campus or service center are highly attractive to online students. Most online students enroll in institutions within 100 miles of their home for their online study.
Key Findings and Observations
page | 6Online College Students 2012: Comprehensive Data on Demands and Preferences
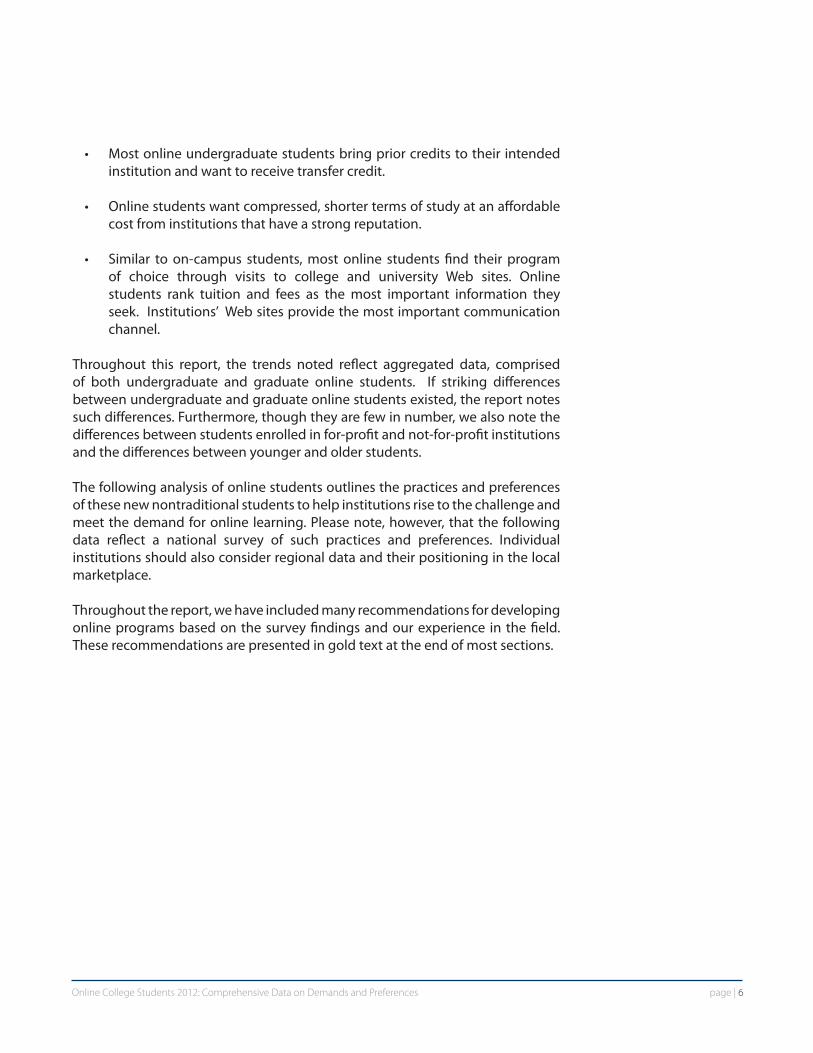
• Most online undergraduate students bring prior credits to their intended institution and want to receive transfer credit.
• Online students want compressed, shorter terms of study at an affordable cost from institutions that have a strong reputation.
• Similar to on-campus students, most online students find their program of choice through visits to college and university Web sites. Online students rank tuition and fees as the most important information they seek. Institutions’ Web sites provide the most important communication channel.
Throughout this report, the trends noted reflect aggregated data, comprised of both undergraduate and graduate online students. If striking differences between undergraduate and graduate online students existed, the report notes such differences. Furthermore, though they are few in number, we also note the differences between students enrolled in for-profit and not-for-profit institutions and the differences between younger and older students.
The following analysis of online students outlines the practices and preferences of these new nontraditional students to help institutions rise to the challenge and meet the demand for online learning. Please note, however, that the following data reflect a national survey of such practices and preferences. Individual institutions should also consider regional data and their positioning in the local marketplace.
Throughout the report, we have included many recommendations for developing online programs based on the survey findings and our experience in the field. These recommendations are presented in gold text at the end of most sections.

page | 7Online College Students 2012: Comprehensive Data on Demands and Preferences
Primary Motivation to Study: It’s All About Careers
In 1980, the College Board published a seminal report that identified when and why adult students decided to begin their studies (Aslanian & Brickell, 1980). The report presented a “transitions hypothesis,” which posited that adults most often enroll in higher education when they face a life transition.
More than 30 years later, the hypothesis still remains true among online students. The vast majority of online students in our 2012 study pointed to some change in their lives as their reason for beginning their online program. Changes in people’s careers most often directed them to further education (as it did in 1980). Trigger events in their careers and family lives also affected when they decided to start their studies (as it did in 1980).
More than 90% of online students said their primary motivation for returning to school involved their careers. Most often they desired to advance in their careers, and next to change their careers. Undergraduate students more often desired to change careers, whereas graduate students more often sought advancement in their careers.
To advance incurrent career
To change careers
To keep up to datein current career
To meet credential orlicensure requirements
for current job
Personal reasons not related to job or career
Other
0% 5% 10% 15% 20% 25% 30% 35% 40% 45% 50%
46%
29%
12%
5%
4%
4%
Primary Motivation

page | 8Online College Students 2012: Comprehensive Data on Demands and Preferences
Trigger Events That Prompt College Study: The Economy and Jobs
The largest proportion of online students today (one-third) continues learning because they desire a promotion or increase in their salaries. These individuals may have missed the promotion they sought or may face family or personal circumstances that call for more income. Failing to rise to the next level or increase income drives many people back to school to gain the credentials they need to succeed. The economy has also driven numerous people back to school because many people are unemployed or underemployed as the nature of work changes due to recent and rapid changes in technology. Finally, changes such as reaching a certain age or stage in life motivate some individuals to make decisions about their future.
To qualify for promotion or salary increase
State of the economy
Reached a “milestone” age(e.g., 30, 40, 50)
Lost job or family member lost job
Moved to new location
Children left home
Got married
Got divorced or separated
Other
0% 5% 10% 15% 20% 25% 30% 35%
33%
19%
15%
9%
4%
3%
2%
2%
13%
Key Trigger Events
Individuals return to school primarily for career reasons. Prospective students of all ages need to see a clear connection between learning and success in their careers.

page | 9Online College Students 2012: Comprehensive Data on Demands and Preferences
Intended Credential: Degrees Dominate but Certificates Show Clout
About 75% of fully online students study for a degree. At the undergraduate level, two-thirds of these students pursue bachelor’s degrees, and at the graduate level, close to 90% seek master’s degrees.
The remainder of online students surveyed, an impressive 25%, seek certificates and licenses, which presents a new opportunity for institutions that focus exclusively on degrees. In our regional and local market analyses conducted for specific colleges, we have noted an increasing number of online institutions that offer such short-term, compressed programs that have a specific career focus.
No institution should ignore degree study’s strong share of the online education market. At the same time, “stackable” certificates (multiple certificates applied toward a degree) are gaining popularity. As interest in competency-based learning rises, so will the demand for short-term, career-oriented, and compressed certificate study.
Degree73%
License8%
Certi�cate orDiploma19%
Intended Credential

page | 10Online College Students 2012: Comprehensive Data on Demands and Preferences
Field of Study: Business As Usual
One-third of online students study in the field of business (primarily business administration and management), making it the most popular area of study at both undergraduate and graduate levels. Next in popularity are the social sciences and health professions at the undergraduate level and education at the graduate level. The STEM (science, technology, engineering, mathematics) disciplines are gaining importance at both the undergraduate and graduate level, and we expect these fields of study to grow steadily in the years ahead, given the projected increase in the number of jobs in these fields.
Furthermore, in examining field of study preferences according to specific credentials, these patterns are consistent. Among online degree students, business again dominates with one-third market share, followed by the social sciences and then health professions and STEM. Among those in certificate, diploma, and licensing programs, the top four areas of study are similar.
Business34%
HealthProfessions
16%
SocialSciences16%
STEM13%
Education11%
Humanities orLiberal Arts
6%Other5%
Field of Study
page | 11Online College Students 2012: Comprehensive Data on Demands and Preferences
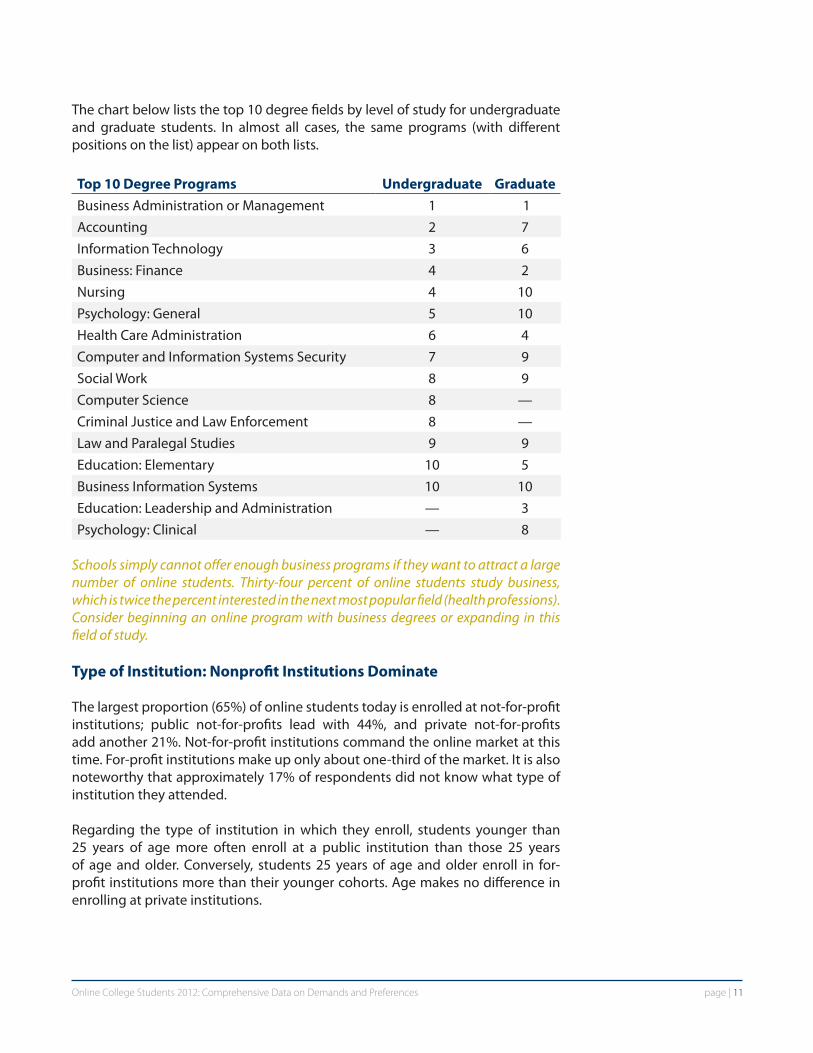
The chart below lists the top 10 degree fields by level of study for undergraduate and graduate students. In almost all cases, the same programs (with different positions on the list) appear on both lists.
Top 10 Degree Programs Undergraduate GraduateBusiness Administration or Management 1 1Accounting 2 7Information Technology 3 6Business: Finance 4 2Nursing 4 10Psychology: General 5 10Health Care Administration 6 4Computer and Information Systems Security 7 9Social Work 8 9Computer Science 8 —Criminal Justice and Law Enforcement 8 —Law and Paralegal Studies 9 9Education: Elementary 10 5Business Information Systems 10 10Education: Leadership and Administration — 3Psychology: Clinical — 8
Schools simply cannot offer enough business programs if they want to attract a large number of online students. Thirty-four percent of online students study business, which is twice the percent interested in the next most popular field (health professions). Consider beginning an online program with business degrees or expanding in this field of study.
Type of Institution: Nonprofit Institutions Dominate
The largest proportion (65%) of online students today is enrolled at not-for-profit institutions; public not-for-profits lead with 44%, and private not-for-profits add another 21%. Not-for-profit institutions command the online market at this time. For-profit institutions make up only about one-third of the market. It is also noteworthy that approximately 17% of respondents did not know what type of institution they attended.
Regarding the type of institution in which they enroll, students younger than 25 years of age more often enroll at a public institution than those 25 years of age and older. Conversely, students 25 years of age and older enroll in for-profit institutions more than their younger cohorts. Age makes no difference in enrolling at private institutions.

page | 12Online College Students 2012: Comprehensive Data on Demands and Preferences
Public, not-for-pro�t44%
Private,not-for-pro�t
21%
For-pro�t35%
*Note: The table above includes reclassified data from the 17% of respondents who did not know what type of institution they attended. We reclassified the data by examining the individual responses that identified colleges by name.
Type of Institution*
Although not-for-profit institutions collectively enroll the majority of online students, a small set of prominent and well-known for-profit institutions, led by the University of Phoenix, continue to individually dominate market share.
By far the largest proportion (about 15%) of online students studies at the University of Phoenix. No other institution comes close to its share of the online student market. The university began its online programming in 1989 and has become a market leader in online education in the last two decades. Kaplan, DeVry, Capella, Ashford, Strayer, and Walden follow but with far fewer enrollments among for-profit institutions.
Among public and private not-for-profit institutions, hundreds, if not thousands, of institutions each attract a relatively small share of the online market. Institutions that have noteworthy enrollment numbers include Liberty University, University of Massachusetts, University of Maryland: University College, California State University, New York University, University of California, and Nova Southeastern University.
Regarding level of study, public institutions more often serve undergraduate students (62%) than graduate students (38%). In contrast, private institutions serve a larger proportion of graduate students (69%) than undergraduate

page | 13Online College Students 2012: Comprehensive Data on Demands and Preferences
students (31%). For-profit institutions serve more equal shares of undergraduates (56%) and graduate students (44%).
Although for-profit institutions spend more money on marketing and advertising (typically 20% or more of intended revenue) that increases their visibility, not-for-profit institutions are rapidly growing in the online marketplace because of their brand and location. As competition increases in all sectors, institutions of all types need to differentiate from others and set forth a clear, compelling value proposition.
Location: Proximity Makes a Difference
About 80% of online students live within 100 miles of a campus or service center of the institution they attend, and the large majority live within 50 miles. Geographic proximity is a major advantage in attracting online students. Furthermore, among all the institutions that respondents considered during their college search, the farthest institution they considered was often located less than 50 miles from where they resided.
Online students seriously consider physical location when selecting an institution. Institutions that offer online programs should promote their programs to local residents within 100 miles of campus. Fully online institutions should consider their physical presence across key residential areas of the country.
Full- or Part-Time Study: Both in Demand
Among degree seekers, a fairly equal split exists among those who study full-time and part-time. However, nearly 60% of undergraduate students study full-time, and about 60% of graduate students prefer part-time study.
About two-thirds of online students younger than the age of 25 study full-time, and less than half of online students 25 years of age or older study full-time. Additionally, as age increases, the tendency to study part-time (as opposed to full-time) also increases.
For any online program, colleges should offer and promote arrangements that enable students to study either full-time or part-time, depending on individual preference. Key factors to consider include the term length and the schedule of classes to accommodate both types of learners.

page | 14Online College Students 2012: Comprehensive Data on Demands and Preferences
Undergraduate Credits Prior to Enrollment: Saving Time and Money
More than 80% of undergraduate online students brought transfer credits to their online institutions. On average, they had about 35 credits to transfer, but one out of four brought 60 or more credits.
1 to 15
16 to 30
31 to 59
60 to 99
100+
none
0% 5% 10% 15% 20% 25%
20%
8%
18%
19%
18%
17%
Undergraduate Credits Prior to Enrollment
Institutions that welcome and accept transfer credits are obviously very attractive to prospective online students. Transferring prior credits helps students reduce total tuition costs and accelerate the completion of their program.
Preferred Length of Course: Shorter Is Better
The largest proportion of online students prefers courses that are six to eight weeks long. The standard semester-length courses that traditional institutions typically offer do not work in the online marketplace. Online students also prefer courses offered year-round because these courses allow students to steadily continue their studies or stop for brief periods of time if necessary.
Deliver online programs in eight-week (or fewer) terms that run continuously throughout the year.
5 or fewer weeks
6 to 8 weeks
9 to 12 weeks
13 or more weeks
0% 10% 20% 30% 40%
14%
15%
32%
40%
Preferred Length of Course

page | 15Online College Students 2012: Comprehensive Data on Demands and Preferences
Preferred Online Study Model: Self-Direction and Guided Instruction
When given a choice of instructor-led, independent, or tutorial instruction, online students are rather equally split on their preference. However, in analyzing differences at the undergraduate versus graduate levels, we note that the largest proportion of online undergraduate students prefers independent study, while the largest proportion of online graduate students prefers instructor-led online study.
Online Study Model Percent Instructor-led: Students complete a series of instructor-led learning activities and discussion forums with a class of other students and complete assignments and exams as scheduled.
35%
Independent: Students study independently at their own pace, with books and other resources that the institution provides, and then complete assignments and exams.
33
Tutorial: Students complete a series of learning activities at their own pace, with an instructor available to answer questions, and then complete assignments or exams.
32
Institutions must assess the advantages and benefits of each model so they can support the model they believe will work for them. However, given that the majority of programs today are instructor led, colleges should consider independent study or tutorial options for special populations. To best meet the demands of online students overall, institutions should offer multiple models.

page | 16Online College Students 2012: Comprehensive Data on Demands and Preferences
Reason for Enrolling in Online Education: Have It Your Way
Most online students are older, have past experiences in higher education, and have several responsibilities in life, so they seek convenience and flexibility when furthering their education. Millions of postsecondary students have turned to online education because it enables them to fit education around their work and family responsibilities and to study anytime and anywhere.
Ability to balancework, family, and
school responsibilities
Ability to studyanytime and anywhere
Availability of accelerated,fast-track courses
Overall lower cost
Faster completion time
Access to a greatervariety of programs
Availability ofcertain credentials
A more e�ectivelearning method
Other
0% 10% 20% 30% 40% 50% 60% 70%
2%
9%
9%
12%
18%
30%
37%
64%
68%
Reason for Enrolling in Online Study
Institutions should avoid required synchronous activities that limit student flexibility and also work to improve asynchronous methods that maintain a high level of communication among students and faculty members.
Survey respondents made the following comments about their reasons for enrolling in online study.
“I don’t have to show up to a classroom at a specific time. I can study at my dining room table in my pajamas with no makeup if I want!”
“You can literally go to school around your schedule. I sometimes travel for work, and I was able to keep up with my schoolwork while I’m on the road.”
“Online allows flexibility and group work with people who are all over the world. I was able to be a full-time mom, full-time employee, and full-time student without too much stress.”

page | 17Online College Students 2012: Comprehensive Data on Demands and Preferences
Most Positive Features of Online Education: Self-Direction and Independence
Online students unquestionably value the independence, self-direction, and control online education offers them. Among several factors that drive them to online programs, students most often point to “the ability to study when and where I want” and “the ability to study at my own pace.”
Ability to studyanywhere and anytime
Ability to studyat one’s own pace
Convenient schedulesand formats
Ability to study at home(elimination of travel)
Ability to study aroundfamily responsibilities
Ability to study aroundwork obligations
0% 5% 10% 15% 20% 25% 30% 35%
31%
6%
7%
10%
16%
24%
Most Positive Features of Online Study
A lead marketing message should focus on the fact that the institution knows its students and supports them. Use testimonials from busy, working students trying to juggle family, work, and studies. Key attractors include flexibility and self-pacing.

page | 18Online College Students 2012: Comprehensive Data on Demands and Preferences
Less Positive Features of Online Education: Uninvolved Instructors
Online students view the lack of direct interaction with instructors and other students as the greatest disadvantage of online study. Next most frequently, they point to problems in contacting and communicating with instructors. Few respondents were concerned about the difficulty of online learning or external perceptions of quality in regard to online study.
In addition, online students said they were only moderately satisfied by their online instructors’ availability, which coincides with students’ top perceived disadvantages in online education and also supports the high level of importance students give to having easy and open access to their instructors.
Less Positive Feature PercentLack of direct contact and interaction with instructors and students 37%Inconsistent or poor contact and communication with instructors 24Motivation, attention, or focus challenges 20External perceptions of quality of online study 5More difficult than classroom 4Inconsistent or poor quality of instruction 4Cost 2Other 5
Survey respondents voiced the following concerns about online study.
“I’d like to interact more with other students and my instructors so we can share knowledge and help each other.”
“Online education is not for those who lack discipline. One must be a self-starter and very responsible because online studying has no set structure.”
“It’s difficult to get ahold of an instructor at a time that works for me. Sometimes instructions are not clear or can be read two different ways, and it can take a day or more to receive clarification.”
Set expectations for the quantity and quality of faculty interaction with students and provide appropriate faculty development.

page | 19Online College Students 2012: Comprehensive Data on Demands and Preferences
Concerns About Online Education: Length, Quality, and Cost
Students were most concerned about the length of time to complete their program and the quality of online study (especially among graduate students). The survey showed the availability of financial aid as the next most important concern.
In addition, when asked to describe their employers’ acceptance of online study, the vast majority of online students reported that their employers accepted online study.
Concern PercentTime to complete studies 59%Quality of online study 57Availability of financial aid 54Employers’ acceptance of online study 49Having the self-discipline to do well 30Fulfilling admissions requirements 27Having the necessary academic skills 26Having all the necessary equipment or hardware 26Having the appropriate technical skills 20
Institutions need to give attention, clarification, and specific responses to students’ top three concerns. Marketing efforts should focus on completion time, tangible evidence of quality, and detailed information on how to obtain financial aid. Additionally, employer testimonials or endorsements can also help ease concerns about online study. Institutions can use these endorsements to reinforce students’ confidence in online education to help them reach their career goals.

page | 20Online College Students 2012: Comprehensive Data on Demands and Preferences
Institutional Choice: The Importance of Brand and Cost
Prospective online students seek an affordable high-quality institution that has a good reputation in their intended field of study. More than half the respondents also indicated that factors such as successful career placement, generous transfer credit policies, simple admissions processes, and no set class meeting times all affect their enrollment decision.
FactorsPercent
(Very Important)
Reputation of institution 75%Cost of tuition and fees 73Recognition in your field of study as a high-quality institution 65Availability of majors or concentrations related to occupations that have large numbers of job openings
61
Successful career placement 56Acceptance of transfer credits 56Simplicity of admissions process and documents 53Scholarship opportunities 53No set class meeting times 52Faculty members who teach part-time and work as practitioners in their field
52
Positive interactions with financial aid personnel 51No on-campus requirements 49Availability of general education courses that teach workplace skills such as problem solving, critical thinking, and teamwork
43
Tools for building community with other online students 42Faculty members who teach full-time and possess a doctorate 42Availability of basic writing, math, and reading courses 36Reputation as a rigorous program 34Internship opportunities 34Employee tuition discounts and benefits 33Set class times that provide facilitated group interaction 32School has a relationship with your current employer 31Alumni network and program 30Placement or ranking on magazine or industry list 30Recommendation of a friend or family member 26Military tuition discounts and benefits 23
Online programs should publish their tuition and fee information prominently, ensure programs have strong endorsements from prospective employers in related fields, and maximize the ease of enrolling. Institutions should solicit testimonials and endorsements from employers and former students that speak to the quality of programs and the applicability of subject matter to current job opportunities.

page | 21Online College Students 2012: Comprehensive Data on Demands and Preferences
Student Services: 24/7 Online Access
A large percentage of students list online library and research services and 24/7 technical support as important student services. The survey showed academic advising as the next most important factor. The majority of online students work full-time and seek to advance or change their careers, so about half of the respondents rate career-related assistance as important.
Student ServicesPercent
(Important)
Online library and research 74%24/7 technical support 67Academic advising 58Career placement 50Career coaching and planning 49Student support and coaching 49Writing assistance and tutoring 43Math assistance and tutoring 41
Online program services must use technology to make study as easy as possible, help students advance their careers, and help students excel in their program of study. Regular, effective advising or coaching can be instrumental in retaining students. Consider hiring professional staff to advise and coach students.

page | 22Online College Students 2012: Comprehensive Data on Demands and Preferences
Choosing a Program: The Impact of Web Sites
The largest proportion of online students (61%) initially seeks information about a program of interest directly from an institution’s Web site. This suggests that many online students already know the institution in which they will eventually enroll. Some students know about the institution because they reside in the same region (79% enrolled at an institution within 100 miles of where they reside), and others know about some large nationwide institutions likely because of their large-scale marketing and promotional efforts.
Almost half of online students initially use an Internet search engine to determine their online programs of interest, which points to the importance of search engine optimization (SEO) in attracting students.
Initial Search Methods Percent Specific institution’s Web site 61%Internet search engine such as Google, Bing, or Yahoo 48Institution search site such as eLearners.com, ClassesUSA.com, or eLearnPortal.com
28
Conversation with friends or family 26Conversation with employer or supervisor 18Other 2
Regional and national institutions must maximize the top-of-mind awareness (TOMA) of their online programs among people residing in their region. Institutions must also ensure their Web sites (and particularly their home pages) are attractive, informative, easily navigable, and highly optimized for prospective online students. Institutional Web sites are the single most important tool that online students use to make their enrollment decision.
page | 23Online College Students 2012: Comprehensive Data on Demands and Preferences
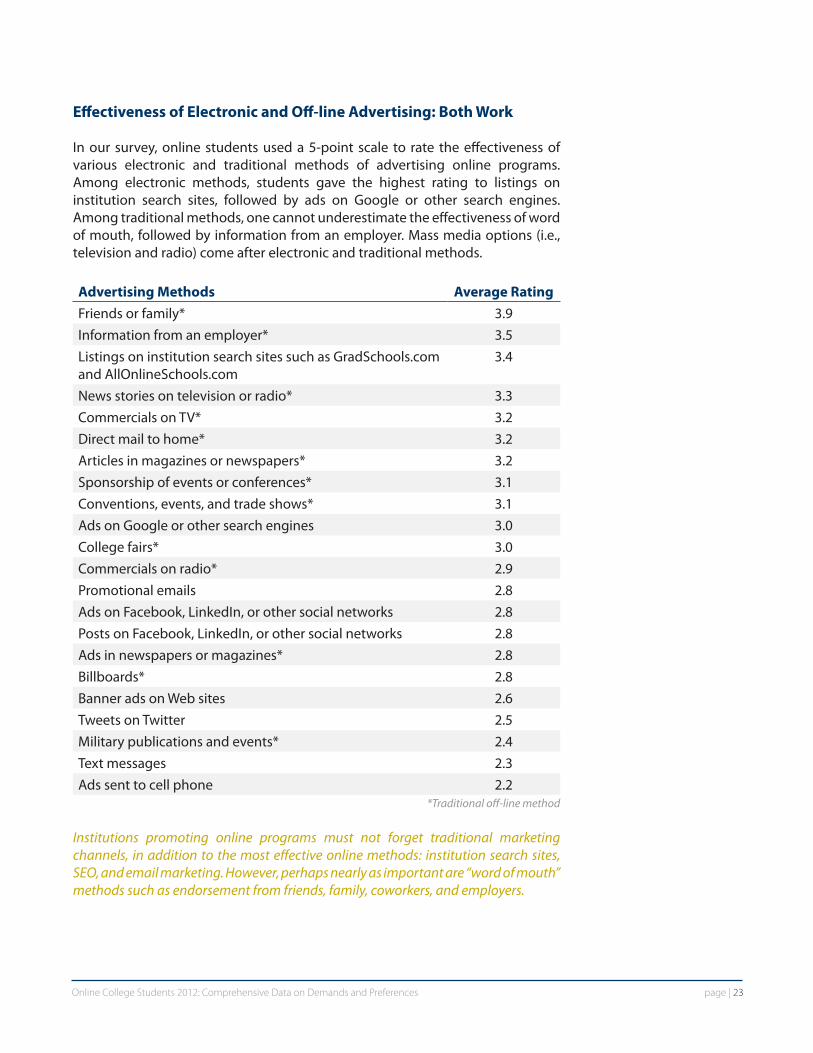
Effectiveness of Electronic and Off-line Advertising: Both Work
In our survey, online students used a 5-point scale to rate the effectiveness of various electronic and traditional methods of advertising online programs. Among electronic methods, students gave the highest rating to listings on institution search sites, followed by ads on Google or other search engines. Among traditional methods, one cannot underestimate the effectiveness of word of mouth, followed by information from an employer. Mass media options (i.e., television and radio) come after electronic and traditional methods.
Advertising Methods Average RatingFriends or family* 3.9Information from an employer* 3.5Listings on institution search sites such as GradSchools.com and AllOnlineSchools.com
3.4
News stories on television or radio* 3.3Commercials on TV* 3.2Direct mail to home* 3.2Articles in magazines or newspapers* 3.2Sponsorship of events or conferences* 3.1Conventions, events, and trade shows* 3.1Ads on Google or other search engines 3.0College fairs* 3.0Commercials on radio* 2.9Promotional emails 2.8Ads on Facebook, LinkedIn, or other social networks 2.8Posts on Facebook, LinkedIn, or other social networks 2.8Ads in newspapers or magazines* 2.8Billboards* 2.8Banner ads on Web sites 2.6Tweets on Twitter 2.5Military publications and events* 2.4Text messages 2.3Ads sent to cell phone 2.2
*Traditional off-line method
Institutions promoting online programs must not forget traditional marketing channels, in addition to the most effective online methods: institution search sites, SEO, and email marketing. However, perhaps nearly as important are “word of mouth” methods such as endorsement from friends, family, coworkers, and employers.
page | 24Online College Students 2012: Comprehensive Data on Demands and Preferences
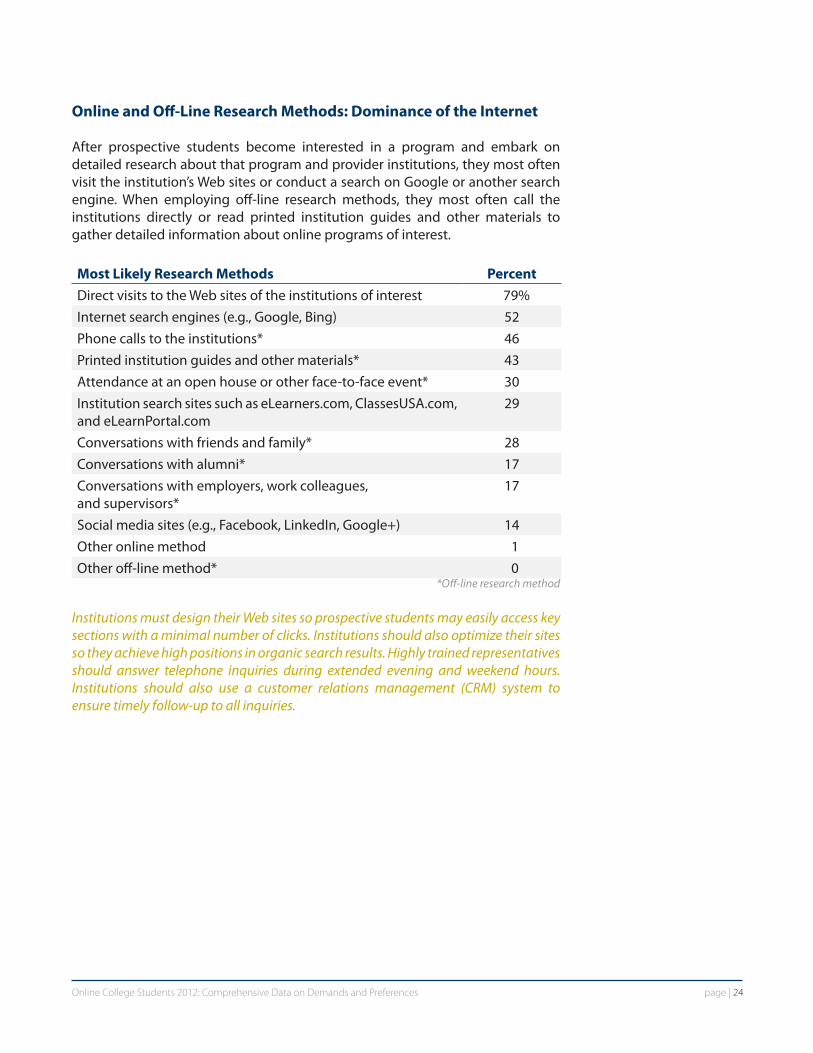
Online and Off-Line Research Methods: Dominance of the Internet
After prospective students become interested in a program and embark on detailed research about that program and provider institutions, they most often visit the institution’s Web sites or conduct a search on Google or another search engine. When employing off-line research methods, they most often call the institutions directly or read printed institution guides and other materials to gather detailed information about online programs of interest.
Most Likely Research Methods PercentDirect visits to the Web sites of the institutions of interest 79%Internet search engines (e.g., Google, Bing) 52Phone calls to the institutions* 46Printed institution guides and other materials* 43Attendance at an open house or other face-to-face event* 30Institution search sites such as eLearners.com, ClassesUSA.com, and eLearnPortal.com
29
Conversations with friends and family* 28Conversations with alumni* 17Conversations with employers, work colleagues, and supervisors*
17
Social media sites (e.g., Facebook, LinkedIn, Google+) 14Other online method 1Other off-line method* 0
*Off-line research method
Institutions must design their Web sites so prospective students may easily access key sections with a minimal number of clicks. Institutions should also optimize their sites so they achieve high positions in organic search results. Highly trained representatives should answer telephone inquiries during extended evening and weekend hours. Institutions should also use a customer relations management (CRM) system to ensure timely follow-up to all inquiries.

page | 25Online College Students 2012: Comprehensive Data on Demands and Preferences
Most Important Information on Institution Web Sites: Don’t Hide Your Cost
When asked to select the top three most important pieces of information they looked for on institution Web sites, the largest proportion of online students cited tuition and fee information.
Institution Web Site Information PercentTuition and fee information 67%Available degree majors and programs 35Admissions requirements 34Courses included in a program 33Course schedules 25Descriptions of specific courses 21Financial aid information 21Career options and career placement 18
Many institutions tend to “hide” their tuition and fees. In so doing, they risk losing many of the 80% of prospective students who visit the Web sites first for such information. Not only should cost (and financial aid) information be easy to find in one or two clicks, but it also must be easy to understand.
Length of Time and Frequency of Institutional Contact: Stay in Touch
Typically, about 80% of prospective online students would like an institution they contacted to respond within two days. Nearly half want contact within 24 hours.
Response Time Percent Within hours 13%24 hours 36Two days 30Three to seven days 16More than one week 5
Furthermore, prior to making a final enrollment decision, the largest proportion of online students prefers ongoing weekly communication from institutions they contacted.
page | 26Online College Students 2012: Comprehensive Data on Demands and Preferences
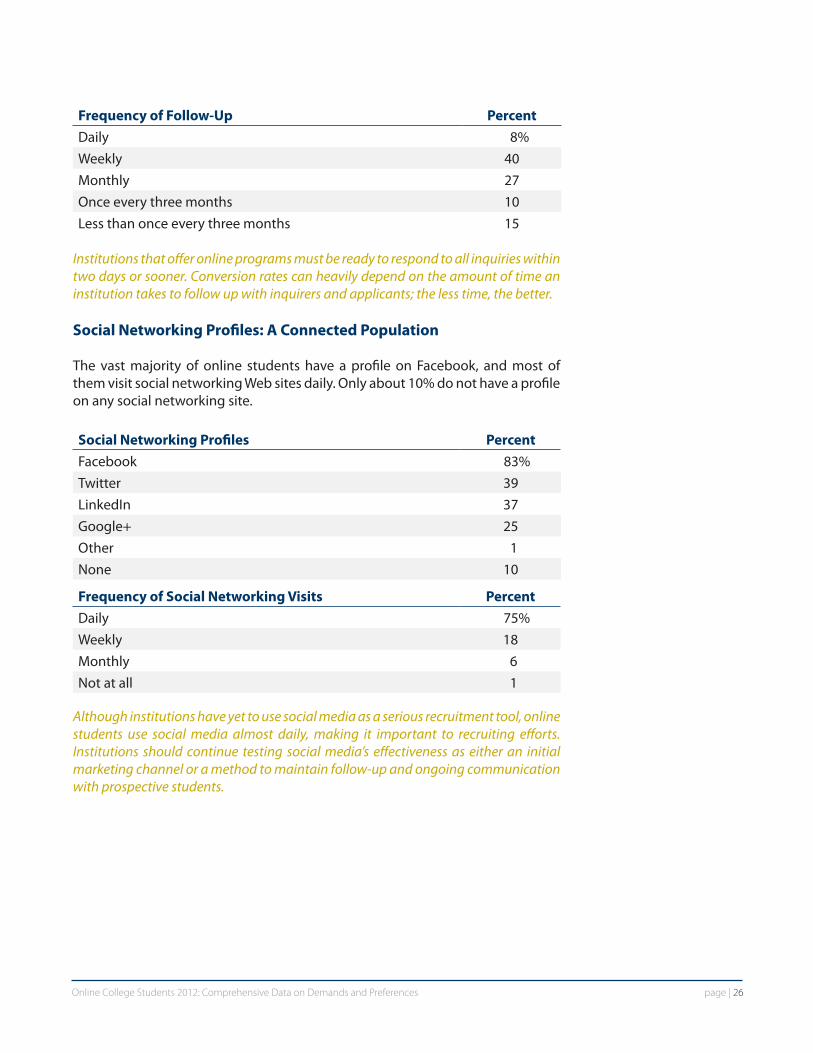
Frequency of Follow-Up PercentDaily 8%Weekly 40Monthly 27Once every three months 10Less than once every three months 15
Institutions that offer online programs must be ready to respond to all inquiries within two days or sooner. Conversion rates can heavily depend on the amount of time an institution takes to follow up with inquirers and applicants; the less time, the better.
Social Networking Profiles: A Connected Population
The vast majority of online students have a profile on Facebook, and most of them visit social networking Web sites daily. Only about 10% do not have a profile on any social networking site.
Social Networking Profiles PercentFacebook 83%Twitter 39LinkedIn 37Google+ 25Other 1None 10
Frequency of Social Networking Visits PercentDaily 75%Weekly 18Monthly 6Not at all 1
Although institutions have yet to use social media as a serious recruitment tool, online students use social media almost daily, making it important to recruiting efforts. Institutions should continue testing social media’s effectiveness as either an initial marketing channel or a method to maintain follow-up and ongoing communication with prospective students.
page | 27Online College Students 2012: Comprehensive Data on Demands and Preferences
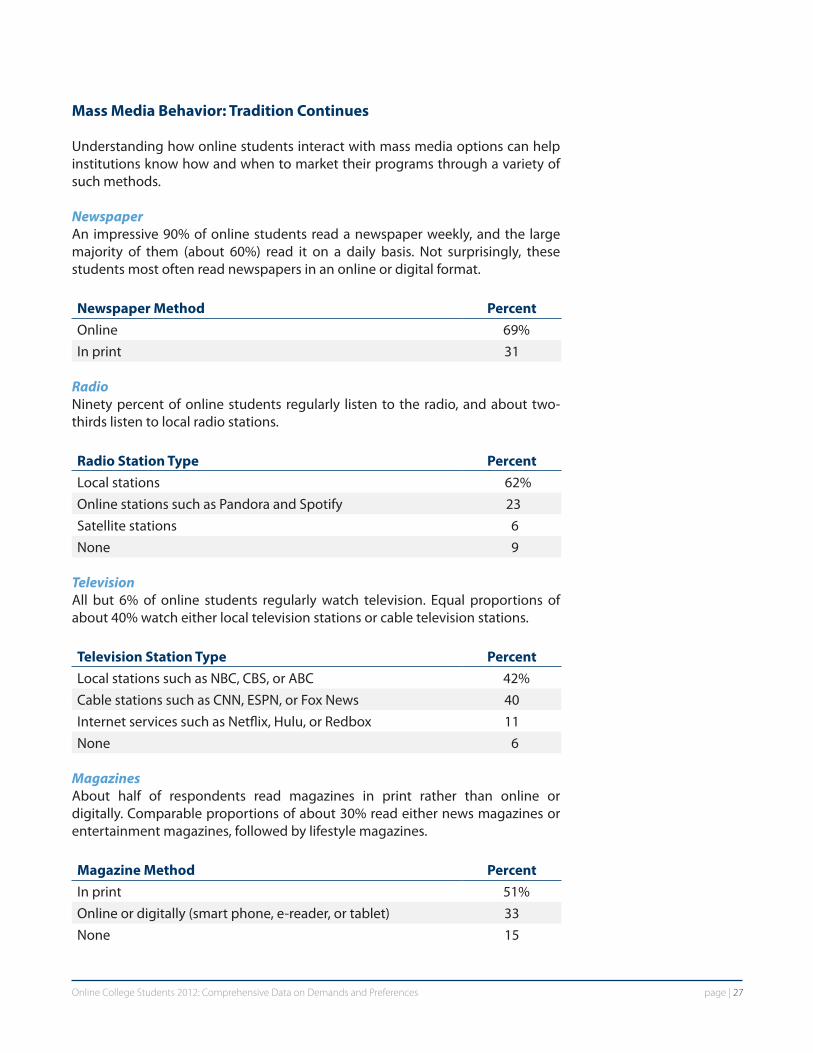
Mass Media Behavior: Tradition Continues
Understanding how online students interact with mass media options can help institutions know how and when to market their programs through a variety of such methods.
Newspaper An impressive 90% of online students read a newspaper weekly, and the large majority of them (about 60%) read it on a daily basis. Not surprisingly, these students most often read newspapers in an online or digital format.
Newspaper Method Percent Online 69%In print 31
Radio Ninety percent of online students regularly listen to the radio, and about two-thirds listen to local radio stations.
Radio Station Type Percent Local stations 62%Online stations such as Pandora and Spotify 23Satellite stations 6None 9
Television All but 6% of online students regularly watch television. Equal proportions of about 40% watch either local television stations or cable television stations.
Television Station Type Percent Local stations such as NBC, CBS, or ABC 42%Cable stations such as CNN, ESPN, or Fox News 40Internet services such as Netflix, Hulu, or Redbox 11None 6
MagazinesAbout half of respondents read magazines in print rather than online or digitally. Comparable proportions of about 30% read either news magazines or entertainment magazines, followed by lifestyle magazines.
Magazine Method PercentIn print 51%Online or digitally (smart phone, e-reader, or tablet) 33None 15

page | 28Online College Students 2012: Comprehensive Data on Demands and Preferences
Type of Magazine Most Frequently Read PercentNews magazines (Time, Newsweek) 31%Entertainment magazines (People, Us Weekly) 28Lifestyle magazines (Consumer Reports, Reader’s Digest, Oprah) 26Sports magazines (Sports Illustrated, ESPN The Magazine) 14Other 2
Although online students use the Internet to search and communicate, they also use and visit mass media channels of communication. Colleges must integrate these options into their overall marketing campaigns
Online Behavior: Totally Connected
In addition to their online studies, about 70% of online students spend 10 or more hours online weekly. They most often visit social media Web sites, followed by news and shopping sites.
Hours Per Week Online PercentLess than 10 28%10 to 19 3720 to 29 1930 to 39 340 to 49 850 to 59 260 or more 3
Type of Site Most Frequently Visited PercentSocial media 52%Local or regional news 46National news (CNN.com, FoxNews.com) 45Shopping (QVC.com, Amazon.com) 44Entertainment 36Sports (SI.com, ESPN.com) 15Auction (eBay.com, QuiBids.com) 15Lifestyle 15Computer gaming 9Other 2
In an era in which no single medium can communicate everything, online institutions must inform prospective students of what they offer through a mixture of both new and traditional media. Students watch, read, listen, and most certainly “surf.”

page | 29Online College Students 2012: Comprehensive Data on Demands and Preferences
Demographic Profile of Online Students
In general, online students nationwide most often fit the following profile:
Online students are typically Caucasian females about 33 years of age who are not the first in their family to attend college and who typically have a total family income of about $66,500. They work full-time for an employer who offers tuition reimbursement.
About 25% of undergraduate online students had already earned a bachelor’s degree or higher before they most recently enrolled in undergraduate study. About 35% of graduate online students had already earned a master’s degree or higher before they most recently enrolled in graduate study.
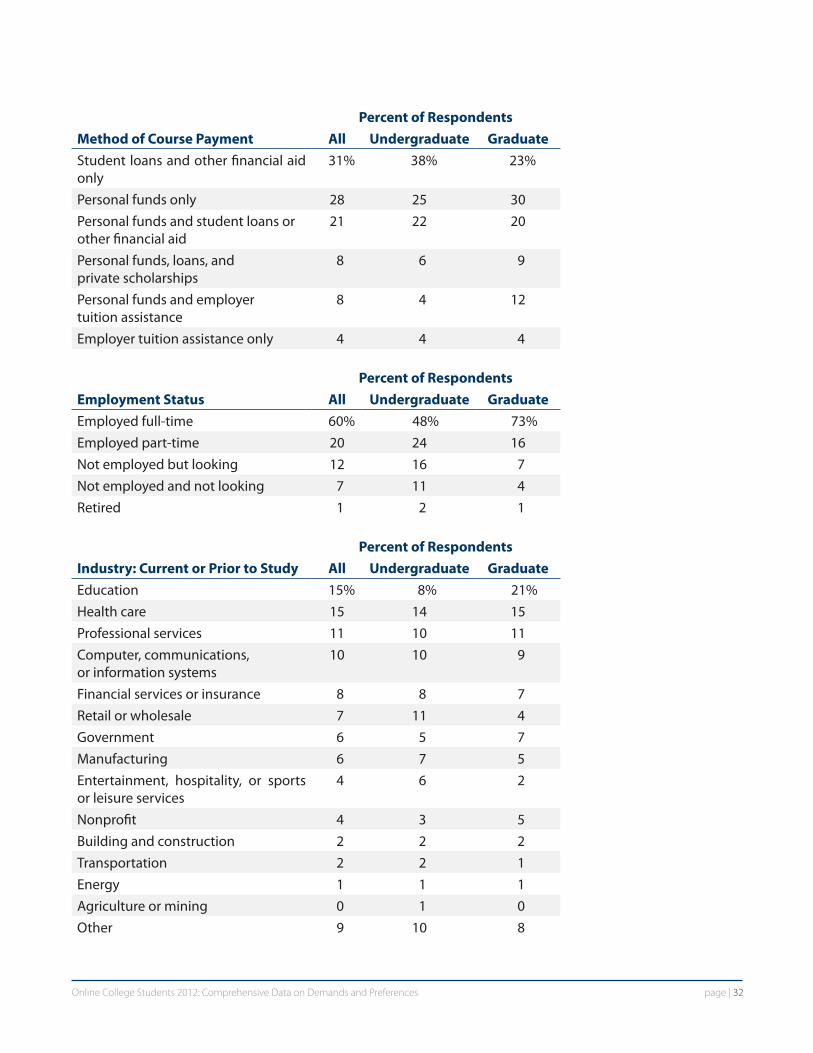
Online students most often use student loans and other financial aid to pay for courses (36%), followed by personal funds (32%), or they use a combination of personal funds and student loans or other financial aid (25%).
In the tables below, we present the detailed findings of each question related to the demographic profile of online students nationwide. Some specific patterns to note include:
• More than twice as many women as men enroll in online education.• Nearly 40% of online students are 29 years of age or younger.• Forty percent of online students do not work full-time.• If they are employed, online students most often work in the fields of
education and health care.
In general, few noticeable differences exist between students enrolled in for-profit versus not-for-profit institutions regarding motivation, intended credential, field of study, and course schedules. Some demographic differences to note include:
• Almost 50% of not-for-profit students enrolled in online education are 29 years of age or younger as compared to only about 32% of students enrolled in for-profit institutions.
• One-third of online for-profit students had African–American or Hispanic backgrounds as compared to only 23% of those enrolled in not-for-profit online programs.

page | 30Online College Students 2012: Comprehensive Data on Demands and Preferences
GenderPercent of Respondents
All Undergraduate GraduateFemale 70% 74% 66%Male 30 26 34
Percent of RespondentsEthnicity All Undergraduate GraduateCaucasian 62% 65% 58%African–American 19 19 18Asian or Pacific Islander 9 5 13Hispanic 8 8 9Native American 1 1 0Another background 1 2 1
Percent of RespondentsAge When Last Enrolled All Undergraduate Graduate18 to 24 19% 25% 13%25 to 29 20 17 2430 to 34 15 13 1635 to 39 13 12 1440 to 44 11 12 1145 to 49 10 10 1050 to 54 8 8 855 or older 4 4 4
First in Family to Attend CollegePercent of Respondents
All Undergraduate GraduateNo 63% 61% 64%Yes 37 39 36
Percent of RespondentsMilitary Status All Undergraduate GraduateNo service 94% 94% 94%Veteran 4 3 4Active duty 1 2 1Reserve 1 1 1

page | 31Online College Students 2012: Comprehensive Data on Demands and Preferences
Percent of RespondentsTotal Household Income All Undergraduate GraduateLess than $25,000 11% 18% 4%$25,000 to $39,999 14 20 8$40,000 to $54,999 15 15 14$55,000 to $69,999 13 12 13$70,000 to $84,999 11 10 13$85,000 to $99,999 9 7 12$100,000 to $114,999 8 6 9$115,000 to $129,999 3 2 5$130,000 to $149,999 3 2 4$150,000 or more 6 4 10Prefer not to say 7 5 8
Percent of RespondentsHighest Level of Education All Undergraduate GraduateHigh school diploma or GED 6% 12% 0%One or two years of college, but no associate degree
17 33 0
Associate degree 8 16 0Three or four years of college, but no bachelor’s degree
9 17 0
Bachelor’s degree 30 15 47Some graduate courses, but no master’s degree
11 4 18
Master’s degree 12 3 23Some graduate courses beyond a master’s degree, but no doctorate
4 1 6
Doctorate 3 0 5
page | 32Online College Students 2012: Comprehensive Data on Demands and Preferences
Percent of RespondentsMethod of Course Payment All Undergraduate GraduateStudent loans and other financial aid only
31% 38% 23%
Personal funds only 28 25 30Personal funds and student loans or other financial aid
21 22 20
Personal funds, loans, and private scholarships
8 6 9
Personal funds and employer tuition assistance
8 4 12
Employer tuition assistance only 4 4 4
Percent of RespondentsEmployment Status All Undergraduate GraduateEmployed full-time 60% 48% 73%Employed part-time 20 24 16Not employed but looking 12 16 7Not employed and not looking 7 11 4Retired 1 2 1
Industry: Current or Prior to StudyPercent of Respondents
All Undergraduate GraduateEducation 15% 8% 21%Health care 15 14 15Professional services 11 10 11Computer, communications, or information systems
10 10 9
Financial services or insurance 8 8 7Retail or wholesale 7 11 4Government 6 5 7Manufacturing 6 7 5Entertainment, hospitality, or sports or leisure services
4 6 2
Nonprofit 4 3 5Building and construction 2 2 2Transportation 2 2 1Energy 1 1 1Agriculture or mining 0 1 0Other 9 10 8

page | 33Online College Students 2012: Comprehensive Data on Demands and Preferences
Employer Offers Tuition Reimbursement
Percent of RespondentsAll Undergraduate Graduate
Yes 81% 82% 81%No 7 8 7Unsure 11 10 12
Plans to Change Employment Industry
Among the approximately 30% of students who enrolled in college most recently to change careers, the vast majority planned to move to a different industry. Among this pool of respondents, online undergraduate students planned to move to the health care industry, whereas online graduate students planned to move to a professional services company, such as accounting, consulting, marketing, or public relations firms.
Industry: After StudyPercent of Respondents
All Undergraduate GraduateHealth care 26% 30% 22%Professional services 18 16 26Education 12 11 15Computer, communications, or information systems
10 12 6
Government 7 11 6Financial services or insurance 6 4 10Entertainment, hospitality, or sports or leisure services
5 6 2
Nonprofit 3 2 5Retail or wholesale 2 3 1Energy 1 1 2Building and construction 0 1 0Other 9 5 5

page | 34Online College Students 2012: Comprehensive Data on Demands and Preferences
In spring 2012, Aslanian Market Research and Learning House conducted surveys with 1,500 individuals nationwide. Respondents were at least 18 years of age, had a minimum of a high school degree or equivalent, and were recently enrolled, currently enrolled, or planned to enroll in a fully online undergraduate or graduate degree, certificate, or licensure program.
Resolution Research of Denver, CO, identified the sample of 1,500 respondents. The organization drew the sample from its actively managed, 100% market-research-only panel that represents the U.S. Census, which enables the selection of hard-to-source groups. Resolution Research has collected up to 250 behavioral and demographic data points on each panelist, which allows it to target respondents for specific research objectives.
To recruit for this study, Resolution Research invited all panelists to participate via email invitations. Resolution Research thereafter built and managed quota groups to ensure that invitation counts accurately represented basic requirements for participation in the study: age (18 years or older), learning (enrollment in a fully online degree, certificate, or licensing program, and appropriate geographical distribution). Respondents resided across 47 states and the District of Columbia. The states that represent 52% of the nation’s population (according to the 2009 U.S. Census) represented 70% of the study’s respondents. These states included California, New York, Florida, Colorado, Illinois, Texas, Georgia, New Jersey, Pennsylvania, and Ohio.
Based on a population of 2 to 3 million online students, the sample of 1,500 students in this study represents a +/- 3% margin of error at a 95% confidence level.
The surveys collected information on motivation for study; type, level, and field of study; provider institution; preferred schedules; needed services; strengths and weaknesses of the online format; effective promotional strategies and advertising methods; and a variety of other topics. Surveys also gathered information on the personal characteristics and circumstances of online students at the time they took their most recent undergraduate or graduate course.
Methodology

page | 35Online College Students 2012: Comprehensive Data on Demands and Preferences
Allen, I. E., & Seaman, J. (2011). Going the distance in the United States, 2011. Babson Park, MA: Babson Survey Research Group.
Aslanian, C. B., & Brickell, H. M. (1980). Americans in transition: Life changes as reasons for adult learning. New York: College Board.
Brooks, D. (2012, May 4). The campus tsunami. The New York Times, p. A29.
Christensen, C. M., & Eyring, H. J. (2011). The innovative university: Changing the DNA of higher education from the inside out. San Francisco, CA: Jossey-Bass.
DeMillo, R. A. (2011). Abelard to Apple: The fate of American colleges and universities. Cambridge, MA: MIT Press.
DeMillo, R. A. (2012, April 29). So you’ve got technology. So what? The Chronicle of Higher Education. Retrieved from http://chronicle.com/article/So-Youve-Got-Technology-So/131663/
Silber, J. M., & Condra, P. (2011). Education and training. New York: BMO Capital Markets.
References

page | 36Online College Students 2012: Comprehensive Data on Demands and Preferences
The Learning House, Inc. is an online education solutions partner that helps colleges and universities develop and grow high-quality online degree programs and courses. Partnering with more than 100 colleges and universities, Learning House offers a business model that enables institutions to efficiently and affordably achieve their online education goals. Learning House provides a range of services, including curriculum development and management, faculty training and professional development, marketing and lead generation, admissions and enrollment management, student retention, 24/7 technical support, learning management systems, and management and consultation.
EducationDynamics is a proven leader in helping higher education institutions find, enroll, and retain students. We have worked hard to earn and maintain our industry leadership through a deeply rooted philosophy of serving our schools best by serving students first. This commitment has been at the heart of our success since we began more than a decade ago, and it continues today as we proudly serve more than 1,200 colleges and universities of all types and sizes.
Aslanian Market Research (EducationDynamics’ market research unit) conducts market demand studies, institutional audits, program and marketing reviews, and professional development seminars and workshops for colleges and universities seeking information and data on how to expand adult and online student enrollments. Throughout the last 25 years, our staff has worked with more than 200 colleges and universities of all types—public, private, large, small, rural, suburban, and urban—in every region of the United States. Our seminars have provided thousands of college administrators with practical, hands-on tactics that they can implement at their institutions at minimal cost for maximum impact.
AuthorsCarol B. Aslanian is Senior Vice President of Aslanian Market Research. She is a national authority on the characteristics and learning patterns of adult students, and she has made hundreds of presentations on the topic and led market research projects for more than 300 colleges, universities, and educational agencies.
David L. Clinefelter is Chief Academic Officer of The Learning House, Inc. He has been the Chief Academic Officer of for-profit, online universities (Walden and Kaplan) and the President of Graceland University, an early innovator in online education.
For additional information, contact:
Aslanian Market Research(201) [email protected]@educationdynamics.comwww.educationdynamics.com/market-research
The Learning House, Inc.(502) [email protected]
Partners