O*NET Computerized Interest Profiler: Reliability ... · PDF fileO*NET Computerized Interest...
62
O*NET Computerized Interest Profiler: Reliability, Validity, and Comparability James Rounds, Suzanne E. Mazzeo Thomas J. Smith, Lawrence Hubert University of Illinois at Urbana-Champaign Phil Lewis and David Rivkin National Center for O*NET Development National Center for O*NET Development Employment Security Commission Post Office Box 27625 Raleigh, North Carolina 27611 e-mail: [email protected] 1999
-
Upload
duongthien -
Category
Documents
-
view
240 -
download
1
Transcript of O*NET Computerized Interest Profiler: Reliability ... · PDF fileO*NET Computerized Interest...
O*NET Computerized Interest Profiler:Reliability, Validity, and Comparability
James Rounds, Suzanne E. MazzeoThomas J. Smith, Lawrence Hubert
University of Illinois at Urbana-Champaign
Phil Lewis and David RivkinNational Center for O*NET Development
National Center for O*NET DevelopmentEmployment Security Commission
Post Office Box 27625Raleigh, North Carolina 27611
e-mail: [email protected]
1999

i
Acknowledgments
The O*NET Computerized Interest Profiler was produced and funded bythe O*NET project of the U.S. Department of Labor, Employment and TrainingAdministration, Office of Policy and Research (OPR) under the direction ofGerard F. Fiala, Administrator. The O*NET project is directed by Jim Woods,Office of Policy and Research, and Donna Dye, Office of Workforce Security.
The instrument was created through Department of Labor grants with the NationalO*NET Consortium, National Center for O*NET Development; the North CarolinaEmployment Security Commission, Southern Assessment Research andDevelopment Center; the Utah Department of Employment Security, WesternAssessment Research and Development Center; and the Michigan EmploymentSecurity Commission, Northern Assessment Research and Development Center.Trefoil served as the primary contractor for the development of the software. TheUniversity of Illinois at Urbana-Champaign was the primary contractor involved inconducting this study.
The development of the O*NET Computerized Interest Profiler was directed byPhil Lewis and David Rivkin. Ten research phases were conducted in support ofthe development of the instrument, each of which required multiple steps and theparticipation of a wide variety of staff, contractors, and pilot sites. Gratefulacknowledgment for their prominent roles in this process is made toJeannie Stroupe, Dr. James Rounds, Ann Kump, Diana Williams, Ronald Boese,Dr. Brian Young, Victoria Gray, Maureen Mendick, Brenda Dunn, and Jerry Pickett.A special thanks is given to Dr. René V. Dawis for his technical contribution andguidance he provided at the conception of the project.

ii
Table of Contents
Acknowledgments ............................................................................................... i
Table of Contents ............................................................................................... ii
List of Tables.......................................................................................................iii
List of Figures ..................................................................................................... v
Executive Summary........................................................................................... vi
Introduction .........................................................................................................1
Method ............................................................................................................. …2
Design ........................................................................................................2
Participants ................................................................................................2
Measures ...................................................................................................3
Results.................................................................................................................4
Reliability....................................................................................................4
Validity..............................................................................................….......4
Comparability of the Computerized and P&P IP Forms .............................8
User Feedback...........................................................................................9
Discussion.........................................................................................................10
References ........................................................................................................12
Tables ................................................................................................................14
Figures...............................................................................................................48

iii
List of Tables
Table 1 Description of Comparability Sample ............................................. ... ......15
Table 2 Description of Test-Retest Sample.................................................... ......16
Table 3 Coefficient Alpha for P&P and Computerized Versions of the IP ... ... ......17
Table 4 Computerized IP Test-Retest Correlations..................................... ... ......18
Table 5 Scale Means and Standard Deviations for the P&P andComputerized IP................................................................................ ......19
Table 6 Cross-Classification of the RIASEC High-point Codes forTime 1 and Time 2 Administrations of the Computerized IP ............. ......20
Table 7 Circular Scale Score Distribution Comparing High-point Codeof Current Occupation with High-point Code of Computerized IPProfile ................................................................................................ ......23
Table 8 Circular Scale Score Distribution Comparing High-point Codeof Ideal Occupation with High-point code of Computerized IP Profile .....24
Table 9 Circular Scale Score Distribution Comparing High-point Code ofCurrent Occupation with High-point Code of P&P IP Profile ............. ......25
Table 10 Circular Scale Score Distribution Comparing High-point Code of IdealOccupation with High-point Code of P&P IP Profile .......................... ......26
Table 11 Means and Standard Deviations of Circular Scale Scores................ ......27
Table 12 Cross-Classification of the RIASEC High-point Codes for theComputerized IP and Self-Description Questionnaire ....................... ......28
Table 13 Means and Standard Deviations of Congruence Indices .................. ......31
Table 14 RIASEC Scale Intercorrelations for the Computerized IP (uppertriangle) and P&P IP (lower triangle) ..................................... . ......... ......32

iv
List of Tables (Continued)
Table 15 RIASEC Scale Intercorrelations for the Time 1 (upper triangle) andTime 2 (lower triangle) Test-Retest Administrations of the P&P IP ... ......33
Table 16 Analysis of Variance for Computerized and P&P IP and RIASECCodes................................................................................................ ......34
Table 17 Intercorrelations between the P&P and Computerized IP RIASECScales .............................................................................................. ......35
Table 18 Cross-Classification of RIASEC High-point Codes for the P&P andComputerized IP................................................................................ ......36
Table 19 Length of Time in Minutes to Complete the Computerized IP........... ......39
Table 20 Evaluation of Computerized Interest Profiler..................................... ......40
Table 21 Cross-Classification of Computer Experience with Equipment Used ......43
Table 22 Cross-Classification of Computer Experience with Clarity ofInstructions........................................................................................ ......44
Table 23 Cross-Classification of Computer Experience with Ease of ReadingComputer Screen .............................................................................. ......45
Table 24 Cross-Classification of Computer Experience with Appeal of Graphics.......................................................................................................... ......46
Table 25 Cross-Classification of Computer Experience with IP VersionPreference......................................................................................... ......47

v
List of Figures
Figure 1 Computerized IP MDS Solution on the Comparability Sample.......... ......49
Figure 2 P&P IP MDS Solution on the Comparability Sample......................... ......50
Figure 3 Computerized and P&P IP MDS Solution ......................................... ......51
Figure 4 Computerized IP MDS Solution on the Comparability Sample usingEuclidean Distances.......................................................................... ......52
Figure 5 Computerized IP MDS Solution on the Test-Retest Sample ............. ......53
Figure 6 Estimated Marginal Means of IP Scales............................................ ......54

vi
Executive Summary
This report summarizes a study conducted by researchers at the University of Illinois atUrbana-Champaign, the U.S. Department of Labor’s Office of Policy and Research, andthe National Center for O*NET Development, designed to further the development ofthe computerized version of the O*NET Interest Profiler (Lewis & Rivkin, 1999b). TheO*NET Interest Profiler (IP) is an innovative, self-scoring vocational interest measurethat has been found to yield reliable and valid scores in diverse samples of adults(Lewis & Rivkin, 1999a; Rounds, Walker, Day, Hubert, Lewis, & Rivkin, 1999).Recently, a computerized version of the IP was developed. This study’s purpose wastwofold: first, to assess the psychometric properties of the O*NET ComputerizedInterest Profiler, and, second, to evaluate its comparability with the paper-and-pencil(P&P) version of the O*NET Interest Profiler.
Results from the internal-consistency reliability analyses show that the Computerized IPyields RIASEC scores that are as consistent as the P&P IP scores. Results from thestability analysis show that the Computerized IP yields similar RIASEC scores over onemonth. In sum, these findings suggest that the Computerized IP produces reliablescores.
Evidence for the validity of the Computerized and P&P IP RIASEC scores wasprovided. The criterion-related validity of the two forms of the IP was examined bycomparing the first letter code of the participant’s IP with first-letter code of theparticipants’ current and ideal occupation. The evidence indicates that both forms haveaverage predictive efficiency, similar to the hit rates reported for other RIASECinventories. Additional support for the validity of the Computerized IP profiles wasdemonstrated by their relationship to participants’ scores on the RIASEC Self-Description Questionnaire (SDQ). The SDQ is an instrument that allows an individualto self-rank RIASEC category descriptions according to the degree that each categorydescribes him or herself. Congruence indices suggested that these measures werestrongly related. These results indicate that the Computerized IP is as effective asother well-known vocational interest measures in predicting participants’ rankings ofinterest areas.
The structural validity of the RIASEC scales was studied in two samples: thecomparability sample and the test-retest sample. Individuals in the comparabilitysample completed both forms of the IP, while individuals in the test-retest samplecompleted the Computerized IP on two separate occasions. The test-retest sampleconsisted of individuals who tended to be more highly educated and employed; theywere also less likely to be members of an ethnic minority group. The Computerizedand P&P forms of the IP had similar structures in both samples. The fit to the RIASECcircular order model was poor in the comparability sample and good for the test-retestsample. Nevertheless, the test-retest sample multidimensional scaling solution showedthat the Enterprising scale was located closer than expected to the Realistic scale.These mixed structural results mirror results obtained by Rounds, Walker, Day, Hubert,Lewis, and Rivkin (1999), suggesting a lack of coherent Enterprising items.

vii
Results indicate that the O*NET Computerized Interest Profiler scores are comparableto the P&P version. Equivalent scales from both measures were highly correlated,supporting the convergent validity of these measures. Profile analysis results indicatethat the two forms of the IP generate very similar RIASEC profiles. Cross-classificationanalysis of the IP forms showed that 80% of the participants would receive the samefirst-letter RIASEC code, close to the limits of the reliability of the IP.
Participants’ comfort and satisfaction with the Computerized and P&P versions of the IPwere also investigated. The average time to complete the Computerized IP was 19minutes. The vast majority (84%) of participants indicated that the IP instructions werevery clear. Most (72%) reported that they found the computer presentation andgraphics to be interesting, and 94% reported that the information presented on thecomputer screen was “easy” or “very easy” to read. In addition, the majority (78%)indicated that they preferred the Computerized IP to the P&P IP. Furthermore, 88% ofthe participants reported that they would recommend the IP to a friend. In sum, theparticipants were very satisfied with the Computerized IP.
The O*NET Interest Profiler is a useful, efficient instrument that should prove helpful toindividuals making career decisions. Overall, these results indicate that respondentsreceive similar scores on the IP, regardless of the test version (computerized vs. P&P)taken. However, the present study indicates that clients and students prefer thecomputerized form due to its interactive nature.

1
O*NET Computerized Interest Profiler: Reliability, Validity,and Comparability
Introduction
This report summarizes the results of a study conducted by researchers at theUniversity of Illinois at Urbana-Champaign, the U.S. Department of Labor’s Office ofPolicy and Research, and the National Center for O*NET Development, designed tofurther the development of the computerized version of the O*NET Interest Profiler(Lewis & Rivkin, 1999b).
The O*NET Interest Profiler (IP) is an innovative, self-scoring vocational interestmeasure that has been found to yield reliable and valid scores in diverse samples ofadults (Lewis & Rivkin, 1999a; Rounds, Walker, Day, Hubert, Lewis, & Rivkin, 1999).Recently, a computerized version of the IP was developed. The Computerized IP offersseveral advantages. The automated scoring provides participants with accurate andvirtually instant feedback about their vocational interests. This career-counseling toolcan be used in computer labs prevalent in schools and career centers. For thoseindividuals new to computers, taking the Computerized IP can be an opportunity tolearn basic computer skills while performing a “non-threatening” activity. Finally, pilottests have indicated that clients and students enjoy the interactive nature of completingthe Computerized IP.
Before the Computerized IP can be made available, its reliability and validity must beestablished. Frequently, organizations will be using both the Computerized IP and thePaper & Pencil (P&P) IP. In such cases, it is important to establish the comparability ofIP forms. Thus, the two major purposes of this proposed study are: 1) to evaluate thepsychometric properties of the Computerized IP, and 2) to investigate its comparabilitywith the Paper & Pencil IP form. As the Standardsfor Educational and Psychological Testing (AERA, APA, & NCME, 1985) state:“When scores earned on two different forms of a test, including computer-presented…tests, are intended to be used interchangeably, data concerning theparallelism of the forms should be available” (Standard 4.6, p. 34).
Similarly, Vansickle and Kapes (1993) note: “the equivalence of mode of administrationshould not be assumed for any computer-based instrument unless there is evidencepresented by the test author or publisher” (p. 448). Thus, the comparability analysesincluded in the current study were designed to assist the Department of Labor infulfilling this ethical obligation.
Previous investigations of the equivalence of computerized and P&P vocationalmeasures have primarily focused on the Strong-Campbell Interest Inventory (SCII;Hansen & Campbell, 1985). Brown (1984) found no significant differences between thetwo test forms. Vansickle and his colleagues (Vansickle, Kimmel, & Kapes, 1989;Vansickle & Kapes, 1993) found that in two independent studies the computerizedversion of the SCII exhibited higher test-retest reliability than did the paper-and-pencilversion. In addition, they found that the computerized version could be completed morequickly than the paper-and-pencil version. Means, variances, and frequencies of itemendorsements were equivalent across forms. However, neither Brown’s nor Vansickle’s

2
studies directly investigated the construct validity of the computerized form. Moreover,neither study established the structural equivalence between the computerized andpaper-and-pencil forms. Thus, no evidence was provided to demonstrate that thesecomputerized instruments measure the constructs outlined in Holland’s (1997) RIASECmodel. In the current study, the psychometric properties of the Computerized IP wererigorously evaluated, and its comparability to the P&P IP was thoroughly studied.
Method
Design
Two samples were collected: a comparability sample and a test-retest sample. Themain study employed a repeated measures design, with the comparability sampleconsisting of 463 participants who completed both the Computerized and P&P forms ofthe IP. Participants were assessed in small groups of approximately 4 to 16 at varioussites. The order of administration was balanced, so that approximately half theparticipants were first administered the Computerized IP, and the remaining half werefirst administered the P&P IP. Additionally, a second sample of 125 participants (test-retest sample) was twice administered the Computerized IP. For the test-retest group,the time interval between test administrations ranged from 28 to 35 days, with a meaninterval of 29.8 days. Subscale scores were computed for all participants from theiritem responses (that is, the self-scored subscales of the P&P IP were not used in theanalyses). Participants in the comparability sample were also asked to provide aranking of their preferred RIASEC codes, indicate their most preferred occupation,answer various demographic questions, and respond to several questions evaluatingthe computerized test format.
Participants
Prior to the analyses, participants were eliminated if three or more responses weremissing on the P&P Interest Profiler forms. Note that the Computerized IP format doesnot allow participants to skip items. Using this criterion, we dropped 13 of the 463participants from the study. In addition, 15 participants were eliminated due to variousdata collection irregularities such as missing pages or forms, random-appearing itemresponses (as noted by observers), or observed difficulty with instructions.Consequently, analyses were conducted on 435 individuals from four regions acrossthe United States: East (New York), West (California), North (Michigan), and South(North Carolina). Data collection sites included employment service offices, juniorcolleges, trade schools, high schools and other government agencies. Participantswere each paid $15 to reimburse them for travel expenses. Table 1 depicts thecharacteristics of the comparability sample in terms of sex, age group, education,ethnicity, employment status, student status, and geographical region. As the tableillustrates, the sample over-represented minority participants, especially AfricanAmericans. The majority of participants were female. Most were unemployed and didnot hold a bachelor's degree.
A stability analysis of the Computerized IP (in the form of a test-retest reliabilityestimate) was conducted on a second sample of participants who differed from thecomparability sample in several ways. Participants in this test-retest sample werebetter educated, more likely to be employed, and less likely to belong to an ethnicminority group than were participants in the comparability sample. Specifically,

3
only 10% of the test-retest sample had less than 12 years of education, andapproximately 50% had some college experience. In contrast, about 25% of thecomparability sample had less than 12 years of education, and approximately 67% didnot have any college experience. In addition, ethnic minorities were over-representedin the comparability sample (60% of sample), while the test-retest sample was primarilyCaucasian (68%), Over 50% of the comparability sample were unemployed, comparedto 17% of the test-retest sample. Finally, the test-retest sample included a largerproportion of females than the comparability sample, and all participants wereexclusively from the North Carolina area. The test-retest sample (n = 125) completedthe Computerized IP on two separate occasions, with approximately four weekselapsing between the two administrations. Table 2 depicts the characteristics of thetest-retest group.
Measures
Demographic Questionnaire. All participants provided demographic information thatincluded age, race/ethnicity, gender, educational level, current employment status,school status, current occupation or last job held, and their “ideal” job (“If you couldchoose an occupation for yourself, which would you choose?”).
Paper & Pencil O*NET Interest Profiler. The Paper & Pencil version of the O*NETInterest Profiler (P&P IP; National Center for O*NET Development, 1999) is aninterest inventory designed to assist respondents in making occupational choices. Itincludes 30 items per RIASEC type, for a total of 180 items, in a format that mixes theRIASEC types so that no string of three or more similar items occurs in a column ofitems. Items are presented by RIASEC category in sets of two, beginning with R andending with C. All items are work activities (e.g., “Diagnose and treat sick animals,”“Act in a movie,” “Sell houses”). Participants respond with a "like," "dislike," or "notsure" to the items. Subscale scores (corresponding to the six RIASEC categories) arethen computed by summing the number of “like” items endorsed within each category(“dislike” and “not sure” endorsements do not contribute to subscale scores). Scoresfor the RIASEC subscales may range from 0 to 30.
After completing the IP, the test-taker receives a summary code based on his or her toptwo or three RIASEC types in order of preference, such as IR, SEC, or AIS. In careerreference materials, these RIASEC codes are linked to occupational areas and job titlesso that the user can consider a range of pursuits that are likely to provide a goodpersonality/work environment match. In addition, there is an associated score reportthat links the IP summary codes to relevant occupations (O*NET Occupational Units).
O*NET Computerized Interest Profiler. The content of the Computerized IP isidentical to that of the P&P IP version, except that it is presented on a computer screen.Respondents may answer each item by using either a mouse or computer keyboard.Unlike the P&P version, the Computerized IP does not allow respondents to skip items.Scoring of the Computerized IP is identical to that of the P&P version, as describedabove, except the subscales are automatically calculated by the program.
RIASEC Self-Description Questionnaire. The RIASEC Self-Description Questionnaire(SDQ) lists six narrative descriptions of the RIASEC types. These descriptions were

4
written to reflect Holland’s (1997) RIASEC constructs. This questionnaire wasadministered to all participants. However, only 362 of the responses were usable, asseveral participants did not appear to understand the question format—either failing tocomplete the rankings or entering values that were not ranks. SDQ instructions requestthat the participants rank order each description according to “how much it is like you.”Ranks were values ranging from 1 to 6, with the RIASEC category description most likea participant receiving a rank of 1, and the description least like a participant, ranked 6.Slaney (1978) has shown that it is possible to write descriptions of the RIASEC typesthat have adequate reliability and validity for research purposes.
Results
Reliability
To examine the internal consistency of the Computerized and P&P Interest Profiler,coefficient alpha was calculated for each of the RIASEC scales on both measures.Alpha ranged from .93 to .96 for the scales on both the Computerized and P&Pversions, suggesting that the instruments yield reliable scores. Complete results arepresented in Table 3. In addition, the test-retest correlations for each of the RIASECscales of the Computerized IP ranged from .82 for the Investigative and Enterprisingscales to .92 for the Conventional scale, suggesting that scores onthis measure are stable across test administrations. The test-retest correlationspresented in Table 4 are comparable to those found for the P&P IP in a previous study(Rounds, Walker, Day, Hubert, Lewis, & Rivkin, 1999). Thus, it seemsthat the form of the IP has little effect on the stability of scores. RIASEC scale meansand standard deviations from the overall sample (n = 435) for both the Computerizedand P&P IP versions are presented in Table 5.
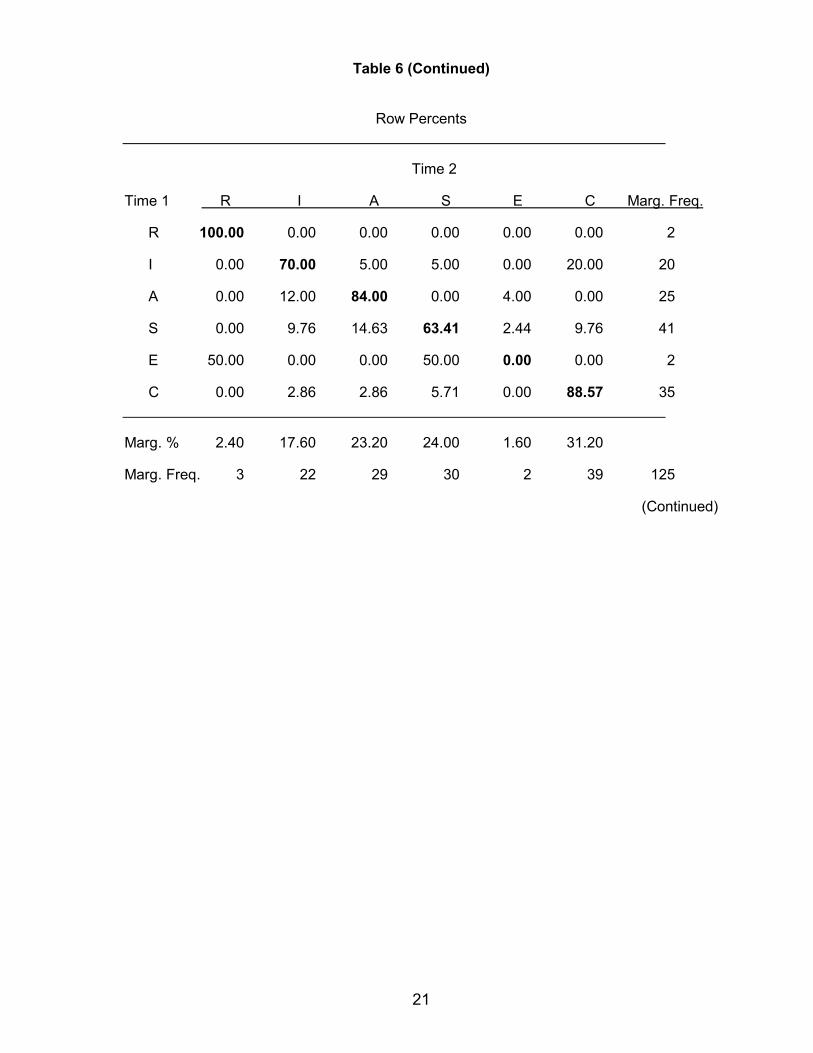
Cross-classification analysis of the test-retest sample indicated that the ComputerizedIP yielded stable high-point RIASEC codes across administrations (Cohen’s CoefficientKappa = .67, hit rate = 75.2%). Yet, as Table 6 indicates, none of the 125 participantsin the test-retest sample was classified as Enterprising on both administrations of theComputerized IP. In addition, only two participants were classified as Realistic on bothadministrations.
Validity
Three types of validity evidence for the Computerized IP were investigated: criterion-related validity, convergent validity, and structural validity. Although the focus of thevalidity analyses was on the Computerized IP, most analyses, unless otherwise noted,were conducted on both the Computerized and P&P versions of the IP.
Criterion-related validity. Criterion-related validity of the IP was evaluated by comparingparticipants’ primary interest area, as measured by the Computerized IP, with their self-reported current and ideal occupations. Agreement between ideal occupation andprimary interest area would suggest that the IP was accurately assessing respondents’vocational interests. Furthermore, agreement between current occupation and the IPprimary interest area would suggest accuracy in vocational interest assessment to the

5
degree that an individual was satisfied with his or her current occupation. Agreementwas measured in several ways, including circular scale scores, and analyses of “hitrates” across interest categories.
Participants’ current (or last-held) and ideal occupations were coded by expert judgesusing the RIASEC profiles from the Holland Dictionary of Occupational Codes(Gottfredson & Holland, 1996). Next, a circular scale score was computed thatassessed the degree of agreement between a participant’s Computerized IP high-pointcode and RIASEC coded current/ideal occupation. The circular scale score is a valueranging from 0 to 3 that indicates the similarity of a pair of codes with respect to theirproximity on the RIASEC hexagonal structure. Perfectly matched codes receive acircular scale score of 3, while the most dissimilar codes (e.g., R vs. S) receive a scalescore of 0. Distributions of the circular scale scores are presented in Tables 7 through10. Participants varied in the degree to which their Computerized IP scorecorresponded with their current occupation. In slightly more than one-half (51.7%) ofcases, the Computerized IP score and the current occupation agreed perfectly or wereone code type away from perfect agreement. The remainder of cases (48.3%)exhibited some disparity in coding (see Table 7). These agreement rates arecomparable to those found in research using other well-established vocational interestmeasures (c.f., Slaney, 1978). Moreover, when ideal occupation was compared withComputerized IP first-letter code, the results demonstrated stronger agreementbetween the two indices. A majority (62.4%) of cases either agreed perfectly (i.e.,circular scale score of 3) or were one code type away from perfect agreement (i.e.,circular scale score of 2). Complete results are presented in Table 8. Similar resultswere found when the P&P IP was compared with participants’ current and idealoccupation (see Tables 9 and 10).
Means and standard deviations of these circular scale scores for both theComputerized and P&P IP versions are presented in Table 11. These results suggestthat for both versions, ideal occupation was more likely than current occupation (or lastjob held) to agree with participants’ first-letter IP code (p < .001). These results are inaccordance with the theory underlying the RIASEC model.
Convergent validity. Convergent validity was assessed by comparing the ComputerizedIP profiles with profiles resulting from the RIASEC Self-Description Questionnaire(SDQ). A moderate relationship was expected between these two methods ofassessing RIASEC types.
A cross-classification analysis was first carried out to assess the agreement betweenthe first-letter codes obtained from the Computerized IP profiles and the rank onecategories from the RIASEC Self-Description Questionnaire (SDQ). Results of thisanalysis are presented in Table 12. As can be seen from the table, the diagonal values(indicating an exact match between profiles) are the highest values within any row orany column, suggesting that the profiles resulting from the Computerized IP correspondwell with the SDQ profiles. The overall hit rate was moderately high (53%).
Three measures of profile congruence were also computed to determine the degree towhich the three-letter profiles resulting from the Computerized and P&P IPadministrations corresponded with three-letter profiles resulting from rankings on theRIASEC Self-Description Questionnaire (SDQ). The measures of profile congruenceutilized were the Iachan M index (Iachan, 1984a, 1984b), the Brown and Gore C index

6
(Brown & Gore, 1994), and a revised version of the Brown and Gore C index (hereafter,C-rev). The Iachan M index uses a rational scoring scheme that weights particularmatch types between two ordered profiles. In standardized form, M can range in valuefrom 0 to 1.0, with larger values of the index indicating a high degree of congruencebetween the two profiles. For example, two ordered profiles with no elements incommon would receive a score of zero on the index. Two profiles with the sameelements (but ordered distinctly) would receive a higher index score, and two profileswith all elements in common and in identical order would receive the highest possiblevalue of the index(i.e., M = 1.0).
The Brown and Gore C index, in contrast, incorporates the concept of circular distancesto determine the level of profile congruence and is computed as
C x x x= + +3 21 2 3 ,
where xi indicates the circular scale score (described previously) between position i inboth profiles. When standardized, the value of C ranges from 0 to 1.0, with highervalues reflecting greater profile congruence. However, both the C index and the Mindex have limitations. Specifically, the M index only weights exact code matches, socodes that are similar to one another (e.g., R and I) receive no greater weight thancodes that are very dissimilar (e.g., R and S). The C index, in contrast, does accountfor these varying degrees of proximity between codes. It does not, however, accountfor the proximity between codes in adjacent positions across profiles (as the M indexdoes)—an issue of importance when code transpositions occur as a result ofmeasurement error. The profiles RSC and SRC, for example, might reasonably beconsidered more similar than the profiles RSC and AIC (because in the former case,the first two code positions have simply been transposed), yet the former receives alower C score than the latter. For this reason a third index, a revised version of the Cindex (C-rev), was computed. The C-rev index is computed in a similar fashion to the Cindex, but also weights adjacent codes across profiles. This results in a congruencemeasure that is more relevant for the RIASEC theory. Specifically, this index iscomputed as
C- rev = 5x11 12 21 22 23 32 332 2 3+ + + + + +x x x x x x ,
where xij indicates the circular scale score between position i of the first profile andposition j of the second profile. C-rev is then standardized to range from 0.0 to 1.0, withhigher values indicating greater profile congruence. When values of the threecongruence indices were calculated (see Table 13), moderately high values (.44 to .66)were obtained on all indices when comparing either the Computerized IP or the P&P IPto the SDQ. These results suggest that both versions of the IP matched the SDQprofiles quite well.
Structural validity. Finally, the structural validity of the Computerized IP wasinvestigated and compared to that of the P&P version to evaluate the dimensionalstability of the IP across test formats. Structurally similar measures suggest that theunderlying constructs measured by the IP are equivalent across forms, thus providingfurther support for the equivalency of the P&P and Computerized versions.

7
Correlations among the subscales within each test version are shown in Table 14.Generally, the pattern of within-test scale intercorrelations fit the hypothesized RIASECstructure (i.e., scales close to each other in the RIASEC structure were more stronglycorrelated than were those further apart from one another). However, the Enterprisingscale appeared to be more strongly correlated with the Realistic scale (in both theComputerized and P&P versions) than would be expected given the theoreticalstructure of the RIASEC scales.
A randomization test of hypothesized order (Rounds, Tracey, & Hubert, 1992) was nextused to examine the structural validity of the Computerized and P&P IP versions,assuming the RIASEC model (Holland, 1997). Also, the correspondence index (CI)was calculated to evaluate model-data fit. This index assesses the degree to whichpredictions derived from the circular model are met by the data ranges. Values of theCI range from -1.00 to +1.00; a value of +1.00 indicates a perfect model-data fit. Forthe Computerized IP, CI = .33 (p < .10), and for the P&P IP, CI = .32 (p < .12). Theseresults were nonsignificant, indicating that a random order hypothesis could not berejected.
The structural validity of the Computerized IP was further examined withmultidimensional scaling (MDS), a statistical procedure that can be used toprovide a spatial representation corresponding to the proximity of variables withina data set. MDS analyses were conducted using the matrix of scale scoreintercorrelations to assess whether the RIASEC circular structure fit the data. First, anMDS of the Computerized IP scores was carried out. The configuration is displayed inFigure 1. A two-dimensional solution fit the data well, explaining 87.9% of the variation.However, the MDS solution did not correspond well with the RIASEC circular model.Specifically, the order of the Artistic and Investigative scales was reversed. In addition,the Enterprising scale was in the center of the plot, reflecting its stronger than expectedrelation with the Realistic and Artistic scales. There was also a larger than expecteddistance between the Realistic and Conventional scales.
Figure 2 shows the MDS solution for the P&P IP scores. This MDS analysisyielded a similar pattern of results. Again, a two-dimensional solution fit the data,explaining 87.5% of the variance. When an MDS solution was obtained usingboth the Computerized IP and P&P IP subscale intercorrelations (see Figure 3),the corresponding RIASEC scales of each measure were identically ordered(R-A-I-S-C-E) and nearly identically situated. This result provides further support forthe comparability of the measures.
Two-dimensional MDS analyses were also carried out using the Euclidean distances(an alternate measure of inter-scale proximity) among the RIASEC scales of both theComputerized and P&P IP. In each case, the structure appeared closer to thehypothesized RIASEC circular structure, with the RIASEC scales appearing in theexpected order, but with the Enterprising scale somewhat depressed. The resultsobtained using the Computerized IP scores are shown in Figure 4 (as nearly identicalresults were obtained with the P&P IP, this MDS configuration is not shown).
Because, as indicated previously, the test-retest sample differed significantly from thecomparability sample on several demographic variables, we used this sample to furtherexamine the structural properties of the IP. Randomization tests were carried out to

8
assess the circularity of the inter-scale correlation matrices for both Time 1 and Time 2.In both cases, the random order hypothesis was rejected (p < .02 and p < .03 for Time1 and Time 2, respectively). The correlation matrices and CI indices are shown inTable 15. The obtained CI indices of .63 and .65 indicate a good fit of the RIASECmodel to the correlations. A simultaneous MDS analysisof the Time 1 and Time 2 test-retest sample (see Figure 5) was then carried out, usingthe inter-scale correlations as input. This produced a configuration much closer to thehypothesized structure. In this solution, the scales were inR-I-A-S-E-C order, with only the Enterprising scale of each IP version appearingin a slightly depressed position. Additionally, corresponding scales from the two IPversions were very nearly overlapping, which suggested that the structure of the datawas consistent across test administrations.
Comparability of the Computerized and P&P IP Forms
In addition to the reliability and validity of the IP, a third issue of importance was thecomparability or convergence between scores generated by the Computerized and P&Pversions of the IP. An analysis was carried out that examined the potential influence oftest format on participants’ scores—that is, whether an individual would achieve thesame profile regardless of the version (Computerized or P&P) administered. M, C, andC-rev index values comparing the P&P IP profiles to the Computerized IP profiles werecomputed, as were indices comparing the Time 1 with the Time 2 Computerized IPprofiles that resulted from the test-retest sample. The test-retest sample was examinedseparately because these participants differed from the comparability sample onseveral demographic variables, including educational level, ethnicity, and gender.Consequently, analysis of this group would provide additional insight into thepsychometric properties of the Computerized IP.
Means and standard deviations of the M, C, and C-rev values comparing IP profiles areshown in Table 13. Very high values (.76 to .90) were found when comparing theprofiles from each IP version, indicating a high degree of profile similarity and highconvergent validity. Similarly, very high congruence values (.75 to .88) resulted whenComputerized profiles from the test-retest sample were compared across a one-monthinterval. These test-retest congruence values can be used as a benchmark since thesame test format was used. Comparing the test-retest congruence values to thecomparability sample values provide further evidence that test format (Computerized orP&P) does not affect IP scores.
In addition, the similarity of results from the reliability and validity analyses of the twoforms of the IP provide evidence that the scores generated from Computerized andPaper & Pencil Interest Profiler are comparable. Nevertheless, direct tests areavailable to evaluate the comparability of the measures. We conducted several ofthese direct tests.
First, a profile analysis was conducted to observe the degree of parallelism between theComputerized and P&P versions of the IP. A participant’s score on each scale of theinstrument was the dependent variable, and the measurement instrument(Computerized or P&P IP) and the RIASEC scale categories were the two independentvariables. Results indicated that there was no significant interaction betweenmeasurement instrument and RIASEC scale (p > .10). That is, an individual’s scalescore did not appear to be dependent upon the particular version of the IP (P&P or

9
Computer) that was taken. Thus, the two versions appear to be comparable. Completeresults of this analysis are presented in Table 16, and they are depicted graphically inFigure 6.
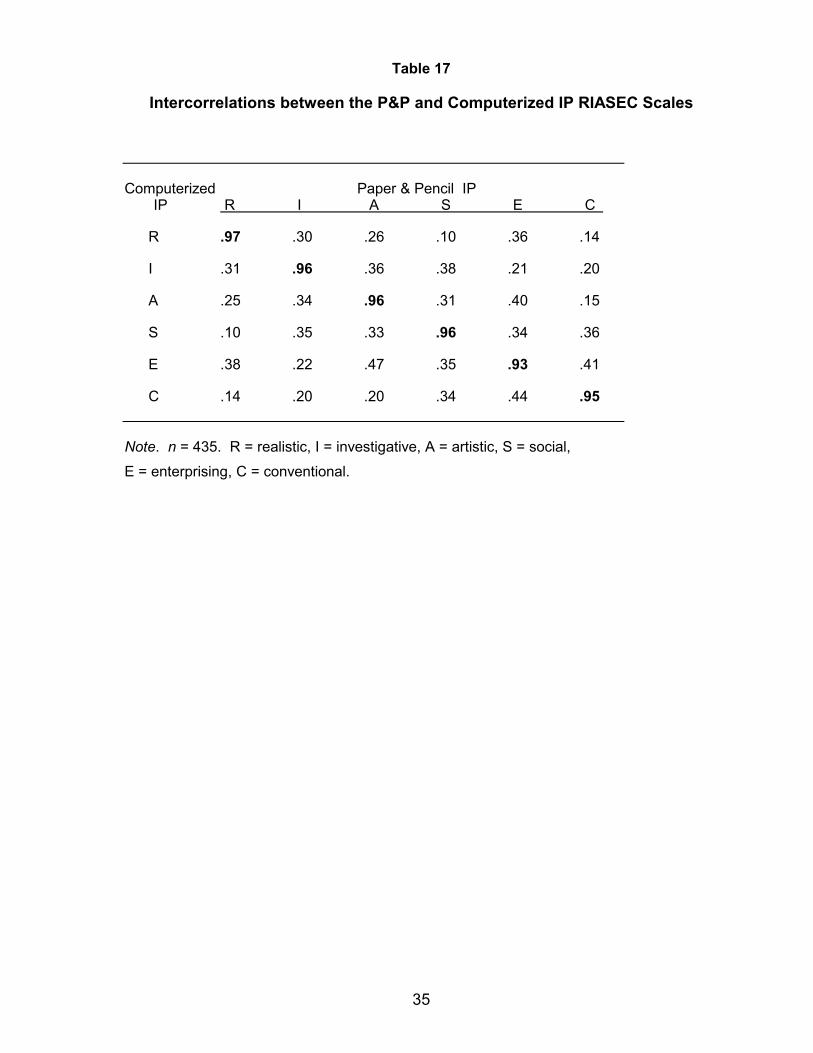
Correlations among the RIASEC scales across test versions provide further evidence ofthe convergent validity of the Computerized and P&P IP forms. These correlationsranged from a low of .93 for the Enterprising scale to a high of .97 for the Realisticscale. Complete results of this analysis are presented in Table 17.
Table 18 illustrates the results of the cross-classification analysis of primary codeagreement between the two IP versions. In general, the measures yielded consistentprimary code classifications across measures (Cohen’s Coefficient Kappa = .75, hit rate= 79.8%). However, only a small number (4.4%) of participants were simultaneouslyclassified as Enterprising by both the Computerized and P&P versions. In addition, it isnoteworthy that a large number of participants (23.4%) were classified as Social by bothIP versions.
User Feedback
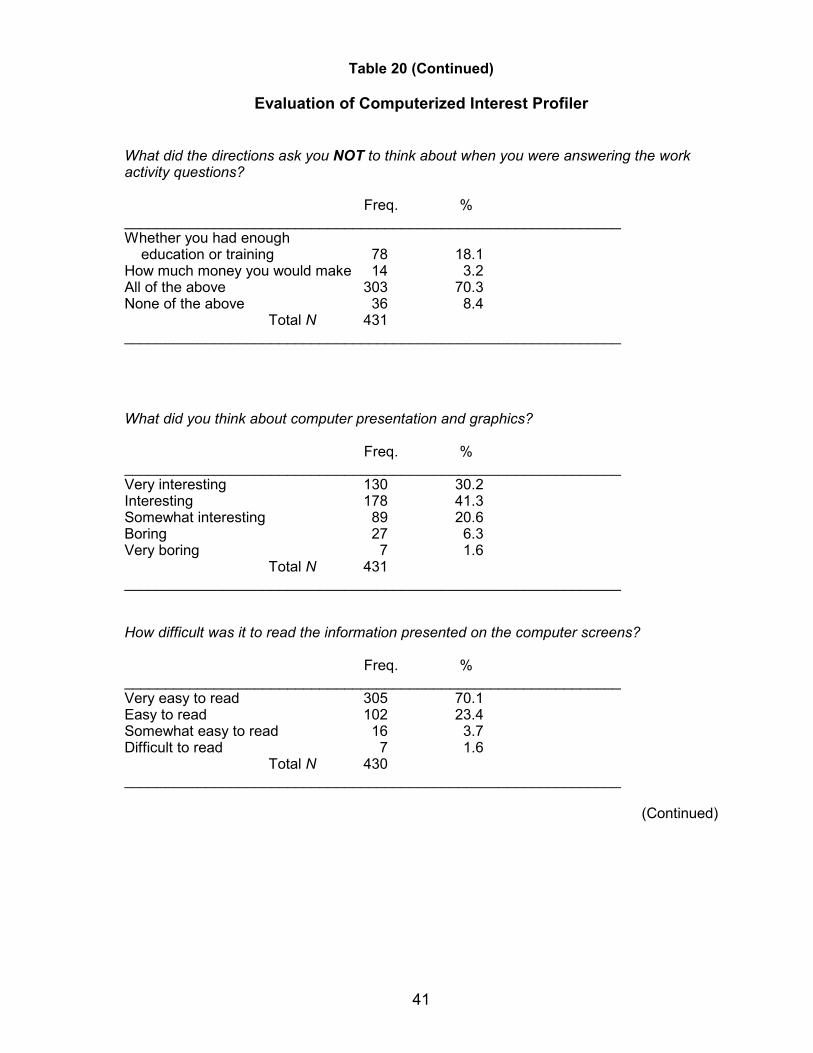
Participants’ comfort and satisfaction with the Computerized and P&P versions of the IPwere also investigated. The length of time taken to complete the Computerized IP wasrecorded, and participants were asked to respond to a questionnaire after they hadcompleted both versions of the IP. This questionnaire was designed to elicit feedbackfrom participants regarding their understanding of each IP version, their perception ofeach instrument, their previous experience with computers, and the process they usedto complete the Computerized IP.Participants completed the Computerized IP quickly. The mean time to complete theComputerized IP was 19.1 minutes. Table 19 provides additional summary statistics forcompletion time. When asked about their experiences using the Computerized IP, thevast majority (84.1%) of participants indicated that the instructions were very clear.Most (92.1%) reported that they found the computer presentation and graphics to be atleast somewhat interesting, and 93.5% reported that the information presented on thecomputer screen was “easy” or “very easy” to read. In addition, the majority (78.4%)indicated that they preferred the Computerized IP to the P&P version, while 17.5%indicated that they would take either version. Furthermore, 87.8% reported that theywould recommend the IP to a friend. Table 20 details these results.
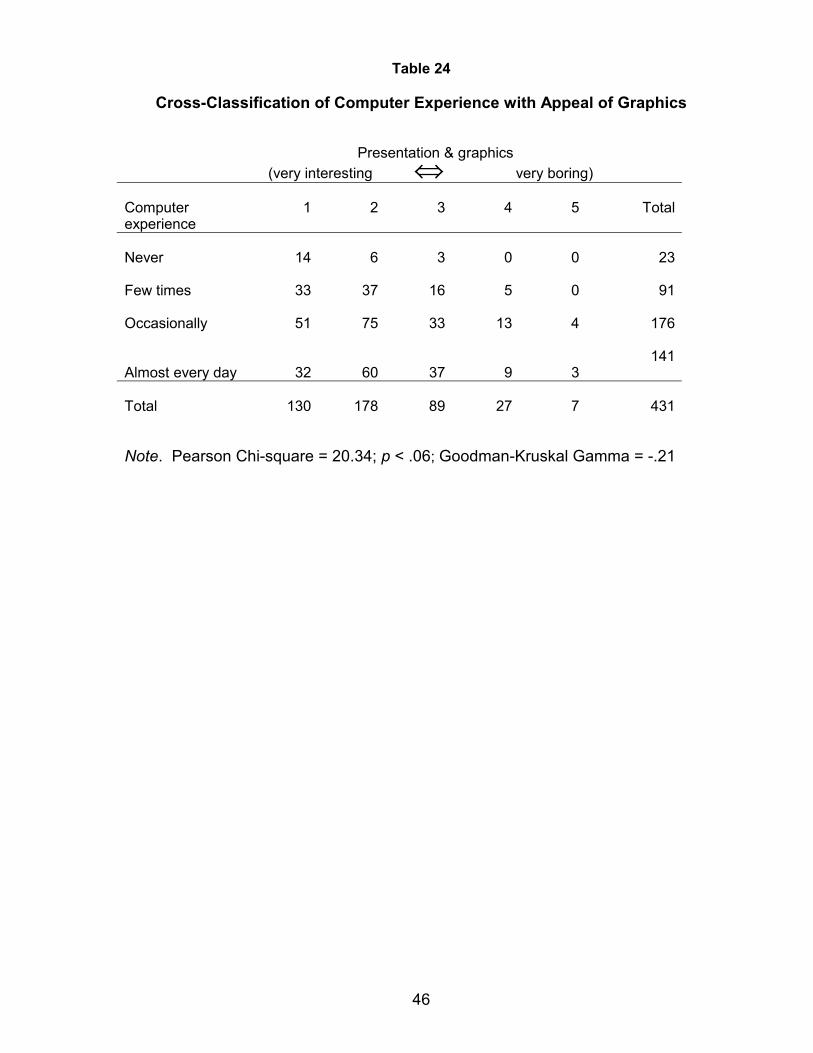
Several cross-classification tables were constructed to assess how participants’previous experience with computers influenced their use of the Computerized IP. AsTable 21 indicates, participants who were more familiar with computers were morelikely to use the mouse to complete the Computerized IP (χ2 = 22.4, p < .001). Inaddition, and not surprisingly, participants more familiar with computers found theinstructions clearer (χ2 = 24.5, p < .01; see Table 22), and the screen easier to read (χ2
= 16.3, p < .06; see Table 23) than did those who had less computer experience.Participants who were less familiar with computers found the graphics to be moreinteresting (χ2 = 16.3, p < .06; see Table 24). The majority of participants (78.0%)preferred the Computerized IP version (see Table 25) and found the instructions clear,although there was a tendency (χ2 = 25.21, p < .0001) for more experienced computerusers to prefer the Computerized IP.

10
Discussion
Computer technology can increase the accessibility and efficiency of vocational testing.However, psychologists have an ethical obligation to ensure the equivalence ofcomputerized and paper-and-pencil versions of assessment instruments (AERA et. al.,1985). In the current study, the psychometric properties of the Computerized IP wereevaluated. Results suggest that the Computerized IP yields reliable scores in diversesamples of adults. In addition, the validity of the Computerized IP was supported. Themeasure demonstrated the expected pattern of relationships with both participants’current job and their self-reported ideal job. Indeed, the correspondence between thehigh-point code generated by the Computerized IP and respondents’ current and idealjobs was comparable to that found in previous studies using well established interestmeasures such as the UNIACT-R (ACT, 1995) and the Vocational Preference Inventory(Holland, 1985). Also, ideal occupation was more congruent with the IP-generatedprimary codes than was current occupation, reflecting (as expected) a disparitybetween current and ideal occupations for at least some segment of the population.
Additional support for the validity of the Computerized IP profiles was demonstrated bytheir relationship to participants’ scores on the RIASEC Self-Description Questionnaire.Congruence indices suggested that these measures were strongly related. Theseresults indicate that the Computerized IP is as effective as other well-known vocationalinterest measures in predicting participants’ rankings of interest areas (c.f., Slaney,1978).
Moreover, the comparability of the Computerized and P&P versions of the IP wasdemonstrated, in accordance with the requirements of the Standards for Educationaland Psychological Testing (AERA et al., 1985). Multiple analyses suggest that theComputerized IP and P&P IP can be used interchangeably with confidence.Specifically, the congruence between profiles generated by each version was found tobe extremely high, providing strong support for the equivalence of the measures.Additionally, MDS analyses indicated that the structures of the Computerized and P&Pversions were virtually identical, providing further evidence of the comparability of thetest formats. Overall, these results suggest that respondents receive similar scores onthe IP, regardless of the test version taken.
The structural validity of the Computerized IP was also evaluated using correspondenceindices (CI) and multidimensional scaling (MDS). MDS analyses and randomizationtests using interscale correlations from the comparability sample indicated that thestructure of the Computerized IP (and the P&P IP) scores deviated from the RIASECmodel. However, a follow-up MDS analysis using the more highly educated, moreethnically homogenous, regionally homogeneous, and predominantly female test-retestsample yielded more promising results. Specifically, a randomization test of the teststructure suggested circularity among the IP scales. Additionally, multidimensionalscaling analyses indicated that the scales from the Computerized IP displayed R-I-A-S-E-C ordering, with only the Enterprising scale appearing in a slightly depressed position.Similar results were found in an earlier study of the P&P IP (Rounds et. al., 1998).Rounds and his colleagues suggested that the depressed position of the Enterprisingscale may be due to the fact that the IP includes items from all prestige and educationalcategories, thereby introducing more variability (and perhaps less conceptual unity) into

11
the Enterprising category. In addition, it is notable that in both the comparability sampleand test-retest sample of this study, very few participants were classified asEnterprising.
These MDS results are similar to those found in previous studies that have examinedthe influence of ethnicity, educational level, and socio-economicstatus (SES) on RIASEC structure. For example, Ryan, Tracey, and Rounds (1996)evaluated the influence of SES and gender in a sample of African-American and Whitehigh school students and found that, while there were no ethnic differences in thestructure of interests, when ethnicity and SES were considered simultaneously,structural differences were found. In addition, these authors found gender differencesin vocational interest structure; specifically, Holland’s model provided a better fit forfemale respondents, regardless of their ethnicity. It is notable that the composition ofthe test-retest sample in the current study is demographically similar to samples used inprevious studies that have found an adequate fit to the RIASEC model (e.g., Day,Rounds, & Swaney, 1998).
With respect to participants’ subjective evaluation of the Computerized IP, most viewedthe Computerized IP as easy to use, and the vast majority preferred it to the P&Pversion. They were able to complete the Computerized IP in a reasonable amount oftime, found the instructions easy to comprehend and follow, and had little difficultyreading from the computer screen. Most would recommend this version of the IP tofriends. These responses suggest that people will be apt to use the instrument and besatisfied with its results. In sum, the Computerized IP appears to be a useful, efficient,interest inventory that should prove helpful to those making career decisions. Futureresearch with the IP should revise the Enterprising scale so that its psychometricproperties are consistent with the RIASEC model. In addition, longitudinal studies ofthe utility of the IP could prove useful in establishing additional evidence of themeasure’s criterion-related validity.
12
References
American College Testing Program (1995). Technical manual: RevisedUnisex edition of the ACT Interest Inventory (UNIACT). Iowa City: Author.
American Educational Research Association, American PsychologicalAssociation & National Council on Measurement in Education (1985). Standards forEducational and Psychological Testing. Washington, DC: American PsychologicalAssociation.
Brown, J.M. (1984). Similarity of Strong-Campbell Interest Inventory scoresand profiles from computerized versus paper-and-pencil administration.Unpublished doctoral dissertation, University of Minnesota.
Brown, S.D. & Gore, P.G. (1994). An evaluation of interest congruenceindices: distribution characteristics and measurement properties. Journal ofVocational Behavior, 45, 310-327.
Day, S. X, Rounds, J., & Swaney, K. (1998). The structure of vocationalinterests for diverse racial-ethnic groups. Psychological Science, 9, 40-44.
Gottfredson, G.D., & Holland, J.L. (1996). Dictionary of Holland occupationalcodes, (3rd edition). Odessa, FL: Psychological Assessment Resources, Inc.
Hansen, J.C. & Campbell, D.P. (1985). Manual for the Strong InterestInventory, (4th edition). Palo Alto, CA: Consulting Psychologists Press.
Holland, J.L. (1985). Manual for the Vocational Preference Inventory.Odessa, FL: Psychological Assessment Resources.
Holland, J.L. (1997). Making vocational choices: A theory of vocationalpersonalities and work environments (3rd edition). Odessa, FL: PsychologicalAssessment Resources, Inc.
Iachan, R. (1984a). A family of differentiation indices. Psychometrika,49, 217-222.
Iachan, R. (1984b). A measure of agreement for use with Holland’sclassification system. Journal of Vocational Behavior, 24, 133-141.
Lewis, P., & Rivkin, D. (1999a). Development of the O*NET Interest Profiler.Raleigh, NC: National Center for O*NET Development.
Lewis, P. & Rivkin, D. (1999b). O*NET Interest Profiler user's guide. Raleigh,NC: National Center for O*NET Development.
National Center for O*NET Development. (1999). O*NET Interest Profiler.Raleigh, NC: Author.

13
Rounds, J., Tracey, T. J., & Hubert, L. (1992). Methods for evaluatingvocational interest structural hypotheses. Journal of Vocational Behavior, 40, 239-259.
Rounds, J., Walker, C.M., Day, S. X, Hubert, L., Lewis, P., & Rivkin, D.(1999). O*NET Interest Profiler: Reliability, validity, and self-scoring. Raleigh, NC:National Center for O*NET Development.
Ryan, J. M., Tracey, T. J. G., & Rounds, J. Generalizability of Holland’sstructure of vocational interests across ethnicity, gender, and socioeconomic status.Journal of Counseling Psychology, 43, 330-337.
Slaney, R. B. (1978). Expressed and inventoried vocational interests: Acomparison of instruments. Journal of Counseling Psychology, 27, 122-129.
Vansickle, T.R., & Kapes, J.T. (1993). Comparing paper-pencil andcomputer-based versions of the Strong-Campbell Interest Inventory. Computers inHuman Behavior, 9, 441-449.
Vansickle, T.R., Kimmel, C., & Kapes, J.T. (1989). Test-retest equivalency ofthe computer-based and paper-and-pencil versions of the Strong-Campbell InterestInventory. Measurement and Evaluation in Counseling and Development, 22, 88-93.

14
Tables

15
Table 1
Description of Comparability Sample___________________________________________________________________
Characteristic freq. %___________________________________________________________________Gender Male 168 38.6 Female 267 61.4Age 18 or less 118 27.1 19 to 22 53 12.1 23 to 30 86 19.8 31 to 40 72 16.6 41 to 50 79 18.2 > 50 26 6.0Education Less than high school 113 26.0 High school degree 164 37.7 Some college to BA 145 33.3 > 16 years 12 2.8Ethnicity White Non-Hispanic 173 39.8 African-American 170 39.1 Hispanic/Latino 69 15.9 Asian/Pacific Islander 5 1.1 American Indian/Alaskan Native 4 0.9 Other 14 3.2Employment Status Unemployed 237 54.4 Part-time 88 20.2 Full-time 70 16.1 Military 5 1.1 Not seeking employment 35 8.0Student status Not a student 126 29.0 High school 114 26.3 Junior College/vocational 58 13.4 College Student 59 13.6 Graduate Student 34 7.8 Other 43 9.9Region East (NY) 45 10.3 West (CA) 59 13.6 North (MI) 167 38.4 South (NC) 164 37.7
Note. Column marginal frequencies do not always sum up to total number of participantsbecause of missing data; total N = 435.

16
Table 2
Description of Test-Retest Sample
___________________________________________________________________Characteristic freq. %___________________________________________________________________Gender Male 29 23.2 Female 96 76.8Age 18 or less 9 7.2 19 to 22 33 26.4 23 to 30 33 26.4 31 to 40 31 24.8 41 to 50 12 9.6 > 50 7 5.6Education Less than high school 12 9.6 High school degree 49 39.2 Some college to BA 58 46.4 > 16 years 5 4.0Ethnicity White Non-Hispanic 85 68.0 African American 32 25.6 Hispanic/Latino 3 2.4 Asian/Pacific Islander 3 2.4 American Indian/Alaskan Native 0 0.0 Other 1 0.8Employment status Unemployed 29 23.2 Part-time 48 38.4 Full-time 35 28.0 Military 0 Not seeking employment 13 10.4Student status Not a student 8 6.5 High school 3 2.5 Junior College/vocational 48 38.7 College Student 49 39.5 Graduate Student 7 5.6 Other 9 7.3
___________________________________________________________________
Notes. Column marginal frequencies do not always sum up to total number of participants(125) because of missing data. All participants in the test-retest sample were from theSouthern region (NC).

17
Table 3
Coefficient Alpha for P&P and Computerized Versions of the IP
P& P ComputerizedScale IP IP
R .94 .94
I .94 .94
A .95 .95
S .95 .95
E .93 .93
C .96 .96
Note. n = 125; R = realistic, I = investigative, A = artistic,
S = social, E = enterprising, C = conventional.

18
Table 4
Computerized IP Test-Retest Correlations
Scale r
R .87
I .82
A .88
S .88
E .82
C .92
Note. n = 125; R = realistic, I = investigative, A = artistic,
S = social, E = enterprising, C = conventional.

19
Table 5
Scale Means and Standard Deviations for the P&P and Computerized IP
Scale Means: R I A S E C___________________________________________________________________
Paper & Pencil IP 8.46 12.63 14.31 16.28 11.35 13.22Computerized IP 8.30 12.89 14.40 16.39 11.41 13.13___________________________________________________________________
Scale standard deviations:
R I A S E C___________________________________________________________________
Paper & Pencil IP 7.94 8.97 9.00 9.50 7.85 10.21Computerized IP 7.93 8.93 9.27 9.45 7.77 10.06___________________________________________________________________
Note. R = realistic, I = investigative, A = artistic, S = social, E = enterprising,C = conventional; n = 435 for each group.

20
Table 6
Cross-Classification of the RIASEC High-point Codes for
Time 1 and Time 2 Administrations of the Computerized IP
Time 2
Time 1 R I A S E C Marg. Freq
R 2 0 0 0 0 0 2
I 0 14 1 1 0 4 20
A 0 3 21 0 1 0 25
S 0 4 6 26 1 4 41
E 1 0 0 1 0 0 2
C 0 1 1 2 0 31 35
Marg. Freq. 3 22 29 30 2 39 125
(Continued)
21
Table 6 (Continued)
Row Percents
Time 2
Time 1 R I A S E C Marg. Freq.
R 100.00 0.00 0.00 0.00 0.00 0.00 2
I 0.00 70.00 5.00 5.00 0.00 20.00 20
A 0.00 12.00 84.00 0.00 4.00 0.00 25
S 0.00 9.76 14.63 63.41 2.44 9.76 41
E 50.00 0.00 0.00 50.00 0.00 0.00 2
C 0.00 2.86 2.86 5.71 0.00 88.57 35
Marg. % 2.40 17.60 23.20 24.00 1.60 31.20
Marg. Freq. 3 22 29 30 2 39 125
(Continued)

22
Table 6 (Continued)
Column Percents
Time 2
Time 1 R I A S E C % M. Freq.
R 66.67 0.00 0.00 0.00 0.00 0.00 1.60 2
I 0.0 63.46 3.45 3.33 0.00 10.26 16.00 20
A 0.00 13.64 72.41 0.00 50.00 0.00 20.00 25
S 0.00 18.18 20.69 86.67 50.00 10.26 32.80 41
E 33.33 0.00 0.00 3.33 0.00 0.00 1.60 2
C 0.0 4.55 3.45 6.67 0.00 79.49 28.00 35
Marg. Freq. 3 22 29 30 2 39 125
Note. Cohen Coefficient Kappa = 0.67. Hit rate = 75.2%. R = realistic, I = investigative,A = artistic, S = social, E = enterprising, C = conventional.

23
Table 7
Circular Scale Score Distribution Comparing High-point Code of
Current Occupation with High-point Code of Computerized IP profile
.
Circular Scale Score Freq Percent
0 61 16.5
1 118 31.9
2 102 27.6
3 89 24.1
Total N 370

24
Table 8
Circular Scale Score Distribution Comparing High-point Code of Ideal
Occupation with High-point Code of Computerized IP Profile
Circular Scale Score Freq Percent
0 41 10.0
1 114 27.7
2 103 25.0
3 154 37.4
Total N 412

25
Table 9
Circular Scale Score Distribution Comparing High-point Code of Current
Occupation with High-point Code of P&P IP profile
Circular Scale Score Freq Percent
0 67 18.1
1 103 27.8
2 111 30.0
3 89 24.1
Total N 370

26
Table 10
Circular Scale Score Distribution Comparing High-point Code of Ideal
Occupation with High-point Code of P&P IP profile
Circular Scale Score Freq Percent
0 50 11.5
1 99 24.0
2 100 24.3
3 163 39.6
Total N 412

27
Table 11
Means and Standard Deviations of Circular Scale Scores
Currentoccupation
Idealoccupation
M SD M SD
Paper & PencilIP
1.60 1.04 1.90 1.03
ComputerizedIP
1.59 1.03 1.90 1.02
Note. n = 435 for current and ideal occupation and n = 362 for SDQ.

28
Table 12
Cross-Classification of the RIASEC High-point Codes for the Computerized IP
and Self-Description Questionnaire
SDQ
Comp. IP R I A S E C Marg. Freq.
R 18 2 1 1 0 1 23
I 15 28 8 5 3 2 61
A 10 14 29 14 2 7 76
S 8 6 4 75 5 2 99
E 10 1 3 5 8 1 28
C 8 8 4 15 6 34 75
Marg. Freq. 69 59 49 114 24 47 362
(Continued)

29
Table 12 (Continued)
Row Percents
SDQ
Comp. IP R I A S E C Marg. Freq.
R 78.26 8.70 4.35 4.35 0.00 4.35 23
I 24.59 45.90 13.12 8.20 4.92 3.28 61
A 13.16 18.42 38.16 18.42 2.63 9.21 76
S 8.08 6.06 4.04 74.75 5.05 2.02 99
E 35.71 3.57 10.71 17.86 28.57 3.57 28
C 10.67 10.67 5.33 20.00 8.00 45.33 75
Marg. % 19.06 16.30 13.54 31.49 6.63 12.98
Marg. Freq. 69 59 49 114 24 47 362
(Continued)

30
Table 12 (Continued)
Column Percents
SDQ
Comp. IP R I A S E C % M. Freq.
R 26.09 3.39 2.04 0.88 0.00 2.13 6.35 23
I 21.74 47.46 16.33 4.39 12.5 4.26 16.85 61
A 14.49 23.73 59.18 12.28 8.33 14.89 20.99 76
S 11.59 10.17 8.16 64.91 20.83 4.26 27.35 99
E 14.49 1.70 6.12 4.39 33.33 2.13 7.74 28
C 11.59 13.56 8.16 13.16 25.00 72.34 20.72 75
Marg. Freq. 69 59 49 114 24 47 362
Note. Cohen Coefficient Kappa = 0.42. Hit rate = 53.0%. R = realistic, I = investigative,A = artistic, S = social, E = enterprising, C = conventional.

31
Table 13
Means and Standard Deviations of Congruence Indices
Comparison Iachan M IndexBrown & Gore
C IndexRevised Brown &Gore C-rev Index
M SD M SD M SD
P&P IP/SDQ .440 .285 .664 .229 .620 .205
Comp. IP/SDQ .444 .288 .657 .238 .610 .214
P&P IP/Comp. IP .900 .158 .824 .222 .757 .170
Time 1/Time 2 Comp. IP .879 .162 .794 .224 .746 .165
Note. SDQ = Self-Description Questionnaire. Comp = Computerized. Indices have beenstandardized to range from 0.0 to 1.0.

32
Table 14
RIASEC Scale Intercorrelations for the Computerized IP (upper triangle)
and P&P IP (lower triangle)
R I A S E C
R -- .30 .25 .09 .38 .15
I .32 -- .36 .36 .22 .21
A .27 .36 -- .32 .45 .18
S .12 .38 .33 -- .35 .37
E .38 .23 .46 .36 -- .46
C .15 .22 .19 .34 .43 --
Note. n = 435. R = realistic, I = investigative, A = artistic, S = social,E = enterprising, C = conventional. Randomization test (Computerized IP):CI = .33, p ≤ .10; Randomization test (Paper & Pencil IP): CI = .32, p ≤ .12.

33
Table 15
RIASEC Scale Intercorrelations for the Time 1 (upper triangle) and Time 2
(lower triangle) Test-Retest Administrations of the P&P IP
R I A S E C
R -- .39 .18 .12 .24 .13
I .40 -- .35 .31 .18 -.11
A .17 .42 -- .33 .30 .22
S .16 .28 .28 -- .22 .06
E .33 .19 .26 .28 -- .44
C .19 -.09 .03 .09 .55 --
Note. n = 125. R = realistic, I = investigative, A = artistic, S = social, E = enterprising,C = conventional. Randomization test (Time 1): CI = .63, p ≤ .02; Randomization test(Time 2): CI = .65, p ≤ .03.

34
Table 16
Analysis of Variance for Computerized and P&P IP and RIASEC Codes_______________________________________________________________________
Source df SS MS F p-value________________________________________________________________________
Scale Version 1 2.58 2.58 0.33 .57* Error 434 3374.76 7.78
RIASEC 5 31819.81 6363.96 57.84 .000* Error 2170 238776.19 110.04
Scale * RIASEC 5 24.19 4.84 1.73 .12* Error 2170 6062.47 2.79________________________________________________________________________
*Geisser-Greenhouse / Huynh-Feldt corrections or Wilk’s lambda provide p-values of thesame magnitude.
35
Table 17
Intercorrelations between the P&P and Computerized IP RIASEC Scales
Computerized Paper & Pencil IP IP R I A S E C
R .97 .30 .26 .10 .36 .14
I .31 .96 .36 .38 .21 .20
A .25 .34 .96 .31 .40 .15
S .10 .35 .33 .96 .34 .36
E .38 .22 .47 .35 .93 .41
C .14 .20 .20 .34 .44 .95
Note. n = 435. R = realistic, I = investigative, A = artistic, S = social,E = enterprising, C = conventional.

36
Table 18
Cross-Classification of RIASEC High-point Codes for the
P&P and Computerized IP
Paper & PencilInterest Profiler Computerized Interest Profiler
R I A S E C Marg. Freq.
R 21 3 2 2 2 1 31
I 0 55 9 4 0 1 69
A 1 3 77 6 2 2 91
S 3 3 1 102 6 5 120
E 0 0 5 5 19 2 31
C 0 7 3 4 6 73 93
Marg. Freq. 25 71 97 123 35 84 435
(Continued)

37
Table 18 (Continued)
Row Percents
Paper & PencilInterest Profiler Computerized Interest Profiler
R I A S E C Marg. Freq.
R 67.74 9.68 6.45 6.45 6.45 3.23 31
I 0.0 79.71 13.04 5.80 0.0 1.45 69
A 1.10 3.30 84.62 6.59 2.20 2.20 91
S 2.50 2.50 0.83 85.00 5.00 4.17 120
E 0.0 0.0 16.13 16.13 61.29 6.45 31
C 0.0 7.53 3.23 4.30 6.45 78.49 93
Marg. % 5.75 16.32 22.30 28.28 8.05 19.31
Marg. Freq. 25 71 97 123 35 84 435
(Continued)

38
Table 18 (Continued)
Column Percents
Paper & PencilInterest Profiler Computerized Interest Profiler
R I A S E C % M. Freq.
R 84.00 4.23 2.06 1.63 5.71 1.19 7.13 31
I 0.0 77.46 9.28 3.25 0.0 1.19 15.86 69
A 4.00 4.23 79.38 4.88 5.71 2.38 20.92 91
S 12.00 4.23 1.03 82.93 17.14 5.95 27.59 120
E 0.0 0.0 5.15 4.07 54.29 2.38 7.13 31
C 0.0 9.86 3.09 3.25 17.14 86.90 21.38 93
Marg. Freq. 25 71 97 123 35 84 435
Note. Cohen Coefficient Kappa = .75. R = realistic, I = investigative, A = artistic,S = social, E = enterprising, C = conventional.

39
Table 19
Length of Time in Minutes to Complete the Computerized IP
Mean Median Minimum Maximum SD
19.1 17.4 7.3 73.0 8.0
Note. n = 435.

40
Table 20
Evaluation of Computerized Interest Profiler
How much experience do you have using a computer?
Freq. %_____________________________________________________________None 23 5.3A few times 92 21.1Occasionally 188 40.7Almost every day 143 32.9
Total N 435_____________________________________________________________
What equipment did you use to work through your computerized Interest Profiler?
Freq. %_____________________________________________________________Mostly used keyboard 77 17.7Mostly used mouse 258 59.3Used both about equally 100 23.0
Total N 435_____________________________________________________________
Overall, how clear were the Interest Profiler instructions?
Freq. %_____________________________________________________________Very clear 366 84.1Clear 58 13.3Somewhat unclear 10 2.3Not clear at all 1 0.2
Total N 435_____________________________________________________________
(Continued)
41
Table 20 (Continued)
Evaluation of Computerized Interest Profiler
What did the directions ask you NOT to think about when you were answering the workactivity questions?
Freq. %_____________________________________________________________Whether you had enough education or training 78 18.1How much money you would make 14 3.2All of the above 303 70.3None of the above 36 8.4
Total N 431_____________________________________________________________
What did you think about computer presentation and graphics?
Freq. %_____________________________________________________________Very interesting 130 30.2Interesting 178 41.3Somewhat interesting 89 20.6Boring 27 6.3Very boring 7 1.6
Total N 431_____________________________________________________________
How difficult was it to read the information presented on the computer screens?
Freq. %_____________________________________________________________Very easy to read 305 70.1Easy to read 102 23.4Somewhat easy to read 16 3.7Difficult to read 7 1.6
Total N 430_____________________________________________________________
(Continued)

42
Table 20 (Continued)
Evaluation of Computerized Interest Profiler
After the instruments are completed and available to the public, which version of theInterest Profiler would you rather take?
Freq. %_____________________________________________________________Paper & Pencil version 18 4.1Computerized version 341 78.4No preference,would take either version 76 17.5
Total N 435_____________________________________________________________
After the Interest Profiler is completed and available to the public, would you recommend itto a friend who needs help in exploring careers?
Freq. %_____________________________________________________________Yes 381 87.8No 10 2.3Not sure 43 9.9
Total N 434_____________________________________________________________

43
Table 21
Cross-Classification of Computer Experience with Equipment Used
Computerexperience
MostlyKeyboard
MostlyMouse
Bothabout
equally Total
Never 10 10 3 23
Few times 23 48 21 92
Occasionally 21 106 50 177
Almost every day 23 94 26 143
Total 77 258 100 435
Note. Pearson Chi-square = 22.35; p < .001

44
Table 22
Cross-Classification of Computer Experience with Clarity of Instructions
Clarity of instructions
Computerexperience
VeryClear Clear
Somewhatclear Not clear Total
Never 15 6 2 0 23
Few times 68 19 4 1 92
Occasionally 152 22 3 0 177
Almost every day 131 11 1 0 143
Total 366 58 10 1 435
Note. Pearson Chi-Square = 24.53; p < .01; Goodman-Kruskal Gamma = -0.42

45
Table 23
Cross-Classification of Computer Experience with
Ease of Reading Computer Screen
Ease of reading screen (very easy ⇔ very difficult)
Computerexperience 1 2 3 4 5 Total
Never 10 12 1 0 0 23
Few times 61 26 2 2 0 91
Occasionally 125 40 7 3 0 175
Almost every day 109 24 6 2 0 141
Total 305 102 16 7 0 430
Note. Pearson Chi-square = 16.27; p < .06; Goodman-Kruskal Gamma = – 0.20
46
Table 24
Cross-Classification of Computer Experience with Appeal of Graphics
Presentation & graphics (very interesting ⇔ very boring)
Computerexperience
1 2 3 4 5 Total
Never 14 6 3 0 0 23
Few times 33 37 16 5 0 91
Occasionally 51 75 33 13 4 176
Almost every day 32 60 37 9 3141
Total 130 178 89 27 7 431
Note. Pearson Chi-square = 20.34; p < .06; Goodman-Kruskal Gamma = -.21

47
Table 25
Cross-Classification of Computer Experience with IP Version Preference
Preferred Version
ComputerExperience
Paper & PencilIP
ComputerizedIP
NoPreference Total
Never 2 15 6 23
Few times 8 57 27 92
Occasionally 6 149 22 177
Almost every day 2 120 21 143
Total 18 341 76 435
Note. Pearson Chi-square = 25.21, p < .0001.

48
Figures

49
Figure 1
Computerized IP MDS Solution on the Comparability Sample
-2 -1 0 1 2Dimension-1
Note. Stress = .105, VAF = .879, N = 435.
-2
-1
0
1
2
Dimension-2
S
C
I
R
A
E

50
Figure 2
P&P IP MDS Solution on the Comparability Sample
-2 -1 0 1 2Dimension-1
Note. Stress = .114, VAF = .875, N = 435.
-2
-1
0
1
2
Dimension-2C
S
ER
A
I

51
Figure 3
Computerized and P&P IP MDS Solution
-2 -1 0 1 2Dimension-1
Notes. Stress = .114, VAF = .945, N = 435.
R,I,A,S,E, and C indicate scales of the Computerized IP.
Rp, Ip, Ap, Sp, Ep, and Cp indicate scales of the P&P IP.
-2
-1
0
1
2
Dimension-2
Rp R
A
Ip
Ap
I
CpC
SSp
EpE

52
Figure 4
Computerized IP MDS Solution on the ComparabilitySample using Euclidean Distances
-2 -1 0 1 2Dimension-1
Note. Stress = .095, VAF = .915, N = 435.
-2
-1
0
1
2
Dimension-2 S
A
C
RE
I

53
Figure 5
Computerized IP MDS Solution on the Test-Retest Sample
-2 -1 0 1 2Dimension-1
Notes. Stress = .093, VAF = .948, N = 125
R, I, A, S, E, and C indicate scales for Time 1.
R1, I2, A2, S2, E2, and C2 indicate scales for Time 2.
-2
-1
0
1
2
Dimension-2 C
C2 E2
E
R
R2 I
A2
I2A
SS2

54
Figure 6
Estimated Marginal Means of IP Scales
SubscaleCESAIR
EstimatedMarginalMeans
18
16
14
12
10
8
6
P&P IP
Computerized IP