One WaSH National Programme - Inception Report · This Inception Report is based on the findings of...
145
One WaSH National Programme - Inception Report Volume 1: Technical and Managerial Support for OWNP M&E
Transcript of One WaSH National Programme - Inception Report · This Inception Report is based on the findings of...
One WaSH National Programme - Inception Report
Volume 1: Technical and Managerial Support for OWNP M&E
Department for International Development (DFID)
Technical and Managerial Support for Strengthening the Monitoring
and Evaluation (M&E) system of the One WaSH National Programme
(OWNP) of Ethiopia, and for Conducting an Impact Evaluation
Contract Reference PO6888
List of Partners
IRC
October 2015
Coffey International Development Ltd
The Malthouse 1 Northfield Road Reading Berkshire RG1 8AH United Kingdom
T (+44) (0) 1189 566 066 F (+44) (0) 1189 576 066 www.coffey.com
Registered Office: 1 Northfield Road Reading Berkshire RG1 8AH United Kingdom
Registered in England No. 3799145 Vat Number: GB 724 5309 45
This document has been approved for submission by Coffey’s Project
Director, based on a review of satisfactory adherence to our policies on:
Quality management
HSSE and risk management
Financial management and Value for Money (VfM)
Personnel recruitment and management
Performance Management and Monitoring and Evaluation
(M&E)
Richard Hooper, Dr Robina Shaheen - Project Directors
Signature:
One WaSH National Programme – Inception Report, Volume 1

Disclaimer
This report is provided on the basis that it is for the use of DFID and
National WaSH Coordination Office, Government of Ethiopia only.
Coffey International Development Ltd will not be bound to discuss,
explain or reply to queries raised by any agency other than the intended
recipients of this report. Coffey International Development Ltd disclaims
all liability to any third party who may place reliance on this report and
therefore does not assume responsibility for any loss or damage
suffered by any such third party in reliance thereon.
ONEWASH INCEPTION REPORT VOL.1 (TASKS 1 AND 3)
ONEWASH – OCTOBER 2015
Abbreviations and Acronyms
AfDB African Development Bank
Akvo FLOW A data collection tool
API Application Programming Interface
BoE Bureau of Education
BoFED Bureau of Finance & Economic Development
CBOs Community Based Organizations
CBPF Capacity Building Pool Fund
CCRDA Consortium of Christian Relief and Development Association
CD Compact Disc
CMP Community Managed Project
CSA Central Statistical Agency
CSOs Civil Society Organizations
CSV Comma Separated Values (a file format)
CWA Consolidated WaSH Account
COWASH Community-Led Accelerated WASH
DFID Department for International Development
DHS Demographic Health Survey
IFMIS Integrated Financial Management Information System
EMIS Education Management Information System
ESIA Environmental and Social Impact Assessment
ESMF Environmental and Social Management Framework
ESMP Environmental and Social Management Plan
FRMP Fiduciary Risk Mitigation Plan
GPS Global Positioning System
GTP Growth and Transformation Plan
HEH Hygiene and Environmental Health
HEW Health Extension Worker
ONEWASH INCEPTION REPORT VOL.1 (TASKS 1 AND 3)
ONEWASH – OCTOBER 2015
HMIS Health Management Information System
HRD Human Resource Development
HR Human Resource
HSC Health Science College
HSDP Health Sector Development Program
IBEX Integrated Budget and Expenditure system
ICRC International Committee of the Red Cross
ICT Information Communication Technology
IDA International Development Assistance
IPs Implementing Partners
IRC International think-and-do tank focused on WaSH
IT Information and Technology
JMP Joint Monitoring Program
JTR Joint Technical Review
KPI Key Performance Indicators
M&E Monitoring & Evaluation
MDG Millennium Development Goal
MIS Management Information Systems
MoE Ministry of Education
MoFED Ministry of Finance and Economic Development
MoH Ministry of Health
MoU Memorandum of Understanding (signed in 2012 between OWNP partners MoWE, MoH, MoE
and MoFED)
MoWE Ministry of Water and Energy (later Ministry of Water, Irrigation and Energy)
MoWIE Ministry of Water, Irrigation and Electricity (from October 2015, previously Ministry of Water,
Irrigation and Energy)
MSF Multi-Stakeholder Forum
NGO Non-Governmental Organization
NWCO National WaSH Coordination Office
NWI National WaSH Inventory
ONEWASH INCEPTION REPORT VOL.1 (TASKS 1 AND 3)
ONEWASH – OCTOBER 2015
NWSC National WaSH Steering Committee
NGO Non-Governmental Organization
OWNP One WaSH National Program
PBS Promoting Basic Services (a program)
PMU Project Management Unit
POM Programme Operations Manual (for Consolidated WaSH Account)
PUT Professionals United Together
RPF Resettlement Policy Framework
RWCO Regional WaSH Coordination Office
RWSC Regional WaSH Steering Committee
S&HWG Sanitation and Hygiene Working Group
SLA Service Level Agreement
SNV Netherlands Development Organization
TVETC Technical and Vocational Education and Training College
TWU Town Water Utility
UAP Universal Access Program
UNICEF United Nations Children’s Fund
USD United States Dollar
WaSH Water, Sanitation and Hygiene
WaSH M&E MIS Water, Sanitation and Hygiene Monitoring & Evaluation Management Information System
WaSHCO Water, Sanitation and Hygiene Committee
WHO World Health Organisation
WIF WaSH Implementation Framework
WoFED Woreda Finance and Economic Development Office
WPs Water Points
WSF Water and Sanitation Forum
WSP Water and Sanitation Program (administered by the World Bank)
WSSD Water Supply and Sanitation Directorate
WSWG Water Sector Working Group

ONEWASH INCEPTION REPORT VOL.1 (TASKS 1 AND 3)
ONEWASH – OCTOBER 2015
WWT Woreda WaSH Team
CONTENTS / ONEWASH INCEPTION REPORT VOL. 1 (TASKS 1 AND 3)
ONEWASH – OCTOBER 2015 i
Contents
EXECUTIVE SUMMARY 1
Section 1: Background and Purpose 5
About this Report 5
Current Status of OWNP M&E Systems 5
Structure and Key Definitions 13
Section 2: Enhanced OWNP M&E Framework 14
Overview 14
Design Considerations of Enhanced M&E Framework 18
Detailed Design of Enhanced M&E Framework 19
Tracking Risks Using Enhanced M&E Framework 21
Calendar for Enhanced OWNP M&E Reporting 23
Section 3: Technical & Functional Requirement Specifications of WaSH M&E ICT System 25
Design Criteria 25
Shared Requirements for all ICT Systems 26
MIS Requirement Specifications 26
Mobile Data Collection System Requirement Specifications 27
Section 4: Four Year Operational Plan 29
Work Plan Structure 29
OWNP Systems Enhancement Sub-Plan 30
Capacity Development Sub-Plan 36
Procurement Sub-Plan 44
Synergy and Complementarity Sub-Plan 49
National WaSH Inventory Renewal Sub-Plan 53
Data Quality Assurance Sub-Plan 57
Data Dissemination and Use Sub-Plan 59
Exit Sub-Plan 69
Section 5: Cost Estimates 73
ANNEXES: Annex 1: References 77
Annex 2: Organisations Consulted 78
CONTENTS / ONEWASH INCEPTION REPORT VOL. 1 (TASKS 1 AND 3)
ONEWASH – OCTOBER 2015 ii
Annex 3: Proposed OWNP M&E Indicators 81
Annex 4: Detailed Work Plan (GANNT) 106
Annex 5: Terms of Reference 112

EXECUTIVE SUMMARY / ONEWASH INCEPTION REPORT VOL.1
ONEWASH – OCTOBER 2015 1
Executive Summary
This is Volume 1 of the Inception Report which is the final deliverable of the inception phase for technical and
managerial support for strengthening the M&E system of the One WaSH National Programme (OWNP). Volume
two of the Inception Report focused on the impact evaluation of the OWNP whereas Volume 1 sets out a plan to
operationalise an enhanced M&E framework for monitoring and reporting on the programme, the ICT-enabled
tools and operational plans that are needed to implement this enhanced framework and data dissemination and
use activities to ensure use.
Basis of Recommendations
This Inception Report is based on the findings of a Diagnostic Review Report which was submitted to DFID on 8
May and constituted the first deliverable of a six month inception phase which ran from May to September 2015.
The Diagnostic Review Report provided an analysis of the current state of the OWNP and its findings include:
The OWNP is a challenging multi-sector (water, education, health and finance) programme to report on
with emerging coordination structures that need to be strengthened. Improvements in WaSH M&E can
support this process.
Existing WaSH M&E processes are sectoral and fragmented with relatively little experience to date of
integrated reporting.
Existing IT-enabled systems are in use in all sector ministries to monitor aspects of WaSH, although not yet
at national level in water supply.
The National WaSH Inventory has been a major advance with its results used in critical processes and
decision making. There is potential for further integration and ownership of its data across sectors.
WaSH M&E MIS software that has been in development since 2010 is now functional but is not yet
operational (i.e. in use at all administrative levels) and does not fully meet current requirements.
Introduction of ICT is at an early stage across WaSH sectors, but with developments underway in all WaSH
sectors. There is potential to benefit and learn from these initiatives.
Quality assurance has not received major attention yet with limited practice of triangulation or validation of
data.
There is strong demand for data but the use of data is generally neglected because it is not accessible or
limited resources and priority is allocated to analysis and use.
There are substantial capacity constraints which require a broad approach to capacity development.
Development partners, through a range of projects, have made substantial financial commitments to WaSH
M&E. As well as DFID’s TA and financial support for the NWI this also includes the Capacity Building Pool
Fund, AfDB financing through the Rural Water Supply and Sanitation Initiative Trust Fund, CWA Capacity
Building activities, and through the Promoting Basic Services program.
[See chapter 2 for a detailed discussion of these issues. See table 1, section 1.2.2 for a summary of the current
WaSH M&E system.]
Key Recommendations and Actions
On the basis of these findings, this report defines:
A. An enhanced M&E Framework for OWNP monitoring and reporting in an integrated manner across the
sector ministries and other development partners.
B. An Integrated Reporting Mechanism across all sector ministries to enable the enhanced M&E
framework.
C. Procurement and deployment modalities of an ICT-enabled WaSH Management Information System
(MIS) and a mobile data collection solution to operationalise the enhanced M&E framework.
EXECUTIVE SUMMARY / ONEWASH INCEPTION REPORT VOL.1
ONEWASH – OCTOBER 2015 2
D. A Four Year Work Plan - made up of a number of ‘sub-plans’ in key areas – for capacity development of
ministry staff and roll-out modalities of the use of these ICT-enabled technologies for monitoring and
reporting nationwide.
The following recommendations and actions are proposed in relation to each of the above.
A. Enhanced M&E Framework
This report recommends an updated indicator set that can be collected across all sectors for integrated WaSH
monitoring and reporting. This proposed set consists of a set of 14 Core Key Performance Indicators and 80
Supplementary Indicators which can be added on in a phased manner as M&E capacities improve across sector
ministries and inter-agency coordination mechanisms are strengthened. It is anticipated that these indicator sets
will be discussed further to align them with GTP2 and other requirements. [See section 3.3.1, Table 1 for a list of
core indicators and Annex 3 for a full list of indicators, definitions and data sources. See section 3.5 for an
indicative calendar which synchronises activities around collection, processing and analysis of these indicators with
ministry reporting requirements on quarterly and annual basis.]
It is inevitable that monitoring and reporting requirements will keep changing over time in response to changing
WaSH trends and the needs of various organisations involved in OWNP. A regular system of review and updating
of indicators across sector ministries is essential. This report earmarks a set of “Other Standard Indicators” but
does not specify these indicators at this point. This set of indicators will be gradually developed and kept updated
as the programme runs its course.
The combined set of Core and Supplementary Indicators will also be able to track environmental, social,
resettlement and fiduciary risks across WaSH sectors. [See section 3.4 for a discussion of how these risks will
be tracked.]
B. Integrated Reporting Mechanism for Enhanced M&E Framework
This report recommends an integrated reporting mechanism whereby existing sectoral MIS systems (owned by
line ministries in health, education and finance) are used to collect data from local levels which is then imported at
the federal level into an ICT-enabled WaSH MIS (s) housed in the Ministry of Water Irrigation and Electricity
(MoWIE) to support both water supply reporting (on a quarterly and annual basis) and production of integrated
OWNP reports at woreda, town, zone, regional, and federal levels. The WaSH MIS will also enable quick access to
WaSH data at all administrative levels. This will require sector line ministries to enter into a data sharing
agreement.
In the longer term, it is expected that as this system stabilises and strengthens, it will progress to the next level
where WaSH data is imported into an ICT enabled WaSH MIS directly at woreda (district) level. This will require
improved physical factors including electricity, computers and reliable internet connectivity, and strengthening over
time of institutional capacity to coordinate the collection, processing and analysis of data across all woredas in the
country which is why it is a longer term goal.
The National WaSH Inventory (NWI) is proposed to be updated on a five yearly cycle. It will complement the
integrated reporting on a quarterly and annual basis as it can incorporate indicators which are more suitable for
collection at longer intervals and will help to triangulate the data generated by the WaSH MIS. Last updated in
FY2010-11, this report recommends the second update of the NWI to be completed by FY 2015-16.
The integrated reporting mechanism outlined above emerged as the preferred option out of four options
discussed in stakeholder consultation workshops with OWNP line ministries, donors and development partners
in August and September 2015. These four options were:
1. Using existing sector MIS systems (health, education and finance) and operationalising the existing water
supply MIS to support water supply data management (both regular reporting and asset inventory data),
together with integrated OWNP reports produced at all levels (woreda, town, zone, regional, federal).
2. Using existing sector MIS systems (health, education and finance) to collect data from local levels and
operationalising a new, integrated WaSH MIS to both support water supply data management (regular
reporting and asset inventory) and to provide access to WaSH data at all levels to support production of
integrated OWNP reports (woreda, town, zone, regional, federal). Health, education and finance sector
data is imported at federal level and made available at all levels downwards (regions, zones and woredas).
EXECUTIVE SUMMARY / ONEWASH INCEPTION REPORT VOL.1
ONEWASH – OCTOBER 2015 3
3. As in option 2 but with data imported from health, education and finance sector MIS systems at woreda
(district) level for entry into the new, integrated WaSH MIS.
4. Integrated data collection through an annually updated National WaSH Inventory only without using sector
MIS systems.
[See section 3.1 for a discussion of these options.]
C. Enhanced ICT-enabled WaSH Management Information System (MIS)
To enable integrated reporting on the enhanced M&E framework, this report recommends the use of ICT-enabled
MIS. After assessing the current levels of ICT use in the four line ministries, this report recommends the following
actions [see section 4.4 for detailed discussion of procurement aspects]:
Modify existing WaSH MIS software to incorporate limited, improved functionalities: The current
scope of the existing WaSH M&E MIS will be changed to support its operationalisation. It will refocus on
the reporting and analysis requirements as well as local data storage, while most user data input functions
will be disabled. The outputs will include online dashboards with customisable reporting templates for
regular OWNP reporting. This is to be done through extending the contract to PUT, the developers of the
current custom built software. After these modifications, the current MIS software will be able to improve
processing of OWNP and NWI data and generate programme reports although it will not use data entry
functionalities and would have limited scope.
Procure, in parallel, alternate WaSH MIS software: It is recommended that Commercially-Available-Off-
The-Shelf (COTS) software be procured in parallel to the modification work to the existing software and
customised to develop a new WaSH MIS solution that can capitalise on the latest technology available in
the market and have the flexibility and support systems in place for quicker deployment. As integrated
reporting mechanisms strengthen after a year, this will give MoWIE the option of switching over to a more
powerful MIS software application should it be the case that the existing software is unable to meet all
requirements even after modifications.
Utilise mobile device–based data collection software: It is recommended that data collection, for OWNP
reporting as well as NWI, be reported through the use of COTS mobile data collection software. It is important to
ensure that the data collected through mobile devices is in a format that is compatible with both the current and
proposed new MIS software.
Development for low connectivity contexts: Internet connectivity, while improving, remains a major challenge for
ICT-based solutions. Some of the proposed mitigation strategies to overcome connectivity issues include:
Paper-based systems will still be streamlined and improved as a back-up
Mobile phones will have a feature to capture large sets of data
Mobile phones to be synced at Woreda level and data to be made available in reusable format for later
import to the MIS system
MIS to have feature to import bulk data
Offline tools for low-level data analysis to be created
Deploy experienced ICT Project Management Support: It is recommended to deploy specialist ICT Project
Management support to design contracts and technical specifications, manage related procurement processes and
ensure that the solutions procured meet contract requirements.
This report recommends design criteria and requirement specifications for both the MIS (current and new) and
mobile data collection solutions. [See section 3.1 for design criteria, and sections 3.2-3.4 for requirement
specifications.]
D. Four Year Operational Plan
This report provides a four year detailed work plan to ensure that the enhanced M&E Framework is adopted and
related ICT systems developed, tested and rolled out across sectors in a phased and sustainable manner.
Support is not restricted to technical issues by any means, but is comprehensive and multi-faceted to address the
wider governance and political economy challenges in WaSH data use. Plans include four work packages related
to 1) OWNP systems enhancement, 2) capacity development, 3) data dissemination and use and 4) synergy and
EXECUTIVE SUMMARY / ONEWASH INCEPTION REPORT VOL.1
ONEWASH – OCTOBER 2015 4
complementarity, and four sub-plans relating to procurement of ICT solutions, the National WaSH inventory, data
quality assurance and sustainability (an exit plan). Beginning in November 2015, this plan sets out a timetable for
the adoption and implementation of the enhanced M&E framework by February 2019. Key phases of this work plan
[see annex 4 for a detailed GANNT chart] are outlined below:
February 2016: Procurement of mobile data collection solution completed and ready for launch
September 2016: Procurement, development, testing of upgraded existing software and new MIS software
completed and ready for launch
October 2016: Second update of NWI (NWI2) completed using mobile data collection
October 2016, 2017, 2018: OWNP Integrated Annual WaSH Report published every October (with 2016
report produced manually without using integrated WaSH MIS software)
June 2017: First wave roll-out of integrated MIS completed
February 2017: First Ethiopia WaSH Atlas produced on basis of NWI2 data
May 2018: Second wave roll-out of integrated MIS completed
December 2018: All regions enabled to collect, process and report on data at kebele and water point levels
February 2019: Hand-over to the National WaSH Coordination Office and exit of technical and managerial
support team
The adherence to these timelines will very much depend upon the start date for the implementation phase.
The overall work plan cascades into components or ‘sub-plans’ with detailed activities for key areas: OWNP
systems enhancement [see section 4.2], Capacity development [see section 4.3], Procurement [section 4.4],
Synergy and Complementarity [section 4.5], NWI Renewal [section 4.6], Data Quality Assurance [section 4.7], Data
Dissemination and Use [section 4.8] and Exit [section 4.9].
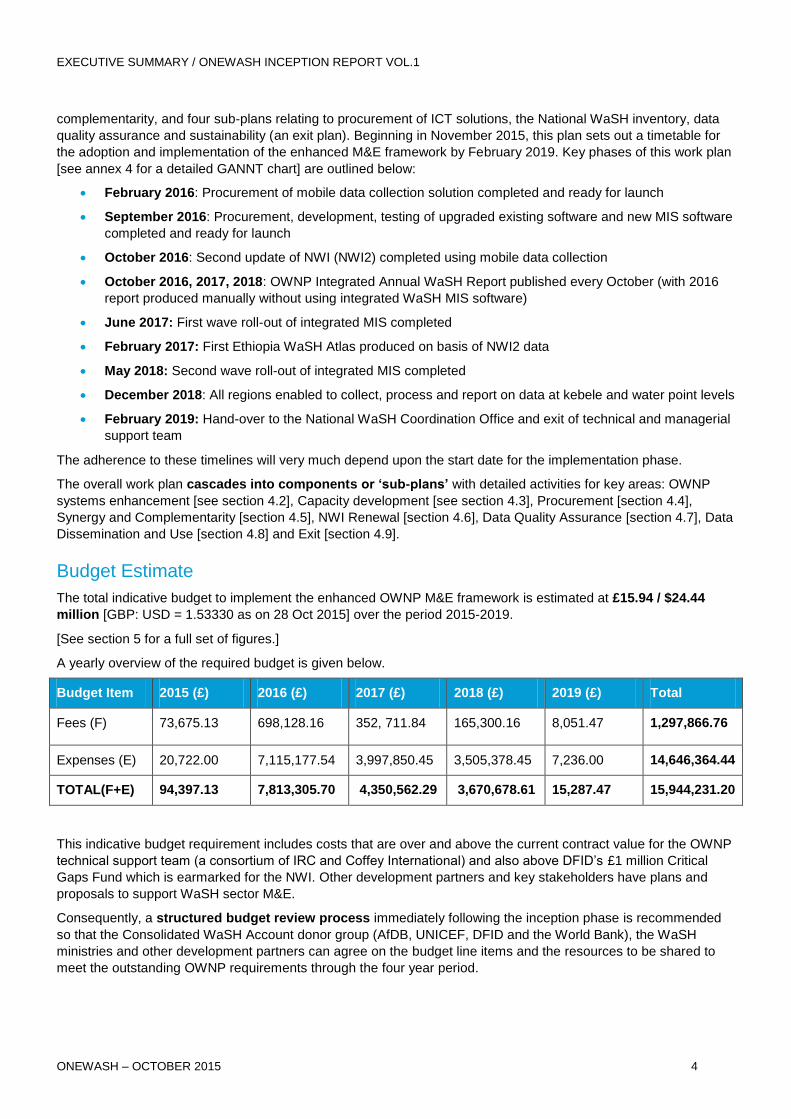
Budget Estimate
The total indicative budget to implement the enhanced OWNP M&E framework is estimated at £15.94 / $24.44
million [GBP: USD = 1.53330 as on 28 Oct 2015] over the period 2015-2019.
[See section 5 for a full set of figures.]
A yearly overview of the required budget is given below.
Budget Item 2015 (£) 2016 (£) 2017 (£) 2018 (£) 2019 (£) Total
Fees (F) 73,675.13 698,128.16 352, 711.84 165,300.16 8,051.47 1,297,866.76
Expenses (E) 20,722.00 7,115,177.54 3,997,850.45 3,505,378.45 7,236.00 14,646,364.44
TOTAL(F+E) 94,397.13 7,813,305.70 4,350,562.29 3,670,678.61 15,287.47 15,944,231.20
This indicative budget requirement includes costs that are over and above the current contract value for the OWNP
technical support team (a consortium of IRC and Coffey International) and also above DFID’s £1 million Critical
Gaps Fund which is earmarked for the NWI. Other development partners and key stakeholders have plans and
proposals to support WaSH sector M&E.
Consequently, a structured budget review process immediately following the inception phase is recommended
so that the Consolidated WaSH Account donor group (AfDB, UNICEF, DFID and the World Bank), the WaSH
ministries and other development partners can agree on the budget line items and the resources to be shared to
meet the outstanding OWNP requirements through the four year period.
ONEWASH INCEPTION REPORT VOL. 1 (TASKS 1 AND 3)
ONEWASH – OCTOBER 2015 5
1 Background and purpose 1.1 About this report
The UK Department for International Development (DFID) engaged the Coffey International Development and IRC
consortium to provide technical and managerial support to the One WaSH National Programme (OWNP) in
monitoring and evaluation (M&E) and to undertake an impact evaluation. Tasks over a four year period are related
to three main areas: strengthening and coordinating M&E systems across the WaSH sectors (Task 1- led by IRC),
promoting dissemination and use of WaSH data (Task 3 - also led by IRC), and undertaking an impact evaluation
of the nationwide OWNP (Task 2 - led by Coffey).
Consultancy support to the National WaSH Coordination Office (NWCO) began in March 2015, and the inception
report is the key output of the inception phase to September 2015. This part of the inception report is related to
tasks 1 and 3 only and has been prepared by the OWNP M&E support team from IRC. The other part of the
inception report is related to task 2 only and has been prepared by Coffey. It is important to note that the report is
structured in this way to comply with DFID requirements of independence between task 2 (impact evaluation) and
tasks 1 and 3 (M&E support).
Building on the findings of a diagnostic report (produced in May 2015), this inception report sets out a plan to
operationalise OWNP M&E. The key components of the inception report were discussed at a stakeholder
consultation workshop held in Addis Ababa on 21 August 2015 and a follow up workshop held on 22 September
2015.
1.2 Current status of OWNP M&E: findings from the diagnostic review
The OWNP is a sector-wide approach to water, sanitation and hygiene (WaSH) that involves four key government
ministries and their related sectors to modernise the way WaSH services are delivered to people. It combines the
efforts of the Ministry of Water, Irrigation and Electricity (MoWIE) (lead by its Water and Sanitation Supply
Directorate), Ministry of Health (MoH), Ministry of Education (MoE) and the Ministry of Finance & Economic
Development (MoFED). It brings together government, development partners and Non-Governmental (NGO)
activities in WaSH in a coordinated programme with total planned programme investments of 2 billion USD over a
seven year period (2013-2020).
The OWNP aims to improve the health and well-being of communities in rural and urban areas by increasing
equitable and sustainable access to water supply and sanitation and the adoption of good hygiene practices. It
combines a comprehensive range of water, sanitation and hygiene interventions that include capital investments to
extend first-time access to water and sanitation as well as investments focused on developing the enabling
environment, building capacity, ensuring the sustainability of service delivery, and behavioural change. It
addresses WaSH provision for households, rural and urban communities, as well as in schools, health and other
institutions.
OWNP M&E objectives include1:
to measure and report progress towards the intended One WaSH National Programme (OWNP) results,
and;
to strengthen accountability of the WaSH sector at all levels (i.e., federal, regional and Woreda) through the
use of data and information from the WaSH M&E system.
This section of the report summarises key aspects of the current status of OWNP M&E and the enabling
environment for OWNP M&E. It summarises the key findings from the diagnostic review of OWNP M&E
(Coffey/IRC, 2015), field visits to three regions and further stakeholder consultations including additional
assessments of M&E capacity (IRC, 2015a) and the WaSH M&E MIS (IRC, 2015b) that is under development. This
background provides the foundation for the design decisions taken on further support to OWNP M&E and its
operationalisation.
1 Based upon Terms of Reference (Annex 5).
ONEWASH INCEPTION REPORT VOL. 1 (TASKS 1 AND 3)
ONEWASH – OCTOBER 2015 6
1.2.1 OWNP: a challenging multi-sector programme with emerging coordination structures
The OWNP is a challenging multi-sector and multi-stakeholder programme to report on. It involves multiple
ministries and levels, and its organs and coordination mechanisms are generally new, still under development and
all the intended capacities not yet in place. Water, Sanitation and Hygiene are challenging to integrate because
implementation is through the relevant government sectors and their processes. This leads to emphasise on a
vertical reporting approach within the concerned line ministries. Strengthening horizontal coordination (between
sectors) is critical for integrated WaSH reporting and decision making because the programme spans different
sectors.
At federal level, links between the four ministries are gradually being strengthened as NWCO capacity is increased
and as activities under the Consolidated WaSH Account (CWA) financing are rolled out. Some platforms, such as
the National WaSH Steering Committee (NWSC), are not yet active and there is also not always a strong
understanding of the OWNP by non-focal persons. For example, at all levels the OWNP is widely considered to be
equivalent to the CWA. This presents a barrier to the development of an integrated or coordinated M&E system for
the entire OWNP. Awareness and ownership of OWNP objectives, and the need for coordination, sharing of data
and integrated reporting could be further developed.
Some key structures to enable horizontal coordination such as the Regional WaSH Coordination Offices (RWCOs),
with staffing from all the four sectors, are also not yet fully in place. This means that Project Management Units and
their assigned staff from the implementing ministries partly fulfil the coordination role. At woreda level, horizontal
coordination between sectors is somewhat easier to realise through the Woreda WaSH teams where these are in
place. Linkages are weaker in woredas that are not supported through the CWA or other donor-supported WaSH
programmes.
1.2.2 Existing WaSH M&E processes: sectoral and fragmented with little integrated reporting
The WaSH sectors are intended to gradually move towards ‘one plan, one budget, and one report’ reducing the
administrative and reporting burden on critical staff and supporting greater efficiency. The starting point of the
existing WaSH landscape is rather fragmented and complex with numerous programmes, plans, financing
channels and reports across the WaSH sectors. There is clearly great potential that improved and more integrated
M&E will facilitate improved information flows and support coordination, with the OWNP being able to more quickly
monitor, evaluate and communicate its successes and failures. It can also help to realise the strengths of a multi-
sectoral approach (using links between water supply, sanitation provision and hygiene behaviours in decision-
making).
Table 1 summarises the key reporting processes within government related to WaSH. There are already
considerable efforts in WaSH M&E across the three main sectors and in finance as a supporting ministry. Further
data is collected through the household surveys administered by the Central Statistical Agency. Integrated WaSH
monitoring, through combined data collection processes, is a recent development through for example the NWI in
2010/11. There is some overlap between these efforts although they are largely complementary. Water supply
indicators used by MoWIE and the CSA overlap but this has proven useful as data collection methods are different
and variation in results has led to scrutiny and improved methodologies. There is little overlap between other efforts
except with relation to the NWI.
M&E responsibilities and efforts are typically fragmented (even within government) because of the complex
financing arrangements in WaSH sectors and the many different Ministries, Departments, Offices, Processes, Sub-
processes and Case Teams involved. Fragmented responsibilities result from the many different funding
modalities, for example the block grant, consolidated WaSH account, bilateral and multilateral (UN) programmes
and projects, NGO projects and emergency WaSH interventions.
Cooperation between the units managing information systems and IT across WaSH ministries and alignment of
data from the different MIS systems across the WaSH sectors is currently limited, and this hampers efforts to
produce WaSH sector wide reporting, for example to combine health data on sanitation and education data on
school WaSH with water sector data on rural and urban water supply. Ministries do not yet cooperate sufficiently to
ensure data sets are complementary, avoid overlaps and ensure timely sharing. A further challenge is presented by
the decentralised nature of the country. Regions and woredas especially have substantial powers and a strong
stake in what data shows. A typical gap (affecting financial expenditure data for example) is that as data flows up
the system it loses value due to aggregation at the different levels (regions reporting consolidated woreda-data to
the federal level for example).

ONEWASH INCEPTION REPORT VOL. 1 (TASKS 1 AND 3)
ONEWASH – OCTOBER 2015 7
Major surveys by the Central Statistical Agency (CSA) with WaSH questions include the Demographic and Health
Survey (every 5 years with recent mini-DHS for PBS recently), Welfare Monitoring Survey (every 5 years),
Household Consumption Expenditure Survey (5 years), and Census (10 years). Strong links have not yet been
established to the National Statistical System led by the CSA and there appears to be potential for wider use of
household survey data within the OWNP if these links are strengthened, as well as learning from developments in
M&E in other sectors.
There are established governance arrangements to link NGO reporting to the OWNP such as the consolidated
reporting of the Christian Relief and Development Association (CCRDA) Water and Sanitation Forum, in addition to
the agreement-related reporting requirements on NGOs to report to Finance and Economic Development at
woreda, region or federal level. Efforts are underway to strengthen this reporting and will be supported and
strengthened.

ONEWASH INCEPTION REPORT VOL. 1 (TASKS 1 AND 3)
ONEWASH – OCTOBER 2015 8
Table 1: Existing governmental monitoring processes related to WaSH
Processes Water Health Education Finance Central Statistical
Agency
Integrated WaSH
WaSH
Indicators
Indicators are defined in multiple
documents with the UAP and
GTP indicators leading, and
others defined in OWNP, CWA,
NWI etc. Focus on access to
improved schemes and
functionality.
HMIS includes 3 key indicators
on household sanitation and
hygiene, and an indicator on
water and sanitation at health
institutions. HEH programme
monitoring includes additional
indicators and these are being
expanded.
EMIS provides data on water
and latrine facilities at
schools with improved
indicators included in the
Education Sector
Development Plan IV.
Expenditure data is
collected according to
standard budget
codes.
WaSH indicators
generally as per JMP
definitions. Surveys with
WaSH questions include
the Demographic and
Health Survey, Welfare
Monitoring Survey,
Household Consumption
Expenditure Survey, and
Census.
The National WaSH
Inventory, OWNP and
CWA have all identified
indicators across WaSH
Data
collection
(and
reporting
frequency)
Critical coverage and
functionality indicators are
calculated based upon data that
is annually reported by woreda
water offices (rural water) and
urban water supply utilities.
Quarterly reporting processes
are extensive, but based upon
none standard indicators and
variable definitions.
Data is collected frequently by
health extension workers and
reported through health
centres to woredas. Data is
aggregated and entered into
HMIS (on quarterly basis) and
reported at all levels. However,
some sanitation data does not
get aggregated at regional
level, causing data gaps.
Annually from all schools
under supervision of
supervisors.
Quarterly from
WoFED, BoFED, etc.
Household surveys
employing trained
enumerators. Statistical
sampling. Some surveys
and questions provide
disaggregated data with
respect to gender, age ,
religion etc.
Not currently routine.
Major recent examples
of integrated data
collection were NWI
2010/11 (NWI in Somali
excluded the household
sanitation components)
and collection of data
from regions through
standard formats for
CWA annual report.
Data
processing
Generally done using desktop
software, e.g. Excel.
The HMIS is managed by a
diploma holding expert at
Woreda level who is in charge
of transcribing paper-based
submissions and generating
CDs with the woreda results.
The expert’s computer is highly
regulated to prevent viruses
and reduce maintenance
requirements.
Regions aggregate results
from paper forms using Excel
and submit this to MoE who
manage the data in an
Access database.
Data processing
occurs in IBEX.
Centralised in CSA NWI data was entered
into a custom-made
Access database.

ONEWASH INCEPTION REPORT VOL. 1 (TASKS 1 AND 3)
ONEWASH – OCTOBER 2015 9
Processes Water Health Education Finance Central Statistical
Agency
Integrated WaSH
MIS/
analysis
Rural and urban water supply
included in WaSH M&E MIS but
this is not yet operational. Excel
is standard for analysis.
The HMIS supports the
calculation of the indicators for
which it is configured. Not all
health data is in the HMIS and
some indicators may be
calculated in Excel or
manually. Performance reviews
at each level are an additional
check to the analysis.
The EMIS data is analysed in
MoE on an annual basis.
There can be significant
delays in reporting with
reports coming up to a year
later.
IBEX is currently used
to generate reports.
MoFED is currently
piloting a new
Integrated Financial
Management
Information System
(IFMIS) with MoH.
There are a number of
web platforms to
generate indicators from
CSA, e.g. CountryStat
Ethiopia. Many datasets
are created by CSA
analysts.
Most analysis in Excel.
Data from 2010/11 has
been imported into the
WaSH M&E MIS by
PUT. WaSH M&E MIS
(not yet operational)
Reporting Annual reports are prepared by
Planning Department (MoWIE
wide) and by WSSD for various
donor projects and programmes.
Reports disseminated in sector
meetings.
MoH publishes HMIS indicator
results on an annual basis in
its annual performance report.
However, the key sanitation
indicators have not yet been
reported.
An Education Statistics
Annual Abstract is produced.
Budgets are published
annually and financial
information can be
accessed through
IBEX.
The CSA website
provides access to
publications and a
number of web platforms
for downloading analysis
and datasets published
on a regular basis. The
naming and coding
publication, critical for
integrated reporting is
not yet regularly updated
(last updated in 2012).
The first OWNP-CWA
report was prepared in
August 2015. However
this was only integrated
at federal level.
Integrated reporting is
not yet underway at
regional or woreda
levels.
ONEWASH INCEPTION REPORT VOL. 1 (TASKS 1 AND 3)
ONEWASH – OCTOBER 2015 10
1.2.3 Existing IT-enabled systems: in use to monitor aspects of WaSH
There are a large number of existing systems that already collect WaSH related data at both national and local
levels. These systems include in health the HMIS (with 3 household sanitation indicators and 2 health institution
indicators; located within the Health System Special Support Directorate) which is complemented by the Hygiene
and Environmental Health directorate’s programme monitoring system (with four additional WaSH indicators
proposed). The Education sector also has an existing national level management information system in place
(within the EMIS directorate) with School WaSH indicators (3 key indicators) and annual reports include reporting
on these indicators. Finance has the national IBEX system to manage public expenditure according to standard
budget codes.
All of these systems have gaps with respect to WaSH indicators and the quality of data collected. However, these
are all functioning national scale data collection and reporting systems within OWNP implementing ministries, and
there are opportunities (at relatively low cost) to improve the WaSH data that is captured by these systems and to
ensure that it is utilised as far as possible. While IT-enabled MIS systems at national level are operational within
the education, health and finance sectors, there is not yet a comparable national system in use in the water supply
sector. This is a major challenge. There may be approaching 200,000 improved water supply schemes compared
to approximately 20,000 health institutions and 37,000 schools to monitor.
There are however other IT-enabled systems in water supply at regional and more local levels. The Tigray Water
Resources Board has deployed the most extensive system. This covers the whole region to monitor water supplies
based upon data entry and management by woredas linked to a database managed at the regional level that relies
upon internet connectivity. The system is operational despite, in particular, internet connectivity challenges, and the
data is used in official coverage calculations. However, similar to many other sector databases the data held within
the system is not being utilised to its full potential.
There is an opportunity to learn from these existing national and regional IT-enabled M&E systems in WaSH while
introducing new systems. The introduction of new systems should also clearly be undertaken based upon careful
consideration and plans on what to do with the existing systems.
1.2.4 The National WaSH Inventory: a major advance with potential for further integration
A key recent achievement in WaSH has been the undertaking of a National WaSH Inventory in 2010/11 and in
2014 in the Somali region. The latter undertaking deployed new mobile data collection technologies which greatly
improved the speed and quality of data collection. A major success of the NWI was an improved national estimate
of access to improved water supplies, and the results were accepted and used by both the parliament and later the
WHO-UNICEF Joint Monitoring Programme (JMP) in determining that Ethiopia had successfully met the MDG
water target.
While the NWI was multi-sectoral in its WaSH scope, and engaged health extension workers and teachers in data
collection, it has not achieved the same level of ownership in the health and education sectors as in water who led
the process. The NWI involved collection of data on hygiene and sanitation and institutional WaSH (in 2010/11 in
Somali household sanitation was not included) that in future could duplicate sectoral data collection processes in
the health and education sectors. This duplication would be costly if repeated and might also hinder development
of ownership of NWI results by sectors that have their own M&E systems (including WaSH data).
The development of an integrated WaSH M&E MIS which currently holds NWI data does not yet link to the
established data collection processes and management information systems in finance, education and health.
Concerted efforts will be required to ensure integration and ownership within the ministries of health, education and
finance.
1.2.5 WaSH M&E MIS software: functional but not yet operational
The WaSH M&E MIS has been in development since 2008 with software handed over to MoWIE in 2015. Our
analysis shows that the WaSH M&E MIS is functional (key functions as originally intended) but is not operational
i.e. is not in use. The system is technically functional for many operations. Most basic functions such as entering
and editing data, generating analysis and outputting results are possible, despite a few bugs.
Despite a large-scale roll out of training (to over 300 woredas) we have not identified any significant use of the
system. A telephone survey in September 2015 of 24 regional, zonal and woreda offices found that all (24/24
respondents) had knowledge of the database, and had received training but no respondent (0/24) reported using
the MIS. These findings are consistent with earlier regional visits. The database contains only 2010/11 NWI data

ONEWASH INCEPTION REPORT VOL. 1 (TASKS 1 AND 3)
ONEWASH – OCTOBER 2015 11
that has been manually imported and new data is not being entered. The hardware and training roll-out has not yet
led to use of the system.
In its current status, the WaSH M&E MIS does not meet the minimum requirements considered necessary for
operationalization, for example training and other support activities will not lead to widespread use of the system.
Our assessment identifies significant technical and operational challenges with the system and the testing
processes that have been undertaken have not been sufficient to ensure that the system met user requirements
and capabilities. Critically the software is not user friendly (easy to use, meaning it is not difficult to learn or
understand, and that it is simple, clean, intuitive and reliable), and has limited flexibility without recourse to
reprogramming work by the developers. Changes such as adding a new question, changing a calculation, or
revising a spelling mistake, requires a contract with the developers or else a significant change in the capacity of
the ministry to manage the software. This is challenging given that it is now necessary to fully update the indicators
with new requirements such as revised GTP2 indicators, and internationally the new Sustainable Development
Goals (SDGs).
Details of recommended improvements to the WaSH M&E MIS (PUT) together with activities to develop alternative
solutions are included in this report (section 2.1.1). Operationalisation of the WaSH M&E MIS will require extensive
capacity development and activities promoting dissemination and use of data.
1.2.6 Introduction of ICT: at an early stage across WaSH sectors
The introduction of Information and Communications Technologies (ICT) to support M&E across the WaSH sectors
is at an early stage. The Health and Education reporting systems are largely paper-based (data becomes digital at
woreda level in the HMIS and at regional level in the EMIS). There is no use at scale of internet and mobile
communications technologies within these systems although pilots are underway with mobile data collection
technologies in the health sector.
IBEX is a series of standalone databases at regional level and is not networked. Data is sent to federal level by
hardcopy official letter and sometimes by email. There is some variation in regions with data entry being done at
woreda levels where infrastructure is better. Currently at federal level it is only possible to access consolidated
regional data, so analysis possibilities are limited (Prat, et al. 2014). It is only possible to access woreda level data
at the regional or lower levels. Data is re-entered at federal level. When IBEX is networked, starting now in Tigray,
woreda level data will be available up to federal level. Staff may also be able to dedicate more time to data analysis
rather than data entry.
The water sector has not yet linked its routine reporting systems to an operational MIS system, but has made
significant progress in establishing a nationwide inventory of the main sector assets. In 2014, the Somali part of this
inventory successfully used mobile data collection tools at regional scale. It was possible to collect data from all
water supply schemes and institutional WaSH facilities within approximately one month across a large and
relatively remote region. MoWIE with the regional bureaus and supported by UNICEF, used Akvo FLOW as the
mobile data collection tool. The Akvo FLOW platform combines a mobile app that uses Android for data collection
with a web-based administrative dashboard where surveys can be created and assigned to phones and where data
can be downloaded and edited to some extent. Lack of internet connectivity will be overcome through having
criteria whereby the software will allow uploading of data from phones using data cable and not requiring internet
connectivity. Our system designs and our approach for the rollout address the connectivity issue and we have
continually tried to design processes which take maximum benefit of the limited infrastructure.
Key findings of the mobile-enabled exercise in Somali were that data could be collected much faster and more
reliably than using paper based systems (GPS data entry was especially prone to errors earlier). These are the
major advantages rather than cost savings. Going forward, costs will also strongly depend on whether data
collection is intended to be part of a monitoring system (with on-going use of phones) rather than as a one-off
exercise.
There is considerable ICT-related innovation in monitoring within bilateral programmes, projects and NGOs. Multi-
level pilots such as those supported by COWASH/CMP, ICRC (Tigray), WaterAid and others show potential, and
each provide important lessons on how to roll out nationally decentralised but coordinated WaSH M&E systems.
1.2.7 Quality assurance and control: limited practice of data control, validation and triangulation
There is little practice of validating data or triangulating data derived from different sources in the OWNP sectors. In
the health sector for example the HMIS includes data quality management mechanisms (Lotus Quality Survey &
ONEWASH INCEPTION REPORT VOL. 1 (TASKS 1 AND 3)
ONEWASH – OCTOBER 2015 12
Data Quality Survey) but these are not implemented effectively and there is no systematic process in place to verify
Hygiene & Environmental Health data (Jones, 2015). Although it has been used (see section 1.2.4), there are
concerns about the quality of National WaSH Inventory (2010/11) data (for example with errors in geographic
coordinates) and the validation processes. The unreliability of geographic coordinates is a particular limitation to
the utility of the data. Data quality improved considerably through deployment of mobile data collection technology
in Somali in 2014. However, beyond official approvals we are not aware of any systematic and analytical quality
assurance (e.g. to check and verify a sample of the data).
There has been to date relatively little systematic use of nationally representative household surveys undertaken by
the Central Statistical Agency or impact evaluations and other special studies and research. Such sources can
provide alternative data for triangulation or to fill gaps. Quality could be improved and money saved by making use
of a range of different data sources especially those that are well suited to monitoring critical issues such as
tracking equity and gender impacts of the OWNP.
1.2.8 Strong demand for data but use is generally neglected
There is strong demand for data at all levels. However, much data is not fully utilised because it is not made
accessible, because insufficient resources are allocated to data analysis, dissemination and use compared to data
collection or because incentives are lacking. The NWI is an example where much wider use of data could have
been made through publication (e.g. of a WaSH atlas) and providing sector stakeholders more access to the data.
The diagnostic review findings indicate that there is relatively little knowledge about the data available within the
OWNP partner ministries, the Central Statistical Agency or the National WaSH Inventory and/or sharing of relevant
information across ministries. There was also considerable duplication in the data collected as part of the (to date
one-off) NWI and that collected by other ministries such as the Ministry of Health (MoH) and the Ministry of
Education (MoE). There is potential to improve M&E and reduce costs through making wider use of existing data,
and scarce resources could be put to further use to improve rather than duplicate such data.
Most recent WaSH M&E efforts that were assessed have not yet succeeded in making a clear link between the
decisions that need to be taken and the data needed. There is a tendency (a) to collect excessive data, (b) to
inadequately use existing data, (c) to have an absence or lack of capacity and systems to analyse, interpret and
respond to data collected at the appropriate levels, in particular at the woreda level, and (d) to have weak standard
processes, forms and procedures for using data. These are also common problems that are found elsewhere,
especially in low capacity contexts. Although other factors are also at play a critical issue is low capacity including a
lack of skills, and addressing the capacity gaps in WaSH M&E has received insufficient structured support to date.
The plans presented later in the report aim to address all of these issues.
1.2.9 Capacity constraints: many and severe requiring a broad approach to capacity development
Further to the constraints facing inter-sectoral collaboration and coordination, as already discussed above (and in
themselves a critical capacity issue), there are critical constraints with respect to Human Resources Development
(HRD), resourcing more broadly including the physical and logistic resources needed to do M&E tasks, and the
current supply of training and broader capacity building support.
With respect to Human Resources Development (HRD), M&E is perceived to have a lower priority than other core
processes, and M&E staffing and training is not prioritised. There is high turnover of staff; numerous vacant
positions (managerial, technical, expert and support) related to WaSH M&E; insufficient incentives or motivation;
limited or no financial resources and opportunities to build staff M&E capacity; low levels of skills in M&E and IT.
There is relatively better capacity in health and education M&E, but WaSH is not a focus or core competence in
these sectors.
Policy knowledge is generally weak within the WaSH sectors. There is limited understanding of national policies,
strategies and targets and their local relevance at regional, zonal and woreda levels, including about the OWNP,
the MoU and the division of mandates, roles and functions of different stakeholders.
Resource gaps (physical, financial and human) between regions and woredas are also significant. Two regions,
Tigray and Amhara, are mobilising kebele level water staffing and bringing the water supply sector into a position
more similar to the health and education sectors. Woredas with larger donor investments (such as those now
receiving CWA funds which makes provision for capacity building) have generally higher capacity and are better
equipped. Physical capacity relevant to M&E includes equipment and transport logistics. Although considerable ICT
equipment is available at regional level, its use is hindered by a significant shortage of skills to manage and use it
ONEWASH INCEPTION REPORT VOL. 1 (TASKS 1 AND 3)
ONEWASH – OCTOBER 2015 13
effectively. A lack of ICT facilities and equipment is notable from woreda level downwards. There are clear IT skills
and systems constraints at all levels. Lack of transport facilities further hinders both M&E and collaborative efforts.
Although the health sector has the strongest of the WaSH sector monitoring systems, there is high turnover of
HMIS experts who focus on capturing rather than interpreting or responding to WaSH data. There is also a lack of
senior technical and middle management staff in the Planning and Programme departments. Health extension
workers have been deployed to towns in recent years and inadequate teaching materials and facilities and a lack of
training in waste management technologies have been noted. Limited knowledge of sanitation and hygiene
significantly impacts on health staff’s ability to gather and analyse monitoring data and to compile accurate reports.
Similarly, education departments are primarily concerned with education-related targets, and the positive
correlation between improved WaSH and achieving education targets is not foregrounded.
On the supply side, TVETCs and HSCs train water technicians and health officers with M&E related content but
overall training supply is ad-hoc and there is a lack of continuity in training courses and no central coordinating
body. There is also no system to monitor the efficacy or impact of training. The MoWIE Capacity Building Unit is not
yet fully functional.
Training on WaSH M&E is very limited, and where training exists it is on M&E generally and theoretically, plus
there is a general bias towards water over sanitation and hygiene monitoring. Courses also tend to be one-off
without a system in place to update training when M&E systems are updated in keeping with sector changes. The
M&E support provided will work to address these challenges, which are critical, and a work package is dedicated to
this issue (see Capacity Development Section 4.3).
Training materials are usually not available in local languages and are either not provided or not commensurate
with the level of trainee groups. The availability of training materials after completing training courses is a key issue
given the high turnover and attrition of M&E and sector personnel.
1.3 Structure and key definitions
The remaining sections of this report present the following:
Enhanced M&E Framework – this framework sets out proposals for what OWNP M&E will measure,
including proposals for harmonisation and updating of indicators in line with GTP2 requirements, and the
approaches that together form an overall OWNP M&E system.
Enhanced OWNP Management Information Systems – is the design of integrated MIS systems for the
OWNP building upon existing systems, filling gaps and IT-enabling. The design addresses the people
(capacity), processes (from data collection through to dissemination and use of data) and the systems (IT)
that will be needed to realise implementation of the framework.
Operational Plan – presents a phased work plan (2015-19) to operationalise OWNP MIS including four
workpackges related to enhancement/ operationalisation, capacity building, dissemination and use and
synergy, and four sub-plans relating to procurement of IT, the National WaSH inventory, data quality
assurance and sustainability (exit plan).
Cost Estimates – set out the costs of implementation of the operational plan.
1.3.1 Comments on interpretation and reading of this report (key definitions)
The ‘programme’ refers to the One WaSH National Programme which covers the entire country and
covers all WaSH activities throughout the country.
Consolidation WaSH Account (CWA) refers to the part of the OWNP that is implemented through the
pooled financing arrangement and its related management structures and processes. Currently the CWA
arrangements are still considered by many as being synonymous with One WaSH or the One WaSH
project.
Implementing partners are the core government partners that deliver the OWNP and its on-going WaSH
services. These are the three sector ministries MoWIE, MoH, MoE and MoFED and the related regional,
zonal, woreda and lower level structures. Each of these institutions has existing M&E processes, capacities
and systems.

ONEWASH INCEPTION REPORT VOL. 1 (TASKS 1 AND 3)
ONEWASH – OCTOBER 2015 14
Implementing partner MIS systems refers to the MIS systems (HMIS, EMIS and IBEX) within the
implementing partners. The water supply sector does not yet have an operational MIS system although a
WaSH M&E MIS with water supply components has been built.
The ‘WaSH sectors’ or ‘sectors’ refers to the combination of water (with its component responsibility for
water supply), health (responsible for hygiene and sanitation), education (responsible for WaSH in schools)
and finance sectors, in line with the MoU and the way that government is organised.
Capacity development is defined broadly and refers to the systems, skills, knowledge, information, tools,
and human, financial and logistical resources required for people to undertake particular tasks, roles or
mandates. Training refers to formal or informal activities aimed at developing the skills, knowledge and
competencies identified as necessary to undertake particular tasks, roles or mandates.
Monitoring is defined as the routine collection of data in order to track progress toward objectives
Evaluation is defined as analysis that measures the extent to which the programme (and not other causes)
have led to observed progress
2 Enhanced OWNP M&E Framework The key elements of the enhanced M&E Framework are a set of indicators (with associated definitions and targets
and related goals) that OWNP M&E will track, and a set of recommended data sources on how these will be
monitored. The framework also sets out further detail on the related processes including an outline calendar for
implementation of OWNP M&E with links to the critical processes for data collection, dissemination and use.
The system in the WaSH M&E Framework and Manual Version 1.0 has not been fully implemented. Given that it
was prepared before the critical documents that have defined the OWNP (OWNP programme document, WIF and
POM etc.) it is partly outdated. However, many of its key elements remain valid and have been retained in the
implementation plan proposed in this document.
While this report was being prepared, the government has been elaborating its critical integrated plan for the period
2016-2020. The Second Growth and Transformation Plan (GTP2) has major implications for M&E in the water
supply sector (FDRE, 2015) and potentially the other WaSH sectors, although health and education plans were not
yet available at the time of writing.
Questions have been formulated to frame the critical challenges in enhancing the M&E framework based on the
findings of the diagnostic review (Coffey/ IRC, 2015) as summarised in section 2.1. These are presented in the next
section.
2.1 Overview
2.1.1 Strategic aspects and approach to OWNP M&E
A number of critical strategic questions for the enhanced M&E framework and its related processes, systems and
capacities have been considered during the inception phase. This section identifies the critical questions that have
been addressed and provides an overview of the strategic directions that are recommended and proposed for the
implementation phase.
How to streamline the numerous sets of WaSH targets, indicators and different definitions?
An expanding set of WaSH policy documents has established many new or amended targets and several different
indicator sets are available. It is also common that indicators are differently defined. For example, in water supply
alone there are indicators set out in the WaSH M&E Framework and Manual (FDRE, 2008), in the National WaSH
Inventory (MoWIE, 2010), in the OWNP programme document (2013), in the Program Operational Manual (POM)
for the CWA (FDRE, 2014) and in the (draft) water component of the Second Growth and Transformation Plan
(FDRE, 2015). The lack of coherence between targets, indicators and definitions in rural sanitation and hygiene
has also been carefully documented (Jones, 2015).
An updated set of draft WaSH indicators is proposed in this document. These are proposals and will require
amendment and agreement by the implementing partners. It is also recognised that indicator development is a
continuous process, and an annual review of indicators by the sector is proposed led by the NWCO as part of the
implementation plan. For example, a new urban sanitation strategy is under development and it may soon be
ONEWASH INCEPTION REPORT VOL. 1 (TASKS 1 AND 3)
ONEWASH – OCTOBER 2015 15
agreed that additional indicators are required to track aspects of urban sanitation. Sufficient consistency should
however be maintained to avoid tracking ‘moving targets’.
We have made extensive proposals to consolidate and revise water supply indicators. In water supply, the
proposed updated indicators in this document give primacy to the new (draft) GTP2 indicators and definitions.
Other indicators have been derived from indicators proposed or assessed to be required by the OWNP (KPIs and
results framework), key CWA policies including the POM, the OWNP Social Assessment, the Environmental and
Social Management Framework (ESMF) and the Resettlement Policy Framework, as well as the M&E framework
and manual. The updated process has aimed to avoid duplication of indicators and has given priority to the more
recently approved indicators and/or definitions.
In sanitation and hygiene, indicators are based on the updated indicators in the Health MIS (Federal Ministry of
Health, 2014) and include proposals for additional indicators based upon circulated proposals of the Hygiene and
Environmental Health department which is currently engaged in a strategy development process (so these are draft
indicators). Provisional indicators in urban sanitation are based upon the contents of the draft Urban Sanitation
Strategy (FDRE, 2015b).
We have prioritised indicators in three categories identifying 1) an updated set of possible KPIs, 2) supplementary
indicators and 3) other indicators.
The dynamic nature of WaSH policy making means that indicators need to frequently change. It is recommended
that systems build in the flexibility to allow for the simple modification or addition of new indicators. Where
indicators are added (e.g. for regions to address specific requirements) these should be approved or standardised
wherever possible and included in updated indicator lists and manuals.
How best to establish integrated reporting and the use of WaSH data across all WaSH sectors?
During the inception phase, four alternative options were developed setting out different possibilities for WaSH data
sources and their processing to support integrated reporting. The four options included:
1. Using existing sectoral MIS systems (health, education and finance) and operationalising a water supply MIS to
support water supply data management (both regular reporting and asset inventory data), together with
integrated OWNP reports produced at all levels (woreda, town, zone, regional, federal).
2. Using existing sectoral MIS systems (health, education and finance) to collect data from local levels and
operationalising a WaSH MIS to both support water supply data management (regular reporting and asset
inventory) and to provide access to WaSH data at all levels to support production of integrated OWNP reports
(woreda, town, zone, and regional, federal). Health, education and finance sector data is imported at federal
level and made available at all levels (for examples, regions, zones and woredas).
3. As option 2 but with data tapped from sectoral MIS systems at woreda level for entry into the WaSH MIS.
4. Integrated data collection through an annual National WaSH Inventory.
With each of the options 1-3 the National WaSH Inventory is envisaged as a 5 yearly exercise.
The recommended option, with agreement of all key stakeholders at the workshop on 22nd September, 2015, was
to implement option 2, with option 3 being a desired long-term objective for a later phase of M&E enhancement.
This includes operationalisation of a WaSH M&E MIS to include water supply data, but also to hold data on
household sanitation and hygiene and institutional WaSH. Using the same indicators and definitions, regular data
will be derived from the same quarterly and annual data collection processes that feed HMIS/HEH programme
monitoring, EMIS and IBEX systems as well as water supply data collection and reporting by kebele, woreda and
urban water supply utilities in towns.
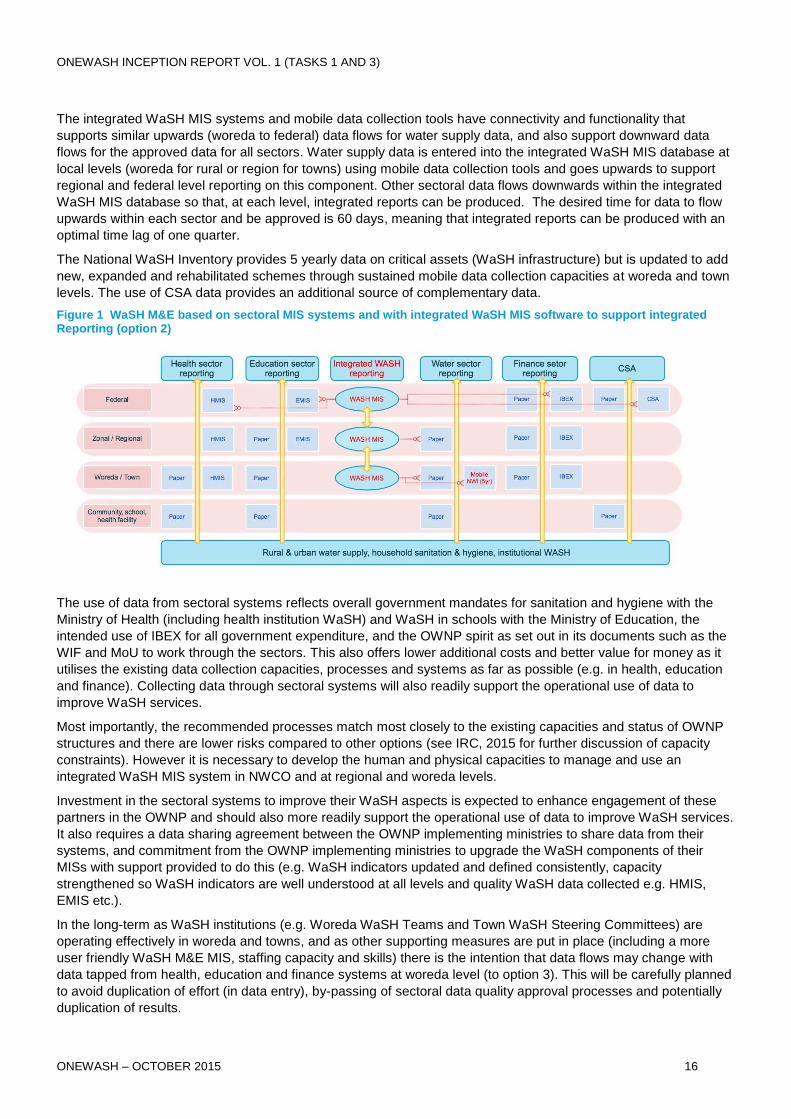
Figure 1 summarises the approach (option 2) further. As well as holding water supply data, the integrated WaSH
MIS database stores data from other sectoral systems, accessed through data exchange at federal level between
OWNP partners. These systems are harmonised wherever possible to ensure indicators and units of data
collection are compatible.
All data is collected at local levels and flows upwards to woredas, zones, regions and the national level through
sectoral channels (health, education, water and finance). In health, education and finance sectors these data flows
are supported by the existing approval processes of the HMIS, EMIS and IBEX systems.
ONEWASH INCEPTION REPORT VOL. 1 (TASKS 1 AND 3)
ONEWASH – OCTOBER 2015 16
The integrated WaSH MIS systems and mobile data collection tools have connectivity and functionality that
supports similar upwards (woreda to federal) data flows for water supply data, and also support downward data
flows for the approved data for all sectors. Water supply data is entered into the integrated WaSH MIS database at
local levels (woreda for rural or region for towns) using mobile data collection tools and goes upwards to support
regional and federal level reporting on this component. Other sectoral data flows downwards within the integrated
WaSH MIS database so that, at each level, integrated reports can be produced. The desired time for data to flow
upwards within each sector and be approved is 60 days, meaning that integrated reports can be produced with an
optimal time lag of one quarter.
The National WaSH Inventory provides 5 yearly data on critical assets (WaSH infrastructure) but is updated to add
new, expanded and rehabilitated schemes through sustained mobile data collection capacities at woreda and town
levels. The use of CSA data provides an additional source of complementary data.
Figure 1 WaSH M&E based on sectoral MIS systems and with integrated WaSH MIS software to support integrated Reporting (option 2)
The use of data from sectoral systems reflects overall government mandates for sanitation and hygiene with the
Ministry of Health (including health institution WaSH) and WaSH in schools with the Ministry of Education, the
intended use of IBEX for all government expenditure, and the OWNP spirit as set out in its documents such as the
WIF and MoU to work through the sectors. This also offers lower additional costs and better value for money as it
utilises the existing data collection capacities, processes and systems as far as possible (e.g. in health, education
and finance). Collecting data through sectoral systems will also readily support the operational use of data to
improve WaSH services.
Most importantly, the recommended processes match most closely to the existing capacities and status of OWNP
structures and there are lower risks compared to other options (see IRC, 2015 for further discussion of capacity
constraints). However it is necessary to develop the human and physical capacities to manage and use an
integrated WaSH MIS system in NWCO and at regional and woreda levels.
Investment in the sectoral systems to improve their WaSH aspects is expected to enhance engagement of these
partners in the OWNP and should also more readily support the operational use of data to improve WaSH services.
It also requires a data sharing agreement between the OWNP implementing ministries to share data from their
systems, and commitment from the OWNP implementing ministries to upgrade the WaSH components of their
MISs with support provided to do this (e.g. WaSH indicators updated and defined consistently, capacity
strengthened so WaSH indicators are well understood at all levels and quality WaSH data collected e.g. HMIS,
EMIS etc.).
In the long-term as WaSH institutions (e.g. Woreda WaSH Teams and Town WaSH Steering Committees) are
operating effectively in woreda and towns, and as other supporting measures are put in place (including a more
user friendly WaSH M&E MIS, staffing capacity and skills) there is the intention that data flows may change with
data tapped from health, education and finance systems at woreda level (to option 3). This will be carefully planned
to avoid duplication of effort (in data entry), by-passing of sectoral data quality approval processes and potentially
duplication of results.
ONEWASH INCEPTION REPORT VOL. 1 (TASKS 1 AND 3)
ONEWASH – OCTOBER 2015 17
Integrated WaSH reporting is undertaken at each level (i.e. woreda WaSH teams, town WaSH teams, regional
WaSH coordination offices, NWCO). At federal level it is proposed that a reporting team led by NWCO works with
data drawn from the integrated WaSH M&E MIS database and staff from the sectors to produce a comprehensive
flagship OWNP annual report. Similar but lighter reporting processes are envisaged at regional and woreda levels
in line with demand and capacities at these levels.
Well-functioning WaSH institutions are required to lead production of integrated reports at federal and other levels.
This will require capacity development of the NWCO and delegated staff from the implementing ministries to
produce the annual report (and similar efforts at regional and woreda levels).
Apart from integrated reports, data use is to be promoted through an intervention package on dissemination and
use that focuses on ensuring the use of data at local levels to improve service delivery as well as promoting use
within each of the OWNP sub-sectors.
How to further operationalise the WaSH M&E MIS (PUT) system and maximise its potential
The OWNP M&E system requires a redevelopment or replacement of the existing WaSH M&E MIS software. The
recommended approach, which has been agreed with the MoWIE and NWCO on 22nd September, 2015 is to build
on the development of the existing WaSH M&E MIS (PUT) software to make it operational with reduced scope,
while MoWIE/NWCO also require the development of an alternative software in order to reduce risks and provide
an alternative option for future development. This will involve:
Retaining and improving the existing WaSH M&E MIS but with a more focused scope in line with the
revised data flows that are now envisaged. The recommendation is to focus on operationalising as a
priority the database and reporting functionality. Since water supply (and NWI) data will be collected
through mobile applications and other health, education and finance data is tapped at federal levels
through sectoral systems, there is no requirement to operationalise data entry functions at woreda level
using the WaSH M&E MIS.
Implementation of improvements will require a new contract with the developers PUT to modify the WaSH
M&E MIS in line with specifications detailed in his report.
To purchase the WaSH M&E source code from the developers PUT subject to cost and audit (before
purchase) to assess the options for long term use of the software and the potential for maintenance and
modifications by the MoWIE IT department as well as the level of required reliance on either PUT or other
software developers.
To develop separate but compatible mobile data collection capabilities through the procurement and
customisation of ‘off the shelf’ software to support NWI2 data collection to be completed this Ethiopian
fiscal year (ending July 2016).
To develop alternative database and analytical software capacities within the MoWIE/ NWCO to provide an
additional option to store, process, approve, and analyse WaSH data. Alternative software will be procured
if possible at the same time as mobile data collection software (and with source code that is open for
modification and accessible).
How to ensure regular water supply sector reporting within a standard national system?
The OWNP M&E system with respect to water supply includes combining strengthened regular reporting (quarterly-
annual frequency) together within regular but occasional (e.g. 5 yearly frequency) inventory of infrastructure assets
(the NWI). The NWI was previously undertaken in 2010/11 so undertaking data collection for the NWI2 in 2016 will
be consistent with a 5 year cycle.
Reporting and inventory processes are both already in place and can be strengthened through improvement of
indicators and enhancement of capacities as well as through supporting ICTs. The use of mobile data collection
tools will also be an integral part of the NWI2, with mobile technologies then embedded for use to update the
inventory in all woredas and towns. As well as adding new (and rehabilitated or extended) facilities into the
inventory, it is recommended that current water supply paper-based reporting is gradually migrated through
additional forms using the same mobile application and phones. The objective is to phase out paper-based
reporting as the capacities are put in place to do this digitally. Paper-based reporting systems will be improved
while waiting for the deployment of mobile technologies through NWI2.
ONEWASH INCEPTION REPORT VOL. 1 (TASKS 1 AND 3)
ONEWASH – OCTOBER 2015 18
The water supply sub-sector needs to enhance its monitoring without having yet the same levels of capacity as
other WaSH sectors. Only now is kebele level staffing being rolled out in Tigray and Amhara for example, and the
sector does not have the same institutionalised M&E/MIS capacity as in the health and education sectors. A
phased process of development is recommended making it possible to introduce regular kebele-level reporting
where capacities are lower (minimum for all regions/ woredas by 2016) with capacity development to enable all
regions to adopt infrastructure level (i.e. water point) monitoring systems by the end of 2018.
How to ensure data within OWNP MISs is widely and effectively used?
Use of data from the OWNP M&E system is intended to justify further investments in improving and maintaining
M&E systems. Promoting use of data will:
Start by focusing on promoting local level data use in operational responses (e.g. repairs to non-functional
water schemes).
Involve activities within all WaSH sectors as well as promoting the integrated use of data at different levels
to strengthen cross-sectoral collaboration in WaSH.
Include streamlining reporting processes and improving MIS reports to ensure that these systems generate
the reports that are required in the correct formats (refer to section 4.7).
2.1.2 Key features of OWNP M&E
The framework developed will support monitoring of all indicators required within the framework of GTP2, the
OWNP and the activities funded through the CWA which are an important priority. The processes and systems
recommended are also designed with the flexibility and capacity to include indicators required by other critical
components of the OWNP regardless of the funding channel.
The implementation approach proposed for water supply does not include continuous frequent monitoring on a
water point/system (infrastructure basis) from the outset in all regions although the ICT systems will support his.
Although there is water point mapping (for rural areas) in the NWI2, it not considered feasible for quarterly reporting
in all regions to update KPIs on a water point basis. Initially kebele level reporting will be a minimum option with
infrastructure level reporting adopted as capacities are developed.
Kebele level reporting is well suited to tracking the KPIs but is not well suited to tracking large numbers of
supplementary indicators including indicators relating to environmental and social risks and resettlement. This
approach is a pragmatic compromise to rapidly realise some monitoring and reporting in line with low capacities,
while those capacities are developed and more sophisticated systems and processes introduced.
The proposed indicator framework includes indicators covering all the KPIs and other indicators in the existing
OWNP results framework.
One further gap at this stage is that there is not an agreed approach to monitor household-led self-supply
investments and this issue requires further work and agreement.
2.2 Design Considerations of Enhanced M&E Framework
The design of the enhanced M&E framework has been based upon the following design choices:
To promote a balance between three key components in WaSH M&E: 1) People, 2) Processes, and 3)
(ICT) Systems. The design takes into account:
• The existing levels of capacity available within WaSH institutions (people).
• The requirements of planning, reporting and decision-making processes to use data and builds
on existing reporting practices (processes).
• The use of ICT in management information systems (systems) to support reporting processes.
To maximise use of existing sectoral data collection systems and to improve the WaSH indicator reporting
within these systems.
To build upon the National WaSH Inventory as undertaken in 2010/11 and 2014 (Somali) as an integrated
data collection exercise to support WaSH M&E.
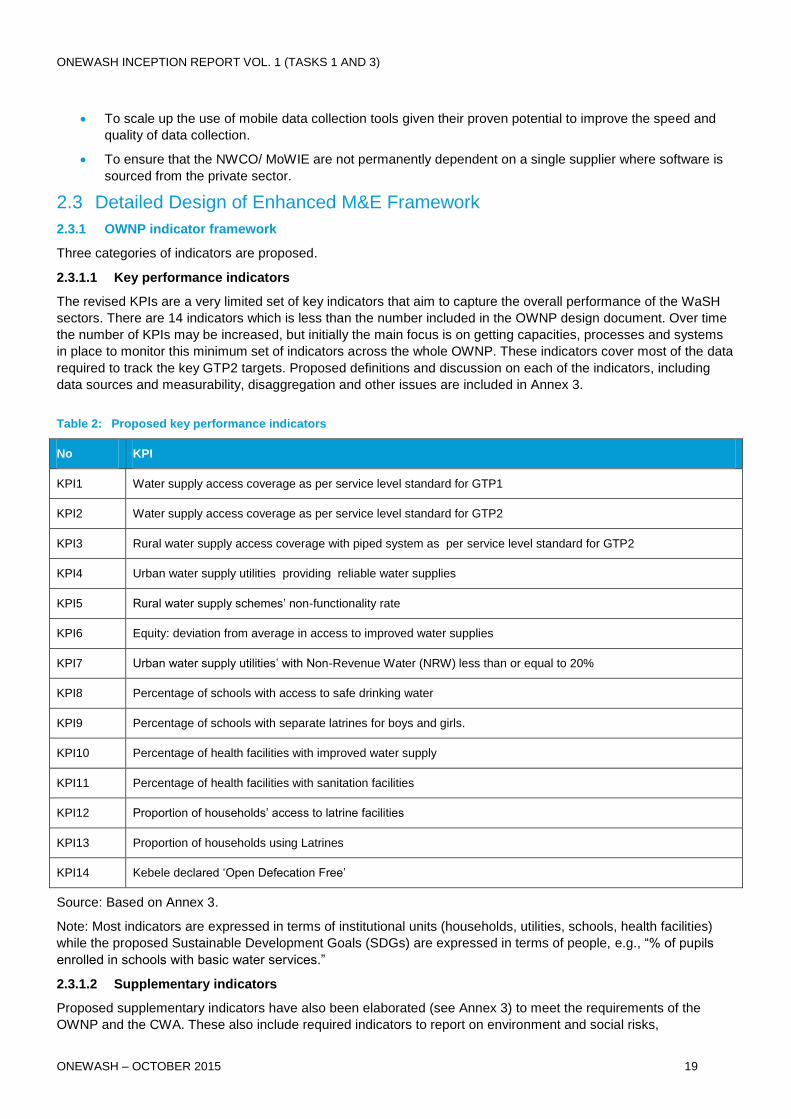
ONEWASH INCEPTION REPORT VOL. 1 (TASKS 1 AND 3)
ONEWASH – OCTOBER 2015 19
To scale up the use of mobile data collection tools given their proven potential to improve the speed and
quality of data collection.
To ensure that the NWCO/ MoWIE are not permanently dependent on a single supplier where software is
sourced from the private sector.
2.3 Detailed Design of Enhanced M&E Framework
2.3.1 OWNP indicator framework
Three categories of indicators are proposed.
2.3.1.1 Key performance indicators
The revised KPIs are a very limited set of key indicators that aim to capture the overall performance of the WaSH
sectors. There are 14 indicators which is less than the number included in the OWNP design document. Over time
the number of KPIs may be increased, but initially the main focus is on getting capacities, processes and systems
in place to monitor this minimum set of indicators across the whole OWNP. These indicators cover most of the data
required to track the key GTP2 targets. Proposed definitions and discussion on each of the indicators, including
data sources and measurability, disaggregation and other issues are included in Annex 3.
Table 2: Proposed key performance indicators
No KPI
KPI1 Water supply access coverage as per service level standard for GTP1
KPI2 Water supply access coverage as per service level standard for GTP2
KPI3 Rural water supply access coverage with piped system as per service level standard for GTP2
KPI4 Urban water supply utilities providing reliable water supplies
KPI5 Rural water supply schemes’ non-functionality rate
KPI6 Equity: deviation from average in access to improved water supplies
KPI7 Urban water supply utilities’ with Non-Revenue Water (NRW) less than or equal to 20%
KPI8 Percentage of schools with access to safe drinking water
KPI9 Percentage of schools with separate latrines for boys and girls.
KPI10 Percentage of health facilities with improved water supply
KPI11 Percentage of health facilities with sanitation facilities
KPI12 Proportion of households’ access to latrine facilities
KPI13 Proportion of households using Latrines
KPI14 Kebele declared ‘Open Defecation Free’
Source: Based on Annex 3.
Note: Most indicators are expressed in terms of institutional units (households, utilities, schools, health facilities)
while the proposed Sustainable Development Goals (SDGs) are expressed in terms of people, e.g., “% of pupils
enrolled in schools with basic water services.”
2.3.1.2 Supplementary indicators
Proposed supplementary indicators have also been elaborated (see Annex 3) to meet the requirements of the
OWNP and the CWA. These also include required indicators to report on environment and social risks,
ONEWASH INCEPTION REPORT VOL. 1 (TASKS 1 AND 3)
ONEWASH – OCTOBER 2015 20
resettlement and fiduciary aspects. These indicators are also standardised nationally. In annex 3, 78 updated
supplementary indicators have been proposed.
2.3.1.3 Other indicators
This category of indicators has not been further elaborated at this stage. The category is included to highlight that
other programmes will require other data and will develop further indicators. Regions will likely wish to expand data
collection to cover indicators that are of regional priority (e.g. with respect to livestock and agriculture). An indicator
review process is proposed so that wherever possible these other indicators are known, approved and where
possible standardised with approved definitions.
2.3.2 Data sources
It is proposed for OWNP M&E to make use of four main sources of data described in the following sub-sections.
2.3.2.1 Regular sector monitoring and reporting
Regular sector monitoring and reporting involves data collection on quarterly to annual cycles for indicators defined
by the WaSH sectors and supported by their Management Information Systems.
Water: The water sector does not yet have a national MIS system. A national MIS will be operationalised with data
derived from existing (quarterly) reporting processes and the National WaSH Inventory. New Information and
Communication Technologies (ICT) will be introduced to capture current paper-based reporting and to improve the
speed and quality of data collected and support updating.
Health: The Health MIS (HMIS) is an established national monitoring system that includes some key sanitation
and hygiene indicators. Data on additional sanitation and indicators is also collected through the Health and
Environmental Hygiene program monitoring systems (refer to Annex 3).
Education: The Education MIS (EMIS) is also an established national monitoring system with indicators included
on WaSH in Schools.
Finance: IBEX is the national system for managing government financial expenditure. Due to the many and
complex financing channels in WaSH it only tracks a part of total WaSH expenditure including the CWA
component. It is intended for use with respect to all channel 1 and 2 expenditure2. Increased and improved use of
IBEX will be promoted, with additional surveys used to estimate total WaSH expenditure (including channel 3
expenditure).
2.3.2.2 National WaSH Inventory
The NWI will complement sector data providing occasional (every 5 years is proposed as the data collection
frequency) inventory of WaSH infrastructure assets. NWI data is both a source of triangulation for KPIs, and
potentially a source of data for additional indicators that are not included in regular reporting.
2.3.2.3 Additional sector monitoring studies
The OWNP is implementing its own impact evaluation which will include nationally representative household
surveys to establish a baseline, mid-line and end-line. This is viewed as a component part of the OWNP M&E
system and will include collecting additional data (for example on some indicators that are not included and cannot
be easily included in the regular reporting or NWI).
Other studies are regularly undertaken across the WaSH sectors by government, development partners and the
national and international academic communities. These include sustainability checks and behaviour change
studies (focusing on sanitation and hygiene for example) which are undertaken periodically to provide more in-
depth understanding on some of the more complex issues that the WaSH sectors face. These studies can be used
to fill gaps in OWNP M&E and a coordinated process to review and use such sources is proposed.
2.3.2.4 Nationally-representative household survey (CSA) data
Household survey data provides complementary data that emphasises the use of water, sanitation and hygiene
facilities. Such data is used by the JMP internationally to develop its global reports but is relatively under-utilised
within government WaSH reporting. Being focused on use at the household level, this data is well suited to analysis
2 Channel 1a involves public finance from government treasury, Channel 1b is on-budget development assistance, Channel 2 is bilateral
funding)
ONEWASH INCEPTION REPORT VOL. 1 (TASKS 1 AND 3)
ONEWASH – OCTOBER 2015 21
focused on questions of equity (although generally not questions of intra-household equity, gender issues etc.). It is
proposed that wider use is made of household survey data to fill some of the gaps left by sector provider data, and
for triangulation purposes.
2.4 Tracking Risks using the Enhanced M&E Framework
The OWNP through its CWA financing is introducing new mechanisms to anticipate and mitigate environmental
and social risks with respect to development of water and sanitation systems, including new procedures to manage
resettlement where this is required. The enhanced OWNP M&E Framework includes indicators to support the
implementation of these provisions.
2.4.1 Tracking Environmental and Social Risks
Although Water, Sanitation and Hygiene related interventions are expected to have broadly positive environmental
and social impacts, there is the potential for adverse impacts on both people and the environment. The CWA’s
Program Operational Manual (POM) establishes an environmental and social screening process to identify the
potential for adverse impacts and to trigger appropriate follow up. This is further explained in the Environmental
and Social Management Framework (ESMF) (FDRE, 2013b).
The following proposed standard indicators are included in the OWNP M&E framework (as supplementary
indicators) to support tracking of risks in line with the ESMF. It is anticipated that data on these indicators will
initially be collected and reported in CWA-funded woredas but with the potential for such tracking to be extended to
other financing channels as required.
Percentage of schemes with completed environment and social screening process.
Percentage of schemes assigned to each environmental and social screening category (A, major adverse
impacts; B1, potential adverse impacts requiring mitigation measures as specified in the Environmental and
Social Management Framework; B2, further environmental and social impact assessment (ESIA) required
and a specific Environmental and Social Management Plan; C, no significant issues).
Percentage of B1 schemes with public consultation completed and reported.
Percentage of B2 schemes with completed ESIA and ESMP and public consultation completed and
reported.
These data will be collected by RWCO/PMUs on an annual basis. Inclusion of the indicators will support the
preparation of the annual environmental monitoring report to be prepared at regional level as part of CWA-funded
implementation.
Tools for climate screening such as those being piloted by COWASH have the potential to further enhance
environmental screening and source protection.
2.4.2 Tracking exclusion risks
There is a risk that “focusing policies and programmes on broad-based understandings of underserved regions,
populations and vulnerable groups will lead to overlooking inequalities between individuals within these regions,
populations and groups” (Brocklesby, 2013). The social assessment undertaken as part of the development of the
OWNP highlights large variations between woredas in the same region and between kebeles in the same woreda
due to a “complex mix of environmental, social and institutional factors”. It distinguishes between vertical
inequalities within populations and groups (e.g. pastoralist communities, children, and kebeles within woredas) and
horizontal inequalities between populations and groups (e.g. rural-urban populations), and recommends a focus on
the vertical differences within underserved populations and vulnerable groups to better address the different needs
amongst people who are under-served and to better target interventions. The report also finds that the “current
sector data collection and monitoring system for the WaSH sector has yet to consider the full range of vertical
differences within underserved populations and vulnerable groups. It does not capture coverage, access and use
data below the household level. There is limited data on differential access and use by age, gender and disability.”
The report also flags the importance of cost of services to poor households with affordability being an important
reason why many resort to unimproved sources.
OWNP M&E will specifically address these issues through:

ONEWASH INCEPTION REPORT VOL. 1 (TASKS 1 AND 3)
ONEWASH – OCTOBER 2015 22
The OWNP impact evaluation which includes household surveys with questions focused on sub-household
issues related to gender, disability, age in accessing WaSH services, and an approach that views the
impact evaluation as an integral part of the M&E system
Making greater use of household survey data collected by the CSA as recommended in the OWNP social
assessment (such as the Ethiopia Demographic and Health Survey)
Improvement of indicators with respect to social issues based upon recommendations made in the OWNP
social assessment.
Disaggregation where possible of data to highlight inequities, and development of metrics to report on
inequalities using available data (see for example in Annex 3, KPIs 1-3 and 9, and supplementary
indicators S6,9, S27, S29, S61 and S67)
A specific section in the OWNP annual report on progress in addressing inequalities in access to WaSH
services.
2.4.3 Tracking Resettlement Risks
Water and sanitation schemes may require acquisition of land and may involve resettlement of people. A
Resettlement Policy Framework (RPF) has been put in place to support CWA-funded implementation and to
ensure such issues are addressed systemically in line with legal requirements (FDRE, 2013c).
The following proposed standard indicators are included in the OWNP M&E framework (as supplementary
indicators) to support tracking of risks in line with the RPF. It is again anticipated that data on these indicators will
initially be collected and reported in CWA-funded woredas but with the potential for such tracking to be extended to
other financing channels as required.
The following indicators are identified to support implementation of provisions related to resettlement issues:
Percentage of schemes involving resettlement of people.
Percentage of households and individuals relocated as a result of water and/or sanitation scheme
activities.
Percentage of schemes where compensation is paid relating to development of water and/or sanitation
schemes.
Average amount of compensation paid relating to development of water and/or sanitation schemes.
Average time taken to make compensation payments (defined as time between date when displacement
occurred and date when compensation was actually delivered).
Number of grievances registered.
These data will be collected by RWCO/PMUs on an annual basis. Inclusion of these indicators will support the
preparation of the annual monitoring report to be prepared by implementing agencies (as set out in the RPF).
2.4.4 Tracking Fiduciary Risks
Following a fiduciary risk assessment that identified and assessed the major risks, a Fiduciary Risk Mitigation Plan
(FRMP) was developed to support management of funds through the CWA.
The following proposed standard indicators are included in the OWNP M&E framework (as supplementary
indicators) to supporting tracking of risks in line with the FRMP. It is also anticipated that data on these indicators
will initially be collected and reported in CWA-funded woredas but with the potential for such tracking to be
extended to other financing channels as required.
Volume of WaSH investments managed and reported through IBEX.
Proportion of financial reports submitted on time.
Proportion of WaSH institutions with annual audits completed.
Proportion of WaSH institutions with up to date asset registers/ inventories.
These data will be collected by RWCOs/NWCO and BOFED/MoFED. Indicators with respect to tracking capital
investment costs and cost recovery by service providers are also included in line with GTP2 (see Annex 3).
ONEWASH INCEPTION REPORT VOL. 1 (TASKS 1 AND 3)
ONEWASH – OCTOBER 2015 23
2.5 Calendar for enhanced OWNP M&E Reporting
Table 3 illustrates how on an annual basis data will be collected and reported within sectoral processes, shared
with the NWCO (in the case of data from health, finance and education systems) and made available at each level
for the preparation of integrated reports. Some of the key sector events, where OWNP reports are vital inputs, are
also highlighted.
In years where the National WaSH Inventory is undertaken, such as 2016, additional data is collected and reported in the WaSH Atlas.
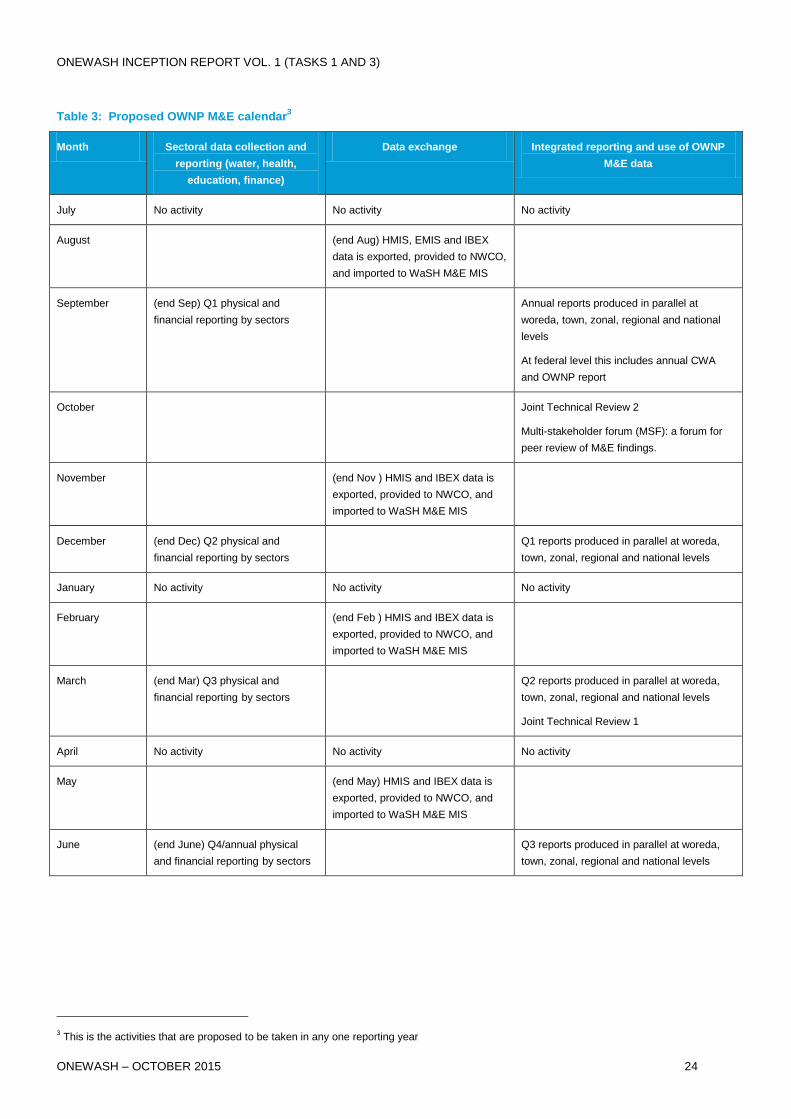
ONEWASH INCEPTION REPORT VOL. 1 (TASKS 1 AND 3)
ONEWASH – OCTOBER 2015 24
Table 3: Proposed OWNP M&E calendar3
Month Sectoral data collection and
reporting (water, health,
education, finance)
Data exchange Integrated reporting and use of OWNP
M&E data
July No activity No activity No activity
August (end Aug) HMIS, EMIS and IBEX
data is exported, provided to NWCO,
and imported to WaSH M&E MIS
September (end Sep) Q1 physical and
financial reporting by sectors
Annual reports produced in parallel at
woreda, town, zonal, regional and national
levels
At federal level this includes annual CWA
and OWNP report
October Joint Technical Review 2
Multi-stakeholder forum (MSF): a forum for
peer review of M&E findings.
November (end Nov ) HMIS and IBEX data is
exported, provided to NWCO, and
imported to WaSH M&E MIS
December (end Dec) Q2 physical and
financial reporting by sectors
Q1 reports produced in parallel at woreda,
town, zonal, regional and national levels
January No activity No activity No activity
February (end Feb ) HMIS and IBEX data is
exported, provided to NWCO, and
imported to WaSH M&E MIS
March (end Mar) Q3 physical and
financial reporting by sectors
Q2 reports produced in parallel at woreda,
town, zonal, regional and national levels
Joint Technical Review 1
April No activity No activity No activity
May (end May) HMIS and IBEX data is
exported, provided to NWCO, and
imported to WaSH M&E MIS
June (end June) Q4/annual physical
and financial reporting by sectors
Q3 reports produced in parallel at woreda,
town, zonal, regional and national levels
3 This is the activities that are proposed to be taken in any one reporting year
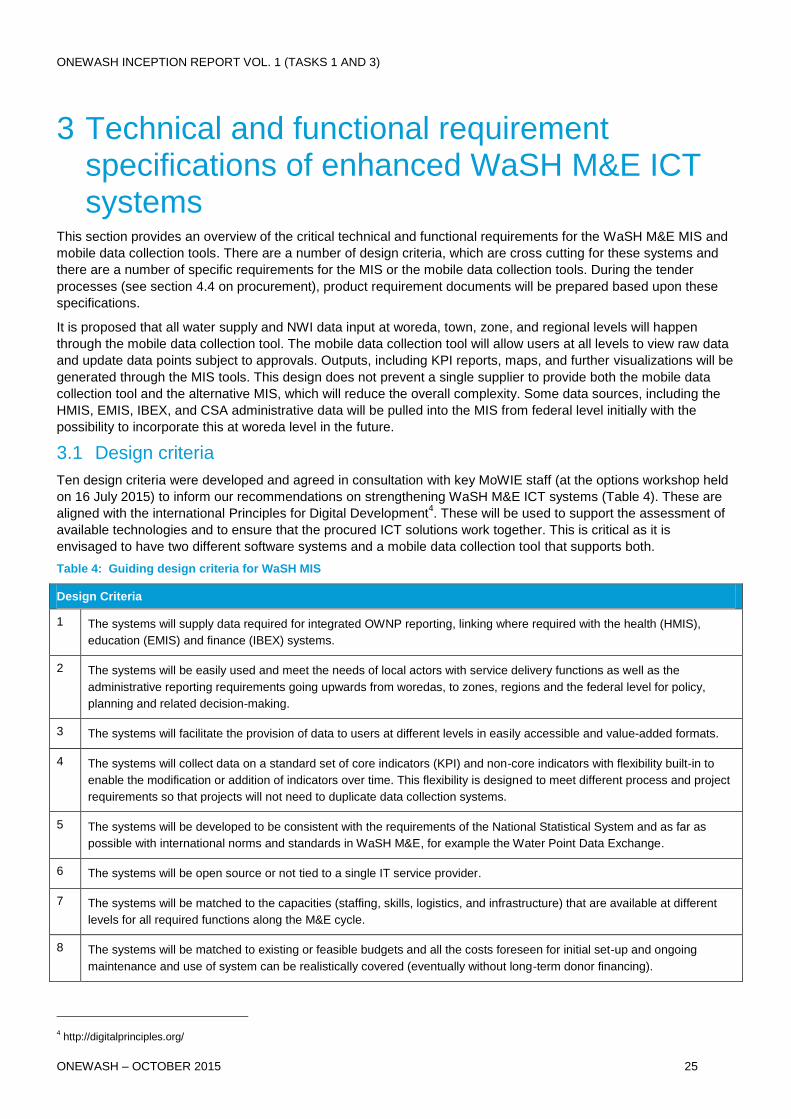
ONEWASH INCEPTION REPORT VOL. 1 (TASKS 1 AND 3)
ONEWASH – OCTOBER 2015 25
3 Technical and functional requirement specifications of enhanced WaSH M&E ICT systems
This section provides an overview of the critical technical and functional requirements for the WaSH M&E MIS and
mobile data collection tools. There are a number of design criteria, which are cross cutting for these systems and
there are a number of specific requirements for the MIS or the mobile data collection tools. During the tender
processes (see section 4.4 on procurement), product requirement documents will be prepared based upon these
specifications.
It is proposed that all water supply and NWI data input at woreda, town, zone, and regional levels will happen
through the mobile data collection tool. The mobile data collection tool will allow users at all levels to view raw data
and update data points subject to approvals. Outputs, including KPI reports, maps, and further visualizations will be
generated through the MIS tools. This design does not prevent a single supplier to provide both the mobile data
collection tool and the alternative MIS, which will reduce the overall complexity. Some data sources, including the
HMIS, EMIS, IBEX, and CSA administrative data will be pulled into the MIS from federal level initially with the
possibility to incorporate this at woreda level in the future.
3.1 Design criteria
Ten design criteria were developed and agreed in consultation with key MoWIE staff (at the options workshop held
on 16 July 2015) to inform our recommendations on strengthening WaSH M&E ICT systems (Table 4). These are
aligned with the international Principles for Digital Development4. These will be used to support the assessment of
available technologies and to ensure that the procured ICT solutions work together. This is critical as it is
envisaged to have two different software systems and a mobile data collection tool that supports both.
Table 4: Guiding design criteria for WaSH MIS
Design Criteria
1 The systems will supply data required for integrated OWNP reporting, linking where required with the health (HMIS),
education (EMIS) and finance (IBEX) systems.
2 The systems will be easily used and meet the needs of local actors with service delivery functions as well as the
administrative reporting requirements going upwards from woredas, to zones, regions and the federal level for policy,
planning and related decision-making.
3 The systems will facilitate the provision of data to users at different levels in easily accessible and value-added formats.
4 The systems will collect data on a standard set of core indicators (KPI) and non-core indicators with flexibility built-in to
enable the modification or addition of indicators over time. This flexibility is designed to meet different process and project
requirements so that projects will not need to duplicate data collection systems.
5 The systems will be developed to be consistent with the requirements of the National Statistical System and as far as
possible with international norms and standards in WaSH M&E, for example the Water Point Data Exchange.
6 The systems will be open source or not tied to a single IT service provider.
7 The systems will be matched to the capacities (staffing, skills, logistics, and infrastructure) that are available at different
levels for all required functions along the M&E cycle.
8 The systems will be matched to existing or feasible budgets and all the costs foreseen for initial set-up and ongoing
maintenance and use of system can be realistically covered (eventually without long-term donor financing).
4 http://digitalprinciples.org/

ONEWASH INCEPTION REPORT VOL. 1 (TASKS 1 AND 3)
ONEWASH – OCTOBER 2015 26
9 The systems will facilitate updating, support versioning and facilitate verification.
10 The systems will enable management of users and the approval of data stored by the designated authorities, and provide
a similar level of assurance and integrity to stamped paper-based reporting trails.
3.2 Shared requirements for all systems
All systems are expected to meet the Ethiopian and IP regulations on ICT systems and to provide accessible and
modifiable source code whether open source or closed source. In addition, all systems will need to meet these
shared functional specifications (see Table 5). It is also expected that vendors will provide access to issue lists,
including the complexity and status of each issue.
Table 5: Shared functional specifications for all systems
Shared functional specifications
Mobile and desktop compatible web interface
Versioning of data and conflict resolution when importing data
Ticketed support system available from tool interface.
Low bandwidth
High availability
User permissions and roles customisable by administrative user, including geographic roles and permissions for regional, zone, and woreda staff
Localised or multi-language support
Data security e.g. backups, insurance for fire and theft.
Scalable for data management and number of users
User friendly with intuitive/easy access to the system and navigation.
Rich support documentation
3.3 MIS requirement specifications
The MIS requirement specifications (Table 6) relate to both the existing WaSH M&E MIS and the alternative MIS.
The current scope of the existing WaSH M&E MIS will be changed to support its operationalisation. It will refocus
on the reporting and analysis requirements as well as local data storage, while most user data input functions will
be disabled. The outputs will include online dashboards with customisable reporting templates for regular OWNP
reporting.
Table 6: Output and input specifications for WaSH MIS (both the existing WaSH M&E MIS and the alternative MIS)
Output specifications for WaSH MIS Input specifications for WaSH MIS
Access to web-based MIS data, custom queries, pivot tables, and template reports by authenticated users according to permissions and roles
Shape files for administrative boundaries
Share data analysis using a URL Import data from Health, Education, CSA and Finance using 3
rd party read API or a CSV import. Respect unique
IDs.
Longitudinal outputs User search, basic and advanced
Export reporting templates to PDF and MS Word-editable file. Configuration of aggregated analysis tables, figures and

ONEWASH INCEPTION REPORT VOL. 1 (TASKS 1 AND 3)
ONEWASH – OCTOBER 2015 27
maps in the dashboard based on user role and permissions.
Export point data to WPDx standard5 Configuration of colour schemes, logos and branding
Mapping including using hierarchical administrative boundaries and visualisation of point based data to provide comprehensive assessment of KPIs.
Write API for authenticated applications with roles and permissions
Export to raw data to Excel and/or CSV. User management interface for defining roles and permission and for creating users.
Configuration by administrative user of automatic reporting periods, e.g. quarterly, annually, etc.
Import data from mobile data collection tool using read API. Respect unique IDs.
Configuration of MIS data, custom queries and template reports by authenticated users according to permissions and roles
Configuration of advanced analysis (pivot tables, queries, KPI, etc.) in standard dashboard, maps and reports by authenticated administrative user
Configuration of aggregated analysis tables, figures and maps on a public widget by administrative user
6.
3.4 Mobile data collection system requirement specifications
The mobile data collection solution will handle the majority of inputs into the MIS (i.e. for water supply and NWI
data). Specifications are given in Table 7. Users will be able to submit data and approve data offline and online
using mobile devices. There will be an administrative interface for designing and assigning surveys to devices and
to ensure that each survey question is assigned an appropriate variable name for the purpose of importing the data
into the MIS. The interoperability features of the mobile data collection for the purpose of the MIS will be critically
assessed to control for integration risks.
Table 7: Output, input and functional specifications for data collection system
Outputs specifications Input specifications Functional specifications
Survey response import and export with CSV or MS Excel formats
Web-entry for importing bulk data import from devices or computer
Device registration and survey assignment
Device export through Bluetooth, USB, and/or storage card.
Manage census information and admin levels
Mobile data transfer via GSM data or WIFI
Real time response monitoring on dashboard
Finding entries, in order to edit or modify records
Longitudinal monitoring7 and updating of
records
Read API for export to MIS with variable and response codes and/or raw system data
Server based conflict resolution Rich survey format including templates, photo capture, GPS, branching, validation, hierarchical multiple choice, looping, etc.
Field validation during data entry Intuitive and integrated input system (training mode, accessibility options such as large buttons etc.)
User and/or device-based authentication with roles and permission for data entry
5 http://waterpointdata.org/
6 A ‘public widget’ is a user input to configure the maps, calculations, figures. Like writing an excel equation
7 Repeat monitoring of same point over time

ONEWASH INCEPTION REPORT VOL. 1 (TASKS 1 AND 3)
ONEWASH – OCTOBER 2015 28
Mobile-based viewing of previous data points, including location search and map view
Output codes for exporting data to MIS Update mechanisms to ensure bug-fixes and compatibility
Write API (preferred) Web-entry of surveys by authenticated user
Location or text-based record searching on field devices
Rich user warnings based on survey validation design (preferred)
Import data inventories. Dynamic multiple type questions and feature to link multiple surveys and automatic update of new forms from the backend system
Data cleaning and editing: device and web-based
Common supported platforms and devices with long-term support and upgrades
GPS capture in survey Device monitoring (network usage, etc.)
Survey creation, modification and deletion
Copying, linking, exporting, importing of surveys
Device management interface
Add visualisation parameters, e.g. shape files.
Offline response entry
Photo capture in survey
Reliable GPS readings (checking satellites, accuracy etc.)
Variable names for each question when exporting to MIS
Mobile search field for data
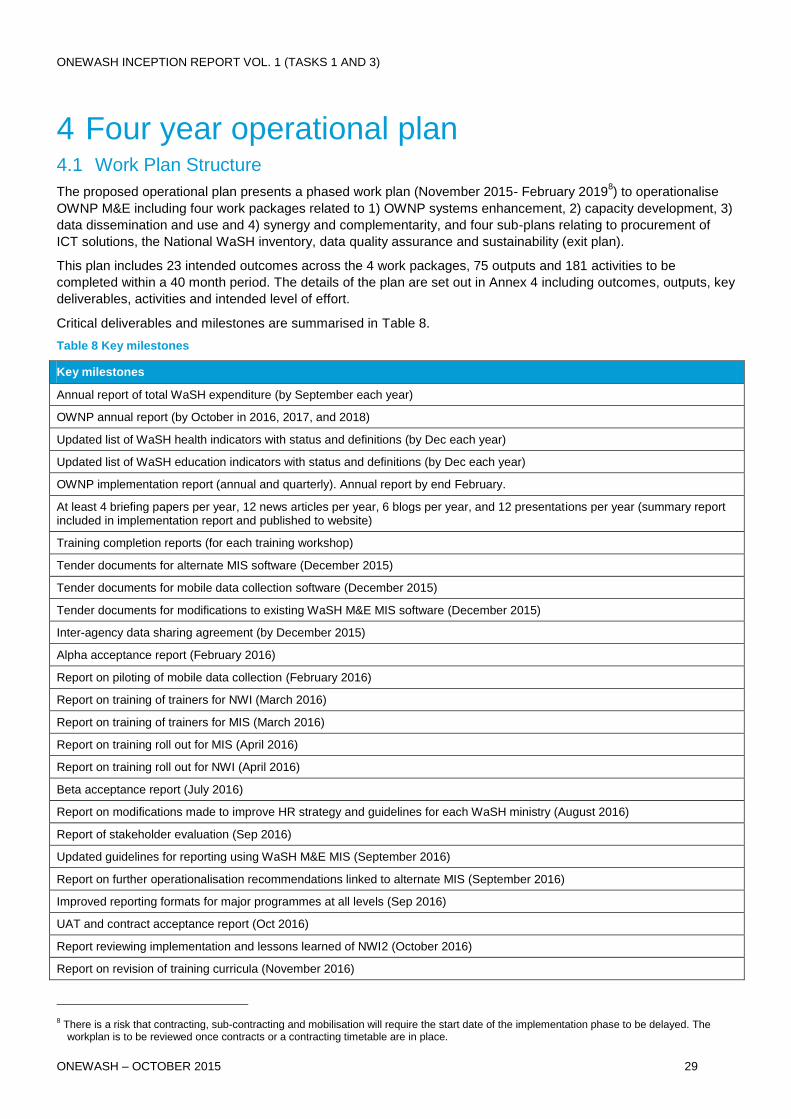
ONEWASH INCEPTION REPORT VOL. 1 (TASKS 1 AND 3)
ONEWASH – OCTOBER 2015 29
4 Four year operational plan 4.1 Work Plan Structure
The proposed operational plan presents a phased work plan (November 2015- February 20198) to operationalise
OWNP M&E including four work packages related to 1) OWNP systems enhancement, 2) capacity development, 3)
data dissemination and use and 4) synergy and complementarity, and four sub-plans relating to procurement of
ICT solutions, the National WaSH inventory, data quality assurance and sustainability (exit plan).
This plan includes 23 intended outcomes across the 4 work packages, 75 outputs and 181 activities to be
completed within a 40 month period. The details of the plan are set out in Annex 4 including outcomes, outputs, key
deliverables, activities and intended level of effort.
Critical deliverables and milestones are summarised in Table 8.
Table 8 Key milestones
Key milestones
Annual report of total WaSH expenditure (by September each year)
OWNP annual report (by October in 2016, 2017, and 2018)
Updated list of WaSH health indicators with status and definitions (by Dec each year)
Updated list of WaSH education indicators with status and definitions (by Dec each year)
OWNP implementation report (annual and quarterly). Annual report by end February.
At least 4 briefing papers per year, 12 news articles per year, 6 blogs per year, and 12 presentations per year (summary report included in implementation report and published to website)
Training completion reports (for each training workshop)
Tender documents for alternate MIS software (December 2015)
Tender documents for mobile data collection software (December 2015)
Tender documents for modifications to existing WaSH M&E MIS software (December 2015)
Inter-agency data sharing agreement (by December 2015)
Alpha acceptance report (February 2016)
Report on piloting of mobile data collection (February 2016)
Report on training of trainers for NWI (March 2016)
Report on training of trainers for MIS (March 2016)
Report on training roll out for MIS (April 2016)
Report on training roll out for NWI (April 2016)
Beta acceptance report (July 2016)
Report on modifications made to improve HR strategy and guidelines for each WaSH ministry (August 2016)
Report of stakeholder evaluation (Sep 2016)
Updated guidelines for reporting using WaSH M&E MIS (September 2016)
Report on further operationalisation recommendations linked to alternate MIS (September 2016)
Improved reporting formats for major programmes at all levels (Sep 2016)
UAT and contract acceptance report (Oct 2016)
Report reviewing implementation and lessons learned of NWI2 (October 2016)
Report on revision of training curricula (November 2016)
8 There is a risk that contracting, sub-contracting and mobilisation will require the start date of the implementation phase to be delayed. The
workplan is to be reviewed once contracts or a contracting timetable are in place.
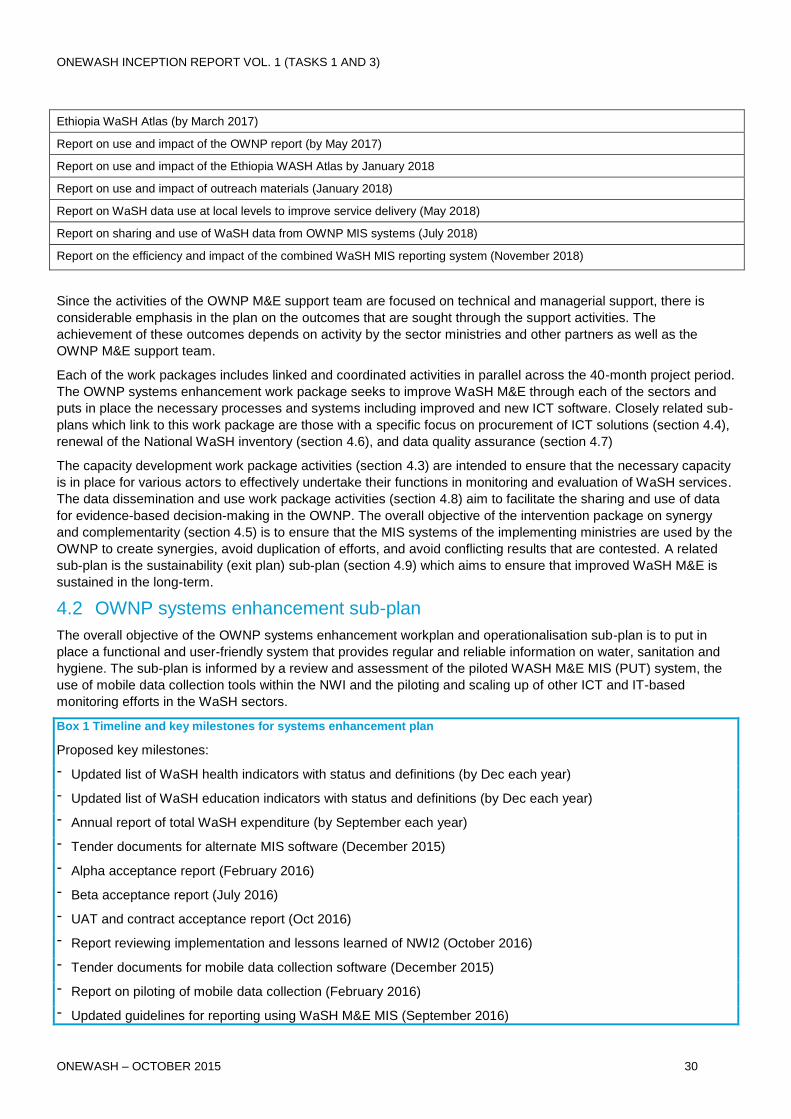
ONEWASH INCEPTION REPORT VOL. 1 (TASKS 1 AND 3)
ONEWASH – OCTOBER 2015 30
Ethiopia WaSH Atlas (by March 2017)
Report on use and impact of the OWNP report (by May 2017)
Report on use and impact of the Ethiopia WASH Atlas by January 2018
Report on use and impact of outreach materials (January 2018)
Report on WaSH data use at local levels to improve service delivery (May 2018)
Report on sharing and use of WaSH data from OWNP MIS systems (July 2018)
Report on the efficiency and impact of the combined WaSH MIS reporting system (November 2018)
Since the activities of the OWNP M&E support team are focused on technical and managerial support, there is
considerable emphasis in the plan on the outcomes that are sought through the support activities. The
achievement of these outcomes depends on activity by the sector ministries and other partners as well as the
OWNP M&E support team.
Each of the work packages includes linked and coordinated activities in parallel across the 40-month project period.
The OWNP systems enhancement work package seeks to improve WaSH M&E through each of the sectors and
puts in place the necessary processes and systems including improved and new ICT software. Closely related sub-
plans which link to this work package are those with a specific focus on procurement of ICT solutions (section 4.4),
renewal of the National WaSH inventory (section 4.6), and data quality assurance (section 4.7)
The capacity development work package activities (section 4.3) are intended to ensure that the necessary capacity
is in place for various actors to effectively undertake their functions in monitoring and evaluation of WaSH services.
The data dissemination and use work package activities (section 4.8) aim to facilitate the sharing and use of data
for evidence-based decision-making in the OWNP. The overall objective of the intervention package on synergy
and complementarity (section 4.5) is to ensure that the MIS systems of the implementing ministries are used by the
OWNP to create synergies, avoid duplication of efforts, and avoid conflicting results that are contested. A related
sub-plan is the sustainability (exit plan) sub-plan (section 4.9) which aims to ensure that improved WaSH M&E is
sustained in the long-term.
4.2 OWNP systems enhancement sub-plan
The overall objective of the OWNP systems enhancement workplan and operationalisation sub-plan is to put in
place a functional and user-friendly system that provides regular and reliable information on water, sanitation and
hygiene. The sub-plan is informed by a review and assessment of the piloted WASH M&E MIS (PUT) system, the
use of mobile data collection tools within the NWI and the piloting and scaling up of other ICT and IT-based
monitoring efforts in the WaSH sectors.
Box 1 Timeline and key milestones for systems enhancement plan
Proposed key milestones:
- Updated list of WaSH health indicators with status and definitions (by Dec each year)
- Updated list of WaSH education indicators with status and definitions (by Dec each year)
- Annual report of total WaSH expenditure (by September each year)
- Tender documents for alternate MIS software (December 2015)
- Alpha acceptance report (February 2016)
- Beta acceptance report (July 2016)
- UAT and contract acceptance report (Oct 2016)
- Report reviewing implementation and lessons learned of NWI2 (October 2016)
- Tender documents for mobile data collection software (December 2015)
- Report on piloting of mobile data collection (February 2016)
- Updated guidelines for reporting using WaSH M&E MIS (September 2016)

ONEWASH INCEPTION REPORT VOL. 1 (TASKS 1 AND 3)
ONEWASH – OCTOBER 2015 31
- Tender documents for modifications to existing WaSH M&E MIS software (December 2015)
- Report on further operationalisation recommendations linked to alternate MIS (September 2016)
4.2.1 Key findings: introduction of ICT-enabled systems for WaSH
The OWNP needs to be able to demonstrate and communicate its results, with sound evidence and analysis being
used to drive improved programme implementation and to ensure further programme investments. During the
various reviews undertaken within this assignment we have assessed the National WASH Inventory 2011, the
National WASH Inventory update in Somali Region 2014, and the WASH M&E MIS, in addition to other ministry
systems holding WASH data. Amongst other tools, the application of a design-reality gap framework has provided
the following insights:
Existing WaSH M&E processes: The existing WaSH landscape is fragmented and complex with numerous
programmes, plans, financing channels and reports across the sectors. M&E responsibilities and efforts are
typically fragmented due to complex financing arrangements in WaSH sectors and different Ministries,
Departments, Offices, Processes, Sub- processes and Case Teams involved. Limited cooperation between the
units managing information systems and IT across WaSH ministries and alignment of data from the different MIS
systems across the WaSH sectors prevents effective WaSH sector wide reporting.
Existing IT-enabled systems: Existing systems are in place providing WaSH information to the sector at both
national and local levels: HMIS has 3 household sanitation indicators and 2 health institution indicators, and EMIS
has 3 school WaSH indicators. The national IBEX system is in place to manage public expenditure. These systems
have gaps with respect to WaSH indicators and the quality of data collected but are functioning national scale data
collection and reporting systems within OWNP implementing ministries. There is not a comparable national system
in use in the water supply sector. IT-enabled systems in water supply exist at regional and local levels but are not
utilised to their full potential.
The National WaSH Inventory: The National WaSH Inventory has resulted in an improved national estimate of
access to improved water supplies, and the results were accepted and used by both the parliament and later the
Joint Monitoring Programme in determining that Ethiopia had successfully met the MDG water target. The Somali
region 2014 update deployed new mobile data collection technologies which greatly improved the speed and
quality of data collection. The NWI however lacks ownership in other WaSH sectors and the WaSH M&E MIS
which currently holds NWI data does not yet link to the established data collection processes and management
information systems in finance, education and health.
WaSH M&E MIS: The WaSH M&E MIS is functional but does not meet the minimum requirements considered
necessary for operationalisation. There are significant technical and operational challenges with the system.
Testing processes were insufficient to ensure the system met user requirements and capabilities. The software is
not user friendly and has limited flexibility without recourse to reprogramming work by the developers. Despite a
large-scale roll out of training there has not been any significant use of the system. The database contains only
2011 NWI data and new data is not being entered. The hardware and training roll-out has not yet led to use of the
system.
Introduction of ICT: The Health and Education reporting systems are largely paper based; there is no use at scale
of internet or mobile communications technologies. IBEX is a series of standalone databases at regional level and
is not networked. The water sector has not yet linked its routine reporting systems to an operational MIS system.
The 2014 Somali region NWI update successfully used mobile technology to collect all water infrastructure data,
where data was be collected faster and more reliable than using paper based systems. There is considerable ICT-
related innovation in monitoring within bilateral programmes, projects and NGOs.
Quality assurance: There is little practice of validating data or triangulating data derived from different sources in
the OWNP sectors. Data quality management is not implemented effectively and there are not systematic
processes in place to verify data. There are concerns about the quality of National WaSH Inventory data and the
validation processes; however data quality is thought to have improved through deployment of mobile data
collection technology in the Somali region.
Demand and use: There is high demand for data but existing data is significantly under-utilised. Data is either not
accessible or insufficient resources are allocated to data analysis, dissemination and use. There is little knowledge
about the data available within the OWNP partner ministries, the CSA or the NWI, or sharing of relevant information
between ministries which has led to considerable duplication in WaSH data collected across the sector. Recent
ONEWASH INCEPTION REPORT VOL. 1 (TASKS 1 AND 3)
ONEWASH – OCTOBER 2015 32
WaSH M&E efforts have failed to make a clear link between the decisions that need to be taken and the data
required. There is a tendency to collect excessive data, to inadequately use existing data, to have an absence or
lack of capacity and systems to analyse, interpret and respond to data collected at the appropriate levels, in
particular at the woreda level, and to have weak standard processes, forms and procedures for using data.
4.2.2 Approach to systems enhancement
Based on the findings of our assessment we provide an overview of the strategic directions that are recommended
and proposed for the implementation phase:
Streamline WaSH targets, indicators and definitions: An updated set of WaSH indicators aligning with GTP2,
OWNP and CWA and other sector priorities are proposed. Sanitation and hygiene indicators are based on the
updated indicators in HMIS. Indicators are prioritised as; updated set of possible KPIs, supplementary indicators,
and other indicators. An annual review process will be established to ensure relevance of data collected for use in
decision making and tracking progress.
Integrated reporting: Reporting will be integrated across ministries by using existing sectoral MIS systems to
collect data from local levels and operationalising a WaSH MIS to both support water supply data management and
to provide access to WaSH data at all levels to support production of integrated OWNP reports. Health, education
and finance sector data is imported at federal level and made available at all levels. A long term vision is to have
woreda level entry into the WaSH MIS from sectoral MIS systems. In addition to regular reporting, a National
WaSH Inventory will provide 5 yearly data for a wide range of indicators on critical assets.
Integrated reporting is undertaken at each level; at federal level a reporting team led by NWCO works with data
drawn from the integrated WaSH M&E MIS database and staff from the sectors to produce a comprehensive
flagship OWNP annual report. Similar reporting processes are envisaged at regional and woreda levels in line with
demand and capacities at these levels. Well-functioning WaSH institutions are required to lead production of
integrated reports at federal and other levels. Apart from integrated reports, data use is to be promoted through an
intervention package on dissemination and use that focuses on ensuring the use of data at local levels to improve
service delivery as well as promoting use within each of the OWNP sub-sectors.
Operationalise the WaSH M&E MIS: Operationalisation will involve three major aspects; improvements to the
existing WASH M&E MIS, procurement of mobile data collection application and an alternative MIS with greater
database and analytical capabilities. The existing WaSH M&E MIS will be further developed to make it operational
with a reduced scope. Steps include improving the existing WaSH M&E MIS with a focus on operationalising the
database and reporting functionality, which will need a new contract with the developers, purchase of the source
code subject to cost and audit to assess the options for long term use of the software and the potential for
maintenance and modifications by the MoWIE IT department. Meanwhile, the development of separate but
compatible mobile data collection capabilities, through the procurement and customisation of ‘off the shelf’ software
to support NWI2 data collection. In parallel will be the procurement and customisation, or development, of an
alternative MIS with great database and analytical software capacities.
Ensuring regular reporting: The OWNP M&E system includes combining strengthened regular reporting together
within periodic inventory of infrastructure assets. Reporting and inventory processes are in place and will be
strengthened through improvement of indicators and enhancement of capacities as well as through supporting
ICTs. Current water supply paper-based reporting will be gradually migrated through additional forms using mobile
application and phones, with care given to ensuring a paper-based backup trail and/or sufficient approvals to
ensure that WasH M&E governance is enhanced and not undermined. A phased process of development and
rollout will facilitate regular kebele-level reporting where capacities are lower, enabling all regions to adopt
infrastructure level monitoring systems by the end of 2018.
4.2.3 Work plan
The work plan sets out the planned activities as part of the systems enhancement work-package/ operationalisation
work plan. Table 9 provides a summary of the work plan describing proposed outcomes, outputs and activities (as
developed during the inception phase and proposed in this report). Annex 4 contains further detail on the timing of
activities.
The timescale is ambitious but grounded within the overall project context and timeframe. The intention is to use
the effort and enthusiasm of NWI2 data collection to begin embedding the regular M&E in those regions and
woredas with the greatest capacity. An example is Tigray, where a lot has been done in WASH data collection,
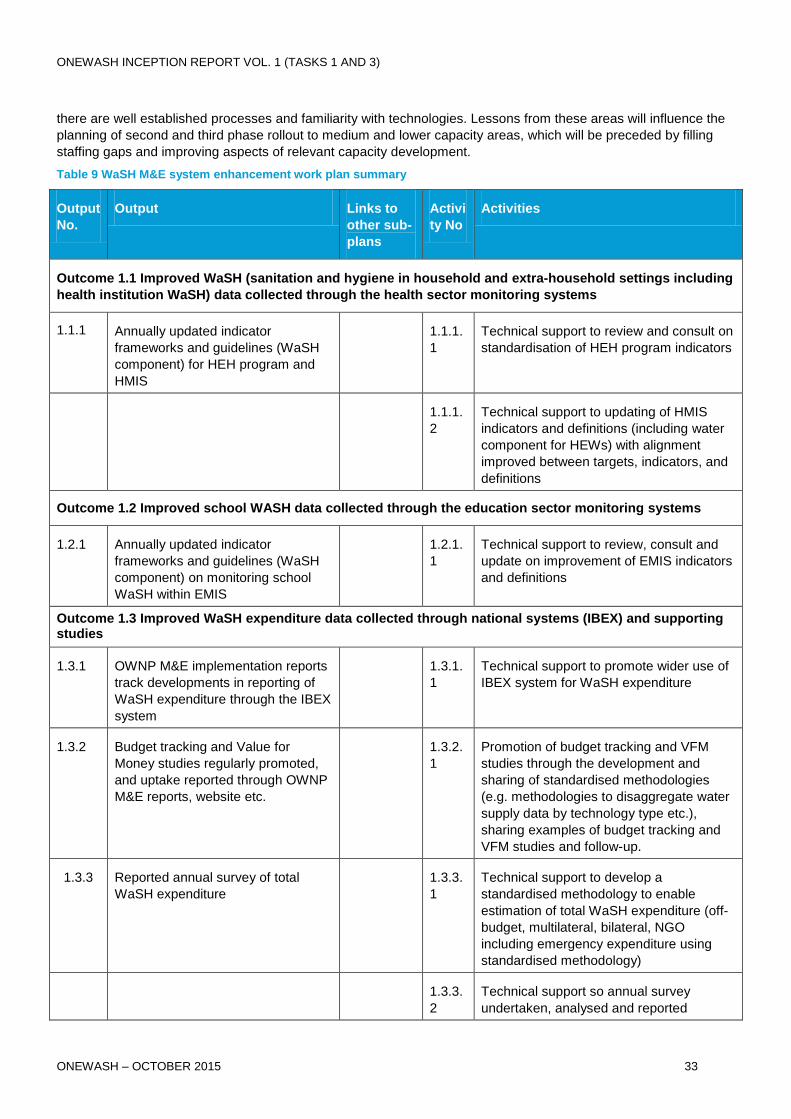
ONEWASH INCEPTION REPORT VOL. 1 (TASKS 1 AND 3)
ONEWASH – OCTOBER 2015 33
there are well established processes and familiarity with technologies. Lessons from these areas will influence the
planning of second and third phase rollout to medium and lower capacity areas, which will be preceded by filling
staffing gaps and improving aspects of relevant capacity development.
Table 9 WaSH M&E system enhancement work plan summary
Output
No.
Output Links to
other sub-
plans
Activi
ty No
Activities
Outcome 1.1 Improved WaSH (sanitation and hygiene in household and extra-household settings including
health institution WaSH) data collected through the health sector monitoring systems
1.1.1 Annually updated indicator
frameworks and guidelines (WaSH
component) for HEH program and
HMIS
1.1.1.
1
Technical support to review and consult on
standardisation of HEH program indicators
1.1.1.
2
Technical support to updating of HMIS
indicators and definitions (including water
component for HEWs) with alignment
improved between targets, indicators, and
definitions
Outcome 1.2 Improved school WASH data collected through the education sector monitoring systems
1.2.1 Annually updated indicator
frameworks and guidelines (WaSH
component) on monitoring school
WaSH within EMIS
1.2.1.
1
Technical support to review, consult and
update on improvement of EMIS indicators
and definitions
Outcome 1.3 Improved WaSH expenditure data collected through national systems (IBEX) and supporting studies
1.3.1 OWNP M&E implementation reports
track developments in reporting of
WaSH expenditure through the IBEX
system
1.3.1.
1
Technical support to promote wider use of
IBEX system for WaSH expenditure
1.3.2 Budget tracking and Value for
Money studies regularly promoted,
and uptake reported through OWNP
M&E reports, website etc.
1.3.2.
1
Promotion of budget tracking and VFM
studies through the development and
sharing of standardised methodologies
(e.g. methodologies to disaggregate water
supply data by technology type etc.),
sharing examples of budget tracking and
VFM studies and follow-up.
1.3.3 Reported annual survey of total
WaSH expenditure
1.3.3.
1
Technical support to develop a
standardised methodology to enable
estimation of total WaSH expenditure (off-
budget, multilateral, bilateral, NGO
including emergency expenditure using
standardised methodology)
1.3.3.
2
Technical support so annual survey
undertaken, analysed and reported

ONEWASH INCEPTION REPORT VOL. 1 (TASKS 1 AND 3)
ONEWASH – OCTOBER 2015 34
Outcome 1. 4 IT-enabled Water MIS system used to facilitate effective processing (sharing, distributing,
analysing, storing) and dissemination
1.4.1 Vendor procured and passed
contract and regulation acceptance
testing
Procurement
1.4.1.
1
Production of tender documentation and
sign off by ministry
1.4.1.
2
Technical support to tender processes and
contract and regulation acceptance testing
for potential vendors
1.4.2 Vendor status log reviewed
(fortnightly)
1.4.2.
1
Manage vendor to customise and further
develop and deliver MIS to include
technical and functional design
specifications
1.4.3 Alpha acceptance report 1.4.3.
1
Representative user feedback from
federal, regional and woreda level
acquired on basis of wireframes and/or
prototype
1.4.4 Operational manuals developed for
the OWNP MIS
1.4.4.
1
Quality assure/review full operational and
technical manuals prepared by vendor for
different users levels
1.4.5 Beta acceptance report based on
piloting OWNP MIS in selected
regions (beta user testing)
1.4.5.
1
Full plan prepared for the MIS pilot in
selected regions (beta user testing)
1.4.5.
2
Prepare and deliver training for pilot of MIS
1.4.5.
3
Coordinate the MIS pilot and feedback
process in selected regions (beta user
testing)
1.4.6 UAT and contract acceptance report
for OWNP MIS ready for national
roll-out
1.4.6.
1
Refine MIS and documentation based on
Beta Acceptance Report and piloting
experiences
1.4.7 Plans for OWNP MIS software
launch
1.4.7.
1
Preparations for software launch
1.4.8 OWNP MIS is kept operational 1.4.8.
1
Monitor vendor to ensure helpdesk
support, regular bug fixing, upgrading,
customisation according to contract
Outcome 1.5 Improved NWI water data collected at periodic intervals, and NWI2 completed
1.5.1 Effective national process in place to
collect and process NWI data at
periodic intervals, and support to
NWI2 reported
1.5.1.
1
Technical support to development NWI2
plan and mobilisation of funds
1.5.1.
2
NWI1 methodology revised and manuals &
guidelines updated
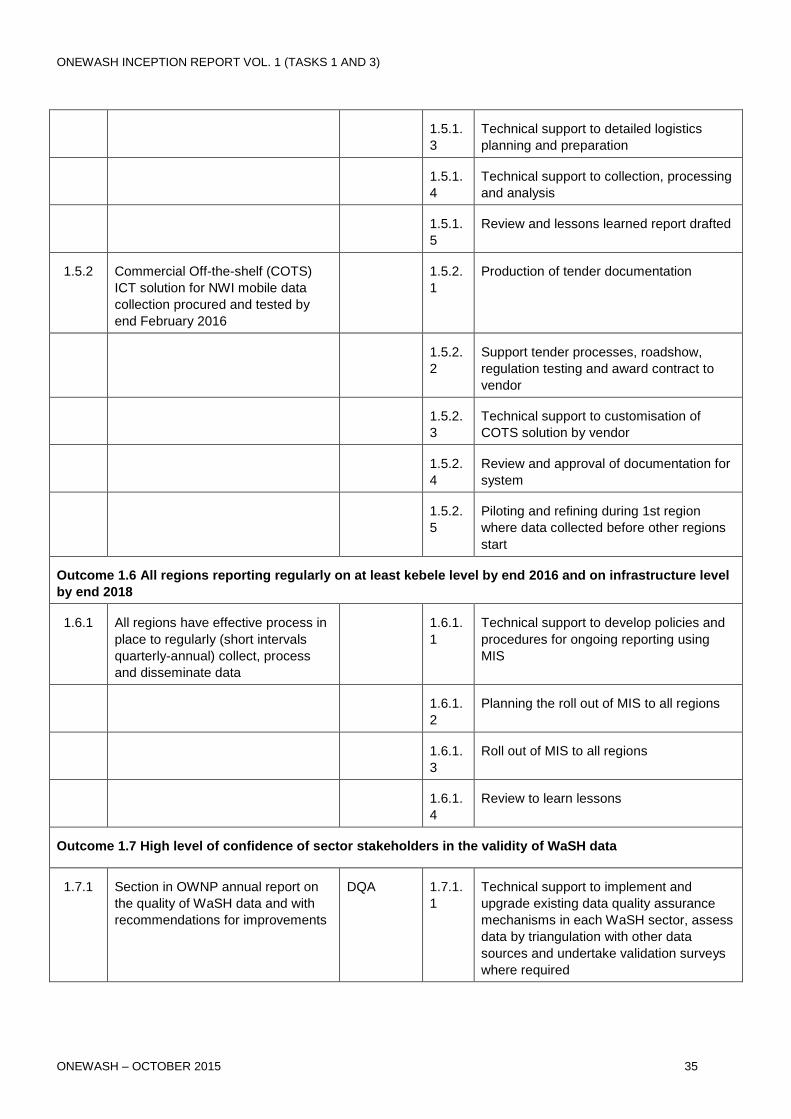
ONEWASH INCEPTION REPORT VOL. 1 (TASKS 1 AND 3)
ONEWASH – OCTOBER 2015 35
1.5.1.
3
Technical support to detailed logistics
planning and preparation
1.5.1.
4
Technical support to collection, processing
and analysis
1.5.1.
5
Review and lessons learned report drafted
1.5.2 Commercial Off-the-shelf (COTS)
ICT solution for NWI mobile data
collection procured and tested by
end February 2016
1.5.2.
1
Production of tender documentation
1.5.2.
2
Support tender processes, roadshow,
regulation testing and award contract to
vendor
1.5.2.
3
Technical support to customisation of
COTS solution by vendor
1.5.2.
4
Review and approval of documentation for
system
1.5.2.
5
Piloting and refining during 1st region
where data collected before other regions
start
Outcome 1.6 All regions reporting regularly on at least kebele level by end 2016 and on infrastructure level
by end 2018
1.6.1 All regions have effective process in
place to regularly (short intervals
quarterly-annual) collect, process
and disseminate data
1.6.1.
1
Technical support to develop policies and
procedures for ongoing reporting using
MIS
1.6.1.
2
Planning the roll out of MIS to all regions
1.6.1.
3
Roll out of MIS to all regions
1.6.1.
4
Review to learn lessons
Outcome 1.7 High level of confidence of sector stakeholders in the validity of WaSH data
1.7.1 Section in OWNP annual report on
the quality of WaSH data and with
recommendations for improvements
DQA 1.7.1.
1
Technical support to implement and
upgrade existing data quality assurance
mechanisms in each WaSH sector, assess
data by triangulation with other data
sources and undertake validation surveys
where required
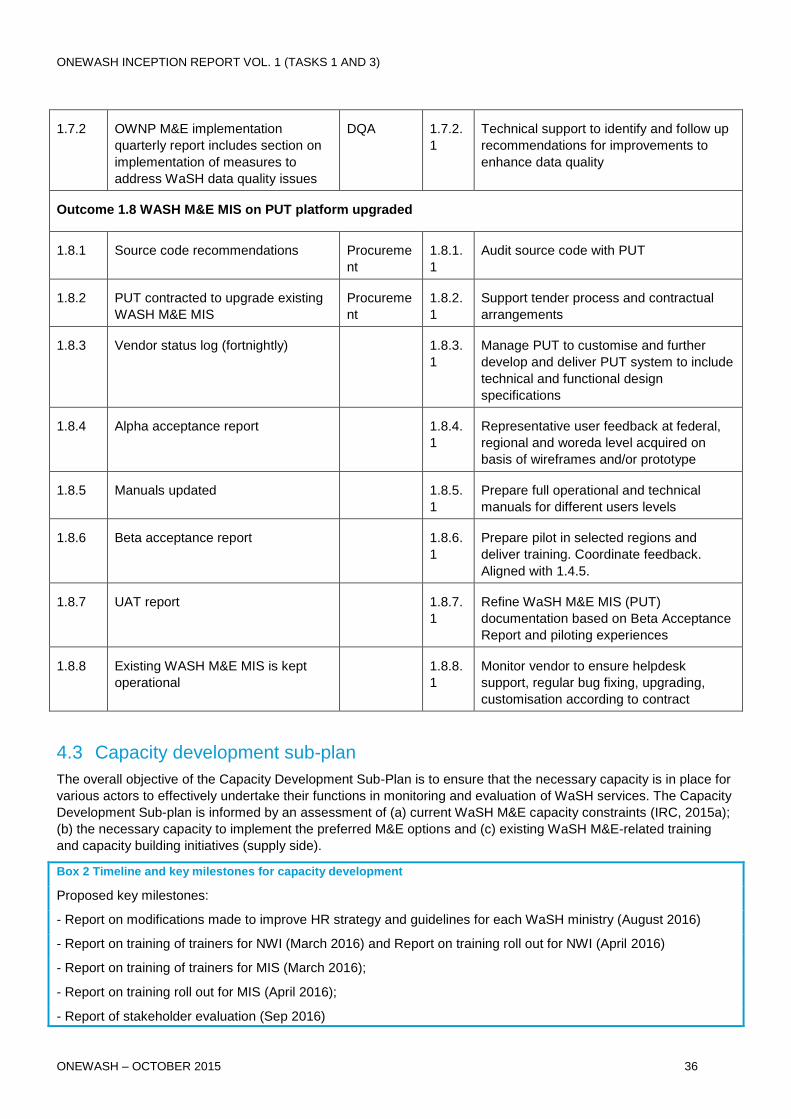
ONEWASH INCEPTION REPORT VOL. 1 (TASKS 1 AND 3)
ONEWASH – OCTOBER 2015 36
1.7.2 OWNP M&E implementation
quarterly report includes section on
implementation of measures to
address WaSH data quality issues
DQA 1.7.2.
1
Technical support to identify and follow up
recommendations for improvements to
enhance data quality
Outcome 1.8 WASH M&E MIS on PUT platform upgraded
1.8.1 Source code recommendations Procureme
nt
1.8.1.
1
Audit source code with PUT
1.8.2 PUT contracted to upgrade existing
WASH M&E MIS
Procureme
nt
1.8.2.
1
Support tender process and contractual
arrangements
1.8.3 Vendor status log (fortnightly) 1.8.3.
1
Manage PUT to customise and further
develop and deliver PUT system to include
technical and functional design
specifications
1.8.4 Alpha acceptance report 1.8.4.
1
Representative user feedback at federal,
regional and woreda level acquired on
basis of wireframes and/or prototype
1.8.5 Manuals updated 1.8.5.
1
Prepare full operational and technical
manuals for different users levels
1.8.6 Beta acceptance report 1.8.6.
1
Prepare pilot in selected regions and
deliver training. Coordinate feedback.
Aligned with 1.4.5.
1.8.7 UAT report 1.8.7.
1
Refine WaSH M&E MIS (PUT)
documentation based on Beta Acceptance
Report and piloting experiences
1.8.8 Existing WASH M&E MIS is kept
operational
1.8.8.
1
Monitor vendor to ensure helpdesk
support, regular bug fixing, upgrading,
customisation according to contract
4.3 Capacity development sub-plan
The overall objective of the Capacity Development Sub-Plan is to ensure that the necessary capacity is in place for
various actors to effectively undertake their functions in monitoring and evaluation of WaSH services. The Capacity
Development Sub-plan is informed by an assessment of (a) current WaSH M&E capacity constraints (IRC, 2015a);
(b) the necessary capacity to implement the preferred M&E options and (c) existing WaSH M&E-related training
and capacity building initiatives (supply side).
Box 2 Timeline and key milestones for capacity development
Proposed key milestones:
- Report on modifications made to improve HR strategy and guidelines for each WaSH ministry (August 2016)
- Report on training of trainers for NWI (March 2016) and Report on training roll out for NWI (April 2016)
- Report on training of trainers for MIS (March 2016);
- Report on training roll out for MIS (April 2016);
- Report of stakeholder evaluation (Sep 2016)
ONEWASH INCEPTION REPORT VOL. 1 (TASKS 1 AND 3)
ONEWASH – OCTOBER 2015 37
- Training completion reports (for each training workshop) (2016, 2017, and 2018)
- Report on revision of training curricula (November 2016)
4.3.1 Key findings: capacity issues in OWNP M&E
From a review of WaSH sector capacity analyses produced over the last five years (Jones, 2015; NWCO 2014;
Birhane et al., 2013 and Evidence on Demand, 2013), together with the findings of federal and regional
consultations comprising at least sixty (60) key informant interviews, the main capacity gaps and constraints with
direct relevance to WaSH M&E are summarised as follows:
Inter-sectoral collaboration and coordination: Limited integration, coordination and harmonisation between
water, health, finance and education sectors at all levels especially sub-federal; collaborative structures such as
WaSH steering committees and WaSH Coordination offices are not yet established in most regions and woredas;
RWCOs have limited convening power and mandate except through the MoU which currently has little traction
below federal level; and very limited support from NWCO which has its own capacity constraints.
Human Resources Development (HRD): M&E staffing and training not prioritised; high staff turnover; numerous
vacant positions (managerial, technical, expert and support); limited or no financial resources and opportunities to
build staff M&E capacity; low levels of skills in M&E and in IT. There is greater capacity in health and education
M&E, but WaSH is not a focus or core competence in these sectors; there is a lack of systematic induction for M&E
personnel in regional, zonal and woreda WaSH sector offices. The most critical HRD gaps are in water M&E.
Policy knowledge: Limited understanding of national policies, strategies and targets and their local relevance at
sub-federal levels, including about the OWNP, the MoU and the division of mandates, roles and functions of
different stakeholders, plus a lack of system(s) for handing over and sharing knowledge, guidelines and other
materials with colleagues at all levels.
Physical capacity: Although ICT equipment is available at regional level, its use is hindered by a shortage of skills
to manage and use it effectively. A lack of ICT facilities and equipment is notable from woreda level downwards.
There are clear IT skills and systems constraints at all levels. Lack of vehicles further hinders both M&E and
collaborative efforts.
Process and system constraints: Poor budget utilisation is linked to delays in transfer of funds; slow
procurement procedures; inefficient management and operational systems; weak reporting systems. There is
limited reporting of reliable data from woreda to zone, from zone to region, and from region to federal. Reports are
prepared manually by calculator which is time consuming and lends itself to error. Systematic monitoring for
improved planning and reporting is not yet a routine. There appears to be a lack of standardised time schedules,
reporting formats and regular meetings to analyse data and to take data-based decisions (IRC/ Coffey, 2015). Most
M&E efforts have failed to make a clear link between the decisions that need to be taken and the data needed.
There is a tendency to over-collect data; existing data are not being used; the capacity and the systems to analyse,
interpret and respond to data collected at the appropriate levels are not in place in particular not at the woreda
level; standard processes, forms and procedures for using data are weak (IRC/ Coffey, 2015).
Priority skills gaps: Understanding, verifying and analysing WaSH data (including WaSH in schools) at all levels
and across sectors; identifying corrective actions to address problems, and IT skills such as the use and
management of Excel. Limited knowledge of sanitation and hygiene significantly impacts on health official’s ability
to gather and analyse monitoring data and to compile accurate reports. Education departments are primarily
concerned with education-related targets, and the positive correlation between improved WaSH and achieving
education targets is not well known.
Training supply gaps: Training on WaSH M&E seems to be sparse to non-existent, and where training exists it's
on M&E generally and theoretically, plus there is a general bias towards water over sanitation and hygiene
monitoring; there is not a system in place to update training when M&E systems are updated in keeping with sector
changes, and training materials are usually not available in local languages and are either not provided or not
commensurate with the level of trainee groups. TVETCs and HSCs lack awareness of WaSH policies and
strategies and there is no link between M&E and WaSH content; inadequate or non-existent linkages within TVETC
departments with the wider WaSH sector; weak curriculum development and pedagogical skills amongst teaching
staff and few mechanisms for feedback on training or on trainee’s performance or satisfaction.
ONEWASH INCEPTION REPORT VOL. 1 (TASKS 1 AND 3)
ONEWASH – OCTOBER 2015 38
4.3.2 Approach to capacity development
Based on the findings of our assessment, the key elements in our proposed approach to capacity development are:
Keep it practical: Adopt a practical, learning-by-doing approach where mentorship and supportive supervision,
and stronger links between actors are employed as key capacity building strategies.
Training materials: Training and materials are relevant to people’s M&E roles and that they are able to apply the
training (i.e. the necessary resources and opportunities are in place) afterwards. Practical training guidance
materials (handouts) are to be developed in local languages and made available to current and future trainees.
Build on what works and on what exists: Review M&E components of existing training initiatives and update
them continuously in keeping with improved OWNP M&E system and sector changes (also refer to the synergy
sub-plan for this principle in action).
Beyond training: Training is only one way to build capacity. Tools, harmonised systems and reporting formats,
reference materials, joint problem analysis, knowledge exchanges, mentorship, supportive supervision, joint
learning are all capacity strengthening mechanisms. Training is often necessary to equip people to perform tasks
and fulfil roles and mandates, but it is seldom (possibly never) sufficient as a measure to address capacity
constraints.
HRD Strategies: Unless the right people are in the right places with the right incentives, motivation and
performance measures, the absorptive capacity for training and skills development will be limited. Proper Human
Resources Development (HRD) strategies are needed, and are a critical component of institutional capacity.
However, the intention is not to write new long strategy documents but to focus on applying improvements in
practice based on existing strategies and incremental improvements. Training is therefore not a panacea and will
not resolve deeper institutional or HRD strategy related constraints and issues. Incentives may also include awards
or prizes for ‘best-performing’ woredas in data collection and use.
Targeted: Capacity support should be targeted in order to address the gaps in systems, resources, skills,
information, knowledge and procedures that constrain the fulfilment of roles and functions. Clear definitions of
capacity gaps enable the identification of capacity development outcomes and indicators against which the efficacy
of capacity development activities can be measured and monitored.
Linked to phasing: The project activities are phased so that the M&E system is rolled out in higher capacity
regions first, while intensive capacity development efforts are targeted at lower capacity regions, with the ultimate
aim of bringing all regions to the level of functional M&E by the end of the project.
The strategy proposed focuses on both the demand and supply sides of capacity development. On the demand
side, it aims to put the necessary human and physical resources in place for effective M&E within each sector, and
to strengthen the ability of all sector actors to collect, analyse, use and disseminate WaSH data. On the supply
side, the strategy aims to enhance the WaSH content of M&E training currently offered by TVETs and HSCs in
order to improve the knowledge of education, health and water sector professionals with respect to the positive
impacts of integrated WaSH on progress within their own sectors.
Existing training related to M&E in all TVETs and HSCs has been reviewed (IRC, 2015a). From this analysis, it is
clear that the M&E training currently does not integrate sector content (in health, water or education) with broad
and general M&E training. The strategy will therefore integrate a WaSH module into the EMIS, HMIS and water
training curricula of TVETCs and HSCs, and include an M&E module in the water training curricula, which will
address methods and means to collect, process, update, edit and use M&E data.
The training Modules and training of trainers course developed and conducted in keeping with this strategy will also
be integrated into M&E-related capacity building processes and initiatives in place or envisaged within MoWIE,
MoH, MoE, MoFED, supported by AfDB, World Bank, and CBPF.
There are opportunities to learn from other countries and a learning exchange with Uganda is proposed focused on
dissemination of WaSH M&E data through a WaSH atlas and other means and constraints to use of that data.
Other countries such as Uganda, Kenya, Ghana and others have rich experience with respect to introduction of ICT
and mobile technologies and these may be accessed through development of links with the Rural Water Supply
Network mapping group and its electronic platforms, the GMSA and others.
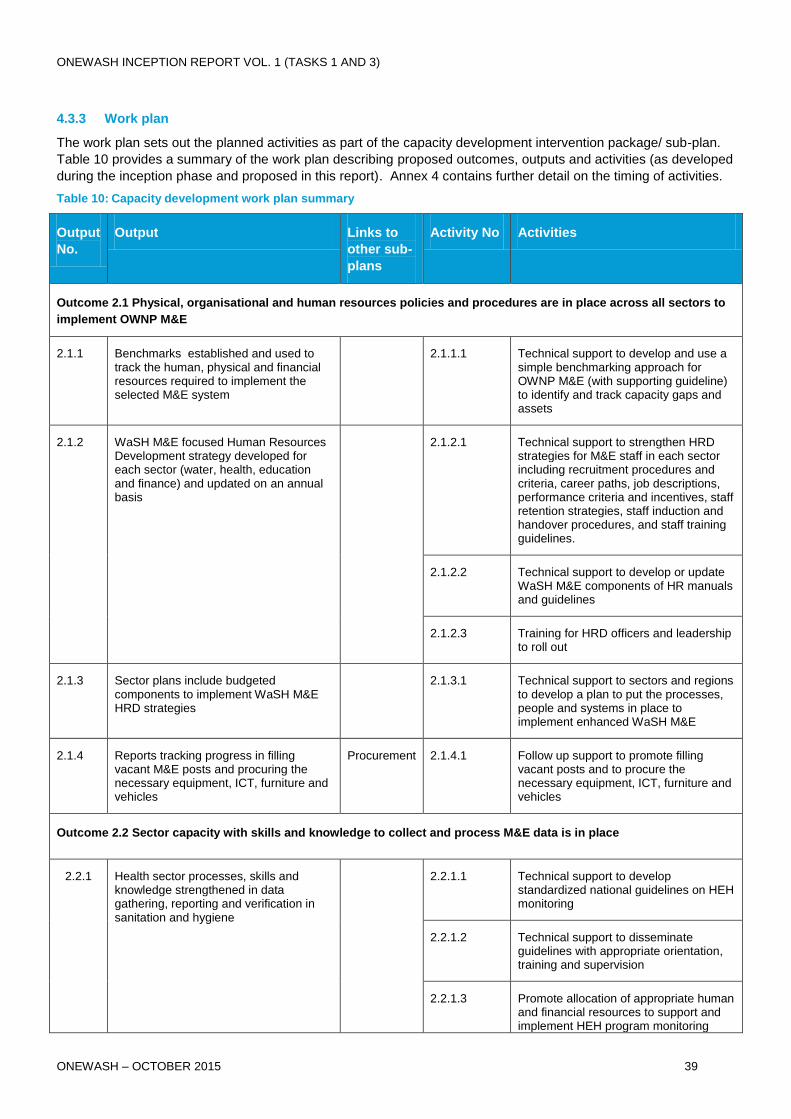
ONEWASH INCEPTION REPORT VOL. 1 (TASKS 1 AND 3)
ONEWASH – OCTOBER 2015 39
4.3.3 Work plan
The work plan sets out the planned activities as part of the capacity development intervention package/ sub-plan.
Table 10 provides a summary of the work plan describing proposed outcomes, outputs and activities (as developed
during the inception phase and proposed in this report). Annex 4 contains further detail on the timing of activities.
Table 10: Capacity development work plan summary
Output
No.
Output Links to
other sub-
plans
Activity No Activities
Outcome 2.1 Physical, organisational and human resources policies and procedures are in place across all sectors to
implement OWNP M&E
2.1.1 Benchmarks established and used to track the human, physical and financial resources required to implement the selected M&E system
2.1.1.1 Technical support to develop and use a simple benchmarking approach for OWNP M&E (with supporting guideline) to identify and track capacity gaps and assets
2.1.2
WaSH M&E focused Human Resources Development strategy developed for each sector (water, health, education and finance) and updated on an annual basis
2.1.2.1 Technical support to strengthen HRD strategies for M&E staff in each sector including recruitment procedures and criteria, career paths, job descriptions, performance criteria and incentives, staff retention strategies, staff induction and handover procedures, and staff training guidelines.
2.1.2.2 Technical support to develop or update WaSH M&E components of HR manuals and guidelines
2.1.2.3 Training for HRD officers and leadership to roll out
2.1.3 Sector plans include budgeted components to implement WaSH M&E HRD strategies
2.1.3.1 Technical support to sectors and regions to develop a plan to put the processes, people and systems in place to implement enhanced WaSH M&E
2.1.4 Reports tracking progress in filling vacant M&E posts and procuring the necessary equipment, ICT, furniture and vehicles
Procurement 2.1.4.1 Follow up support to promote filling vacant posts and to procure the necessary equipment, ICT, furniture and vehicles
Outcome 2.2 Sector capacity with skills and knowledge to collect and process M&E data is in place
2.2.1 Health sector processes, skills and knowledge strengthened in data gathering, reporting and verification in sanitation and hygiene
2.2.1.1 Technical support to develop standardized national guidelines on HEH monitoring
2.2.1.2 Technical support to disseminate guidelines with appropriate orientation, training and supervision
2.2.1.3 Promote allocation of appropriate human and financial resources to support and implement HEH program monitoring
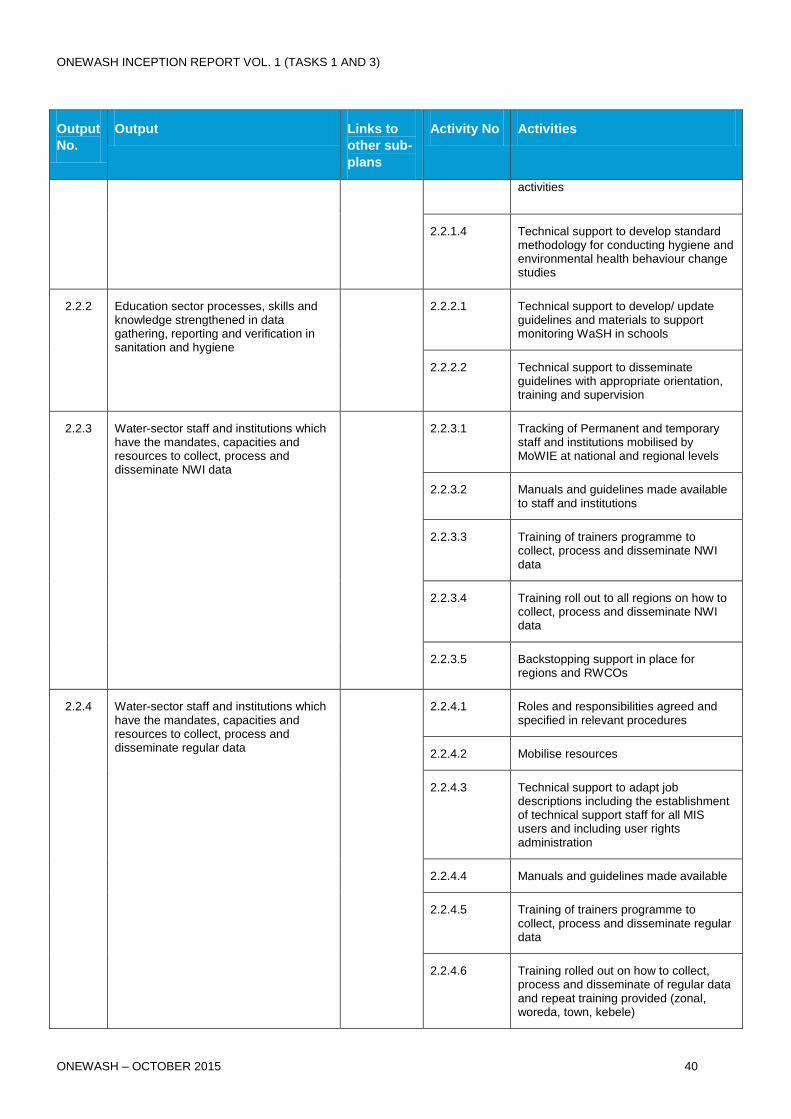
ONEWASH INCEPTION REPORT VOL. 1 (TASKS 1 AND 3)
ONEWASH – OCTOBER 2015 40
Output
No.
Output Links to
other sub-
plans
Activity No Activities
activities
2.2.1.4 Technical support to develop standard methodology for conducting hygiene and environmental health behaviour change studies
2.2.2 Education sector processes, skills and knowledge strengthened in data gathering, reporting and verification in sanitation and hygiene
2.2.2.1 Technical support to develop/ update guidelines and materials to support monitoring WaSH in schools
2.2.2.2 Technical support to disseminate guidelines with appropriate orientation, training and supervision
2.2.3 Water-sector staff and institutions which have the mandates, capacities and resources to collect, process and disseminate NWI data
2.2.3.1 Tracking of Permanent and temporary staff and institutions mobilised by MoWIE at national and regional levels
2.2.3.2 Manuals and guidelines made available to staff and institutions
2.2.3.3 Training of trainers programme to collect, process and disseminate NWI data
2.2.3.4 Training roll out to all regions on how to collect, process and disseminate NWI data
2.2.3.5 Backstopping support in place for regions and RWCOs
2.2.4 Water-sector staff and institutions which have the mandates, capacities and resources to collect, process and disseminate regular data
2.2.4.1 Roles and responsibilities agreed and specified in relevant procedures
2.2.4.2 Mobilise resources
2.2.4.3 Technical support to adapt job descriptions including the establishment of technical support staff for all MIS users and including user rights administration
2.2.4.4 Manuals and guidelines made available
2.2.4.5 Training of trainers programme to collect, process and disseminate regular data
2.2.4.6 Training rolled out on how to collect, process and disseminate of regular data and repeat training provided (zonal, woreda, town, kebele)

ONEWASH INCEPTION REPORT VOL. 1 (TASKS 1 AND 3)
ONEWASH – OCTOBER 2015 41
Output
No.
Output Links to
other sub-
plans
Activity No Activities
2.2.4.7 Backstopping support in place
2.2.4.8 Stakeholder evaluation of MIS performance in reporting
Outcome 2.3 Impact evaluations more widely used to inform WaSH planning and decision-making
2.3.1 NWCO are able to scope, procure, manage and utilise impact evaluations.
2.3.1.1 Technical support to develop guidance materials for WaSH impact evaluations
2.3.1.2 Orientation workshop and follow up to use guidelines
Outcome 2.4 Sector capacity to interpret, use and disseminate data and data products is in place
2.4.1 Capacities built to analyse, interpret and use WaSH data in operational response
2.4.1.1 Training of WWTs in using the data from the Management Information Systems for operational responses in the woreda
2.4.1.2 Series of workshops to promote use and sharing of data by managers
2.4.2 Capacities built at woreda, zonal, regional and federal levels to generate and use data reports for reporting and planning
2.4.2.1 Training in the use of reporting tools and functions
2.4.3 Capacities in handling data requests built 2.4.3.1 Training and technical support to RWCO and NWCO to handle data requests
2.4.4 Capacities built in all aspects of producing the federal OWNP report
2.4.4.1 Tailored training and mentorship to the NWCO on data collection, collation, harmonisation, analysis and report writing
2.4.5 Capacities of the Atlas team built to manage the production of the Atlas
2.4.5.1 Tailored training and mentorship9 to the
NWCO to scope the production of the Atlas, and to procure and provide oversight and quality control to a communications consultant to produce the Atlas.
Mentorship and training to include a learning exchange with Government of Uganda
2.4.6 Capacities built for outreach strategy and for development of outreach products (briefing papers, news, website etc.)
2.4.6.1 Internal training and coaching of the outreach team
2.4.6.2 External tailored training of the outreach team
9 The terms mentorship, coaching and supportive supervision are used interchangeably to denote a continuum of hands-on support. These
kinds of capacity development activities usually incorporate tailored training

ONEWASH INCEPTION REPORT VOL. 1 (TASKS 1 AND 3)
ONEWASH – OCTOBER 2015 42
Output
No.
Output Links to
other sub-
plans
Activity No Activities
Outcome 2.5 WaSH M&E training and capacity development supply is in place
2.5.1 WaSH modules are included in EMIS and HMIS training curricula, and in Water training curricula.
2.5.1.1 Develop WaSH modules (training guide, learner materials, learning evaluation tools) (duration 2 days maximum)
2.5.1.2 Workshop with TVETCs and HSCs regarding how to integrate WaSH Module into EMIS, HMIS and Water curricula
2.5.1.3 Train TVETC and HSC Trainers to offer the WaSH Modules
2.5.2 M&E module included in Water training curricula, addressing methods and means to collect, process, update, edit and use M&E data.
2.5.2.1 Develop M&E Module (training guide, learner materials, learning evaluation tools)
2.5.2.2 Workshop with TVETCs and HSCs regarding how to integrate WaSH Module into EMIS, HMIS and Water curricula
2.5.2.3 Train TVETC and HSC Trainer to offer M&E Module
Table 11 summarises indicative capacity development sub-plan outcomes and is included here to assist with
mobilizing prospective donors to support these activities. Note that terms such as mentorship, coaching and
supportive supervision are used to denote a continuum of hands-on support. These kinds of capacity development
activities incorporate tailored training.
Table 11: Capacity Development: Indicative areas and learning outcomes
Learning outcomes Methodology Trainee groups
Improved knowledge and skills to gather, verify and report sanitation and hygiene data
Tailored training linked to guideline and or tools development, technical support and supportive supervision
NWCO and team; Education and Health staff at national and regional levels
Improved knowledge and skills to gather, verify and disseminate NWI data
Training trainers at federal level followed by regional roll out
Water sector staff and institutions
Improved knowledge and skills to gather, verify and disseminate regular data
Training trainers at federal level followed by regional roll out
Water sector staff and institutions
Replicable ability to scope, procure, manage and use WaSH impact evaluations
Tailored training linked to guideline and or tools development, and mentorship
NWCO and team
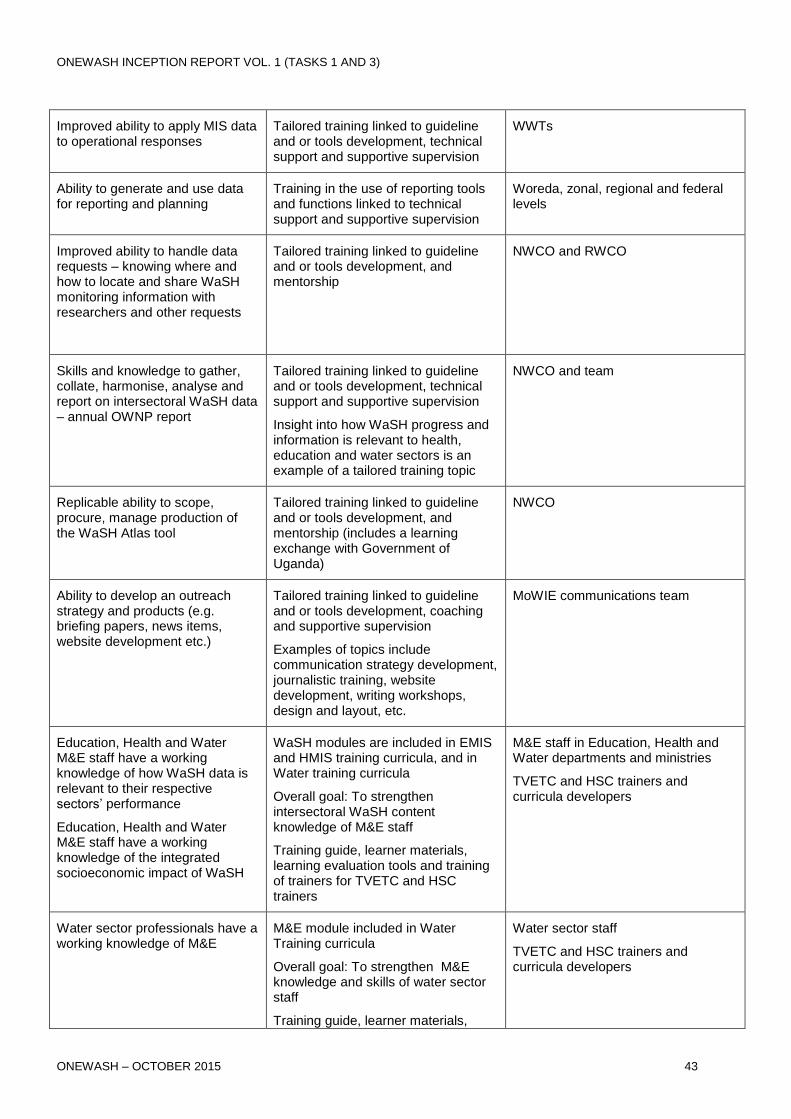
ONEWASH INCEPTION REPORT VOL. 1 (TASKS 1 AND 3)
ONEWASH – OCTOBER 2015 43
Improved ability to apply MIS data to operational responses
Tailored training linked to guideline and or tools development, technical support and supportive supervision
WWTs
Ability to generate and use data for reporting and planning
Training in the use of reporting tools and functions linked to technical support and supportive supervision
Woreda, zonal, regional and federal levels
Improved ability to handle data requests – knowing where and how to locate and share WaSH monitoring information with researchers and other requests
Tailored training linked to guideline and or tools development, and mentorship
NWCO and RWCO
Skills and knowledge to gather, collate, harmonise, analyse and report on intersectoral WaSH data – annual OWNP report
Tailored training linked to guideline and or tools development, technical support and supportive supervision
Insight into how WaSH progress and information is relevant to health, education and water sectors is an example of a tailored training topic
NWCO and team
Replicable ability to scope, procure, manage production of the WaSH Atlas tool
Tailored training linked to guideline and or tools development, and mentorship (includes a learning exchange with Government of Uganda)
NWCO
Ability to develop an outreach strategy and products (e.g. briefing papers, news items, website development etc.)
Tailored training linked to guideline and or tools development, coaching and supportive supervision
Examples of topics include communication strategy development, journalistic training, website development, writing workshops, design and layout, etc.
MoWIE communications team
Education, Health and Water M&E staff have a working knowledge of how WaSH data is relevant to their respective sectors’ performance
Education, Health and Water M&E staff have a working knowledge of the integrated socioeconomic impact of WaSH
WaSH modules are included in EMIS and HMIS training curricula, and in Water training curricula
Overall goal: To strengthen intersectoral WaSH content knowledge of M&E staff
Training guide, learner materials, learning evaluation tools and training of trainers for TVETC and HSC trainers
M&E staff in Education, Health and Water departments and ministries
TVETC and HSC trainers and curricula developers
Water sector professionals have a working knowledge of M&E
M&E module included in Water Training curricula
Overall goal: To strengthen M&E knowledge and skills of water sector staff
Training guide, learner materials,
Water sector staff
TVETC and HSC trainers and curricula developers
ONEWASH INCEPTION REPORT VOL. 1 (TASKS 1 AND 3)
ONEWASH – OCTOBER 2015 44
learning evaluation tools and training of trainers for TVETC and HSC trainers
4.4 Procurement sub-plan
The procurement sub-plan focuses on the procurement of ICT to support the WaSH M&E system. The envisaged
procurement activities include:
1. Procurement of improvements to existing WaSH M&E MIS with a focus on its redefined scope to support
operationalisation.
2. Procurement of an ICT solution using commercial off-the-shelf software (COTS) and associated services to
support mobile data collection based on technical and functional requirements set out in section 4,
including the management of devices and data, with both online and offline functionality.
3. Procurement of alternative WaSH M&E MIS software using commercial off-the-shelf software (COTS),
which will provide an alternative option to store, analyse and report on WaSH data.
4. Procurement of related ICT hardware and associated maintenance services including servers, computers,
mobile phones or alternative field data collection devices, and field based support for the hardware, based
on the requirements of MIS and mobile data collection ICT solutions selected.
Box 3 Key milestones related to procurement
Proposed key milestones related to procurement are:
- Tender documents for alternate MIS software (December 2015)
- Tender documents for mobile data collection software (December 2015)
- Tender documents for modifications to existing WaSH M&E MIS software (December 2015)
It is recommended that procurement of improvements to the existing WaSH M&E MIS will be through a restricted
tender as only the existing supplier will be able to undertake these improvements at limited cost.
Our recommendation is to combine the procurement for the alternative MIS software (3) and mobile data collection
(2) solutions. After the selection of the alternative MIS solution, there will be server and client device specifications
outlined and procurement started for additionally required computers and/or servers. However, wherever possible
hardware that has already been procured for the WaSH M&E MIS will be utilised. After the selection of the mobile
data collection solution, there will be mobile data collection device specifications outlined and procurement started
for additional required hardware.
It is recommended that procurement of software is undertaken in line with World Bank ICT procurement guidelines.
These are well proven and considered the most appropriate for software procurement for government systems.
4.4.1 Procurement Capacity Assessment
4.4.1.1 Procurement capacity and risks
The MoWIE has a procurement specialist within the Water and Sanitation Directorate who is experienced in
procurement in line with Ethiopian government procurement regulations. The MoWIE has recent experience in
procurement of ICT from Ethiopian suppliers (PUT) and international suppliers (Akvo), and senior staff has been
exposed to the challenges of handling such procurement processes. It is suggested to incorporate the capacity
within the IT team to support procurement and aid in the assessment of the effort and risks involved in supporting
and maintaining any potential solution. This is to ensure that in-house (MoWIE) capacity is used to largest extent
possible and taking into account current rates of turn over. There is also the potential for NWCO to draw upon
capacity from MIS staff within other ministries as links are strengthened.
There is additional procurement capacity available within the DFID supported OWNP M&E support team. This
includes experience in procuring ICT solutions on the international market for WaSH applications and in the
development of ICT solutions for WaSH applications. Further capacity is available within development partners –
such as the World Bank, the African Development Bank and UNICEF - and this will be applicable where such

ONEWASH INCEPTION REPORT VOL. 1 (TASKS 1 AND 3)
ONEWASH – OCTOBER 2015 45
partners support certain aspects of WaSH M&E requirements in line with their own procurement regulations. This
will depend upon decisions made with respect to sources of financing.
The most recent experience of ICT procurement for the WaSH M&E MIS, which began in 2008, has not yet rolled
out an MIS solution which is used at regional and woreda levels. Repeating this experience is considered avoidable
and challenges can be minimised during the procurement process by applying the ICT principles outlined in this
inception report. In addition, an experienced ICT project manager with the mandate to report to the project
stakeholders is an important risk mitigation measure. This ICT and WaSH project manager should be responsible
for both the MIS and mobile data collection tool development and should be consulted at all steps during the
procurement.
Table 12 identifies procurement risks and suggests mitigation measures. Some highlighted risk mitigation
measures that will need to be addressed prior to procurement include:
Setting out clear terms and conditions for the suppliers and setting out clear roles and responsibilities for
the solution development, configuration and post-implementation support. This should also include a role
for MoWIE staff that can be easily maintained.
Configuring, developing and user testing of the solutions under the supervision of an experienced
(including WaSH sector expertise) ICT project manager who can translate the expressed needs of
stakeholders and the problems faced by users into remedial actions within the scope of the project and
within the expected timeframe. The project manager should be able to work with all stakeholders to ensure
the project is on track and that the scope, roles and responsibilities are clear and any changes are clearly
communicated. They will need to be able to report directly to MoWIE and a stakeholder group where
decisions can be discussed.
Defining a minimum service level agreement (SLA) which must be in place, to reduce the risk of early
failure after implementation. The SLA will include clear and easily accessible technical support channels for
both administrators and users.
Identifying and agreeing on required support from OWNP M&E support team and other stakeholders with
technical support capacity, for example development partners. The ICT project manager will be provided as
part of this team from IRC (under task 1).
Agreeing the scope of the software will be respected by all parties until the software development is
finished. The effort required for software development can be highly dependent on minor changes to the
scope and may put the project at risk.
Ensuring that user testing is part of the procurement requirements and that each round of successful
testing is also a requirement for payment for that phase, for example alpha, beta and release user
acceptance testing, will reduce the risk that users cannot adopt the tool after it is implemented.
The procurement process should clearly identify the roles of potential bidders, MoWIE and OWNP M&E support
team in the technical project management and should ensure that the bidders will work together with all
stakeholders to ensure that the development and user testing is completed at a high standard and without delay. It
is recommended to form a stakeholder group with the project owner (MoWIE), the project technical manager
(potentially OWNP M&E support team), and providers as well as any other key stakeholders, such as donors.
Table 12: Procurement risks (and recommended mitigation measures)
Risk Explanation Mitigation measures
Unclear requirements Often unclear requirements lead to
disagreements about agreed functionality
and cause delays and cost over runs.
It is important to provide unambiguous
minimum requirements and accept to
remove less important requirements that
add to the application complexity. Ensure
these requirements also include the SLA
for annual maintenance and upgrades.
Incompatibility in integration between
separate solutions
Having separate solutions for the
database and mobile data collection
means that there is a risk of dependency
Define the minimum import/export
functionalities that must be present using
standard technologies (CSV) and
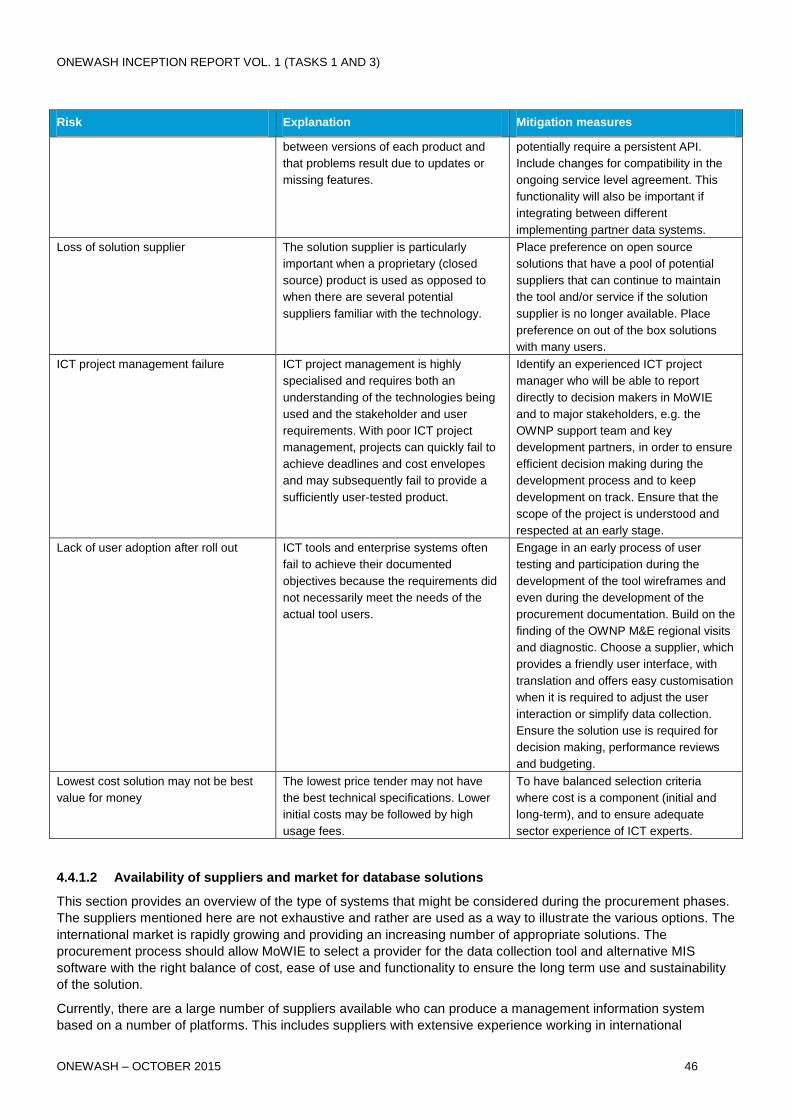
ONEWASH INCEPTION REPORT VOL. 1 (TASKS 1 AND 3)
ONEWASH – OCTOBER 2015 46
Risk Explanation Mitigation measures
between versions of each product and
that problems result due to updates or
missing features.
potentially require a persistent API.
Include changes for compatibility in the
ongoing service level agreement. This
functionality will also be important if
integrating between different
implementing partner data systems.
Loss of solution supplier The solution supplier is particularly
important when a proprietary (closed
source) product is used as opposed to
when there are several potential
suppliers familiar with the technology.
Place preference on open source
solutions that have a pool of potential
suppliers that can continue to maintain
the tool and/or service if the solution
supplier is no longer available. Place
preference on out of the box solutions
with many users.
ICT project management failure ICT project management is highly
specialised and requires both an
understanding of the technologies being
used and the stakeholder and user
requirements. With poor ICT project
management, projects can quickly fail to
achieve deadlines and cost envelopes
and may subsequently fail to provide a
sufficiently user-tested product.
Identify an experienced ICT project
manager who will be able to report
directly to decision makers in MoWIE
and to major stakeholders, e.g. the
OWNP support team and key
development partners, in order to ensure
efficient decision making during the
development process and to keep
development on track. Ensure that the
scope of the project is understood and
respected at an early stage.
Lack of user adoption after roll out ICT tools and enterprise systems often
fail to achieve their documented
objectives because the requirements did
not necessarily meet the needs of the
actual tool users.
Engage in an early process of user
testing and participation during the
development of the tool wireframes and
even during the development of the
procurement documentation. Build on the
finding of the OWNP M&E regional visits
and diagnostic. Choose a supplier, which
provides a friendly user interface, with
translation and offers easy customisation
when it is required to adjust the user
interaction or simplify data collection.
Ensure the solution use is required for
decision making, performance reviews
and budgeting.
Lowest cost solution may not be best
value for money
The lowest price tender may not have
the best technical specifications. Lower
initial costs may be followed by high
usage fees.
To have balanced selection criteria
where cost is a component (initial and
long-term), and to ensure adequate
sector experience of ICT experts.
4.4.1.2 Availability of suppliers and market for database solutions
This section provides an overview of the type of systems that might be considered during the procurement phases.
The suppliers mentioned here are not exhaustive and rather are used as a way to illustrate the various options. The
international market is rapidly growing and providing an increasing number of appropriate solutions. The
procurement process should allow MoWIE to select a provider for the data collection tool and alternative MIS
software with the right balance of cost, ease of use and functionality to ensure the long term use and sustainability
of the solution.
Currently, there are a large number of suppliers available who can produce a management information system
based on a number of platforms. This includes suppliers with extensive experience working in international
ONEWASH INCEPTION REPORT VOL. 1 (TASKS 1 AND 3)
ONEWASH – OCTOBER 2015 47
development providing understanding of the contextual factors that affect these technologies. Some of these
companies are based in countries that can provide lower cost software development.
These providers would be able to provide alternative WaSH M&E MIS solutions. An advantage is that these
providers will provide a high level of customisation and can introduce complex data flows and data checks.
However, most often configuration and subsequent changes to the database and software upgrades will involve
additional (hidden) costs and complexity.
There are also a few cloud-based products that can provide similar functionality and can be configured through the
user interface to build a relational database like the WaSH M&E MIS. These do not offer the same level of control
but often provide some flexibility. For example, solutions available include the ability to create relationships
between datasets that are collected. An example might be an enumerator adding a new water point to the
database while in the field and being able to select the water service provider from a list of previously submitted
service providers. The list of service providers is in fact just another survey. It should be noted that this field
technology depends on synchronising with a database online. Other data collection tools enable users to define
relationships between indicators and to publish pivot tables on an online dashboard or to export results to various
digital and print formats. These systems have the advantage of being configurable by the administrators but
depend on the competency of these individuals after the initial software development is completed.
Some of the mobile data collection tools on the market can also be configured to generate visual results that
combine data similarly to how a relational database would, for example dashboards where data from different data
collection forms can be visualised together in a loose way. These visualisations do not have the same enforcement
of relationships and may require additional data cleaning steps. However, they also reduce the complexity of the
software as data collection forms change over time or indicators and visualisations have to change without the
overhead related to managing how each change affects the relationships in the database. There are also
opportunities to seek strategic partnerships with foundations supporting open-source, mobile and other ICT
initiatives.
4.4.1.3 Availability of suppliers and market for mobile data collection solutions
There are a large number of mobile data collection solutions available at this moment. The range is narrowed when
only considering solutions that work offline. There are several solutions frequently used in developing countries
including both single vendor solutions and open source platforms with related suppliers. The latter provides the
advantage of being more widely supported should the particular supplier go bankrupt or otherwise stop providing
the required services. The advantage of choosing a single vender multi-tenant solution comes when there are
many tenants (users) who are purchasing that software and it is likely to continue to be supported and features are
more rapidly updated and tested. Some of the single vendor solutions are also open source and at some cost could
be replicated by a new vendor.
It should be noted, most of the mentioned mobile and MIS solutions also feature an online database and
dashboard. Most of the online dashboard for viewing the data and doing analysis can only be used online. More
unique but available is functionality to synchronise the database into an offline copy in the user’s browser. Any
locally hosted databases or servers will depend on the availability of the local servers and the local internet
connections. In most cases, cloud-based services will have a higher level of availability and lower cost than
managed servers based in a local data centre. All of the above systems provide ways to back up the entire data
store on a regular basis in local servers if required. There are options for the data collection tool to be fully hosted
in Ethiopia if desired and it could be supported by international or local suppliers.
4.4.2 ‘Build or Buy’ Procurement Analysis
The ‘Build-or-buy’ analysis of the enhanced WaSH M&E system is meant to advise DFID and Ethiopian OWNP
stakeholders on the most appropriate approach for procurement of goods and services for the enhanced M&E
system. During procurement, there is a range of possibilities between systems that will require a large amount of
custom build software development hours and others that only require some user interface configuration of an “off
the shelf” tool. In order to present the relative value of building vs. buying, the tables below provide the main pros
and cons. While most solutions will fall in between these extremes, it is recommended that MoWIE consider
configuration of an alternative commercial-off-the-shelf (COTS) software over the building of completely custom
software in order to have more predictable costs over time and reduce the complexity of the software. This applies
to both the mobile data collection solution and alternative MIS software. An off the shelf solution is more likely to be
configurable within the competency of the MoWIE staff and will provide standard support for their software. While
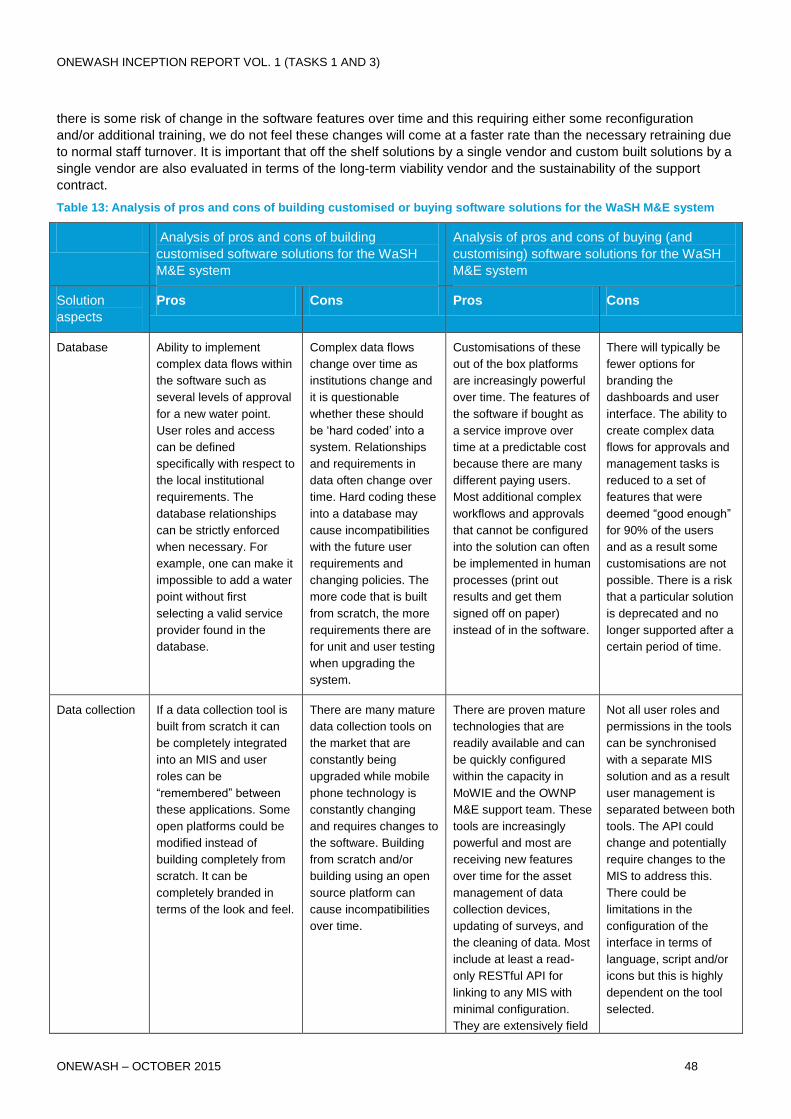
ONEWASH INCEPTION REPORT VOL. 1 (TASKS 1 AND 3)
ONEWASH – OCTOBER 2015 48
there is some risk of change in the software features over time and this requiring either some reconfiguration
and/or additional training, we do not feel these changes will come at a faster rate than the necessary retraining due
to normal staff turnover. It is important that off the shelf solutions by a single vendor and custom built solutions by a
single vendor are also evaluated in terms of the long-term viability vendor and the sustainability of the support
contract.
Table 13: Analysis of pros and cons of building customised or buying software solutions for the WaSH M&E system
Analysis of pros and cons of building
customised software solutions for the WaSH
M&E system
Analysis of pros and cons of buying (and
customising) software solutions for the WaSH
M&E system
Solution
aspects
Pros Cons Pros Cons
Database Ability to implement
complex data flows within
the software such as
several levels of approval
for a new water point.
User roles and access
can be defined
specifically with respect to
the local institutional
requirements. The
database relationships
can be strictly enforced
when necessary. For
example, one can make it
impossible to add a water
point without first
selecting a valid service
provider found in the
database.
Complex data flows
change over time as
institutions change and
it is questionable
whether these should
be ‘hard coded’ into a
system. Relationships
and requirements in
data often change over
time. Hard coding these
into a database may
cause incompatibilities
with the future user
requirements and
changing policies. The
more code that is built
from scratch, the more
requirements there are
for unit and user testing
when upgrading the
system.
Customisations of these
out of the box platforms
are increasingly powerful
over time. The features of
the software if bought as
a service improve over
time at a predictable cost
because there are many
different paying users.
Most additional complex
workflows and approvals
that cannot be configured
into the solution can often
be implemented in human
processes (print out
results and get them
signed off on paper)
instead of in the software.
There will typically be
fewer options for
branding the
dashboards and user
interface. The ability to
create complex data
flows for approvals and
management tasks is
reduced to a set of
features that were
deemed “good enough”
for 90% of the users
and as a result some
customisations are not
possible. There is a risk
that a particular solution
is deprecated and no
longer supported after a
certain period of time.
Data collection If a data collection tool is
built from scratch it can
be completely integrated
into an MIS and user
roles can be
“remembered” between
these applications. Some
open platforms could be
modified instead of
building completely from
scratch. It can be
completely branded in
terms of the look and feel.
There are many mature
data collection tools on
the market that are
constantly being
upgraded while mobile
phone technology is
constantly changing
and requires changes to
the software. Building
from scratch and/or
building using an open
source platform can
cause incompatibilities
over time.
There are proven mature
technologies that are
readily available and can
be quickly configured
within the capacity in
MoWIE and the OWNP
M&E support team. These
tools are increasingly
powerful and most are
receiving new features
over time for the asset
management of data
collection devices,
updating of surveys, and
the cleaning of data. Most
include at least a read-
only RESTful API for
linking to any MIS with
minimal configuration.
They are extensively field
Not all user roles and
permissions in the tools
can be synchronised
with a separate MIS
solution and as a result
user management is
separated between both
tools. The API could
change and potentially
require changes to the
MIS to address this.
There could be
limitations in the
configuration of the
interface in terms of
language, script and/or
icons but this is highly
dependent on the tool
selected.
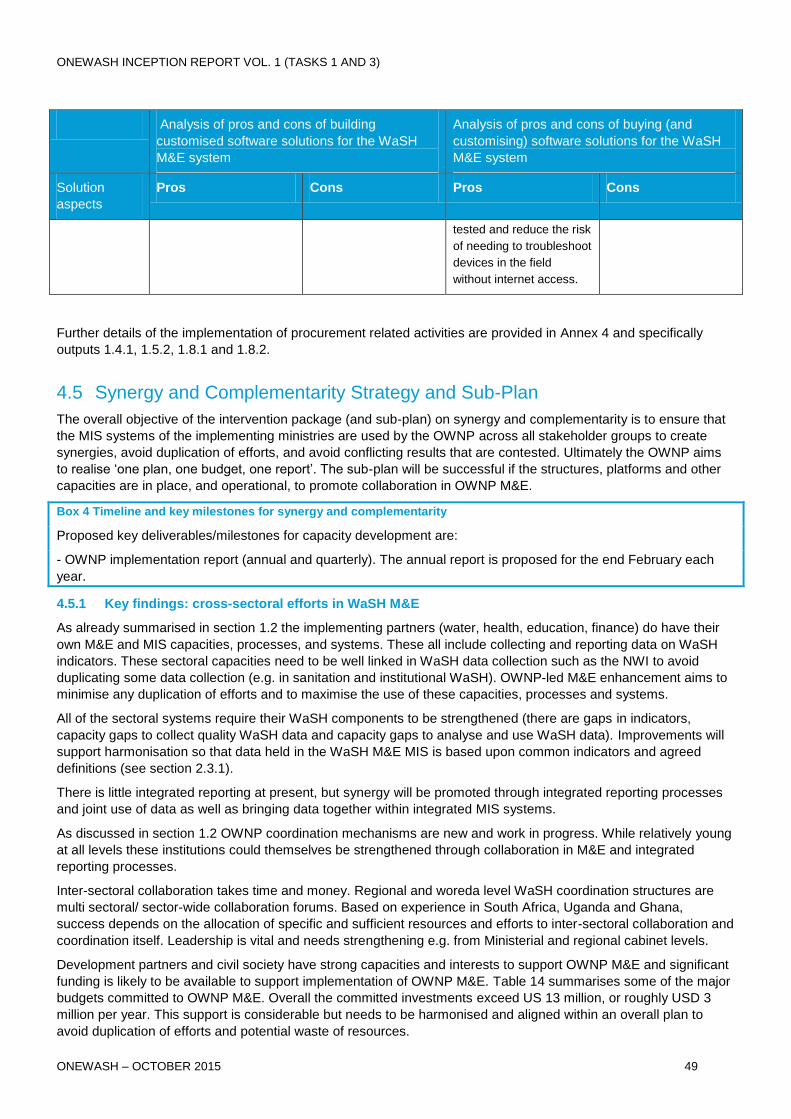
ONEWASH INCEPTION REPORT VOL. 1 (TASKS 1 AND 3)
ONEWASH – OCTOBER 2015 49
Analysis of pros and cons of building
customised software solutions for the WaSH
M&E system
Analysis of pros and cons of buying (and
customising) software solutions for the WaSH
M&E system
Solution
aspects
Pros Cons Pros Cons
tested and reduce the risk
of needing to troubleshoot
devices in the field
without internet access.
Further details of the implementation of procurement related activities are provided in Annex 4 and specifically
outputs 1.4.1, 1.5.2, 1.8.1 and 1.8.2.
4.5 Synergy and Complementarity Strategy and Sub-Plan
The overall objective of the intervention package (and sub-plan) on synergy and complementarity is to ensure that
the MIS systems of the implementing ministries are used by the OWNP across all stakeholder groups to create
synergies, avoid duplication of efforts, and avoid conflicting results that are contested. Ultimately the OWNP aims
to realise ‘one plan, one budget, one report’. The sub-plan will be successful if the structures, platforms and other
capacities are in place, and operational, to promote collaboration in OWNP M&E.
Box 4 Timeline and key milestones for synergy and complementarity
Proposed key deliverables/milestones for capacity development are:
- OWNP implementation report (annual and quarterly). The annual report is proposed for the end February each
year.
4.5.1 Key findings: cross-sectoral efforts in WaSH M&E
As already summarised in section 1.2 the implementing partners (water, health, education, finance) do have their
own M&E and MIS capacities, processes, and systems. These all include collecting and reporting data on WaSH
indicators. These sectoral capacities need to be well linked in WaSH data collection such as the NWI to avoid
duplicating some data collection (e.g. in sanitation and institutional WaSH). OWNP-led M&E enhancement aims to
minimise any duplication of efforts and to maximise the use of these capacities, processes and systems.
All of the sectoral systems require their WaSH components to be strengthened (there are gaps in indicators,
capacity gaps to collect quality WaSH data and capacity gaps to analyse and use WaSH data). Improvements will
support harmonisation so that data held in the WaSH M&E MIS is based upon common indicators and agreed
definitions (see section 2.3.1).
There is little integrated reporting at present, but synergy will be promoted through integrated reporting processes
and joint use of data as well as bringing data together within integrated MIS systems.
As discussed in section 1.2 OWNP coordination mechanisms are new and work in progress. While relatively young
at all levels these institutions could themselves be strengthened through collaboration in M&E and integrated
reporting processes.
Inter-sectoral collaboration takes time and money. Regional and woreda level WaSH coordination structures are
multi sectoral/ sector-wide collaboration forums. Based on experience in South Africa, Uganda and Ghana,
success depends on the allocation of specific and sufficient resources and efforts to inter-sectoral collaboration and
coordination itself. Leadership is vital and needs strengthening e.g. from Ministerial and regional cabinet levels.
Development partners and civil society have strong capacities and interests to support OWNP M&E and significant
funding is likely to be available to support implementation of OWNP M&E. Table 14 summarises some of the major
budgets committed to OWNP M&E. Overall the committed investments exceed US 13 million, or roughly USD 3
million per year. This support is considerable but needs to be harmonised and aligned within an overall plan to
avoid duplication of efforts and potential waste of resources.
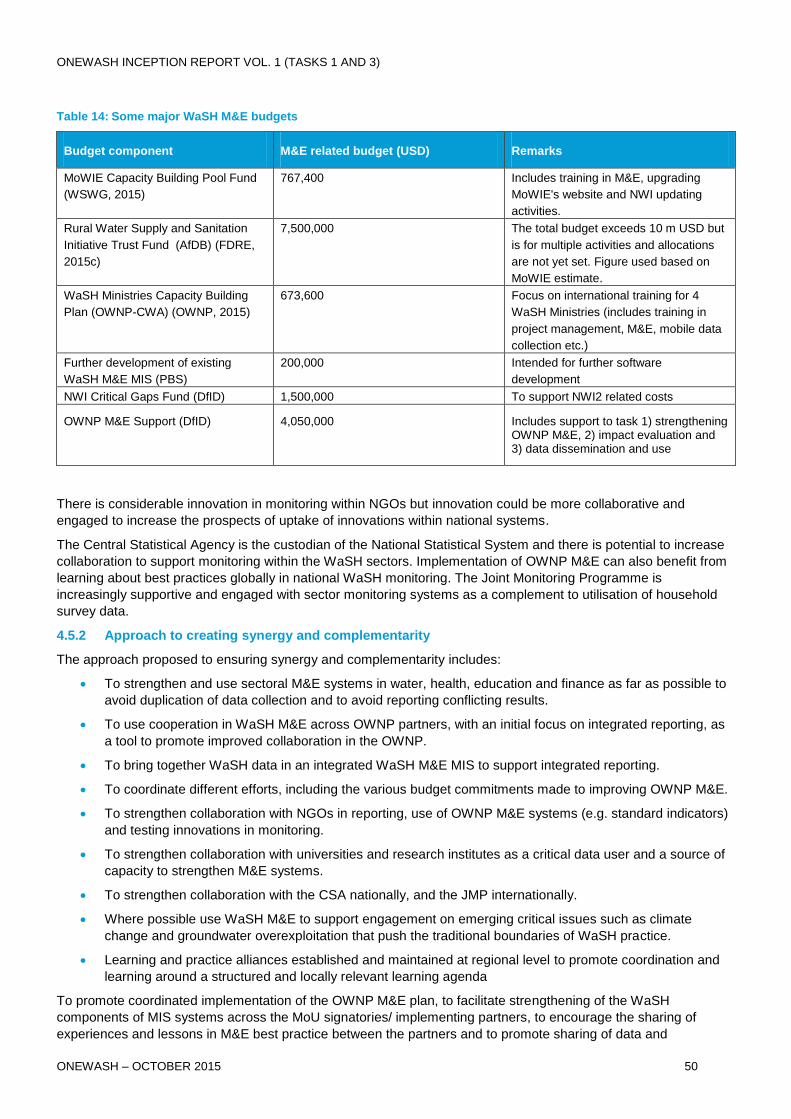
ONEWASH INCEPTION REPORT VOL. 1 (TASKS 1 AND 3)
ONEWASH – OCTOBER 2015 50
Table 14: Some major WaSH M&E budgets
Budget component M&E related budget (USD) Remarks
MoWIE Capacity Building Pool Fund
(WSWG, 2015)
767,400 Includes training in M&E, upgrading
MoWIE's website and NWI updating
activities.
Rural Water Supply and Sanitation
Initiative Trust Fund (AfDB) (FDRE,
2015c)
7,500,000 The total budget exceeds 10 m USD but
is for multiple activities and allocations
are not yet set. Figure used based on
MoWIE estimate.
WaSH Ministries Capacity Building
Plan (OWNP-CWA) (OWNP, 2015)
673,600 Focus on international training for 4
WaSH Ministries (includes training in
project management, M&E, mobile data
collection etc.)
Further development of existing
WaSH M&E MIS (PBS)
200,000 Intended for further software
development
NWI Critical Gaps Fund (DfID) 1,500,000 To support NWI2 related costs
OWNP M&E Support (DfID) 4,050,000 Includes support to task 1) strengthening OWNP M&E, 2) impact evaluation and 3) data dissemination and use
There is considerable innovation in monitoring within NGOs but innovation could be more collaborative and
engaged to increase the prospects of uptake of innovations within national systems.
The Central Statistical Agency is the custodian of the National Statistical System and there is potential to increase
collaboration to support monitoring within the WaSH sectors. Implementation of OWNP M&E can also benefit from
learning about best practices globally in national WaSH monitoring. The Joint Monitoring Programme is
increasingly supportive and engaged with sector monitoring systems as a complement to utilisation of household
survey data.
4.5.2 Approach to creating synergy and complementarity
The approach proposed to ensuring synergy and complementarity includes:
To strengthen and use sectoral M&E systems in water, health, education and finance as far as possible to
avoid duplication of data collection and to avoid reporting conflicting results.
To use cooperation in WaSH M&E across OWNP partners, with an initial focus on integrated reporting, as
a tool to promote improved collaboration in the OWNP.
To bring together WaSH data in an integrated WaSH M&E MIS to support integrated reporting.
To coordinate different efforts, including the various budget commitments made to improving OWNP M&E.
To strengthen collaboration with NGOs in reporting, use of OWNP M&E systems (e.g. standard indicators)
and testing innovations in monitoring.
To strengthen collaboration with universities and research institutes as a critical data user and a source of
capacity to strengthen M&E systems.
To strengthen collaboration with the CSA nationally, and the JMP internationally.
Where possible use WaSH M&E to support engagement on emerging critical issues such as climate
change and groundwater overexploitation that push the traditional boundaries of WaSH practice.
Learning and practice alliances established and maintained at regional level to promote coordination and
learning around a structured and locally relevant learning agenda
To promote coordinated implementation of the OWNP M&E plan, to facilitate strengthening of the WaSH
components of MIS systems across the MoU signatories/ implementing partners, to encourage the sharing of
experiences and lessons in M&E best practice between the partners and to promote sharing of data and
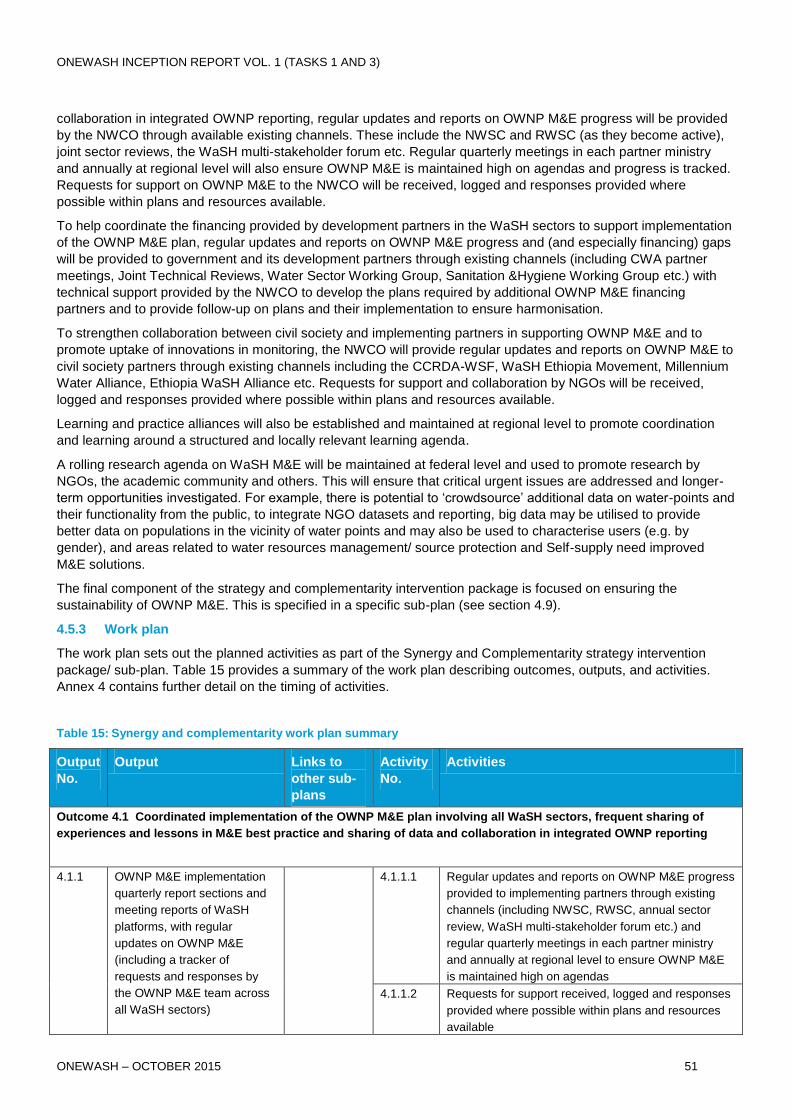
ONEWASH INCEPTION REPORT VOL. 1 (TASKS 1 AND 3)
ONEWASH – OCTOBER 2015 51
collaboration in integrated OWNP reporting, regular updates and reports on OWNP M&E progress will be provided
by the NWCO through available existing channels. These include the NWSC and RWSC (as they become active),
joint sector reviews, the WaSH multi-stakeholder forum etc. Regular quarterly meetings in each partner ministry
and annually at regional level will also ensure OWNP M&E is maintained high on agendas and progress is tracked.
Requests for support on OWNP M&E to the NWCO will be received, logged and responses provided where
possible within plans and resources available.
To help coordinate the financing provided by development partners in the WaSH sectors to support implementation
of the OWNP M&E plan, regular updates and reports on OWNP M&E progress and (and especially financing) gaps
will be provided to government and its development partners through existing channels (including CWA partner
meetings, Joint Technical Reviews, Water Sector Working Group, Sanitation &Hygiene Working Group etc.) with
technical support provided by the NWCO to develop the plans required by additional OWNP M&E financing
partners and to provide follow-up on plans and their implementation to ensure harmonisation.
To strengthen collaboration between civil society and implementing partners in supporting OWNP M&E and to
promote uptake of innovations in monitoring, the NWCO will provide regular updates and reports on OWNP M&E to
civil society partners through existing channels including the CCRDA-WSF, WaSH Ethiopia Movement, Millennium
Water Alliance, Ethiopia WaSH Alliance etc. Requests for support and collaboration by NGOs will be received,
logged and responses provided where possible within plans and resources available.
Learning and practice alliances will also be established and maintained at regional level to promote coordination
and learning around a structured and locally relevant learning agenda.
A rolling research agenda on WaSH M&E will be maintained at federal level and used to promote research by
NGOs, the academic community and others. This will ensure that critical urgent issues are addressed and longer-
term opportunities investigated. For example, there is potential to ‘crowdsource’ additional data on water-points and
their functionality from the public, to integrate NGO datasets and reporting, big data may be utilised to provide
better data on populations in the vicinity of water points and may also be used to characterise users (e.g. by
gender), and areas related to water resources management/ source protection and Self-supply need improved
M&E solutions.
The final component of the strategy and complementarity intervention package is focused on ensuring the
sustainability of OWNP M&E. This is specified in a specific sub-plan (see section 4.9).
4.5.3 Work plan
The work plan sets out the planned activities as part of the Synergy and Complementarity strategy intervention
package/ sub-plan. Table 15 provides a summary of the work plan describing outcomes, outputs, and activities.
Annex 4 contains further detail on the timing of activities.
Table 15: Synergy and complementarity work plan summary
Output
No.
Output Links to
other sub-
plans
Activity
No.
Activities
Outcome 4.1 Coordinated implementation of the OWNP M&E plan involving all WaSH sectors, frequent sharing of
experiences and lessons in M&E best practice and sharing of data and collaboration in integrated OWNP reporting
4.1.1 OWNP M&E implementation
quarterly report sections and
meeting reports of WaSH
platforms, with regular
updates on OWNP M&E
(including a tracker of
requests and responses by
the OWNP M&E team across
all WaSH sectors)
4.1.1.1 Regular updates and reports on OWNP M&E progress
provided to implementing partners through existing
channels (including NWSC, RWSC, annual sector
review, WaSH multi-stakeholder forum etc.) and
regular quarterly meetings in each partner ministry
and annually at regional level to ensure OWNP M&E
is maintained high on agendas
4.1.1.2 Requests for support received, logged and responses
provided where possible within plans and resources
available
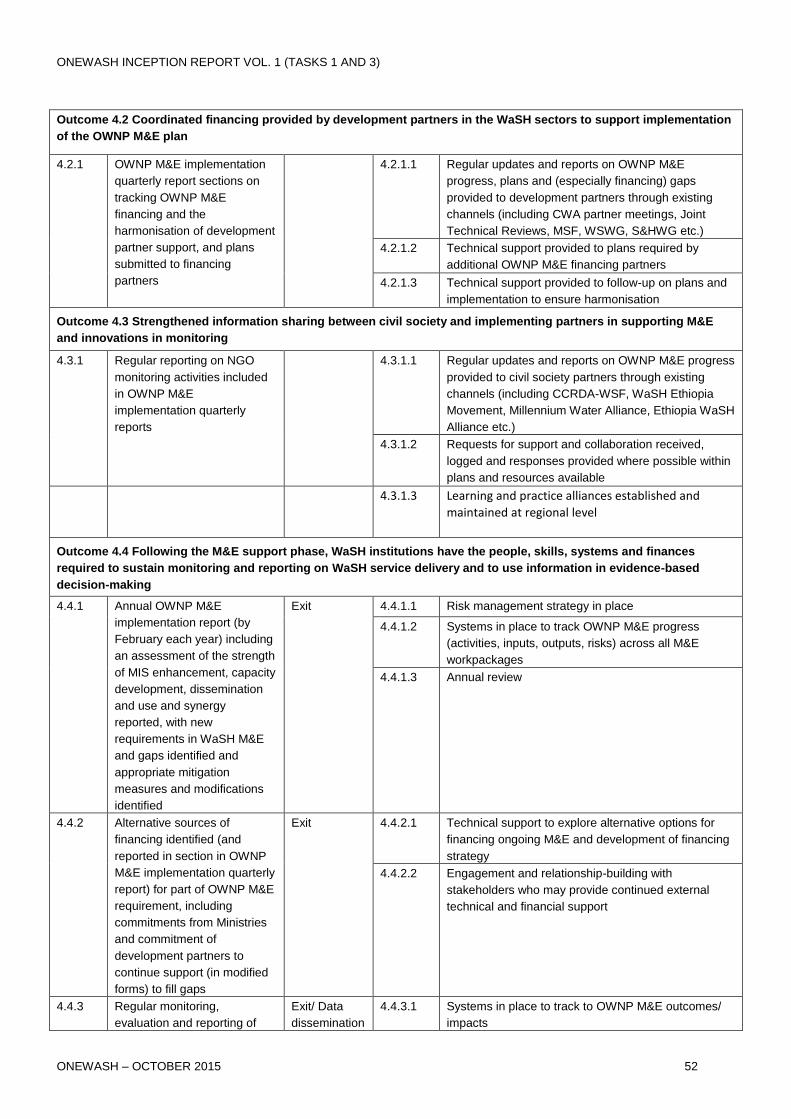
ONEWASH INCEPTION REPORT VOL. 1 (TASKS 1 AND 3)
ONEWASH – OCTOBER 2015 52
Outcome 4.2 Coordinated financing provided by development partners in the WaSH sectors to support implementation
of the OWNP M&E plan
4.2.1 OWNP M&E implementation
quarterly report sections on
tracking OWNP M&E
financing and the
harmonisation of development
partner support, and plans
submitted to financing
partners
4.2.1.1 Regular updates and reports on OWNP M&E
progress, plans and (especially financing) gaps
provided to development partners through existing
channels (including CWA partner meetings, Joint
Technical Reviews, MSF, WSWG, S&HWG etc.)
4.2.1.2 Technical support provided to plans required by
additional OWNP M&E financing partners
4.2.1.3 Technical support provided to follow-up on plans and
implementation to ensure harmonisation
Outcome 4.3 Strengthened information sharing between civil society and implementing partners in supporting M&E
and innovations in monitoring
4.3.1 Regular reporting on NGO
monitoring activities included
in OWNP M&E
implementation quarterly
reports
4.3.1.1 Regular updates and reports on OWNP M&E progress
provided to civil society partners through existing
channels (including CCRDA-WSF, WaSH Ethiopia
Movement, Millennium Water Alliance, Ethiopia WaSH
Alliance etc.)
4.3.1.2 Requests for support and collaboration received,
logged and responses provided where possible within
plans and resources available
4.3.1.3 Learning and practice alliances established and
maintained at regional level
Outcome 4.4 Following the M&E support phase, WaSH institutions have the people, skills, systems and finances
required to sustain monitoring and reporting on WaSH service delivery and to use information in evidence-based
decision-making
4.4.1 Annual OWNP M&E
implementation report (by
February each year) including
an assessment of the strength
of MIS enhancement, capacity
development, dissemination
and use and synergy
reported, with new
requirements in WaSH M&E
and gaps identified and
appropriate mitigation
measures and modifications
identified
Exit 4.4.1.1 Risk management strategy in place
4.4.1.2 Systems in place to track OWNP M&E progress
(activities, inputs, outputs, risks) across all M&E
workpackages
4.4.1.3 Annual review
4.4.2 Alternative sources of
financing identified (and
reported in section in OWNP
M&E implementation quarterly
report) for part of OWNP M&E
requirement, including
commitments from Ministries
and commitment of
development partners to
continue support (in modified
forms) to fill gaps
Exit 4.4.2.1 Technical support to explore alternative options for
financing ongoing M&E and development of financing
strategy
4.4.2.2 Engagement and relationship-building with
stakeholders who may provide continued external
technical and financial support
4.4.3 Regular monitoring,
evaluation and reporting of
Exit/ Data
dissemination
4.4.3.1 Systems in place to track to OWNP M&E outcomes/
impacts
ONEWASH INCEPTION REPORT VOL. 1 (TASKS 1 AND 3)
ONEWASH – OCTOBER 2015 53
project impact and use 4.4.3.2 Communication of project progress and results
4.6 National WaSH Inventory Renewal Strategy and Sub-Plan
The overall objective of the sub-plan for the National WaSH Inventory (NWI) is to ensure the continuation,
improvement and utilisation of the NWI as an integral data collection mechanism and part of the OWNP M&E
system.
Box 5 Timeline and key milestones for National WaSH Inventory Renewal
The sub-plan for the NWI aims to quickly put in place processes supported by mobile data collection tools to collect
data nationwide through the NWI2 by the end of the 2015/16 fiscal year (in July 2016).
Proposed key deliverables/milestones are:
- Tender documents for mobile data collection software (December 2015; also part of procurement plan)
- Report on piloting of mobile data collection (February 2016; also part of procurement plan))
- Report reviewing implementation and lessons learned of NWI2 (October 2016)
- and linked to the data dissemination and use work package, the Ethiopia WaSH Atlas (by March 2017)
4.6.1 Key findings: learning from the first NWI (2010/11) and the 2014 mobile-enabled Somali data
collection
Prior to the first NWI, which involved data collection in 2010 and 2011; key national water supply coverage figures
were compiled from regional inventories, reports and updates. Driving forces for the inventory were differences
between reported national and international figures, and federal concerns about data derived from updating
regional inventories held at different times using diverse methods.
The 2010/11 NWI provided the first relatively consistent WaSH data for the whole country (excluding Somali
Region). It covered over 92,000 rural water supply systems, over 1,600 small town systems and 50,000 schools
and health institutions. Through a household census 12 million households were also interviewed about their water
and sanitation facilities and hygiene practices. The completion of the NWI was a major achievement. The data was
unique in covering both user (through household data) and provider data (from WaSHCOs, utilities and
institutions).
The NWI (2010/11) collected data for a relatively focused set of key performance indicators through ten forms. Its
national roll-out was a major and high cost exercise costing approximately USD 12 million. There were challenges
associated with such a large scale exercise. Results were not reported until two years after data collection due to
the use of paper forms and the large burden of data entry.
As discussed in section 4.8, from the perspective of data use, the results have been used in critical ways:
NWI data from 2010/11 was used by the MoWIE to update its estimates on access to improved water
supplies with new more accurate figures reported to Parliament in 2013. Estimates were revised
downwards significantly with total water supply coverage determined to be 54% compared to the 68.5%
reported for 2010 on the basis of earlier data.
NWI data has been accepted and used by the JMP to update its assessments for Ethiopia in determining
that Ethiopia had met the water MDG in 2015 (57% coverage with improved water supplies).
However, despite these notable successes, it is our assessment that data from the NWI (2010/11 and 2014) has
still not been utilised as widely as it could have been and there is further potential for use. It has also not been
updated. The original intention had been to annually update the NWI.
After initial trials by NGOs of new mobile data collection tools for WaSH, MoWIE decided to extend the NWI to
Somali Region in 2014 (as it had not been included earlier) using a mobile data collection tool (Akvo FLOW).
Importantly this did not include the household surveys reducing the scope of the exercise considerably. The 2014
ONEWASH INCEPTION REPORT VOL. 1 (TASKS 1 AND 3)
ONEWASH – OCTOBER 2015 54
mobile based survey demonstrated improvements in quality of data (especially to coordinate data through the
integrated GPS functions) and drastically reduced the time to collect and report data.
Various ICT tools have been used over time to enter, store and analyse NWI data. A MS Access database was
used to enter the data collected on paper forms (and use of this database is still in use in some UNICEF/SNV
supported woredas). Excel has been most commonly used for providing access to the raw data and analyse. Akvo
FLOW was used in 2014 as the mobile data collection tool and to store and visualize NWI data online. The WaSH
M&E MIS PUT system has imported the NWI data from 2010/11 (manually, the data entry forms are currently not
consistent with the NWI) and can generate some basic key performance indicator analysis from that data. Akvo has
also demonstrated a working prototype of a web dashboard that generates key performance indicators on a map
for all parts of the country after significant cleaning of the geographical coordinates of the 2010/11 dataset for this
purpose.
Although other ministries, including providing staff as enumerators, were involved in NWI data collection our
interviews suggest that there is relatively little knowledge about the NWI data within the OWNP partner ministries
and at the Central Statistical Agency. Going forwards there is also the potential for duplication with data that is
reported through health and education monitoring systems so effective coordination and harmonisation will be
required.
The NWI has been a very collaborative process involving significant support by development partners such as
UNICEF and NGOs who have been strongly involved in the regions and woredas to support data collection and
contributing to the significant logistical costs.
Staffing and skills are a critical issue. Where the NWI (2010/11) used kebele level staff from other sectors in data
collection (health extension workers and teachers) to allow faster data collection this was at the expense of woreda
water officers having the opportunity to visit water schemes (which may have supported more local use of the
data). There was significant technical assistance for the NWI and it was also necessary to outsource the
development of software for data entry, quality control and quality assurance. Software development was
outsourced in a piecemeal fashion and as a result the systems used are not interoperable.
Data management, analysis, and the generation of reports were very process heavy and required manual
interventions. The dissemination of the 2010/11 results occurred three years after the data collection. A
comprehensive report has not as yet been published.
Data quality is reported to be a concern including the low quality of geographic coordinate data due to data entry
errors and use of different reference systems.
The NWI did not include the establishment of unique reference codes for water points and this presents a
challenge to updating and linking datasets (especially where coordinate data is not accurate).
There has been uptake of NWI related data collection modalities. M&E under the Community Managed Project
(CMP) for example has been aligned to the NWI indicators and is carried out with support of the Community Led
Accelerated Water, Sanitation and Hygiene Project (COWASH). Some NGOs are also using the NWI data
collection formats in their local work.
4.6.2 Approach to NWI renewal
Informed by previous experiences, the approach recommended to renewal of the NWI includes:
To undertake the NWI2 as a priority national exercise during fiscal year 2015/16 to provide a baseline for
the GTP2. This will involve repetition rather than update of the NWI1 due in particular to the low quality of
geographic coordinate data.
Water supply components to combine repeat one-time inventory data collection based upon field visits to
water points with updates to add newly constructed, expanded or rehabilitated facilities and regular
reporting on key indicators such as functionality. Such a multi-phase approach means that the high cost
inventory may be undertaken ever 5 years rather than annually (e.g. NWI3 might be scheduled in 2020/21
at the end of GTP2).
Institutional WaSH components of the inventory to be a source of data to triangulate with the data collected
through health and education systems, with consideration to discontinuing or scaling back this component
after NWI2 (e.g. sampling) if data are being or are likely to be effectively reported through HMIS and EMIS.
ONEWASH INCEPTION REPORT VOL. 1 (TASKS 1 AND 3)
ONEWASH – OCTOBER 2015 55
To build upon the Somali exercise to use mobile data collection tools nationwide for NWI2. NWI2 will use
existing and proven software to support data collection to avoid delays and improve quality. It will also build
capacity and use the phones and software solution procured to provide facilities for woredas/ towns to add
new schemes to the database and over-time to support regular reporting (replacing paper-based reporting).
Household sanitation/ hygiene: discontinue the household survey (forms 4 and 5) as done in Somali region
in 2014, and use health sector and CSA household survey data to report on this component.
Introduce additional carefully selected indicators to the NWI2 where this this is required e.g. for GTP2
requirements. In NWI3 to consider further additions and making the inventory more comprehensive to fill
gaps in other data that are reported.
Consider introducing sampling approaches over time to reduce costs, or discontinuing campaign type
inventories as regular monitoring systems are improved (i.e. NWI3 may not be required).
Develop (through upgrading existing WaSH M&E MIS and alternative software) WaSH M&E MIS so that it
stores NWI2 data and supports its use and updating.
Careful design of quality control processes including approvals at key levels such a woreda and region,
and validation through independent checks.
To strongly promote use of the data through a WaSH atlas reporting the NWI results and following up a
systematic process to share data and track its use (see section 4.8.2.3).
Activities to be implemented as part of the NWI renewal strategy are linked to the wider processes of WaSH M&E
such as the establishment of an operational WaSH M&E MIS and the use of regular reporting to update data
collected through occasional inventory of assets.
Within this wider plan the necessary outputs focused on the NWI renewal are identified as:
Putting in place the national process to collect, quality control, process and validate data for the second
NWI (NWI2).
Procurement, testing and roll-out of an ICT solution to support NWI2 as a fully mobile-enabled data
collection exercise.
Procurement of improvements to the existing WaSH M&E MIS to store and report NWI2 data, and to
develop additional WaSH M&E MIS capabilities.
Water-sector staff and institutions with the mandates, capacities and resources to collect, process and
disseminate NWI data (part of the capacity building sub-plan).
Publication, dissemination and evaluation of an Ethiopia WaSH Atlas (part of the data dissemination and
use sub-plan).
The national data collection for the NWI2 is recommended as a priority exercise with data collection starting early in
2016 and completed during the 2015/16 fiscal year. The NWI indicators will need to be revised in line with GTP2
implications and the building upon the indicator recommendations made in section 2.3.1. It is expected that the
scope of data collected will be similar to NWI1 with the exception of household water and sanitation data:
Form 1 – Safe Water Supply Inventory for Rural and Small Towns.
Form 2 – Health Institutions WaSH Facilities Inventory.
Form 3 – School WaSH Facilities Inventory.
Form 6 – Urban Water Supply Utilities Water Supply Scheme Inventory – Water Source Data.
Form 7 – Existing Urban Water Supply Connection Types and Number by Town.
Form 8 – Urban Water Supply Annual Production and Sale Amount Inventory.
Form 9 – Urban Water Supply Utilities Staff Capacity Inventory.
Form 10 – Urban Water Supply Utilities Tariff Rate and Financial Status.
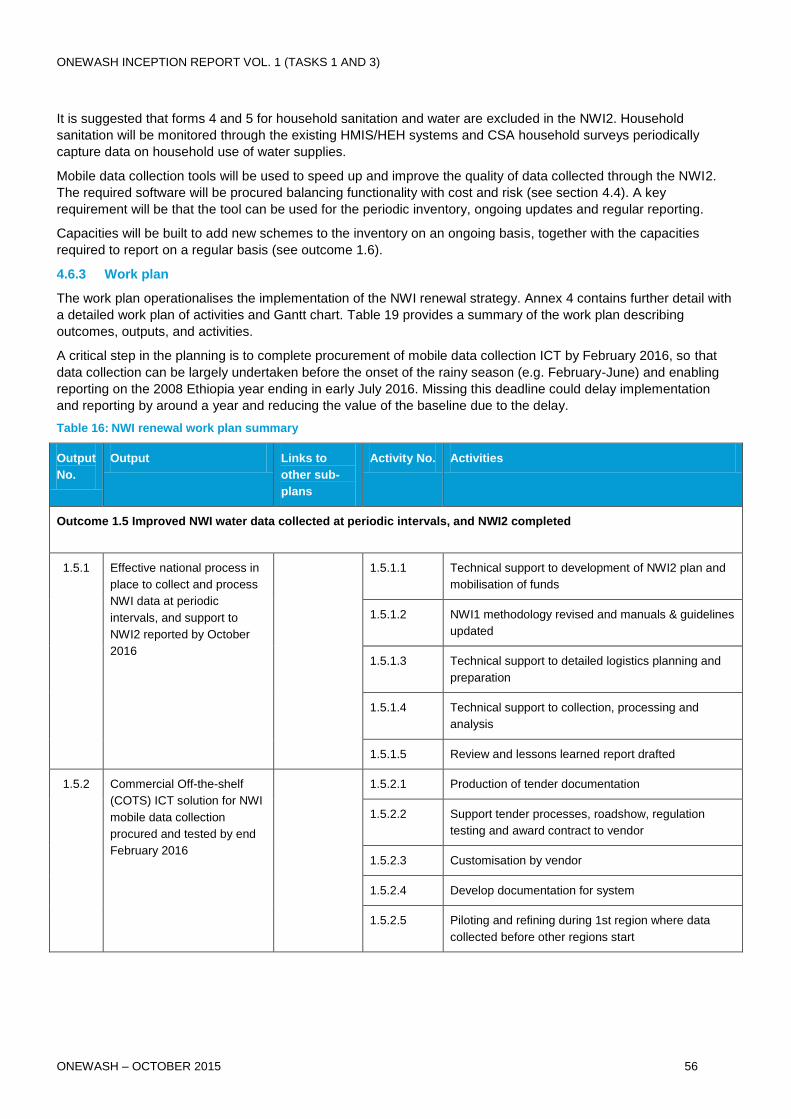
ONEWASH INCEPTION REPORT VOL. 1 (TASKS 1 AND 3)
ONEWASH – OCTOBER 2015 56
It is suggested that forms 4 and 5 for household sanitation and water are excluded in the NWI2. Household
sanitation will be monitored through the existing HMIS/HEH systems and CSA household surveys periodically
capture data on household use of water supplies.
Mobile data collection tools will be used to speed up and improve the quality of data collected through the NWI2.
The required software will be procured balancing functionality with cost and risk (see section 4.4). A key
requirement will be that the tool can be used for the periodic inventory, ongoing updates and regular reporting.
Capacities will be built to add new schemes to the inventory on an ongoing basis, together with the capacities
required to report on a regular basis (see outcome 1.6).
4.6.3 Work plan
The work plan operationalises the implementation of the NWI renewal strategy. Annex 4 contains further detail with
a detailed work plan of activities and Gantt chart. Table 19 provides a summary of the work plan describing
outcomes, outputs, and activities.
A critical step in the planning is to complete procurement of mobile data collection ICT by February 2016, so that
data collection can be largely undertaken before the onset of the rainy season (e.g. February-June) and enabling
reporting on the 2008 Ethiopia year ending in early July 2016. Missing this deadline could delay implementation
and reporting by around a year and reducing the value of the baseline due to the delay.
Table 16: NWI renewal work plan summary
Output
No.
Output Links to
other sub-
plans
Activity No. Activities
Outcome 1.5 Improved NWI water data collected at periodic intervals, and NWI2 completed
1.5.1 Effective national process in
place to collect and process
NWI data at periodic
intervals, and support to
NWI2 reported by October
2016
1.5.1.1 Technical support to development of NWI2 plan and
mobilisation of funds
1.5.1.2 NWI1 methodology revised and manuals & guidelines
updated
1.5.1.3 Technical support to detailed logistics planning and
preparation
1.5.1.4 Technical support to collection, processing and
analysis
1.5.1.5 Review and lessons learned report drafted
1.5.2 Commercial Off-the-shelf
(COTS) ICT solution for NWI
mobile data collection
procured and tested by end
February 2016
1.5.2.1 Production of tender documentation
1.5.2.2 Support tender processes, roadshow, regulation
testing and award contract to vendor
1.5.2.3 Customisation by vendor
1.5.2.4 Develop documentation for system
1.5.2.5 Piloting and refining during 1st region where data
collected before other regions start

ONEWASH INCEPTION REPORT VOL. 1 (TASKS 1 AND 3)
ONEWASH – OCTOBER 2015 57
Outcome also depends on
output 2.2.3 under capacity
building
Capacity
building
Outcome also links to
outputs 3.5.1-3.5.5 under
dissemination and use
Data
dissemination
and use
4.7 Data Quality Assurance Strategy and Sub-Plan
The overall objective of the sub-plan on data quality assurance is that all stakeholders have a high level of
confidence in the validity of OWNP M&E data so they are confident to use that data in their reporting and decision-
making. Ultimately greater confidence should reduce the risk that agencies prefer to collect their own data because
they question the validity of data from other sources.
The sub-plan addresses both quality assurance i.e. procedures put in place ex-ante to reduce the risk of obtaining
compromised data, and quality control referring to the activities taken during and after data collection to verify the
quality of collected data.
Box 6 Key milestones for data quality assurance
Sections on data quality assurance will form part of the OWNP annual report and the OWNP quarterly
implementation reports.
4.7.1 Key findings: data quality assurance and quality control challenges
Data quality control mechanisms receive relatively little attention and there is limited practice to date in the WaSH
sectors of validating data, or triangulating using data derived from different sources (e.g. comparing results on
access derived from service provider and household survey data). In the health sector for example the HMIS
includes data quality management mechanisms (Lotus Quality Survey & Data Quality Survey) but these are not
implemented effectively and there is no systematic process in place to verify Hygiene & Environmental Health data
(Jones, 2015). The National WaSH Inventory (2010/11) data, while providing a hugely useful check on water
supply coverage calculations that up to that time had been calculated through an addition approach that had led
over time to inflated figures, was not validated and there are concerns about its low quality in some respects (for
example with many errors in geographic coordinates). NWI data quality is understood to have improved
considerably through deployment of mobile data collection technology in Somali in 2014 (helping to avoid data
entry errors and facilitating real-time checking of data by supervisors) but that also has not been validated.
There has been to date relatively little systematic practice of use of nationally representative household surveys
undertaken by the Central Statistical Agency, or comparison with results of impact evaluation or other special
studies and research. Such sources can provide alternative data for triangulation or to fill gaps. Quality of the
overall WaSH M&E system could be improved and money saved by making use of a range of different data
sources especially those that are better geared to critical issues such as tracking equity and gender impacts of the
OWNP.
4.7.2 Approach to data quality assurance
The approach proposed to data quality assurance includes:
To strengthen the data quality assurance mechanisms in each sector and their implementation.
To improve the design and implementation of quality control procedures.
To promote the institutionalisation of quality assurance and quality control procedures.

ONEWASH INCEPTION REPORT VOL. 1 (TASKS 1 AND 3)
ONEWASH – OCTOBER 2015 58
To promote triangulation with other data sources such as CSA household survey data and other studies to
identify potential problems associations with indicator definitions, understanding and quality of data
collection.
To use the National WaSH Inventory as an additional data source for the (infrequent but comprehensive)
validation of sectoral datasets.
To promote the use of carefully designed and targeted data validation surveys with a focus on new areas of
data collection, and areas where triangulation reveals major differences in datasets.
To promote a culture of more openly questioning data and its quality, documentation and sharing of gaps
and problems and solution finding to improve data reliability.
Peer review of M&E findings through the annual Multi-Stakeholder Forum (MSF).
The OWNP M&E support team will assist each sector to review their existing data quality assurance and quality
control mechanisms and their application with respect to WaSH indicators, identifying gaps, shortcomings and
possible improvements with follow up to upgrade these mechanisms and enhance their implementation. The review
will include triangulation across datasets and promoting on-going practice of triangulation and identifying and
planning validation surveys where required.
4.7.3 Work plan
The work plan operationalises the implementation of data quality assurance approach. Annex 4 contains further
detail with a detailed work plan of activities and Gantt chart. Table 17 provides a summary of the work plan
describing outcomes, outputs, and activities.
Table 17 Data quality assurance work plan summary
Output
No.
Output Links to
other sub-
plans
Activity No. Activities
Outcome 1.7 High level of confidence of sector stakeholders in the validity of WaSH data
1.7.1 Section in OWNP annual
report on the quality of
WaSH data and with
recommendations for
improvements
Data quality
assurance
1.7.1.1 Technical support to implement and upgrade existing
data quality assurance and quality control
mechanisms in the water sector, assess data by
triangulation with other data sources and undertake
validation surveys where required
1.7.1.2 Technical support to implement and upgrade existing
data quality assurance and quality control
mechanisms in the health sector, assess data by
triangulation with other data sources and undertake
validation surveys where required
1.7.1.3 Technical support to implement and upgrade existing
data quality assurance and quality control
mechanisms in the education sector, assess data by
triangulation with other data sources and undertake
validation surveys where required
1.7.1.4 Technical support to implement and upgrade existing
data quality assurance and quality control
mechanisms in finance, assess data by triangulation
with other data sources and undertake validation
surveys where required

ONEWASH INCEPTION REPORT VOL. 1 (TASKS 1 AND 3)
ONEWASH – OCTOBER 2015 59
1.7.2 OWNP M&E implementation
quarterly report includes
section on implementation of
measures to address WaSH
data quality issues
Data quality
assurance
1.7.2.1 Technical support to identify and follow up
recommendations for improvements to enhance data
quality
4.8 Data Dissemination and Use Strategy and Sub-Plan
The overall objective of the task and intervention package on data dissemination and use is to facilitate the sharing
and use of data for evidence-based decision-making in the OWNP. The activities will establish the linkages
required to encourage use of data, which is vital for M&E itself to be a value for money investment. Related
objectives are: to inform responses to operational challenges in WaSH service delivery, to enable reporting and
planning, to support policy analysis and policy adaptation, to increase accountability of WaSH service providers
and authorities, and to provide data and analysis for in-depth research, advocacy and wider information sharing.
The data dissemination and use strategy will be successful if the use of data results in more efficient planning and
financing of WaSH services; adaptation of policies and regulation; greater accountability of WaSH service providers
and authorities and; more sustainable WaSH services. The primary users of the data are the stakeholders of the
OWNP; secondary users are research organisations, civil society and international WaSH sector experts.
Audiences are discussed further in section 4.8.2.1.
Data dissemination and use activities sit in relation to the triangular linkages between i) data, information and
knowledge and their use in ii) planning and decision making and iii) budgeting and financing. These relations are at
each level in a federal state such as Ethiopia, and complex due to the multiple channels of funding. Better service
delivery is expected through operational use of data at local (woreda and sub-woreda especially) levels. More
effective planning and decision-making informed by better evidence is expected to lead to improvements through
more effective interventions, with more and better targeted financing at all levels and accurate budgeting leading to
more effective activities and, ultimately over time, better value for money.
Figure 2 Relationships between data, planning and budgeting
ONEWASH INCEPTION REPORT VOL. 1 (TASKS 1 AND 3)
ONEWASH – OCTOBER 2015 60
The dissemination strategy will enable sharing of sub-sector data on water supply, sanitation and hygiene and the
integrated analysis of the data for effective and sustainable WaSH service delivery. As discussed in section 3.3.2
primary data sources are WaSH M&E MIS which will hold data from water supply reporting as well as the Health
MIS and Hygiene and Environmental Health programme monitoring systems, the Education MIS, and IBEX while
data from other sources will contribute to analysis such as data from NGOs, from household surveys undertaken by
the CSA etc.
Box 7 Key milestones for Data Dissemination and Use
Proposed key deliverables/milestones are:
- Inter-agency data sharing agreement (by December 2015)
- Improved reporting formats for major programmes at all levels (Sep 2016)
- OWNP annual report (by October in 2016, 2017, and 2018)
- Report on use and impact of the OWNP report (by May 2017)
- Ethiopia WaSH Atlas (by March 2017)
- Report on use and impact of the Ethiopia WASH Atlas by January 2018
- Report on WaSH data use at local levels to improve service delivery (May 2018)
- Report on the efficiency and impact of the combined WaSH MIS reporting system (November 2018)
- Report on sharing and use of WaSH data from OWNP MIS systems (July 2018)
- At least 4 briefing papers per year, 12 news articles per year, 6 blogs per year, and 12 presentations per year
(summary report included in implementation report and published to website)
- Report on use and impact of outreach materials (January 2018)
4.8.1 Key findings: existing data dissemination, use and challenges
Most of the findings discussed in section 1.2 are relevant to data dissemination and use. The already existing
wealth of data is not known to many sector stakeholders and not used as widely as it could be. Rather than
accessing existing data sources, due to fragmentation and limited coordination, there is a tendency towards
duplication of data collection rather than using data collected by other agencies. Most programmes and NGOs
have their own project monitoring systems and tools that they rely upon, and their data do not always feed into
government data systems. The use of data is also generally given lesser priority than data collection and suffers
even greater capacity constraints (skills but also other resources and infrastructure) than the collection of data.
The WaSH sector, despite some previous attempts, has not been able to develop the capacity to sustain integrated
WaSH reporting. A critical failure has also been the failure to report on sanitation at the end of the IDA/DFID water
and sanitation programme (which has been superseded by the CWA).
There have been some notable data use successes too. NWI data from 2010/11 was used by the MoWIE to update
its estimates on access to improved water supplies with new more accurate figures reported to Parliament in 2013,
and by the JMP to update its assessments for Ethiopia in determining that Ethiopia had met the water MDG in
2015. This ‘use of data’ was an outcome in both these cases of considerable efforts to facilitate, understand,
compare, re-analyse and ultimately use data, illustrating the kind of activities and persistence needed to put data to
use.
4.8.2 Approach to data dissemination and use
The approach proposed for data dissemination and use (see also Figure 3) is as follows:
To strengthen cooperation between the constituting MISs: WaSH M&E MIS, Health MIS, Education MIS,
and IBEX and to strengthen processes for access and exchange of data, and strengthen roles and
responsibilities for processing, analysing data and using data for reporting.
To incorporate and promote the use of M&E data from all stakeholders in the OWNP: the MISs of the
Government of Ethiopia, the Development Partners participating in the CWA, and Development Partners
(bilateral, multilateral and NGOs) funding WaSH through channels 2 (bilateral) and 3 (NGO funds).
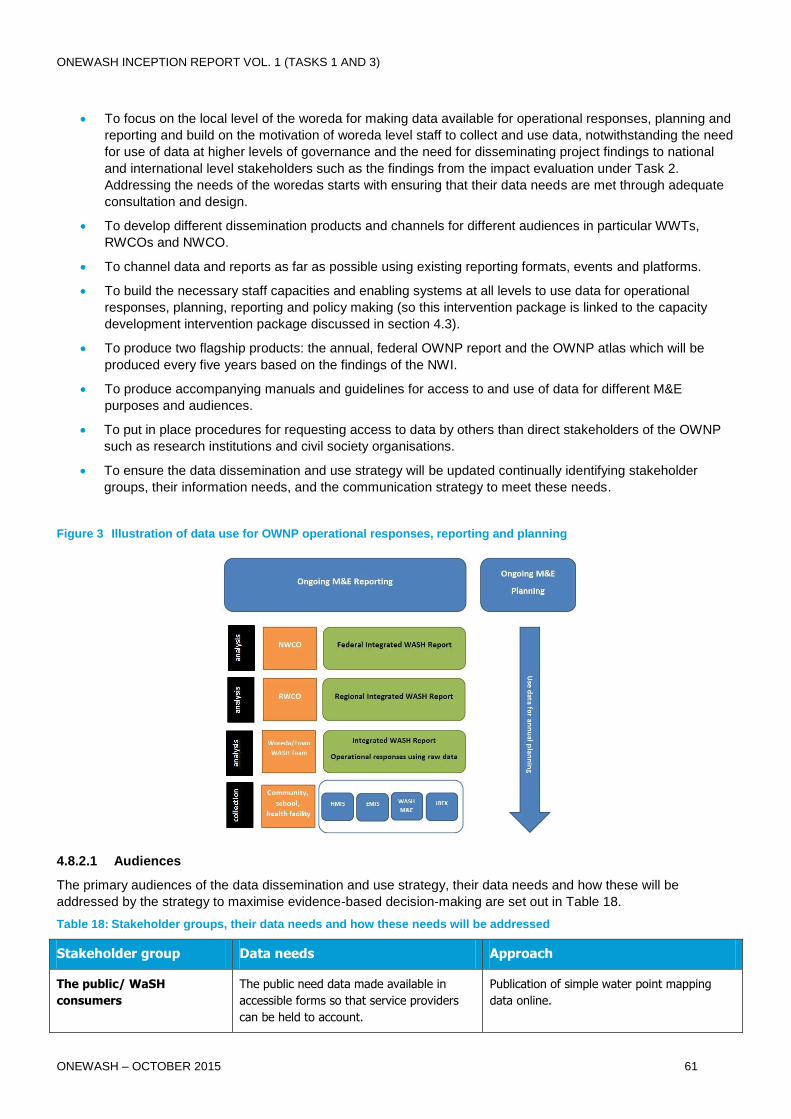
ONEWASH INCEPTION REPORT VOL. 1 (TASKS 1 AND 3)
ONEWASH – OCTOBER 2015 61
To focus on the local level of the woreda for making data available for operational responses, planning and
reporting and build on the motivation of woreda level staff to collect and use data, notwithstanding the need
for use of data at higher levels of governance and the need for disseminating project findings to national
and international level stakeholders such as the findings from the impact evaluation under Task 2.
Addressing the needs of the woredas starts with ensuring that their data needs are met through adequate
consultation and design.
To develop different dissemination products and channels for different audiences in particular WWTs,
RWCOs and NWCO.
To channel data and reports as far as possible using existing reporting formats, events and platforms.
To build the necessary staff capacities and enabling systems at all levels to use data for operational
responses, planning, reporting and policy making (so this intervention package is linked to the capacity
development intervention package discussed in section 4.3).
To produce two flagship products: the annual, federal OWNP report and the OWNP atlas which will be
produced every five years based on the findings of the NWI.
To produce accompanying manuals and guidelines for access to and use of data for different M&E
purposes and audiences.
To put in place procedures for requesting access to data by others than direct stakeholders of the OWNP
such as research institutions and civil society organisations.
To ensure the data dissemination and use strategy will be updated continually identifying stakeholder
groups, their information needs, and the communication strategy to meet these needs.
Figure 3 Illustration of data use for OWNP operational responses, reporting and planning
4.8.2.1 Audiences
The primary audiences of the data dissemination and use strategy, their data needs and how these will be
addressed by the strategy to maximise evidence-based decision-making are set out in Table 18.
Table 18: Stakeholder groups, their data needs and how these needs will be addressed
Stakeholder group Data needs Approach
The public/ WaSH
consumers
The public need data made available in
accessible forms so that service providers
can be held to account.
Publication of simple water point mapping
data online.
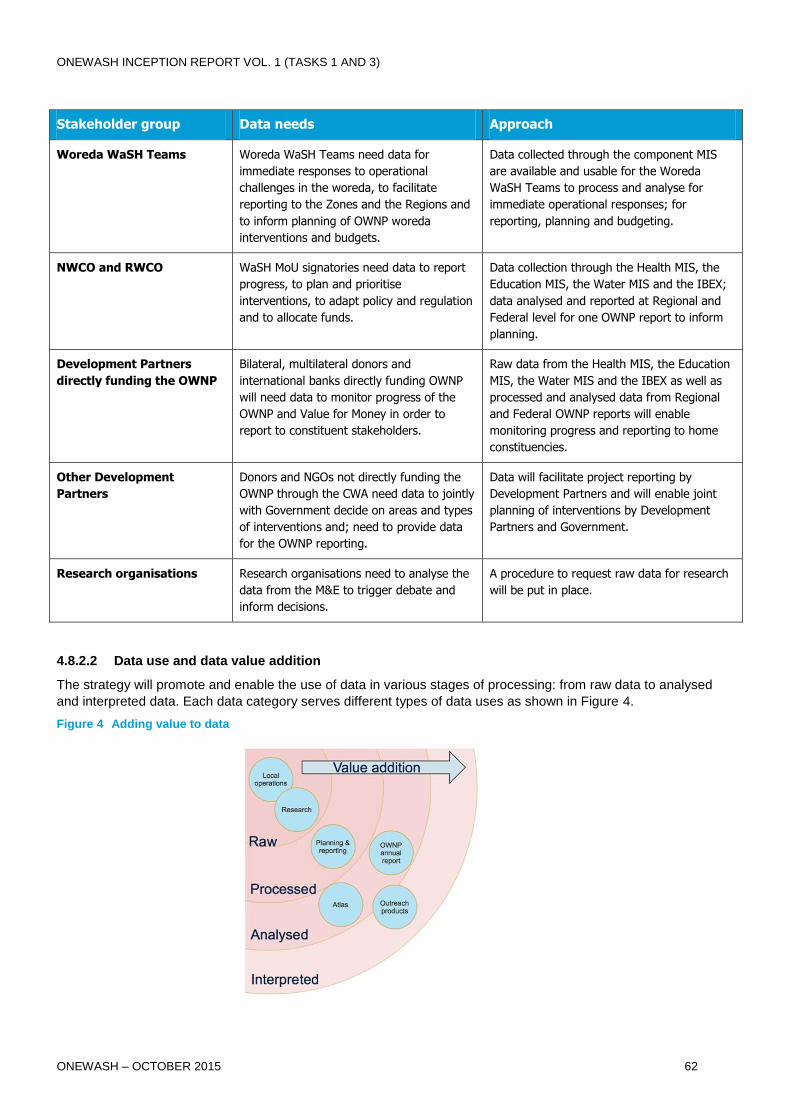
ONEWASH INCEPTION REPORT VOL. 1 (TASKS 1 AND 3)
ONEWASH – OCTOBER 2015 62
Stakeholder group Data needs Approach
Woreda WaSH Teams Woreda WaSH Teams need data for
immediate responses to operational
challenges in the woreda, to facilitate
reporting to the Zones and the Regions and
to inform planning of OWNP woreda
interventions and budgets.
Data collected through the component MIS
are available and usable for the Woreda
WaSH Teams to process and analyse for
immediate operational responses; for
reporting, planning and budgeting.
NWCO and RWCO WaSH MoU signatories need data to report
progress, to plan and prioritise
interventions, to adapt policy and regulation
and to allocate funds.
Data collection through the Health MIS, the
Education MIS, the Water MIS and the IBEX;
data analysed and reported at Regional and
Federal level for one OWNP report to inform
planning.
Development Partners
directly funding the OWNP
Bilateral, multilateral donors and
international banks directly funding OWNP
will need data to monitor progress of the
OWNP and Value for Money in order to
report to constituent stakeholders.
Raw data from the Health MIS, the Education
MIS, the Water MIS and the IBEX as well as
processed and analysed data from Regional
and Federal OWNP reports will enable
monitoring progress and reporting to home
constituencies.
Other Development
Partners
Donors and NGOs not directly funding the
OWNP through the CWA need data to jointly
with Government decide on areas and types
of interventions and; need to provide data
for the OWNP reporting.
Data will facilitate project reporting by
Development Partners and will enable joint
planning of interventions by Development
Partners and Government.
Research organisations Research organisations need to analyse the
data from the M&E to trigger debate and
inform decisions.
A procedure to request raw data for research
will be put in place.
4.8.2.2 Data use and data value addition
The strategy will promote and enable the use of data in various stages of processing: from raw data to analysed
and interpreted data. Each data category serves different types of data uses as shown in Figure 4.
Figure 4 Adding value to data

ONEWASH INCEPTION REPORT VOL. 1 (TASKS 1 AND 3)
ONEWASH – OCTOBER 2015 63
The categories in the data value addition chain are:
1. Raw data: from the component management information systems is mainly used for direct operational
responses in particular at the level of the woreda. Access to raw data should also be facilitated for other
stakeholders than government e.g. for research, for NGOs and CBOs and other stakeholders. A data
request procedure will be put in place following the procedures of the MIS systems for data access which
will need to be clear, transparent and promote data use.
2. Processed data: data that have been ordered and categorised for specific purposes of different target
audiences e.g. data processed at woreda level to inform the reporting requirements to the zones and
regions and; analysed data to be presented in the annual OWNP report and the 5 yearly WaSH Atlas.
3. Analysed data: data analysed to draw conclusions and provide recommendations for planning and action
and for improvements of policy and regulation. There is a lot of potential for data visualisation and the use
of dashboards to present data in accessible forms. This will be exploited through the Atlas and promoting
open access to water point mapping data.
4. Interpreted data which includes data for advocacy and data for use in outreach products, research and
impact evaluation reports, newsletters, publications, briefs e.g. on good cases of data use, the national
MSF, international conferences etc.
4.8.2.3 Data products
The envisaged data products along the value addition chain are:
1. Data for local operations: local operations (e.g. decisions related to repairs to a water point, emptying of a latrine pit at a school etc.) will be facilitated through the rapid provision of data, generally raw data, to the local actors with relevant service provision responsibilities (typically at woreda levels although zones and regions may also be involved). Standard formats may not always be required, but the processes and behaviours to share such data need to be promoted.
2. Data reports for planning and reporting: data reports from the component MIS systems are expected to
provide data in easy to use formats that support the required planning and reporting processes in each
sector. Plans and reports will be more ‘evidence-based’ where they maximise use of data from component
MIS systems (e.g. WMIS, HMIS, EMIS, IBEX etc.). Duplication of effort will be avoided where systems
provide the data that is required to prepare plans and reports. First attempts will be made to synthesise
data across sectors on the OWNP KPIs reports for all woredas and regions in light reporting formats.
3. Data for research: data will be provided to the research community (an important target audience to
promote evidence-based decision making) based upon a transparent process for making data requests
with relevant metadata provided. Such requests are expected to be processed at regional and national
levels, according to the rules of implementing partners (MoWIE, MoH, MoE, MoFED etc.).
4. OWNP report: this is a flagship annual integrated national report on the progress and achievements of all
WaSH activities within the country including rural WaSH, urban WaSH, institutional WaSH and the enabling
environment. Data is interpreted to highlight key trends, achievements and gaps and recommendations
seek to influence high-level decision making. The report will be prepared by September each year and will
be a key input to the Joint Sector Review and Multi-Stakeholder Forum.
5. OWNP atlas: produced every 5 years the OWNP atlas will provide access to national scale data in
attractive map formats (both in hard-copy and online through the website)
6. Outreach products: other products will include:
Briefing papers: short papers will share examples of use of WaSH data, share impact evaluation
findings, summarise advocacy focused on improving WaSH monitoring etc.
News: regular news articles on the development of M&E within the OWNP will be shared through
multiple channels including the OWNP website, sector newsletters. For a long and complex
programme with stakeholders across Ethiopian government, donors, civil society and the wider
community, it will be essential to plan how to communicate the activities undertaken in Task 1 (M&E
enhancement) and Task 2 (Impact evaluation) in order to explain their rationale and benefits. Lessons
learnt during the implementation phase will need to be recorded and disseminated and good practice
highlighted so that institutional learning can take place over time.

ONEWASH INCEPTION REPORT VOL. 1 (TASKS 1 AND 3)
ONEWASH – OCTOBER 2015 64
Presentations and other inputs to events (national and international) highlighting developments, use
etc.
OWNP website: parts of the OWNP website will be developed to be data-rich providing access to key
data generated by the component MIS systems, news, briefs and task 2 evaluation findings.
Accompanying products – all major outputs will be accompanied by products to facilitate the production and use
of the outputs such as manuals, guidelines, training programmes, formats and templates. These will include:
Guidelines for using the raw data from the MISs for operational responses by the Woreda WaSH Teams
and offices.
Template for Woreda WaSH Teams to report to the RWCO.
Template for the Regional One WaSH report.
Template for the National One WaSH report.
Template for the Ethiopia WaSH Atlas.
Materials to promote the use and dissemination of the data.
Data exchange agreement between the MOH, MOE, MOFED and MOWIE.
4.8.3 Work plan
The work plan operationalises the implementation of the proposed data products. Annex 4 contains further detail
with a detailed workplan of activities and Gantt chart. Table 19 provides a summary of the work plan describing
outcomes, outputs, and activities.
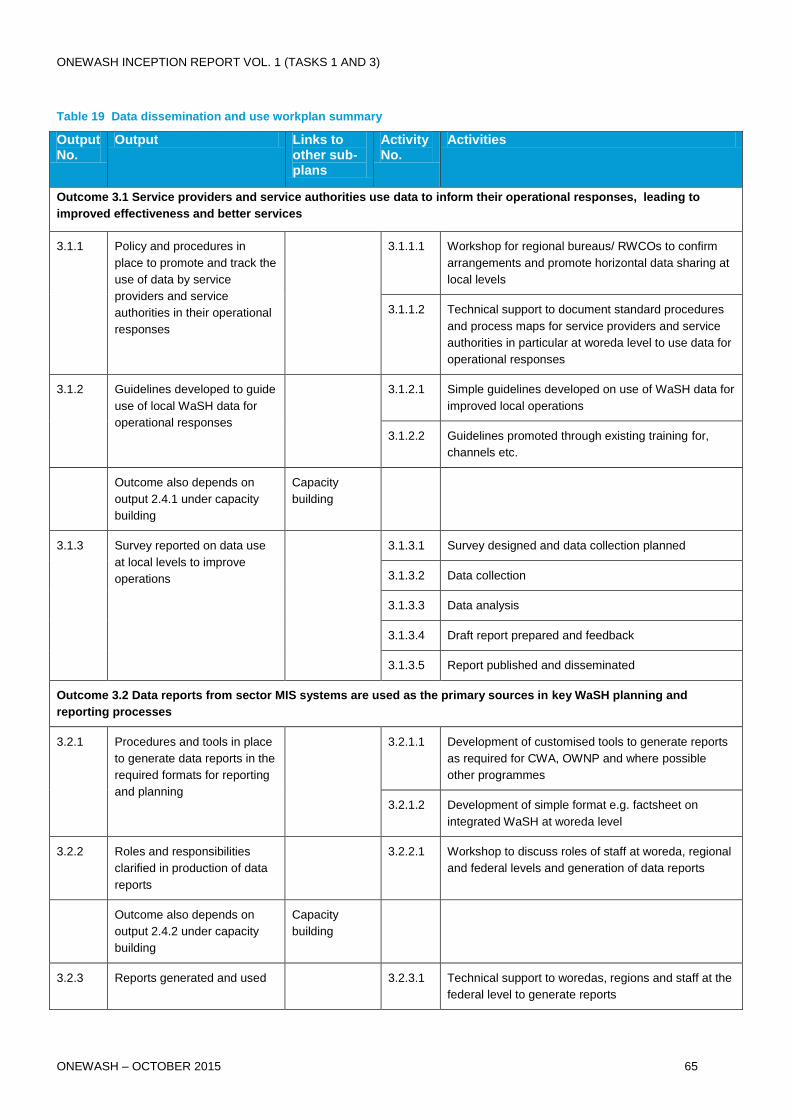
ONEWASH INCEPTION REPORT VOL. 1 (TASKS 1 AND 3)
ONEWASH – OCTOBER 2015 65
Table 19 Data dissemination and use workplan summary
Output No.
Output Links to other sub-plans
Activity No.
Activities
Outcome 3.1 Service providers and service authorities use data to inform their operational responses, leading to
improved effectiveness and better services
3.1.1 Policy and procedures in
place to promote and track the
use of data by service
providers and service
authorities in their operational
responses
3.1.1.1 Workshop for regional bureaus/ RWCOs to confirm
arrangements and promote horizontal data sharing at
local levels
3.1.1.2 Technical support to document standard procedures
and process maps for service providers and service
authorities in particular at woreda level to use data for
operational responses
3.1.2 Guidelines developed to guide
use of local WaSH data for
operational responses
3.1.2.1 Simple guidelines developed on use of WaSH data for
improved local operations
3.1.2.2 Guidelines promoted through existing training for,
channels etc.
Outcome also depends on
output 2.4.1 under capacity
building
Capacity
building
3.1.3 Survey reported on data use
at local levels to improve
operations
3.1.3.1 Survey designed and data collection planned
3.1.3.2 Data collection
3.1.3.3 Data analysis
3.1.3.4 Draft report prepared and feedback
3.1.3.5 Report published and disseminated
Outcome 3.2 Data reports from sector MIS systems are used as the primary sources in key WaSH planning and
reporting processes
3.2.1 Procedures and tools in place
to generate data reports in the
required formats for reporting
and planning
3.2.1.1 Development of customised tools to generate reports
as required for CWA, OWNP and where possible
other programmes
3.2.1.2 Development of simple format e.g. factsheet on
integrated WaSH at woreda level
3.2.2 Roles and responsibilities
clarified in production of data
reports
3.2.2.1 Workshop to discuss roles of staff at woreda, regional
and federal levels and generation of data reports
Outcome also depends on
output 2.4.2 under capacity
building
Capacity
building
3.2.3 Reports generated and used 3.2.3.1 Technical support to woredas, regions and staff at the
federal level to generate reports

ONEWASH INCEPTION REPORT VOL. 1 (TASKS 1 AND 3)
ONEWASH – OCTOBER 2015 66
Output No.
Output Links to other sub-plans
Activity No.
Activities
3.2.4 Greater use of hygiene and
sanitation, and institutional
WaSH data promoted
3.2.4.1 Technical support to promote more local use of health
and education data through clarification of processes
and responsibilities, demand creation through sector
channels, and demonstrated examples (two way
information flows), and analysis with a focus on
assessing disparities/ inequities and using information
to better target investments
3.2.5 Survey reported on the
efficiency and impact of the
combined MIS reporting
system
3.2.6.1 Survey designed and data collection planned
3.2.6.2 Data collection
3.2.6.3 Data analysis
3.2.6.4 Draft report prepared and feedback
3.2.6.5 Report published and disseminated
Outcome 3.3 Researchers and other third parties make extensive use of data within WaSH MIS systems increasing the
evidence base
3.3.1 Policies and procedures in
place to share data from IP
WaSH MIS systems
3.3.1.1 workshop to draft procedures to share WASH data
from sector MIS systems
3.3.1.2 Technical support to finalise procedures
3.3.2 Data requests sought and
fulfilled
3.3.2.1 Data catalogues developed summarising available
data
3.3.2.2 Data request processes published (e.g. on OWNP
website), availability of data promoted and data
requests honoured
Outcome also depends on
output 2.4.3 under capacity
building
Capacity
building
3.3.3 Archive maintained of
publications
3.3.3.1 Follow-up to collate copies of reports, papers and
other products generated using data from WaSH MIS
systems
3.3.3.2 Online archive maintained to facilitate access to
publications developed using WaSH MIS data
3.3.4 Survey to document and
evaluate the number and
purpose of data requests
3.3.4.1 Survey designed and data collection planned
3.3.4.2 Data collection
3.3.4.3 Data analysis
3.3.4.4 Draft report prepared and feedback
3.3.4.5 Report published and disseminated
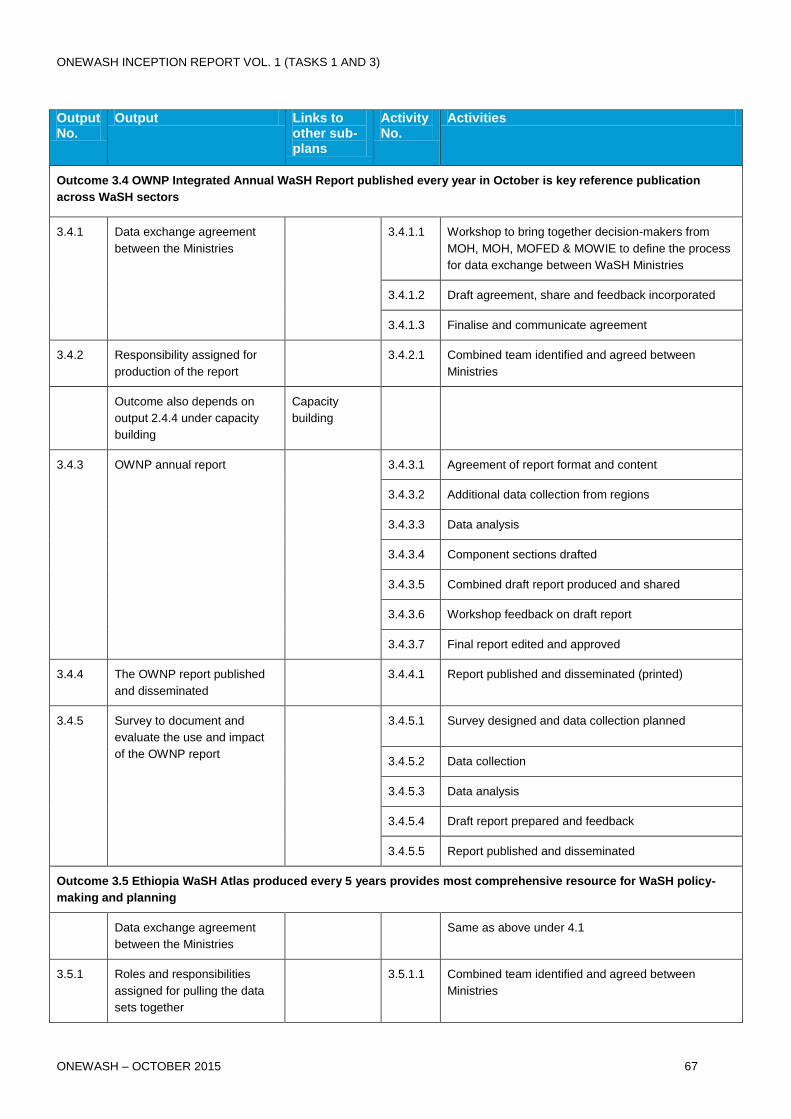
ONEWASH INCEPTION REPORT VOL. 1 (TASKS 1 AND 3)
ONEWASH – OCTOBER 2015 67
Output No.
Output Links to other sub-plans
Activity No.
Activities
Outcome 3.4 OWNP Integrated Annual WaSH Report published every year in October is key reference publication
across WaSH sectors
3.4.1 Data exchange agreement
between the Ministries
3.4.1.1 Workshop to bring together decision-makers from
MOH, MOH, MOFED & MOWIE to define the process
for data exchange between WaSH Ministries
3.4.1.2 Draft agreement, share and feedback incorporated
3.4.1.3 Finalise and communicate agreement
3.4.2 Responsibility assigned for
production of the report
3.4.2.1 Combined team identified and agreed between
Ministries
Outcome also depends on
output 2.4.4 under capacity
building
Capacity
building
3.4.3 OWNP annual report 3.4.3.1 Agreement of report format and content
3.4.3.2 Additional data collection from regions
3.4.3.3 Data analysis
3.4.3.4 Component sections drafted
3.4.3.5 Combined draft report produced and shared
3.4.3.6 Workshop feedback on draft report
3.4.3.7 Final report edited and approved
3.4.4 The OWNP report published
and disseminated
3.4.4.1 Report published and disseminated (printed)
3.4.5 Survey to document and
evaluate the use and impact
of the OWNP report
3.4.5.1 Survey designed and data collection planned
3.4.5.2 Data collection
3.4.5.3 Data analysis
3.4.5.4 Draft report prepared and feedback
3.4.5.5 Report published and disseminated
Outcome 3.5 Ethiopia WaSH Atlas produced every 5 years provides most comprehensive resource for WaSH policy-
making and planning
Data exchange agreement
between the Ministries
Same as above under 4.1
3.5.1 Roles and responsibilities
assigned for pulling the data
sets together
3.5.1.1 Combined team identified and agreed between
Ministries
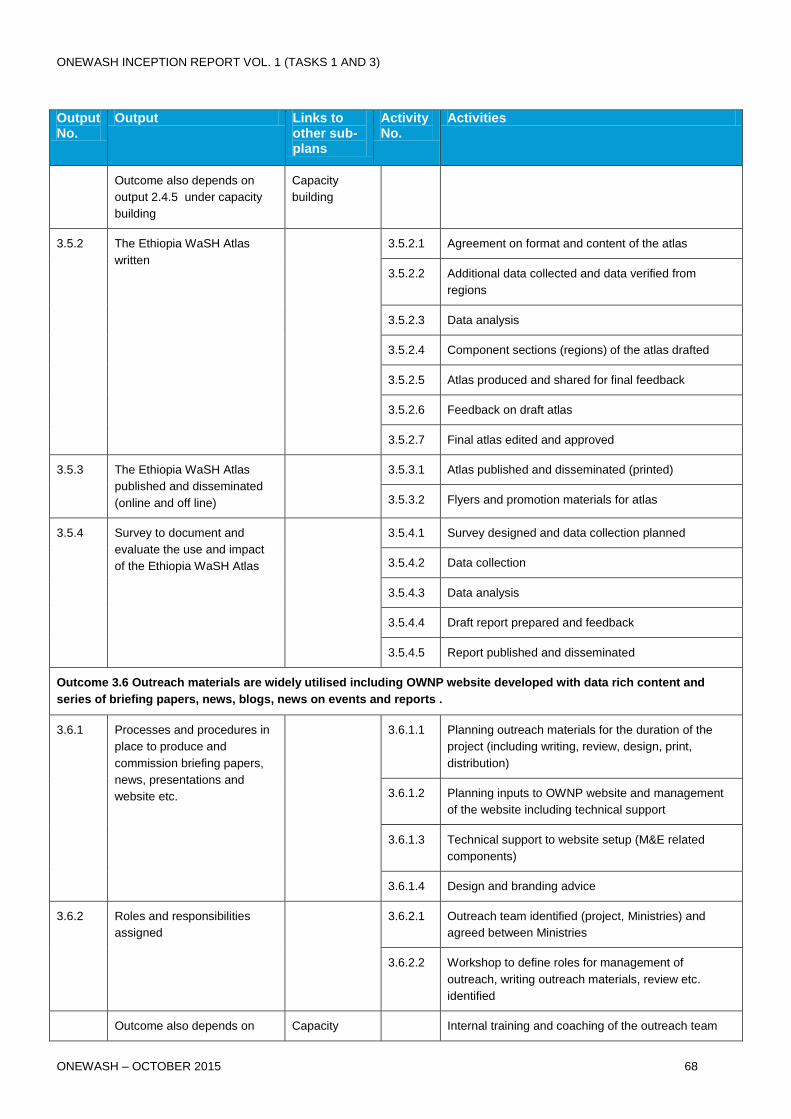
ONEWASH INCEPTION REPORT VOL. 1 (TASKS 1 AND 3)
ONEWASH – OCTOBER 2015 68
Output No.
Output Links to other sub-plans
Activity No.
Activities
Outcome also depends on
output 2.4.5 under capacity
building
Capacity
building
3.5.2 The Ethiopia WaSH Atlas
written
3.5.2.1 Agreement on format and content of the atlas
3.5.2.2 Additional data collected and data verified from
regions
3.5.2.3 Data analysis
3.5.2.4 Component sections (regions) of the atlas drafted
3.5.2.5 Atlas produced and shared for final feedback
3.5.2.6 Feedback on draft atlas
3.5.2.7 Final atlas edited and approved
3.5.3 The Ethiopia WaSH Atlas
published and disseminated
(online and off line)
3.5.3.1 Atlas published and disseminated (printed)
3.5.3.2 Flyers and promotion materials for atlas
3.5.4 Survey to document and
evaluate the use and impact
of the Ethiopia WaSH Atlas
3.5.4.1 Survey designed and data collection planned
3.5.4.2 Data collection
3.5.4.3 Data analysis
3.5.4.4 Draft report prepared and feedback
3.5.4.5 Report published and disseminated
Outcome 3.6 Outreach materials are widely utilised including OWNP website developed with data rich content and
series of briefing papers, news, blogs, news on events and reports .
3.6.1 Processes and procedures in
place to produce and
commission briefing papers,
news, presentations and
website etc.
3.6.1.1 Planning outreach materials for the duration of the
project (including writing, review, design, print,
distribution)
3.6.1.2 Planning inputs to OWNP website and management
of the website including technical support
3.6.1.3 Technical support to website setup (M&E related
components)
3.6.1.4 Design and branding advice
3.6.2 Roles and responsibilities
assigned
3.6.2.1 Outreach team identified (project, Ministries) and
agreed between Ministries
3.6.2.2 Workshop to define roles for management of
outreach, writing outreach materials, review etc.
identified
Outcome also depends on Capacity Internal training and coaching of the outreach team
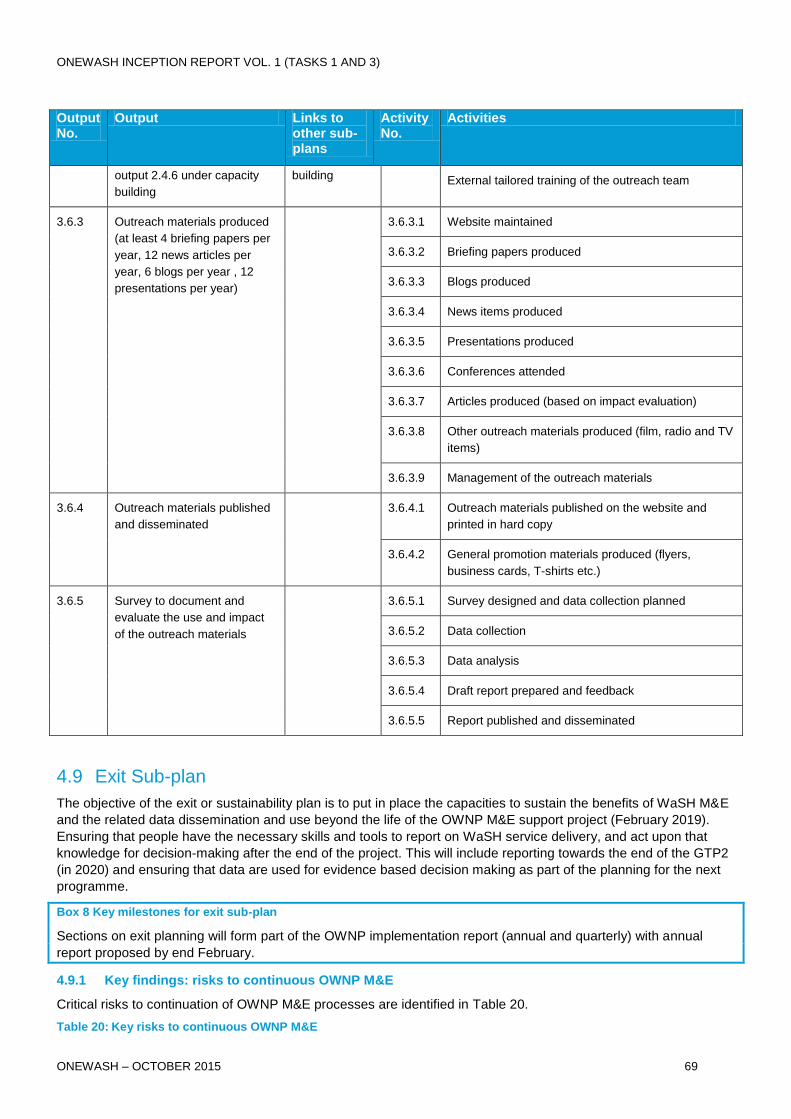
ONEWASH INCEPTION REPORT VOL. 1 (TASKS 1 AND 3)
ONEWASH – OCTOBER 2015 69
Output No.
Output Links to other sub-plans
Activity No.
Activities
output 2.4.6 under capacity
building
building External tailored training of the outreach team
3.6.3 Outreach materials produced
(at least 4 briefing papers per
year, 12 news articles per
year, 6 blogs per year , 12
presentations per year)
3.6.3.1 Website maintained
3.6.3.2 Briefing papers produced
3.6.3.3 Blogs produced
3.6.3.4 News items produced
3.6.3.5 Presentations produced
3.6.3.6 Conferences attended
3.6.3.7 Articles produced (based on impact evaluation)
3.6.3.8 Other outreach materials produced (film, radio and TV
items)
3.6.3.9 Management of the outreach materials
3.6.4 Outreach materials published
and disseminated
3.6.4.1 Outreach materials published on the website and
printed in hard copy
3.6.4.2 General promotion materials produced (flyers,
business cards, T-shirts etc.)
3.6.5 Survey to document and
evaluate the use and impact
of the outreach materials
3.6.5.1 Survey designed and data collection planned
3.6.5.2 Data collection
3.6.5.3 Data analysis
3.6.5.4 Draft report prepared and feedback
3.6.5.5 Report published and disseminated
4.9 Exit Sub-plan
The objective of the exit or sustainability plan is to put in place the capacities to sustain the benefits of WaSH M&E
and the related data dissemination and use beyond the life of the OWNP M&E support project (February 2019).
Ensuring that people have the necessary skills and tools to report on WaSH service delivery, and act upon that
knowledge for decision-making after the end of the project. This will include reporting towards the end of the GTP2
(in 2020) and ensuring that data are used for evidence based decision making as part of the planning for the next
programme.
Box 8 Key milestones for exit sub-plan
Sections on exit planning will form part of the OWNP implementation report (annual and quarterly) with annual
report proposed by end February.
4.9.1 Key findings: risks to continuous OWNP M&E
Critical risks to continuation of OWNP M&E processes are identified in Table 20.
Table 20: Key risks to continuous OWNP M&E
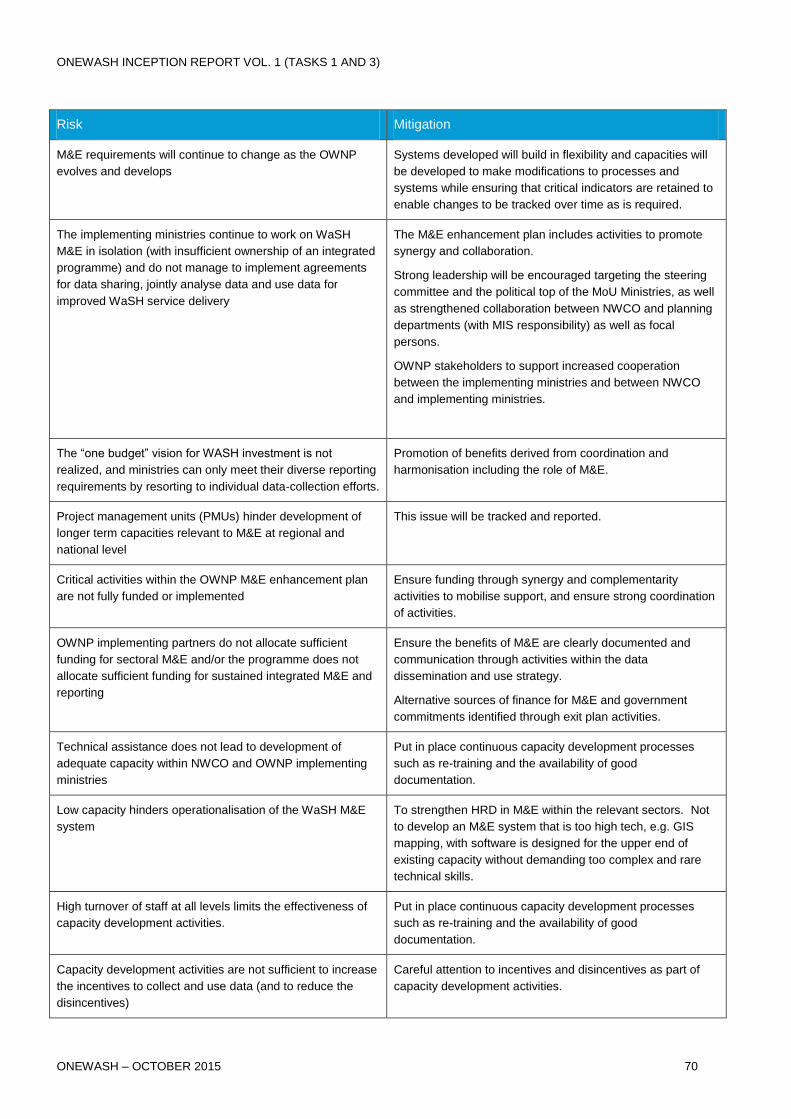
ONEWASH INCEPTION REPORT VOL. 1 (TASKS 1 AND 3)
ONEWASH – OCTOBER 2015 70
Risk Mitigation
M&E requirements will continue to change as the OWNP
evolves and develops
Systems developed will build in flexibility and capacities will
be developed to make modifications to processes and
systems while ensuring that critical indicators are retained to
enable changes to be tracked over time as is required.
The implementing ministries continue to work on WaSH
M&E in isolation (with insufficient ownership of an integrated
programme) and do not manage to implement agreements
for data sharing, jointly analyse data and use data for
improved WaSH service delivery
The M&E enhancement plan includes activities to promote
synergy and collaboration.
Strong leadership will be encouraged targeting the steering
committee and the political top of the MoU Ministries, as well
as strengthened collaboration between NWCO and planning
departments (with MIS responsibility) as well as focal
persons.
OWNP stakeholders to support increased cooperation
between the implementing ministries and between NWCO
and implementing ministries.
The “one budget” vision for WASH investment is not
realized, and ministries can only meet their diverse reporting
requirements by resorting to individual data-collection efforts.
Promotion of benefits derived from coordination and
harmonisation including the role of M&E.
Project management units (PMUs) hinder development of
longer term capacities relevant to M&E at regional and
national level
This issue will be tracked and reported.
Critical activities within the OWNP M&E enhancement plan
are not fully funded or implemented
Ensure funding through synergy and complementarity
activities to mobilise support, and ensure strong coordination
of activities.
OWNP implementing partners do not allocate sufficient
funding for sectoral M&E and/or the programme does not
allocate sufficient funding for sustained integrated M&E and
reporting
Ensure the benefits of M&E are clearly documented and
communication through activities within the data
dissemination and use strategy.
Alternative sources of finance for M&E and government
commitments identified through exit plan activities.
Technical assistance does not lead to development of
adequate capacity within NWCO and OWNP implementing
ministries
Put in place continuous capacity development processes
such as re-training and the availability of good
documentation.
Low capacity hinders operationalisation of the WaSH M&E
system
To strengthen HRD in M&E within the relevant sectors. Not
to develop an M&E system that is too high tech, e.g. GIS
mapping, with software is designed for the upper end of
existing capacity without demanding too complex and rare
technical skills.
High turnover of staff at all levels limits the effectiveness of
capacity development activities.
Put in place continuous capacity development processes
such as re-training and the availability of good
documentation.
Capacity development activities are not sufficient to increase
the incentives to collect and use data (and to reduce the
disincentives)
Careful attention to incentives and disincentives as part of
capacity development activities.
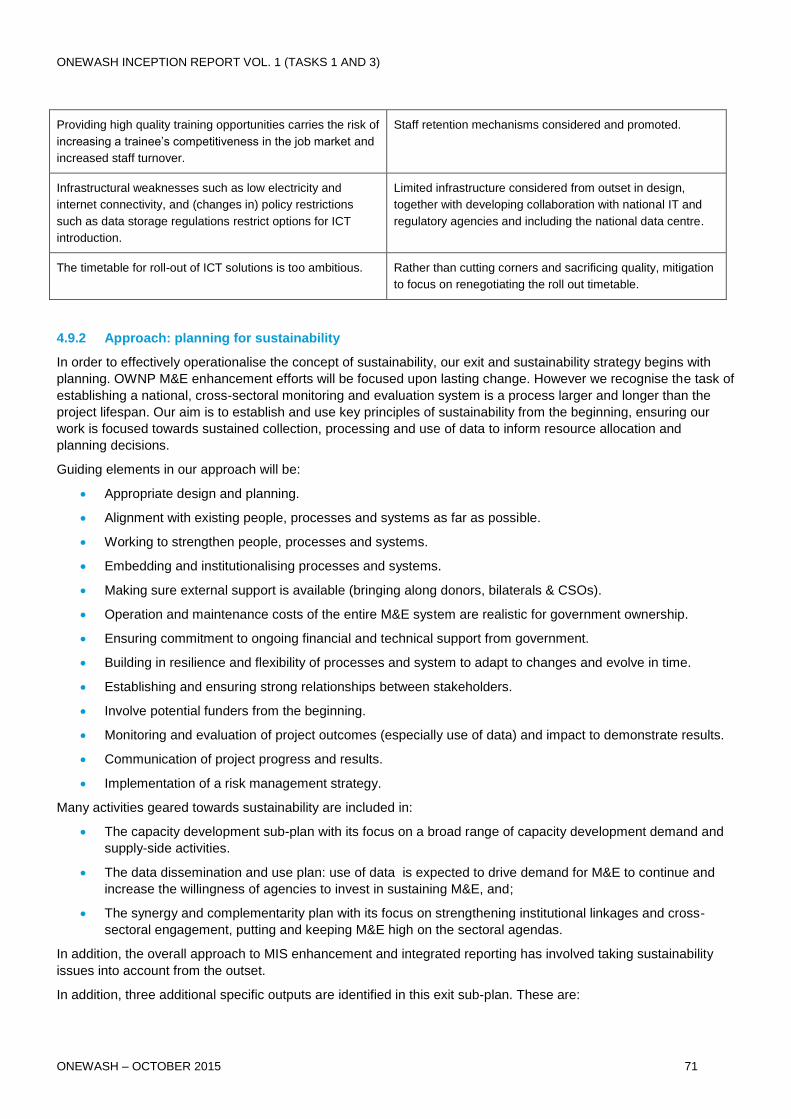
ONEWASH INCEPTION REPORT VOL. 1 (TASKS 1 AND 3)
ONEWASH – OCTOBER 2015 71
Providing high quality training opportunities carries the risk of
increasing a trainee’s competitiveness in the job market and
increased staff turnover.
Staff retention mechanisms considered and promoted.
Infrastructural weaknesses such as low electricity and
internet connectivity, and (changes in) policy restrictions
such as data storage regulations restrict options for ICT
introduction.
Limited infrastructure considered from outset in design,
together with developing collaboration with national IT and
regulatory agencies and including the national data centre.
The timetable for roll-out of ICT solutions is too ambitious. Rather than cutting corners and sacrificing quality, mitigation
to focus on renegotiating the roll out timetable.
4.9.2 Approach: planning for sustainability
In order to effectively operationalise the concept of sustainability, our exit and sustainability strategy begins with
planning. OWNP M&E enhancement efforts will be focused upon lasting change. However we recognise the task of
establishing a national, cross-sectoral monitoring and evaluation system is a process larger and longer than the
project lifespan. Our aim is to establish and use key principles of sustainability from the beginning, ensuring our
work is focused towards sustained collection, processing and use of data to inform resource allocation and
planning decisions.
Guiding elements in our approach will be:
Appropriate design and planning.
Alignment with existing people, processes and systems as far as possible.
Working to strengthen people, processes and systems.
Embedding and institutionalising processes and systems.
Making sure external support is available (bringing along donors, bilaterals & CSOs).
Operation and maintenance costs of the entire M&E system are realistic for government ownership.
Ensuring commitment to ongoing financial and technical support from government.
Building in resilience and flexibility of processes and system to adapt to changes and evolve in time.
Establishing and ensuring strong relationships between stakeholders.
Involve potential funders from the beginning.
Monitoring and evaluation of project outcomes (especially use of data) and impact to demonstrate results.
Communication of project progress and results.
Implementation of a risk management strategy.
Many activities geared towards sustainability are included in:
The capacity development sub-plan with its focus on a broad range of capacity development demand and
supply-side activities.
The data dissemination and use plan: use of data is expected to drive demand for M&E to continue and
increase the willingness of agencies to invest in sustaining M&E, and;
The synergy and complementarity plan with its focus on strengthening institutional linkages and cross-
sectoral engagement, putting and keeping M&E high on the sectoral agendas.
In addition, the overall approach to MIS enhancement and integrated reporting has involved taking sustainability
issues into account from the outset.
In addition, three additional specific outputs are identified in this exit sub-plan. These are:
ONEWASH INCEPTION REPORT VOL. 1 (TASKS 1 AND 3)
ONEWASH – OCTOBER 2015 72
An annual OWNP M&E implementation report (not to be confused with the OWNP annual report with
results across the sectors) to be prepared by February each year. This report will, based upon review by
team members, NWCO, ministries and core stakeholders, bring together an assessment of progress in
activities under each of the intervention packages i.e. 1) MIS enhancement, 2) capacity development, 3)
data dissemination and use and 4) synergy and complementarity. It will also identify new requirements in
WaSH M&E (e.g. as new policies and strategies are developed), identify gaps towards achieving the
intended outcomes of WaSH M&E, and propose mitigation measures and modifications to project
implementation.
The identification of alternative sources of financing which will be reported in a section in OWNP M&E
implementation quarterly reports. Alternative financing beyond the initial donor funding will be sought to
cover part of OWNP M&E cost requirement, including commitments from Ministries and commitment of
development partners to continue support (in modified forms) to fill gaps.
Regular monitoring, evaluation and reporting of project outcomes and impact. Linked to the data
dissemination and use intervention package which includes several activities to track and survey the use of
OWNP M&E data products, this activity will ensure that the wider outcomes and impacts of WaSH M&E are
tracked, documented and reported. Being able to demonstrate outcomes and impacts is expected to
support efforts to sustain OWNP M&E.
4.9.3 Work plan
Outcome 4.4 relating to the exit sub-plan is part of the synergy and complementarity work package (see section 4.5
and Table 15).
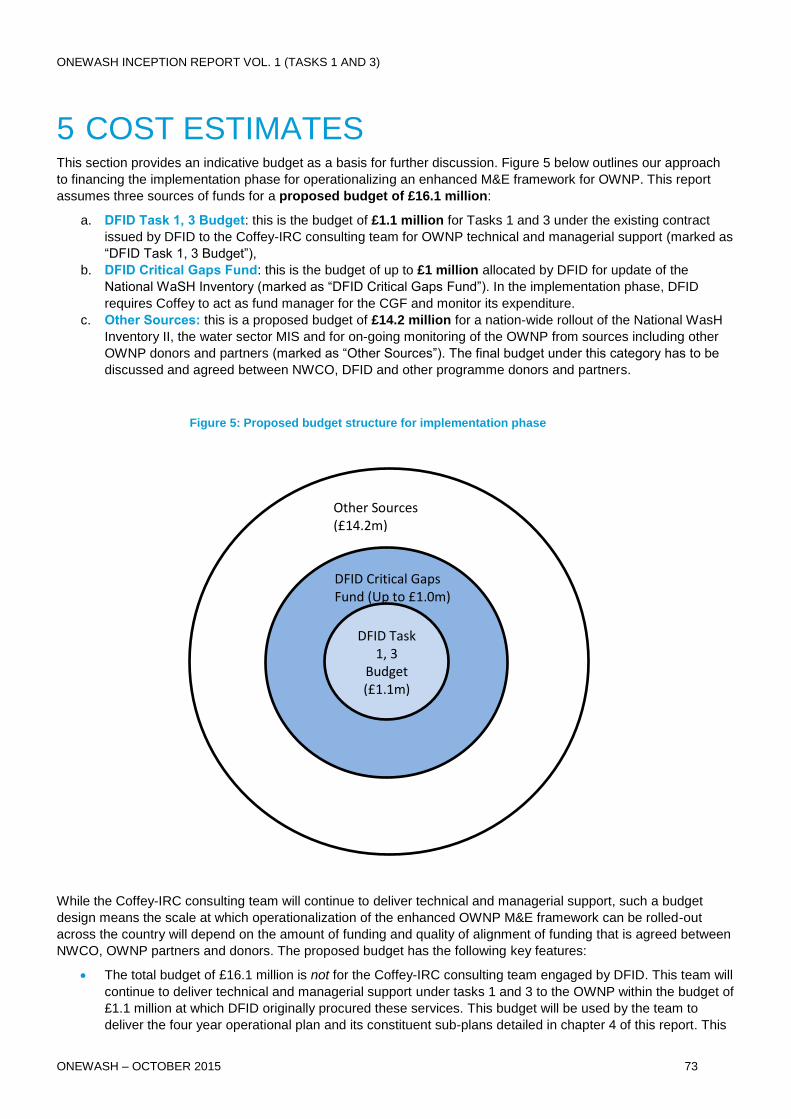
ONEWASH INCEPTION REPORT VOL. 1 (TASKS 1 AND 3)
ONEWASH – OCTOBER 2015 73
5 COST ESTIMATES This section provides an indicative budget as a basis for further discussion. Figure 5 below outlines our approach
to financing the implementation phase for operationalizing an enhanced M&E framework for OWNP. This report
assumes three sources of funds for a proposed budget of £16.1 million:
a. DFID Task 1, 3 Budget: this is the budget of £1.1 million for Tasks 1 and 3 under the existing contract
issued by DFID to the Coffey-IRC consulting team for OWNP technical and managerial support (marked as
“DFID Task 1, 3 Budget”),
b. DFID Critical Gaps Fund: this is the budget of up to £1 million allocated by DFID for update of the
National WaSH Inventory (marked as “DFID Critical Gaps Fund”). In the implementation phase, DFID
requires Coffey to act as fund manager for the CGF and monitor its expenditure.
c. Other Sources: this is a proposed budget of £14.2 million for a nation-wide rollout of the National WasH
Inventory II, the water sector MIS and for on-going monitoring of the OWNP from sources including other
OWNP donors and partners (marked as “Other Sources”). The final budget under this category has to be
discussed and agreed between NWCO, DFID and other programme donors and partners.
While the Coffey-IRC consulting team will continue to deliver technical and managerial support, such a budget
design means the scale at which operationalization of the enhanced OWNP M&E framework can be rolled-out
across the country will depend on the amount of funding and quality of alignment of funding that is agreed between
NWCO, OWNP partners and donors. The proposed budget has the following key features:
The total budget of £16.1 million is not for the Coffey-IRC consulting team engaged by DFID. This team will
continue to deliver technical and managerial support under tasks 1 and 3 to the OWNP within the budget of
£1.1 million at which DFID originally procured these services. This budget will be used by the team to
deliver the four year operational plan and its constituent sub-plans detailed in chapter 4 of this report. This
DFID Critical Gaps Fund (Up to £1.0m)
DFID Task 1, 3
Budget (£1.1m)
Other Sources (£14.2m)
Figure 5: Proposed budget structure for implementation phase
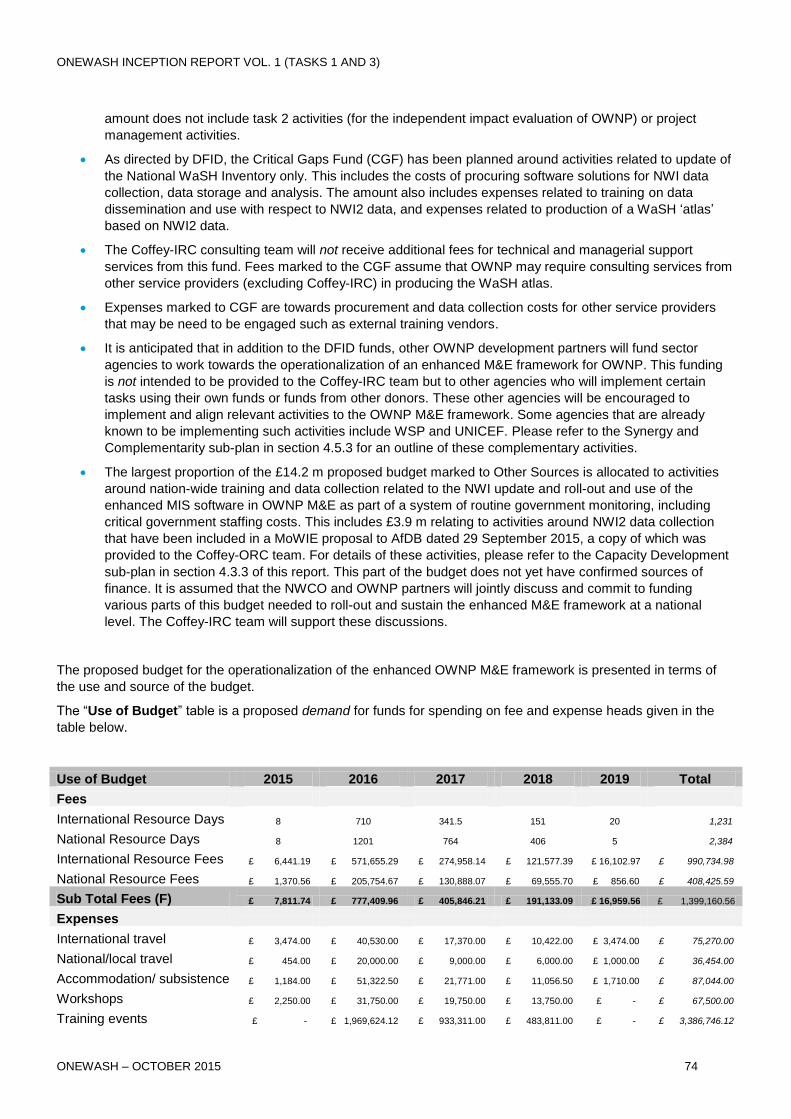
ONEWASH INCEPTION REPORT VOL. 1 (TASKS 1 AND 3)
ONEWASH – OCTOBER 2015 74
amount does not include task 2 activities (for the independent impact evaluation of OWNP) or project
management activities.
As directed by DFID, the Critical Gaps Fund (CGF) has been planned around activities related to update of
the National WaSH Inventory only. This includes the costs of procuring software solutions for NWI data
collection, data storage and analysis. The amount also includes expenses related to training on data
dissemination and use with respect to NWI2 data, and expenses related to production of a WaSH ‘atlas’
based on NWI2 data.
The Coffey-IRC consulting team will not receive additional fees for technical and managerial support
services from this fund. Fees marked to the CGF assume that OWNP may require consulting services from
other service providers (excluding Coffey-IRC) in producing the WaSH atlas.
Expenses marked to CGF are towards procurement and data collection costs for other service providers
that may be need to be engaged such as external training vendors.
It is anticipated that in addition to the DFID funds, other OWNP development partners will fund sector
agencies to work towards the operationalization of an enhanced M&E framework for OWNP. This funding
is not intended to be provided to the Coffey-IRC team but to other agencies who will implement certain
tasks using their own funds or funds from other donors. These other agencies will be encouraged to
implement and align relevant activities to the OWNP M&E framework. Some agencies that are already
known to be implementing such activities include WSP and UNICEF. Please refer to the Synergy and
Complementarity sub-plan in section 4.5.3 for an outline of these complementary activities.
The largest proportion of the £14.2 m proposed budget marked to Other Sources is allocated to activities
around nation-wide training and data collection related to the NWI update and roll-out and use of the
enhanced MIS software in OWNP M&E as part of a system of routine government monitoring, including
critical government staffing costs. This includes £3.9 m relating to activities around NWI2 data collection
that have been included in a MoWIE proposal to AfDB dated 29 September 2015, a copy of which was
provided to the Coffey-ORC team. For details of these activities, please refer to the Capacity Development
sub-plan in section 4.3.3 of this report. This part of the budget does not yet have confirmed sources of
finance. It is assumed that the NWCO and OWNP partners will jointly discuss and commit to funding
various parts of this budget needed to roll-out and sustain the enhanced M&E framework at a national
level. The Coffey-IRC team will support these discussions.
The proposed budget for the operationalization of the enhanced OWNP M&E framework is presented in terms of
the use and source of the budget.
The “Use of Budget” table is a proposed demand for funds for spending on fee and expense heads given in the
table below.
Use of Budget 2015 2016 2017 2018 2019 Total
Fees
International Resource Days 8 710 341.5 151 20 1,231
National Resource Days 8 1201 764 406 5 2,384
International Resource Fees £ 6,441.19 £ 571,655.29 £ 274,958.14 £ 121,577.39 £ 16,102.97 £ 990,734.98
National Resource Fees £ 1,370.56 £ 205,754.67 £ 130,888.07 £ 69,555.70 £ 856.60 £ 408,425.59
Sub Total Fees (F) £ 7,811.74 £ 777,409.96 £ 405,846.21 £ 191,133.09 £ 16,959.56 £ 1,399,160.56
Expenses
International travel £ 3,474.00 £ 40,530.00 £ 17,370.00 £ 10,422.00 £ 3,474.00 £ 75,270.00
National/local travel £ 454.00 £ 20,000.00 £ 9,000.00 £ 6,000.00 £ 1,000.00 £ 36,454.00
Accommodation/ subsistence £ 1,184.00 £ 51,322.50 £ 21,771.00 £ 11,056.50 £ 1,710.00 £ 87,044.00
Workshops £ 2,250.00 £ 31,750.00 £ 19,750.00 £ 13,750.00 £ - £ 67,500.00
Training events £ - £ 1,969,624.12 £ 933,311.00 £ 483,811.00 £ - £ 3,386,746.12
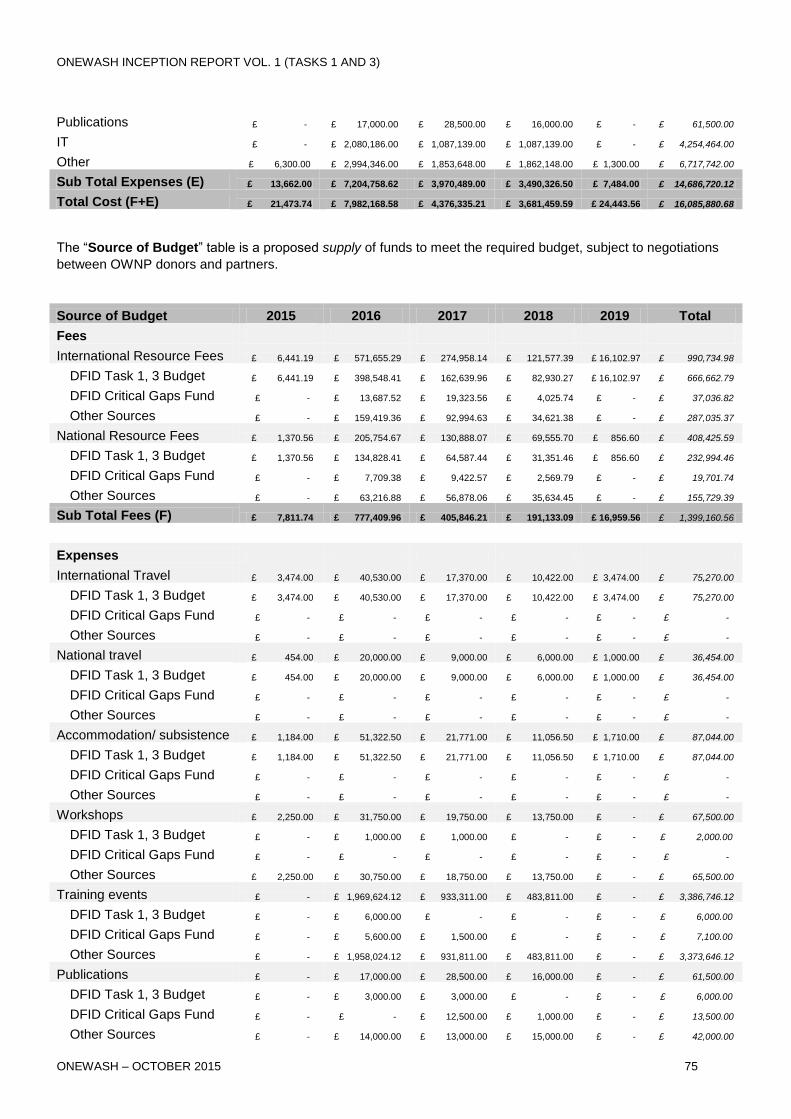
ONEWASH INCEPTION REPORT VOL. 1 (TASKS 1 AND 3)
ONEWASH – OCTOBER 2015 75
Publications £ - £ 17,000.00 £ 28,500.00 £ 16,000.00 £ - £ 61,500.00
IT £ - £ 2,080,186.00 £ 1,087,139.00 £ 1,087,139.00 £ - £ 4,254,464.00
Other £ 6,300.00 £ 2,994,346.00 £ 1,853,648.00 £ 1,862,148.00 £ 1,300.00 £ 6,717,742.00
Sub Total Expenses (E) £ 13,662.00 £ 7,204,758.62 £ 3,970,489.00 £ 3,490,326.50 £ 7,484.00 £ 14,686,720.12
Total Cost (F+E) £ 21,473.74 £ 7,982,168.58 £ 4,376,335.21 £ 3,681,459.59 £ 24,443.56 £ 16,085,880.68
The “Source of Budget” table is a proposed supply of funds to meet the required budget, subject to negotiations
between OWNP donors and partners.
Source of Budget 2015 2016 2017 2018 2019 Total
Fees
International Resource Fees £ 6,441.19 £ 571,655.29 £ 274,958.14 £ 121,577.39 £ 16,102.97 £ 990,734.98
DFID Task 1, 3 Budget £ 6,441.19 £ 398,548.41 £ 162,639.96 £ 82,930.27 £ 16,102.97 £ 666,662.79
DFID Critical Gaps Fund £ - £ 13,687.52 £ 19,323.56 £ 4,025.74 £ - £ 37,036.82
Other Sources £ - £ 159,419.36 £ 92,994.63 £ 34,621.38 £ - £ 287,035.37
National Resource Fees £ 1,370.56 £ 205,754.67 £ 130,888.07 £ 69,555.70 £ 856.60 £ 408,425.59
DFID Task 1, 3 Budget £ 1,370.56 £ 134,828.41 £ 64,587.44 £ 31,351.46 £ 856.60 £ 232,994.46
DFID Critical Gaps Fund £ - £ 7,709.38 £ 9,422.57 £ 2,569.79 £ - £ 19,701.74
Other Sources £ - £ 63,216.88 £ 56,878.06 £ 35,634.45 £ - £ 155,729.39
Sub Total Fees (F) £ 7,811.74 £ 777,409.96 £ 405,846.21 £ 191,133.09 £ 16,959.56 £ 1,399,160.56
Expenses
International Travel £ 3,474.00 £ 40,530.00 £ 17,370.00 £ 10,422.00 £ 3,474.00 £ 75,270.00
DFID Task 1, 3 Budget £ 3,474.00 £ 40,530.00 £ 17,370.00 £ 10,422.00 £ 3,474.00 £ 75,270.00
DFID Critical Gaps Fund £ - £ - £ - £ - £ - £ -
Other Sources £ - £ - £ - £ - £ - £ -
National travel £ 454.00 £ 20,000.00 £ 9,000.00 £ 6,000.00 £ 1,000.00 £ 36,454.00
DFID Task 1, 3 Budget £ 454.00 £ 20,000.00 £ 9,000.00 £ 6,000.00 £ 1,000.00 £ 36,454.00
DFID Critical Gaps Fund £ - £ - £ - £ - £ - £ -
Other Sources £ - £ - £ - £ - £ - £ -
Accommodation/ subsistence £ 1,184.00 £ 51,322.50 £ 21,771.00 £ 11,056.50 £ 1,710.00 £ 87,044.00
DFID Task 1, 3 Budget £ 1,184.00 £ 51,322.50 £ 21,771.00 £ 11,056.50 £ 1,710.00 £ 87,044.00
DFID Critical Gaps Fund £ - £ - £ - £ - £ - £ -
Other Sources £ - £ - £ - £ - £ - £ -
Workshops £ 2,250.00 £ 31,750.00 £ 19,750.00 £ 13,750.00 £ - £ 67,500.00
DFID Task 1, 3 Budget £ - £ 1,000.00 £ 1,000.00 £ - £ - £ 2,000.00
DFID Critical Gaps Fund £ - £ - £ - £ - £ - £ -
Other Sources £ 2,250.00 £ 30,750.00 £ 18,750.00 £ 13,750.00 £ - £ 65,500.00
Training events £ - £ 1,969,624.12 £ 933,311.00 £ 483,811.00 £ - £ 3,386,746.12
DFID Task 1, 3 Budget £ - £ 6,000.00 £ - £ - £ - £ 6,000.00
DFID Critical Gaps Fund £ - £ 5,600.00 £ 1,500.00 £ - £ - £ 7,100.00
Other Sources £ - £ 1,958,024.12 £ 931,811.00 £ 483,811.00 £ - £ 3,373,646.12
Publications £ - £ 17,000.00 £ 28,500.00 £ 16,000.00 £ - £ 61,500.00
DFID Task 1, 3 Budget £ - £ 3,000.00 £ 3,000.00 £ - £ - £ 6,000.00
DFID Critical Gaps Fund £ - £ - £ 12,500.00 £ 1,000.00 £ - £ 13,500.00
Other Sources £ - £ 14,000.00 £ 13,000.00 £ 15,000.00 £ - £ 42,000.00
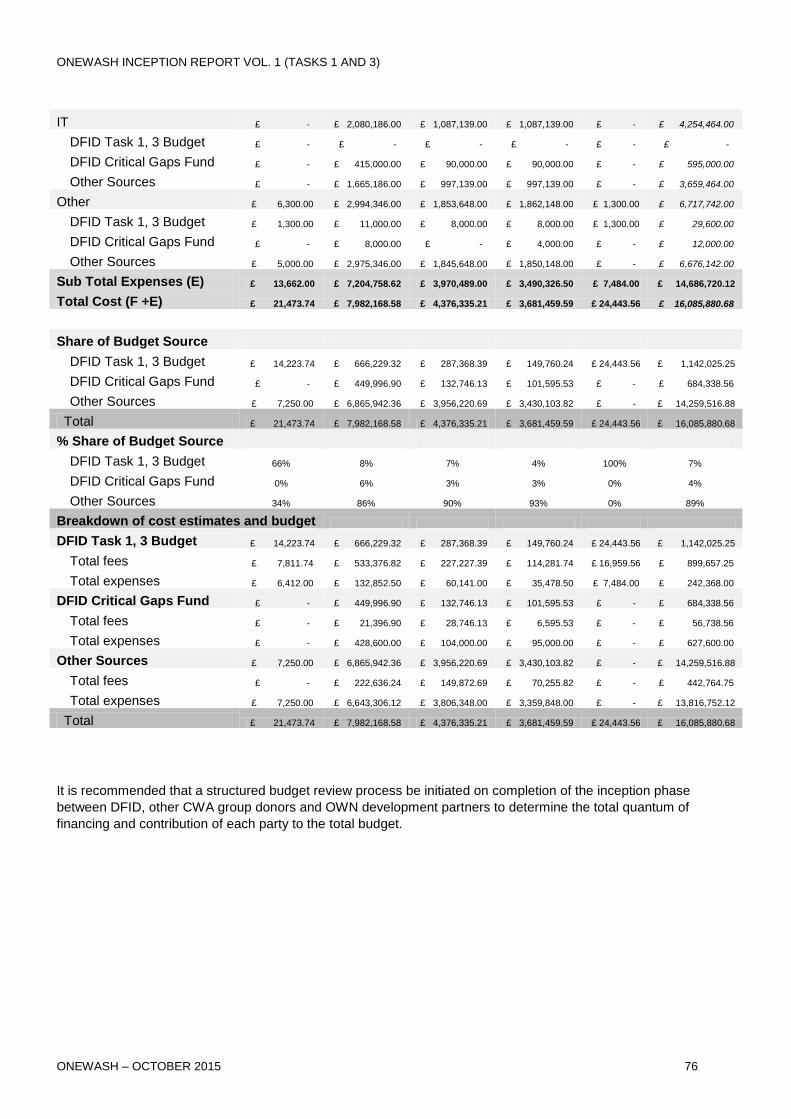
ONEWASH INCEPTION REPORT VOL. 1 (TASKS 1 AND 3)
ONEWASH – OCTOBER 2015 76
IT £ - £ 2,080,186.00 £ 1,087,139.00 £ 1,087,139.00 £ - £ 4,254,464.00
DFID Task 1, 3 Budget £ - £ - £ - £ - £ - £ -
DFID Critical Gaps Fund £ - £ 415,000.00 £ 90,000.00 £ 90,000.00 £ - £ 595,000.00
Other Sources £ - £ 1,665,186.00 £ 997,139.00 £ 997,139.00 £ - £ 3,659,464.00
Other £ 6,300.00 £ 2,994,346.00 £ 1,853,648.00 £ 1,862,148.00 £ 1,300.00 £ 6,717,742.00
DFID Task 1, 3 Budget £ 1,300.00 £ 11,000.00 £ 8,000.00 £ 8,000.00 £ 1,300.00 £ 29,600.00
DFID Critical Gaps Fund £ - £ 8,000.00 £ - £ 4,000.00 £ - £ 12,000.00
Other Sources £ 5,000.00 £ 2,975,346.00 £ 1,845,648.00 £ 1,850,148.00 £ - £ 6,676,142.00
Sub Total Expenses (E) £ 13,662.00 £ 7,204,758.62 £ 3,970,489.00 £ 3,490,326.50 £ 7,484.00 £ 14,686,720.12
Total Cost (F +E) £ 21,473.74 £ 7,982,168.58 £ 4,376,335.21 £ 3,681,459.59 £ 24,443.56 £ 16,085,880.68
Share of Budget Source
DFID Task 1, 3 Budget £ 14,223.74 £ 666,229.32 £ 287,368.39 £ 149,760.24 £ 24,443.56 £ 1,142,025.25
DFID Critical Gaps Fund £ - £ 449,996.90 £ 132,746.13 £ 101,595.53 £ - £ 684,338.56
Other Sources £ 7,250.00 £ 6,865,942.36 £ 3,956,220.69 £ 3,430,103.82 £ - £ 14,259,516.88
Total £ 21,473.74 £ 7,982,168.58 £ 4,376,335.21 £ 3,681,459.59 £ 24,443.56 £ 16,085,880.68
% Share of Budget Source
DFID Task 1, 3 Budget 66% 8% 7% 4% 100% 7%
DFID Critical Gaps Fund 0% 6% 3% 3% 0% 4%
Other Sources 34% 86% 90% 93% 0% 89%
Breakdown of cost estimates and budget
DFID Task 1, 3 Budget £ 14,223.74 £ 666,229.32 £ 287,368.39 £ 149,760.24 £ 24,443.56 £ 1,142,025.25
Total fees £ 7,811.74 £ 533,376.82 £ 227,227.39 £ 114,281.74 £ 16,959.56 £ 899,657.25
Total expenses £ 6,412.00 £ 132,852.50 £ 60,141.00 £ 35,478.50 £ 7,484.00 £ 242,368.00
DFID Critical Gaps Fund £ - £ 449,996.90 £ 132,746.13 £ 101,595.53 £ - £ 684,338.56
Total fees £ - £ 21,396.90 £ 28,746.13 £ 6,595.53 £ - £ 56,738.56
Total expenses £ - £ 428,600.00 £ 104,000.00 £ 95,000.00 £ - £ 627,600.00
Other Sources £ 7,250.00 £ 6,865,942.36 £ 3,956,220.69 £ 3,430,103.82 £ - £ 14,259,516.88
Total fees £ - £ 222,636.24 £ 149,872.69 £ 70,255.82 £ - £ 442,764.75
Total expenses £ 7,250.00 £ 6,643,306.12 £ 3,806,348.00 £ 3,359,848.00 £ - £ 13,816,752.12
Total £ 21,473.74 £ 7,982,168.58 £ 4,376,335.21 £ 3,681,459.59 £ 24,443.56 £ 16,085,880.68
It is recommended that a structured budget review process be initiated on completion of the inception phase
between DFID, other CWA group donors and OWN development partners to determine the total quantum of
financing and contribution of each party to the total budget.
ANNEX 1: REFERENCES / ONEWASH INCEPTION REPORT VOL.1 (TASKS 1 AND 3)
ONEWASH – OCTOBER 2015 77
Annex 1: References
Birhane, G., Aboma, G. and Seyoum, M. (2013) WASH Harmonization and Capacity Building Initiative. Field Notes
for Cascading the WASH Implementation Framework. WaterAid Ethiopia, Addis Ababa
Brocklesby, M. (2013) Social Assessment of the Water Supply, Sanitation and Hygiene Program: OWN-P.
Coffey/IRC (2015) Diagnostic Review Report. Consultancy report. Coffey International Development, London.
Evidence on Demand (2013) Evaluation of WASH Capacity Building Interventions in Ethiopia.
FDRE (2013) One WaSH National Program: Program document. MoWIE, Addis Ababa
FDRE (2013b) Environmental and Social Management Framework (ESMF). Water Supply and Sanitation Program
WaSH II, Ministry of Water and Energy, Addis Ababa.
FDRE (2013c) Resettlement Policy Framework (Draft). Water Supply and Sanitation Program WaSH II, Ministry of
Water and Energy, Addis Ababa.
FDRE (2014) OWNP: Program Operational Manual (POM) for the Consolidated WaSH Accounts. MoWIE, Addis
Ababa.
FDRE (2015) Draft water section for the second Growth and Transformation Plan (GTP2) document. Addis Ababa
FDRE (2015b) Integrated Urban Sanitation and Hygiene Strategy Document (draft). Addis Ababa
FDRE (2008). WaSH M&E Framework and Manual: Version 1.0. Addis Ababa.
FDRE (2015c) Support to the OWNP: Protocol Agreement between the Federal Democratic Republic Of Ethiopia
and African Development Bank. MoWIE, Addis Ababa
Federal Ministry of Health (2014). Revised HMIS Indicator definitions: Technical Standards. Addis Ababa
IRC (2015a) WaSH M&E Systems: Existing Capacity Constraints. Draft Discussion Paper prepared by IRC/One
WaSH National Programme M&E Support Team. IRC Ethiopia, Addis Ababa.
IRC (2015b). Assessment of the WaSH M&E MIS. Draft Discussion Paper prepared by IRC/One WaSH National
Programme M&E Support Team for Stakeholder workshop 22 September 2015. IRC Ethiopia, Addis Ababa
IRC (2015c) Design options for strengthened monitoring of water supply within the One WaSH National
Programme. Draft Discussion Paper prepared by IRC/One WaSH National Programme M&E Support Team. IRC
Ethiopia, Addis Ababa.
IRC (2015d) Options for integrated OWNP reporting. Draft Discussion Paper prepared by IRC/One WaSH National
Programme M&E Support Team for Stakeholder workshop 22 September 2015. IRC Ethiopia, Addis Ababa
Jones, O. (2015) Monitoring Sanitation and Hygiene in Rural Ethiopia: A Diagnostic Analysis of Systems, Tools and
Capacity. Water and Sanitation Programme Technical Paper, World Bank, Addis Ababa.
MoWE (2010) National Water Supply Sanitation and Hygiene Inventory. Data Collection Formats. MoWE, Addis
Ababa.
NWCO (2014) Capacity Gaps in the Ethiopian WASH sector. Presentation slides by Abiy Girma.
OWNP (2015) Consolidated OWNP Capacity Building Package proposal document. NWCO, Addis Ababa
Prat, M.A., Ross, I. & Kebede, S. (2014) Value for Money and Sustainability in WASH Programmes: Assessing the
VFM of DFID’s contribution to the Water Supply and Sanitation Programme (WSSP) in Ethiopia. Oxford Policy
Management, Oxford.
Water Sector Working Group (2015) Capacity Building proposal document. MoWIE, Addis Ababa
ANNEX 2: ORGANISATIONS CONSULTED / ONEWASH INCEPTION REPORT VOL.1 (TASKS 1 AND 3)
ONEWASH – OCTOBER 2015 78
Annex 2: Organisations Consulted
During the inception period, the following organisations and offices were consulted:
Ministry of Water, Irrigation and Energy (including State Minister, Water Supply and Sanitation Directorate,
Planning Directorate and Geo-information and Information Technology Directorate)
National WaSH Coordination Office
Ministry of Health (including Hygiene and Environmental Health Directorate, and Planning and Policy
Directorate staff)
Ministry of Education (including Planning, Resource Mobilization Education Directorate and Education
Management Information Systems Directorate)
Ministry of Finance and Economic Development (including Channel one programs coordination office and
IBEX/IFMIS project office staff)
Central Statistical Agency
UK Department for International Development (DFID)
World Bank
Water and Sanitation Program (WSP)
African Development Bank
UNICEF
COWASH
Water Aid Ethiopia
CCRDA
SNV
USAID
ICRC
Professionals United Together (PUT)
Akvo
Oxford Policy Management
SNNPR-Region
Bureau of Water Resource ((including RWCO, Water PMU and other departments)
Bureau of Finance and Economic Development
Bureau of Health
Bureau Education
Hawassa Water technology TVETC
Dilla Health Science College
Sidama zone Water Mine and Energy Department
Guraghe zone Water, Mine and Energy Department
Gedeo zone Water, Mine and Energy Department
Halaba special Woreda Water, Mine and Energy office
Halaba Special Woreda Finance and Economic Development Office
ANNEX 2: ORGANISATIONS CONSULTED / ONEWASH INCEPTION REPORT VOL.1 (TASKS 1 AND 3)
ONEWASH – OCTOBER 2015 79
People In Need (NGO)
Wondo Genet Woreda Water, Mine and Energy Office
Wondo Genet Woreda Health Office
Wondo Genet Woreda Education Office
Dara Woreda Water, Mine and Energy Office
Yirgacheffe Woreda Water, Mine and Energy Office
Benishangul Gumuz-Region
Bureau of Water Resource (including RWCO, Water PUM and other departments)
Bureau of Health
Bureau of Education
COWASH CMP project
Regional UNICEF Office
Bambasi woreda Administration Office
Bambasi woreda Water, Mine and Energy Office
Sherkole woreda Water, Mine and Energy Office
Kurmuk woreda Water, Mine and Energy Office
Tigray-Region
Bureau of Water Resource (including RWCO, Water PUM and other department staffs)
Bureau of Education
Bureau of Health
REST
Charity: Water
Regional SNV Office
Regional UNICEF Office
COWASH CMP Project
ICRC Office
Kilite Awlalo woreda Water, Mine and Energy Office
Wukro woreda Health Office
Wukro woreda Education Office
Wukro Town Municipality
Wukro Town Water Supply Utility Office
Hadish Town Water Supply Utility office
Alaje woreda Water, Mine and Energy Office
Alaje woreda Education Office
Alaje woreda Health Office
Adigirat Woreda Water, Mine and Energy Office
Amhara-Region
East Gojam zone Enarjina Enawega woreda Water, Mine and Energy Office
ANNEX 2: ORGANISATIONS CONSULTED / ONEWASH INCEPTION REPORT VOL.1 (TASKS 1 AND 3)
ONEWASH – OCTOBER 2015 80
Oromia Special zone Bati woreda Water, Mine and Energy Office
South Gonder zone Tach Gayint woreda Water, Mine and Energy Office
Oromia-Region
Bureau of Water Resource (including RWCO, Water PUM and other departments)
Illu ababora zone, Metu woreda Water, Mine and Energy Office
South West Showa zone, Akaki woreda Water, Mine and Energy Office
West Wellega zone, Mene sibu woreda Water, Mine and Energy Office
West Shewa zone, Suten Soddo woreda Water, Mine and Energy Office
West Shewa zone, Adea Berga woreda Water, Mine and Energy Office
Somali-Region
Bureau of Water Resource (including RWCO, Water PMU and other departments)
Shebelle zone Water, Mine and Energy Department
Afder zone Water, Mine and Energy Department
Siti zone Water, Mine and Energy Department

ANNEX 3: PROPOSED OWNP M&E INDICATORS / ONEWASH INCEPTION REPORT VOL.1 (TASKS 1 AND 3)
ONEWASH – OCTOBER 2015 81
Annex 3: Proposed OWNP M&E Indicators
Please read section 2.3.1 of the main report in conjunction with the indicators elaborated below.
No Indicator Definition Data sources and measurability Dis-aggregation Discussion
Introductory notes
No. Proposed indicators are
listed within 3 proposed
groups: 1) a selected
number of KPIs 2)
supplementary indicators
and 3) other indicators.
See section 3.3.1 of main
report for further
discussion.
An unambiguous explanation of
the indicator with all sub-
components defined.
Discussion on data sources which include:
Regular sector monitoring and reporting
Regular water supply reporting (with WaSH M&E MIS
system under development)
Health Management Information System (HMIS)
Hygiene and Environmental Health (HEH) Programme
Monitoring
National Education Management Information System
(EMIS)
MoFED (IBEX)
National WaSH inventory
Additional sector monitoring studies
OWNP impact evaluation surveys
Sustainability checks
Behaviour change studies
National Drinking Water Quality Monitoring and
Surveillance Strategy (to be established)
Rapid Assessment on Drinking-water Quality (RADWQ)
Nationally-representative household surveys undertaken by
the Central Statistical Agency
DHS, WMS, HCES, Census etc.
Explains the levels at
which data are
disaggregated
Identifies targets where known,
issues, areas for further
discussion to reach agreement,
further indicator development etc.

ANNEX 3: PROPOSED OWNP M&E INDICATORS / ONEWASH INCEPTION REPORT VOL.1 (TASKS 1 AND 3)
ONEWASH – OCTOBER 2015 82
No Indicator Definition Data sources and measurability Dis-aggregation Discussion
Water supply: Proposed Core KPIs
KPI1 Water supply access
coverage as per service
level standard for GTP1.
Percentage of population with
access to improved (as per JMP
definition) drinking water services.
In rural areas, percentage of rural
population with access to
improved drinking water services
as per GTP-1 service level
standard (15 l/c/day within 1.5
km).
In urban areas, percentage of
population with access to
improved drinking water services
as per GTP-1 service level
standard (20 l/c/day within 0.5
km).
Data will be sourced from the National WaSH Inventory and its
updates, with population data provided by CSA (total
population, number of households, population by gender, and
population by age for each administrative area).
Rural water supply: The number of people with access to an
improved source is estimated using standard norms per
source type, and WASHCOs can provide additional data on
the known number of user households within 1.5 km using the
source.
Where the actual number of users fetching water within 1.5 km
distance is less than the maximum number of users set for
each type of improved water supply scheme as per the GTP-1
standard service level, the actual number of users is used.
Where the actual number of users fetching water within 1.5 km
distance is more than the maximum number of users set for
each type of improved water supply schemes as per the GTP-
1 standard service level, only the maximum number of users
assigned to each type of water supply scheme is used.
In case of piped schemes (from boreholes or springs), the
maximum number of users that could access the scheme as
per GTP-1 standard service level is estimated based on the
actual water source yield, daily working hour of the scheme
and the per-capita daily demand, i.e. 15 l/c/day.
The number of users at scheme level is aggregated at Kebele,
Woreda, Zone, Region and National Levels to estimate the
water supply access coverage.
Urban water supply: The maximum number of urban
population that can be served by a scheme is estimated based
Rural, urban, total;
town, kebele,
woreda, zone,
region, national;
Source/system type;
implementation
modality (WMP,
CMP, SS, NGO)
Supersedes OWNP KPI No. 1.
This indicator is developed to
track GTP2 goal 1.1 that all
citizens have (minimum) access
to safe and sustainable drinking
water. Safety and sustainability of
the water supply are not directly
measured.
Safe water is assumed to be
provided by improved water
sources. Whether improved
sources provide safe water can
be tracked through surveys such
as RADWQ and the National
Drinking Water Quality Monitoring
and Surveillance System) and
research studies.
Results are strongly affected by
the assumed numbers of users
per source type so the accuracy
of these norms needs to be
continually assessed. The
accuracy of the standard norms
needs to be assessed as many
report a lack of confidence in
validity.
Results can be triangulated with
the use of improved sources from
household survey data sources.

ANNEX 3: PROPOSED OWNP M&E INDICATORS / ONEWASH INCEPTION REPORT VOL.1 (TASKS 1 AND 3)
ONEWASH – OCTOBER 2015 83
No Indicator Definition Data sources and measurability Dis-aggregation Discussion
on the daily water abstraction potential of the scheme,
estimated losses (Unaccounted for Water) and the average
per-capita demand service level as per GTP-1 standard, i.e.
20 l/c/day.
Where the actual number of users fetching water within 0.5 km
distance, as reported by utilities, is less than the maximum
number of users estimated above, the actual numbers of
users are used in the coverage calculation.
Where the actual number of users reported to be fetching
water within 0.5 km distance is more than the maximum
number of users estimated as discussed above, only the
estimated maximum number of users is included in the
coverage calculation.
Population data: The number of rural and urban population
accessing water supply as discussed above are aggregated at
each level (Kebele, Woreda, Zone, Region and National) to
get total (rural + urban) water supply access coverage at each
level.
The population which serves as denominator in the formula for
estimating the coverage at each level is adopted from CSA
data and its projection for the given year.
Access coverage may not be
strongly related to use.
Quantity is also assumed and
there are concerns that actual
use may be much lower.
Woredas don't always accept
CSA population figures.
Projected figures may especially
be inaccurate where villagisation
takes place.
Household survey data provide
additional possibilities to
disaggregate across wealth
groups and other factors.
Results are affected by double-
counting where families use
multiple sources.
Further work is required to
specify how Self-supply will be
monitored as part of this
indicator. This requires
agreement on the definition of the
standard of Self-supply facilities
to count as improved.
KPI2 Water supply access
coverage as per service
level standard for GTP2.
Percentage of population with
access to improved (as per JMP
definition) drinking water services.
In rural areas, percentage of rural
population with access to
improved drinking water services
as per GTP-2 service level
standard (25 l/c/day within 1.0
Calculated in same way as above, with additional data
provided by WASHCOs and utilities through NWI and updates
on numbers of users within specified distance. Service level
standard and number of maximum users is set as per GTP2
standards.
Rural, urban, total;
town, kebele,
woreda, zone,
region, national;
Source/system type
implementation
modality (WMP,
CMP, SS, NGO);
This indicator is developed to
track the provision of improved
service to rural and urban
populations under GTPII goals
1.2 and 1.3. The target in rural
areas is 85% and in urban areas
75% of the population.
In practice, the actual use of
current water supplies is reported
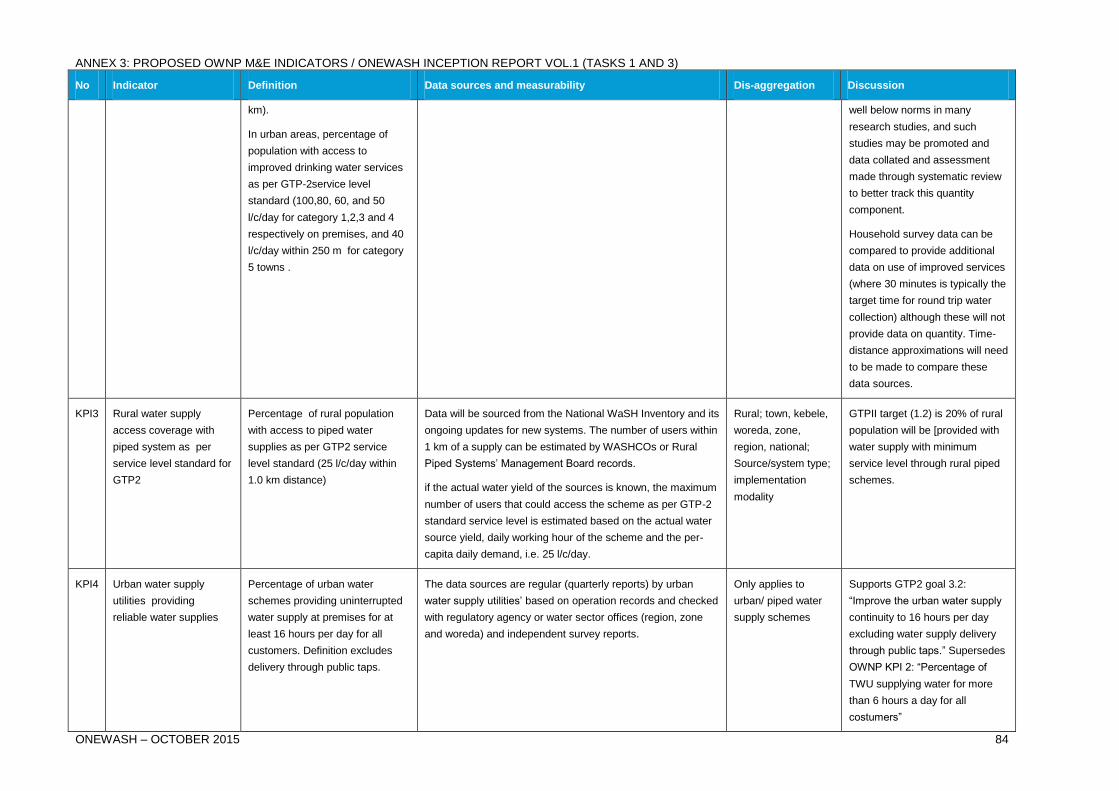
ANNEX 3: PROPOSED OWNP M&E INDICATORS / ONEWASH INCEPTION REPORT VOL.1 (TASKS 1 AND 3)
ONEWASH – OCTOBER 2015 84
No Indicator Definition Data sources and measurability Dis-aggregation Discussion
km).
In urban areas, percentage of
population with access to
improved drinking water services
as per GTP-2service level
standard (100,80, 60, and 50
l/c/day for category 1,2,3 and 4
respectively on premises, and 40
l/c/day within 250 m for category
5 towns .
well below norms in many
research studies, and such
studies may be promoted and
data collated and assessment
made through systematic review
to better track this quantity
component.
Household survey data can be
compared to provide additional
data on use of improved services
(where 30 minutes is typically the
target time for round trip water
collection) although these will not
provide data on quantity. Time-
distance approximations will need
to be made to compare these
data sources.
KPI3 Rural water supply
access coverage with
piped system as per
service level standard for
GTP2
Percentage of rural population
with access to piped water
supplies as per GTP2 service
level standard (25 l/c/day within
1.0 km distance)
Data will be sourced from the National WaSH Inventory and its
ongoing updates for new systems. The number of users within
1 km of a supply can be estimated by WASHCOs or Rural
Piped Systems’ Management Board records.
if the actual water yield of the sources is known, the maximum
number of users that could access the scheme as per GTP-2
standard service level is estimated based on the actual water
source yield, daily working hour of the scheme and the per-
capita daily demand, i.e. 25 l/c/day.
Rural; town, kebele,
woreda, zone,
region, national;
Source/system type;
implementation
modality
GTPII target (1.2) is 20% of rural
population will be [provided with
water supply with minimum
service level through rural piped
schemes.
KPI4 Urban water supply
utilities providing
reliable water supplies
Percentage of urban water
schemes providing uninterrupted
water supply at premises for at
least 16 hours per day for all
customers. Definition excludes
delivery through public taps.
The data sources are regular (quarterly reports) by urban
water supply utilities’ based on operation records and checked
with regulatory agency or water sector offices (region, zone
and woreda) and independent survey reports.
Only applies to
urban/ piped water
supply schemes
Supports GTP2 goal 3.2:
“Improve the urban water supply
continuity to 16 hours per day
excluding water supply delivery
through public taps.” Supersedes
OWNP KPI 2: “Percentage of
TWU supplying water for more
than 6 hours a day for all
costumers”

ANNEX 3: PROPOSED OWNP M&E INDICATORS / ONEWASH INCEPTION REPORT VOL.1 (TASKS 1 AND 3)
ONEWASH – OCTOBER 2015 85
No Indicator Definition Data sources and measurability Dis-aggregation Discussion
The definition requires further
work to specify how to detail with
rotation of supply within urban
areas.
KPI5 Rural water supply
schemes’ non-
functionality rate
Percentage of improved rural
water supply schemes that are not
functional at the time of survey
(excluding schemes that have
been permanently abandoned)
Quarterly report by woredas based upon reports by Kebele
Water Extension Workers (WEWs) or Kebele WaSH Teams
(KWTs) as well periodical NWI.
Only applies to rural
water schemes;
Source/ system type;
kebele, woreda,
zone, region,
national;
implementation
modality (WMP,
CMP, SS, NGO)
GTPII target (goal 2.1) for non-
functionality is 7%
Supersedes OWNP KPI No.2
(rural)
Definition requires further
specification and work on this key
KPI. This could include a specific
workshop on this indicator.
Further data on time to repair
non-functioning water supply
schemes may be desirable and
could also be collected in
quarterly reports.
KPI6 Equity: deviation from
average in access to
improved water supplies
Deviation in area (kebele, woreda
or region) access to water
services relative to average.
This is a derived indicator based upon other KPIs to highlight
the areas where access is low or high (deviating more than
10%) compared to the national average.
Kebele, woreda,
region
Supersedes OWNP KPI No.10.
This indicator needs to be tested
and improved as required.
KPI7 Urban water supply
utilities’ with Non-
Revenue Water (NRW)
less than or equal to 20%
Percentage of urban water supply
utilities with NRW less than or
equal to 20%.
The data sources are regular (quarterly reports) by urban
water supply utilities’ based on operation records and checked
with regulatory agency or water sector offices (region, zone
and woreda) and independent survey reports.
NRW coverage is estimated based on the total water
production and the total billed (collected and not collected)
water consumption for a defined period of time, e.g. month,
annual, etc.
Only applies to
urban; town
Provision included as part of
OWNP KPI No.2. GTP2 target is
to reduce from 39 to 20% by
2020 (goal 3.1).
Percentage of non-revenue water
by town would be a more specific
indicator that may provide more
actionable data.
To consider calibrating this
indicator by utility service area
size due to range of populations
covered.
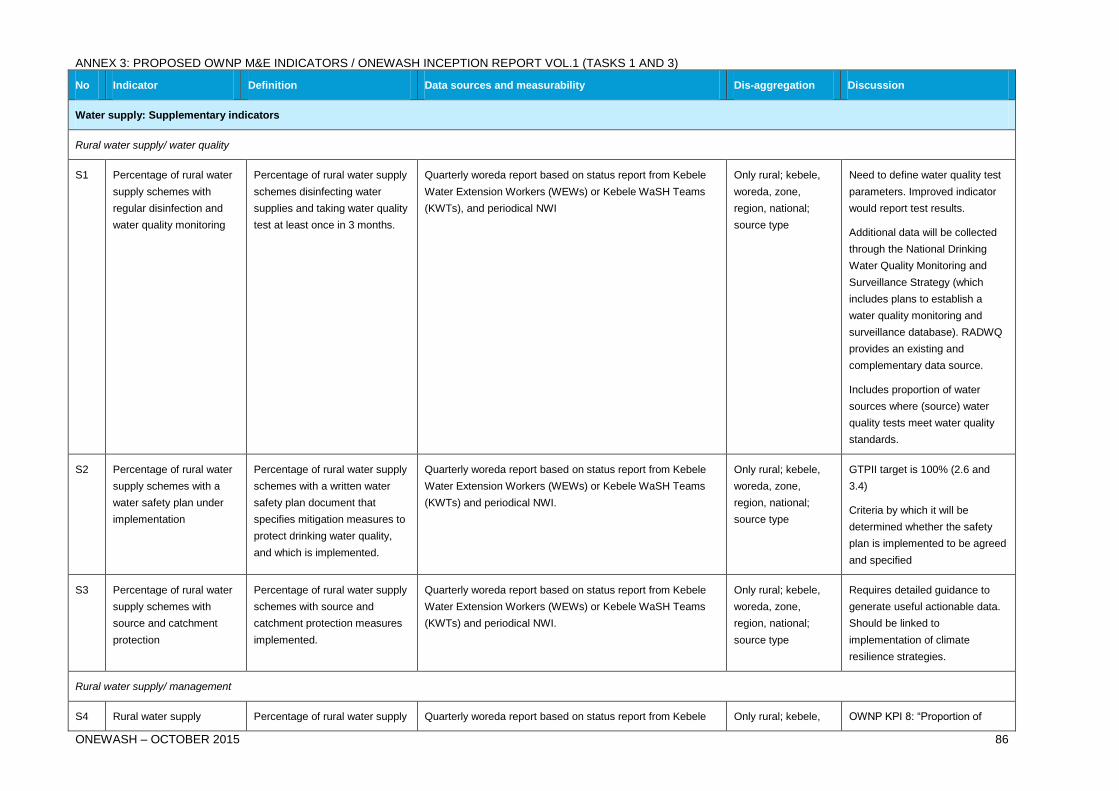
ANNEX 3: PROPOSED OWNP M&E INDICATORS / ONEWASH INCEPTION REPORT VOL.1 (TASKS 1 AND 3)
ONEWASH – OCTOBER 2015 86
No Indicator Definition Data sources and measurability Dis-aggregation Discussion
Water supply: Supplementary indicators
Rural water supply/ water quality
S1 Percentage of rural water
supply schemes with
regular disinfection and
water quality monitoring
Percentage of rural water supply
schemes disinfecting water
supplies and taking water quality
test at least once in 3 months.
Quarterly woreda report based on status report from Kebele
Water Extension Workers (WEWs) or Kebele WaSH Teams
(KWTs), and periodical NWI
Only rural; kebele,
woreda, zone,
region, national;
source type
Need to define water quality test
parameters. Improved indicator
would report test results.
Additional data will be collected
through the National Drinking
Water Quality Monitoring and
Surveillance Strategy (which
includes plans to establish a
water quality monitoring and
surveillance database). RADWQ
provides an existing and
complementary data source.
Includes proportion of water
sources where (source) water
quality tests meet water quality
standards.
S2 Percentage of rural water
supply schemes with a
water safety plan under
implementation
Percentage of rural water supply
schemes with a written water
safety plan document that
specifies mitigation measures to
protect drinking water quality,
and which is implemented.
Quarterly woreda report based on status report from Kebele
Water Extension Workers (WEWs) or Kebele WaSH Teams
(KWTs) and periodical NWI.
Only rural; kebele,
woreda, zone,
region, national;
source type
GTPII target is 100% (2.6 and
3.4)
Criteria by which it will be
determined whether the safety
plan is implemented to be agreed
and specified
S3 Percentage of rural water
supply schemes with
source and catchment
protection
Percentage of rural water supply
schemes with source and
catchment protection measures
implemented.
Quarterly woreda report based on status report from Kebele
Water Extension Workers (WEWs) or Kebele WaSH Teams
(KWTs) and periodical NWI.
Only rural; kebele,
woreda, zone,
region, national;
source type
Requires detailed guidance to
generate useful actionable data.
Should be linked to
implementation of climate
resilience strategies.
Rural water supply/ management
S4 Rural water supply Percentage of rural water supply Quarterly woreda report based on status report from Kebele Only rural; kebele, OWNP KPI 8: “Proportion of
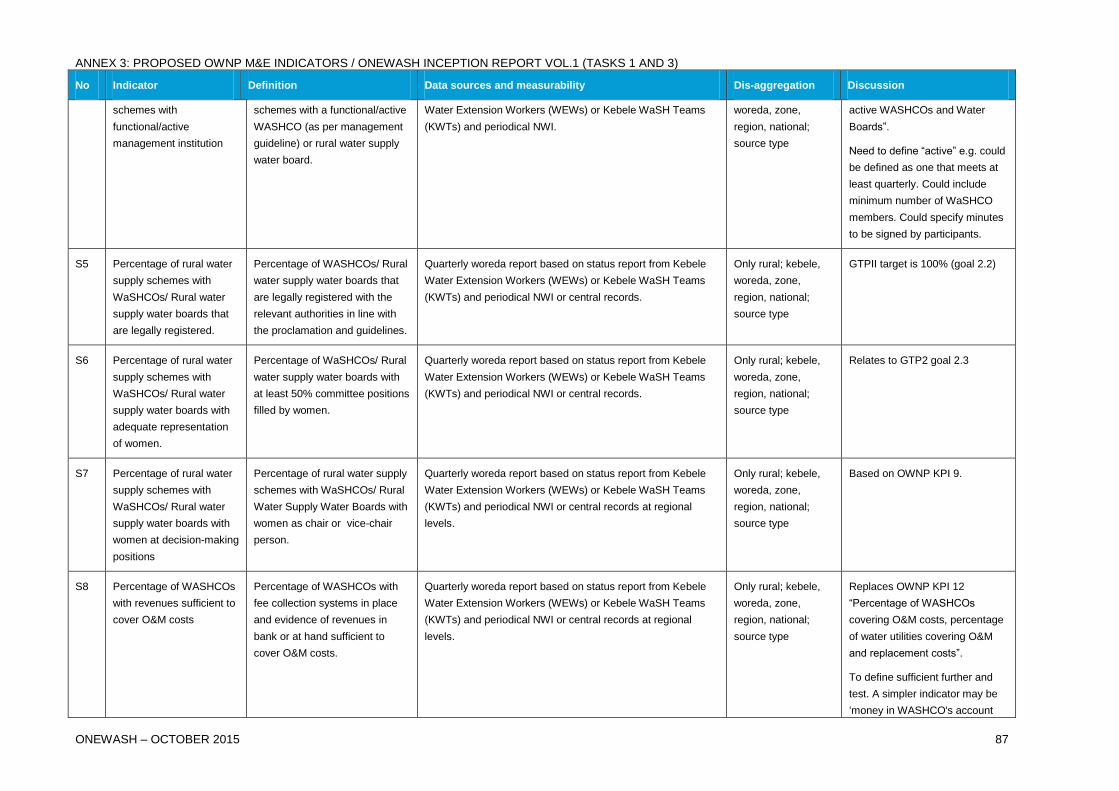
ANNEX 3: PROPOSED OWNP M&E INDICATORS / ONEWASH INCEPTION REPORT VOL.1 (TASKS 1 AND 3)
ONEWASH – OCTOBER 2015 87
No Indicator Definition Data sources and measurability Dis-aggregation Discussion
schemes with
functional/active
management institution
schemes with a functional/active
WASHCO (as per management
guideline) or rural water supply
water board.
Water Extension Workers (WEWs) or Kebele WaSH Teams
(KWTs) and periodical NWI.
woreda, zone,
region, national;
source type
active WASHCOs and Water
Boards”.
Need to define “active” e.g. could
be defined as one that meets at
least quarterly. Could include
minimum number of WaSHCO
members. Could specify minutes
to be signed by participants.
S5 Percentage of rural water
supply schemes with
WaSHCOs/ Rural water
supply water boards that
are legally registered.
Percentage of WASHCOs/ Rural
water supply water boards that
are legally registered with the
relevant authorities in line with
the proclamation and guidelines.
Quarterly woreda report based on status report from Kebele
Water Extension Workers (WEWs) or Kebele WaSH Teams
(KWTs) and periodical NWI or central records.
Only rural; kebele,
woreda, zone,
region, national;
source type
GTPII target is 100% (goal 2.2)
S6 Percentage of rural water
supply schemes with
WaSHCOs/ Rural water
supply water boards with
adequate representation
of women.
Percentage of WaSHCOs/ Rural
water supply water boards with
at least 50% committee positions
filled by women.
Quarterly woreda report based on status report from Kebele
Water Extension Workers (WEWs) or Kebele WaSH Teams
(KWTs) and periodical NWI or central records.
Only rural; kebele,
woreda, zone,
region, national;
source type
Relates to GTP2 goal 2.3
S7 Percentage of rural water
supply schemes with
WaSHCOs/ Rural water
supply water boards with
women at decision-making
positions
Percentage of rural water supply
schemes with WaSHCOs/ Rural
Water Supply Water Boards with
women as chair or vice-chair
person.
Quarterly woreda report based on status report from Kebele
Water Extension Workers (WEWs) or Kebele WaSH Teams
(KWTs) and periodical NWI or central records at regional
levels.
Only rural; kebele,
woreda, zone,
region, national;
source type
Based on OWNP KPI 9.
S8 Percentage of WASHCOs
with revenues sufficient to
cover O&M costs
Percentage of WASHCOs with
fee collection systems in place
and evidence of revenues in
bank or at hand sufficient to
cover O&M costs.
Quarterly woreda report based on status report from Kebele
Water Extension Workers (WEWs) or Kebele WaSH Teams
(KWTs) and periodical NWI or central records at regional
levels.
Only rural; kebele,
woreda, zone,
region, national;
source type
Replaces OWNP KPI 12
“Percentage of WASHCOs
covering O&M costs, percentage
of water utilities covering O&M
and replacement costs”.
To define sufficient further and
test. A simpler indicator may be
‘money in WASHCO's account
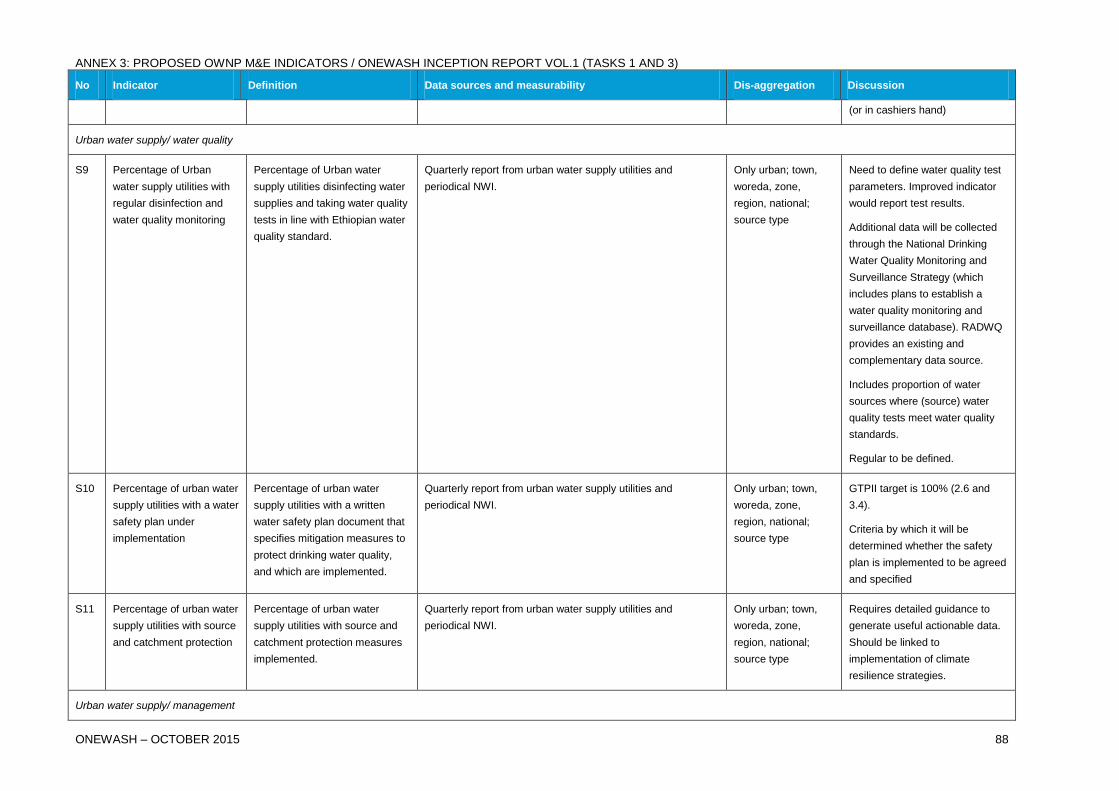
ANNEX 3: PROPOSED OWNP M&E INDICATORS / ONEWASH INCEPTION REPORT VOL.1 (TASKS 1 AND 3)
ONEWASH – OCTOBER 2015 88
No Indicator Definition Data sources and measurability Dis-aggregation Discussion
(or in cashiers hand)
Urban water supply/ water quality
S9 Percentage of Urban
water supply utilities with
regular disinfection and
water quality monitoring
Percentage of Urban water
supply utilities disinfecting water
supplies and taking water quality
tests in line with Ethiopian water
quality standard.
Quarterly report from urban water supply utilities and
periodical NWI.
Only urban; town,
woreda, zone,
region, national;
source type
Need to define water quality test
parameters. Improved indicator
would report test results.
Additional data will be collected
through the National Drinking
Water Quality Monitoring and
Surveillance Strategy (which
includes plans to establish a
water quality monitoring and
surveillance database). RADWQ
provides an existing and
complementary data source.
Includes proportion of water
sources where (source) water
quality tests meet water quality
standards.
Regular to be defined.
S10 Percentage of urban water
supply utilities with a water
safety plan under
implementation
Percentage of urban water
supply utilities with a written
water safety plan document that
specifies mitigation measures to
protect drinking water quality,
and which are implemented.
Quarterly report from urban water supply utilities and
periodical NWI.
Only urban; town,
woreda, zone,
region, national;
source type
GTPII target is 100% (2.6 and
3.4).
Criteria by which it will be
determined whether the safety
plan is implemented to be agreed
and specified
S11 Percentage of urban water
supply utilities with source
and catchment protection
Percentage of urban water
supply utilities with source and
catchment protection measures
implemented.
Quarterly report from urban water supply utilities and
periodical NWI.
Only urban; town,
woreda, zone,
region, national;
source type
Requires detailed guidance to
generate useful actionable data.
Should be linked to
implementation of climate
resilience strategies.
Urban water supply/ management
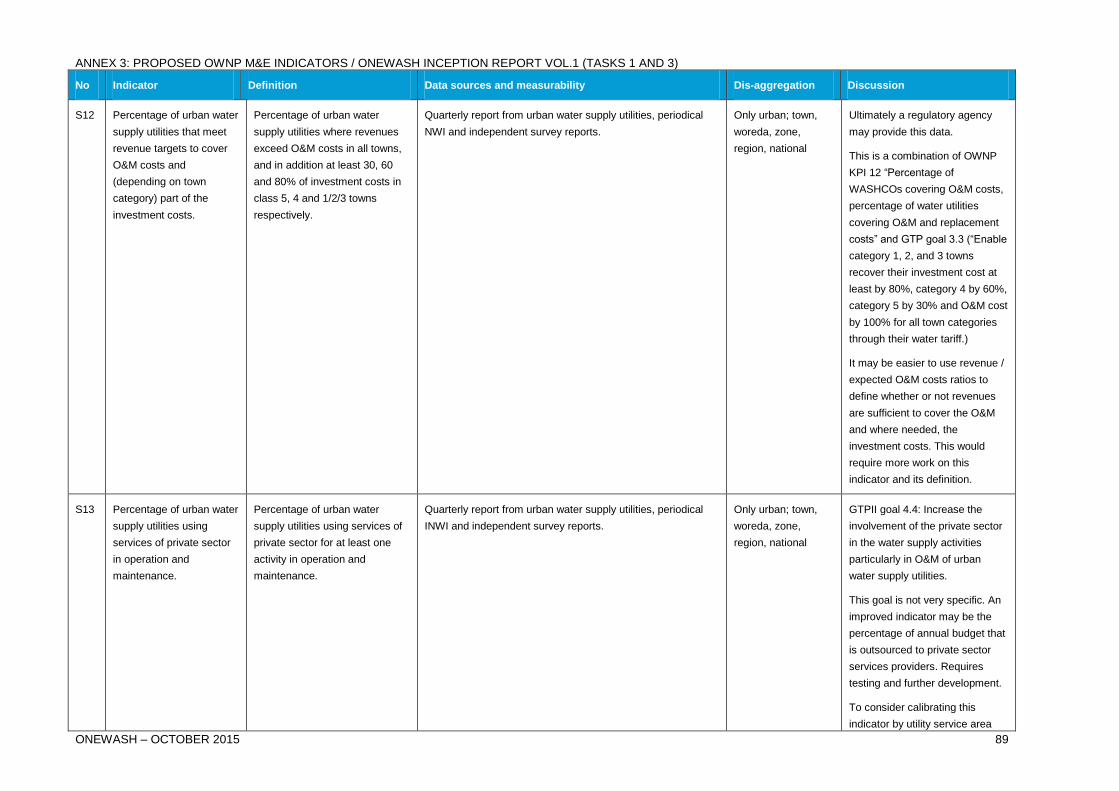
ANNEX 3: PROPOSED OWNP M&E INDICATORS / ONEWASH INCEPTION REPORT VOL.1 (TASKS 1 AND 3)
ONEWASH – OCTOBER 2015 89
No Indicator Definition Data sources and measurability Dis-aggregation Discussion
S12 Percentage of urban water
supply utilities that meet
revenue targets to cover
O&M costs and
(depending on town
category) part of the
investment costs.
Percentage of urban water
supply utilities where revenues
exceed O&M costs in all towns,
and in addition at least 30, 60
and 80% of investment costs in
class 5, 4 and 1/2/3 towns
respectively.
Quarterly report from urban water supply utilities, periodical
NWI and independent survey reports.
Only urban; town,
woreda, zone,
region, national
Ultimately a regulatory agency
may provide this data.
This is a combination of OWNP
KPI 12 “Percentage of
WASHCOs covering O&M costs,
percentage of water utilities
covering O&M and replacement
costs” and GTP goal 3.3 (“Enable
category 1, 2, and 3 towns
recover their investment cost at
least by 80%, category 4 by 60%,
category 5 by 30% and O&M cost
by 100% for all town categories
through their water tariff.)
It may be easier to use revenue /
expected O&M costs ratios to
define whether or not revenues
are sufficient to cover the O&M
and where needed, the
investment costs. This would
require more work on this
indicator and its definition.
S13 Percentage of urban water
supply utilities using
services of private sector
in operation and
maintenance.
Percentage of urban water
supply utilities using services of
private sector for at least one
activity in operation and
maintenance.
Quarterly report from urban water supply utilities, periodical
INWI and independent survey reports.
Only urban; town,
woreda, zone,
region, national
GTPII goal 4.4: Increase the
involvement of the private sector
in the water supply activities
particularly in O&M of urban
water supply utilities.
This goal is not very specific. An
improved indicator may be the
percentage of annual budget that
is outsourced to private sector
services providers. Requires
testing and further development.
To consider calibrating this
indicator by utility service area
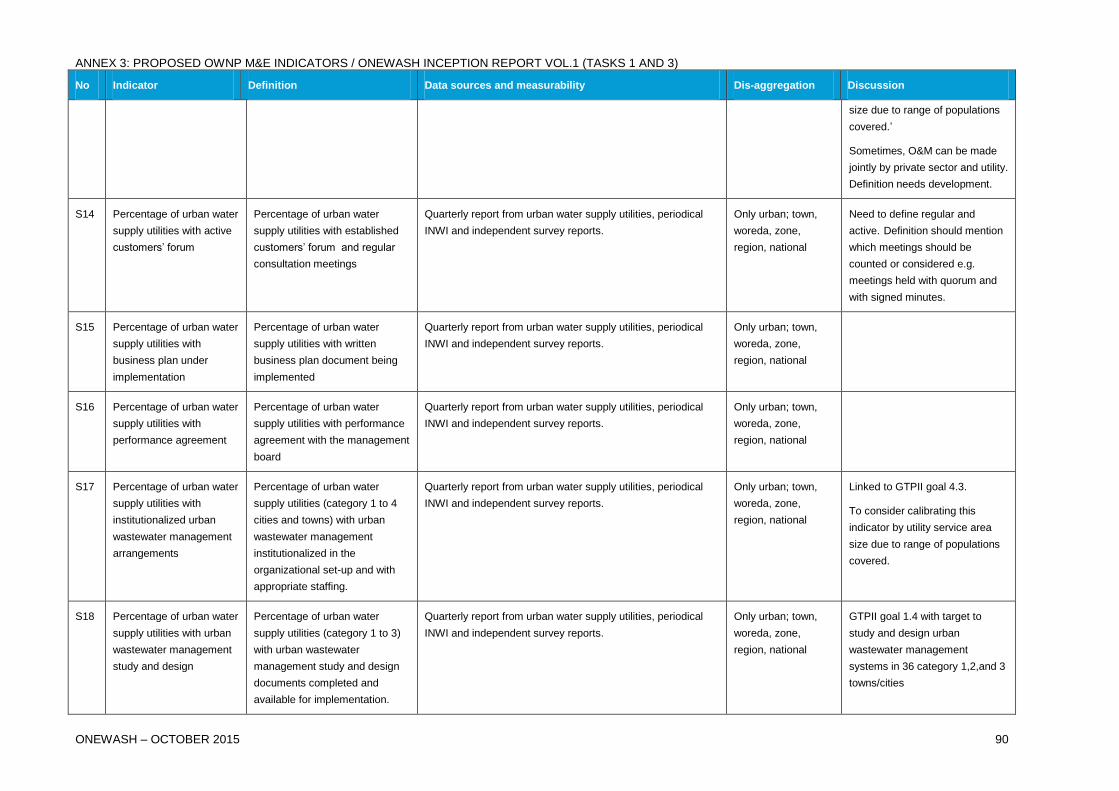
ANNEX 3: PROPOSED OWNP M&E INDICATORS / ONEWASH INCEPTION REPORT VOL.1 (TASKS 1 AND 3)
ONEWASH – OCTOBER 2015 90
No Indicator Definition Data sources and measurability Dis-aggregation Discussion
size due to range of populations
covered.’
Sometimes, O&M can be made
jointly by private sector and utility.
Definition needs development.
S14 Percentage of urban water
supply utilities with active
customers’ forum
Percentage of urban water
supply utilities with established
customers’ forum and regular
consultation meetings
Quarterly report from urban water supply utilities, periodical
INWI and independent survey reports.
Only urban; town,
woreda, zone,
region, national
Need to define regular and
active. Definition should mention
which meetings should be
counted or considered e.g.
meetings held with quorum and
with signed minutes.
S15 Percentage of urban water
supply utilities with
business plan under
implementation
Percentage of urban water
supply utilities with written
business plan document being
implemented
Quarterly report from urban water supply utilities, periodical
INWI and independent survey reports.
Only urban; town,
woreda, zone,
region, national
S16 Percentage of urban water
supply utilities with
performance agreement
Percentage of urban water
supply utilities with performance
agreement with the management
board
Quarterly report from urban water supply utilities, periodical
INWI and independent survey reports.
Only urban; town,
woreda, zone,
region, national
S17 Percentage of urban water
supply utilities with
institutionalized urban
wastewater management
arrangements
Percentage of urban water
supply utilities (category 1 to 4
cities and towns) with urban
wastewater management
institutionalized in the
organizational set-up and with
appropriate staffing.
Quarterly report from urban water supply utilities, periodical
INWI and independent survey reports.
Only urban; town,
woreda, zone,
region, national
Linked to GTPII goal 4.3.
To consider calibrating this
indicator by utility service area
size due to range of populations
covered.
S18 Percentage of urban water
supply utilities with urban
wastewater management
study and design
Percentage of urban water
supply utilities (category 1 to 3)
with urban wastewater
management study and design
documents completed and
available for implementation.
Quarterly report from urban water supply utilities, periodical
INWI and independent survey reports.
Only urban; town,
woreda, zone,
region, national
GTPII goal 1.4 with target to
study and design urban
wastewater management
systems in 36 category 1,2,and 3
towns/cities
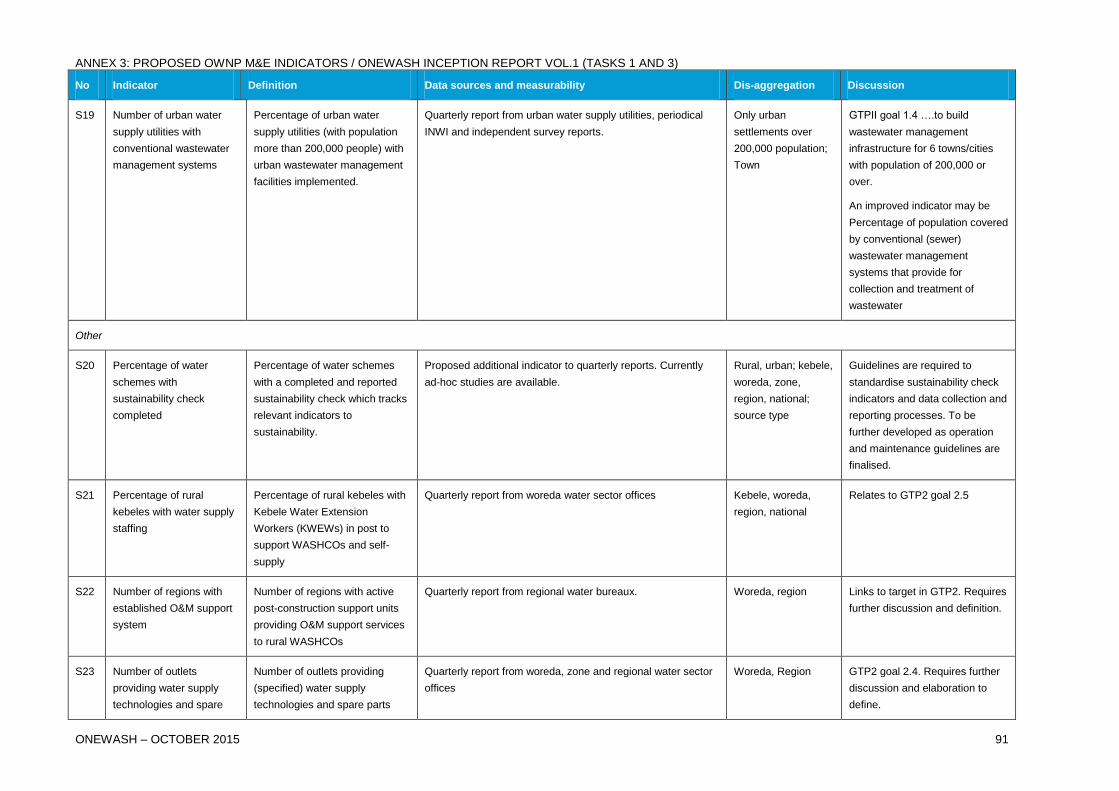
ANNEX 3: PROPOSED OWNP M&E INDICATORS / ONEWASH INCEPTION REPORT VOL.1 (TASKS 1 AND 3)
ONEWASH – OCTOBER 2015 91
No Indicator Definition Data sources and measurability Dis-aggregation Discussion
S19 Number of urban water
supply utilities with
conventional wastewater
management systems
Percentage of urban water
supply utilities (with population
more than 200,000 people) with
urban wastewater management
facilities implemented.
Quarterly report from urban water supply utilities, periodical
INWI and independent survey reports.
Only urban
settlements over
200,000 population;
Town
GTPII goal 1.4 ….to build
wastewater management
infrastructure for 6 towns/cities
with population of 200,000 or
over.
An improved indicator may be
Percentage of population covered
by conventional (sewer)
wastewater management
systems that provide for
collection and treatment of
wastewater
Other
S20 Percentage of water
schemes with
sustainability check
completed
Percentage of water schemes
with a completed and reported
sustainability check which tracks
relevant indicators to
sustainability.
Proposed additional indicator to quarterly reports. Currently
ad-hoc studies are available.
Rural, urban; kebele,
woreda, zone,
region, national;
source type
Guidelines are required to
standardise sustainability check
indicators and data collection and
reporting processes. To be
further developed as operation
and maintenance guidelines are
finalised.
S21 Percentage of rural
kebeles with water supply
staffing
Percentage of rural kebeles with
Kebele Water Extension
Workers (KWEWs) in post to
support WASHCOs and self-
supply
Quarterly report from woreda water sector offices Kebele, woreda,
region, national
Relates to GTP2 goal 2.5
S22 Number of regions with
established O&M support
system
Number of regions with active
post-construction support units
providing O&M support services
to rural WASHCOs
Quarterly report from regional water bureaux. Woreda, region Links to target in GTP2. Requires
further discussion and definition.
S23 Number of outlets
providing water supply
technologies and spare
Number of outlets providing
(specified) water supply
technologies and spare parts
Quarterly report from woreda, zone and regional water sector
offices
Woreda, Region GTP2 goal 2.4. Requires further
discussion and elaboration to
define.
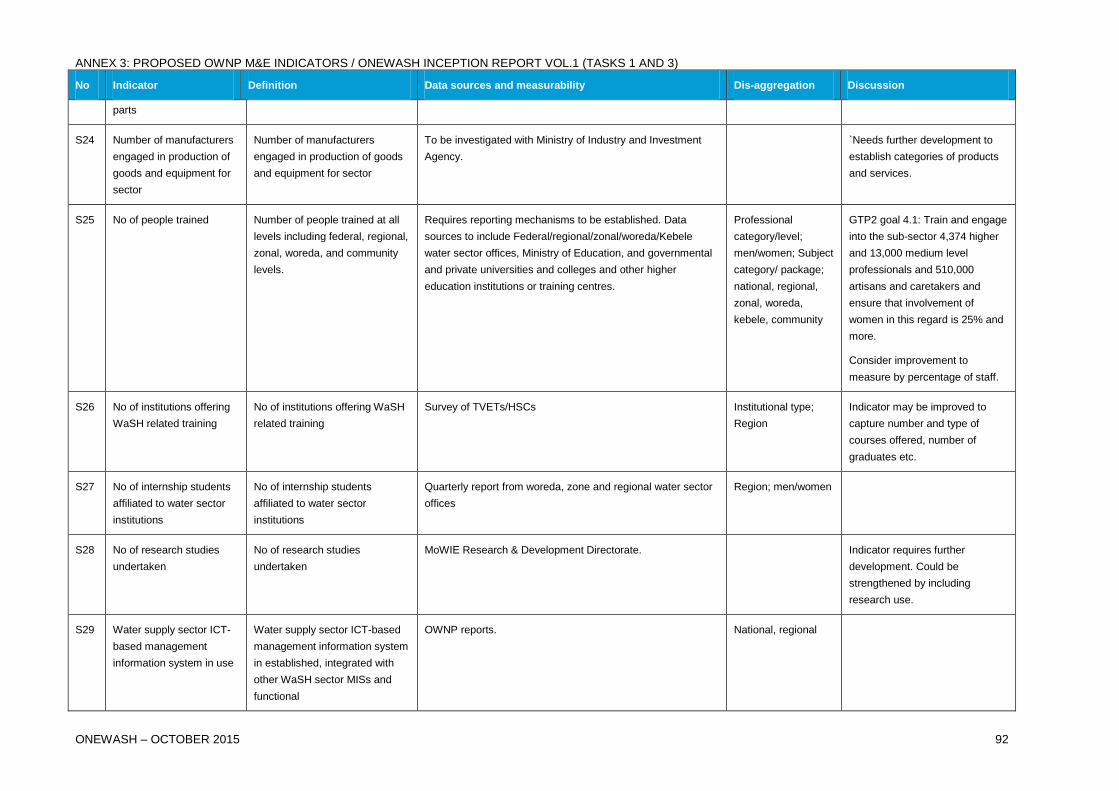
ANNEX 3: PROPOSED OWNP M&E INDICATORS / ONEWASH INCEPTION REPORT VOL.1 (TASKS 1 AND 3)
ONEWASH – OCTOBER 2015 92
No Indicator Definition Data sources and measurability Dis-aggregation Discussion
parts
S24 Number of manufacturers
engaged in production of
goods and equipment for
sector
Number of manufacturers
engaged in production of goods
and equipment for sector
To be investigated with Ministry of Industry and Investment
Agency.
`Needs further development to
establish categories of products
and services.
S25 No of people trained
Number of people trained at all
levels including federal, regional,
zonal, woreda, and community
levels.
Requires reporting mechanisms to be established. Data
sources to include Federal/regional/zonal/woreda/Kebele
water sector offices, Ministry of Education, and governmental
and private universities and colleges and other higher
education institutions or training centres.
Professional
category/level;
men/women; Subject
category/ package;
national, regional,
zonal, woreda,
kebele, community
GTP2 goal 4.1: Train and engage
into the sub-sector 4,374 higher
and 13,000 medium level
professionals and 510,000
artisans and caretakers and
ensure that involvement of
women in this regard is 25% and
more.
Consider improvement to
measure by percentage of staff.
S26 No of institutions offering
WaSH related training
No of institutions offering WaSH
related training
Survey of TVETs/HSCs Institutional type;
Region
Indicator may be improved to
capture number and type of
courses offered, number of
graduates etc.
S27 No of internship students
affiliated to water sector
institutions
No of internship students
affiliated to water sector
institutions
Quarterly report from woreda, zone and regional water sector
offices
Region; men/women
S28 No of research studies
undertaken
No of research studies
undertaken
MoWIE Research & Development Directorate. Indicator requires further
development. Could be
strengthened by including
research use.
S29 Water supply sector ICT-
based management
information system in use
Water supply sector ICT-based
management information system
in established, integrated with
other WaSH sector MISs and
functional
OWNP reports. National, regional
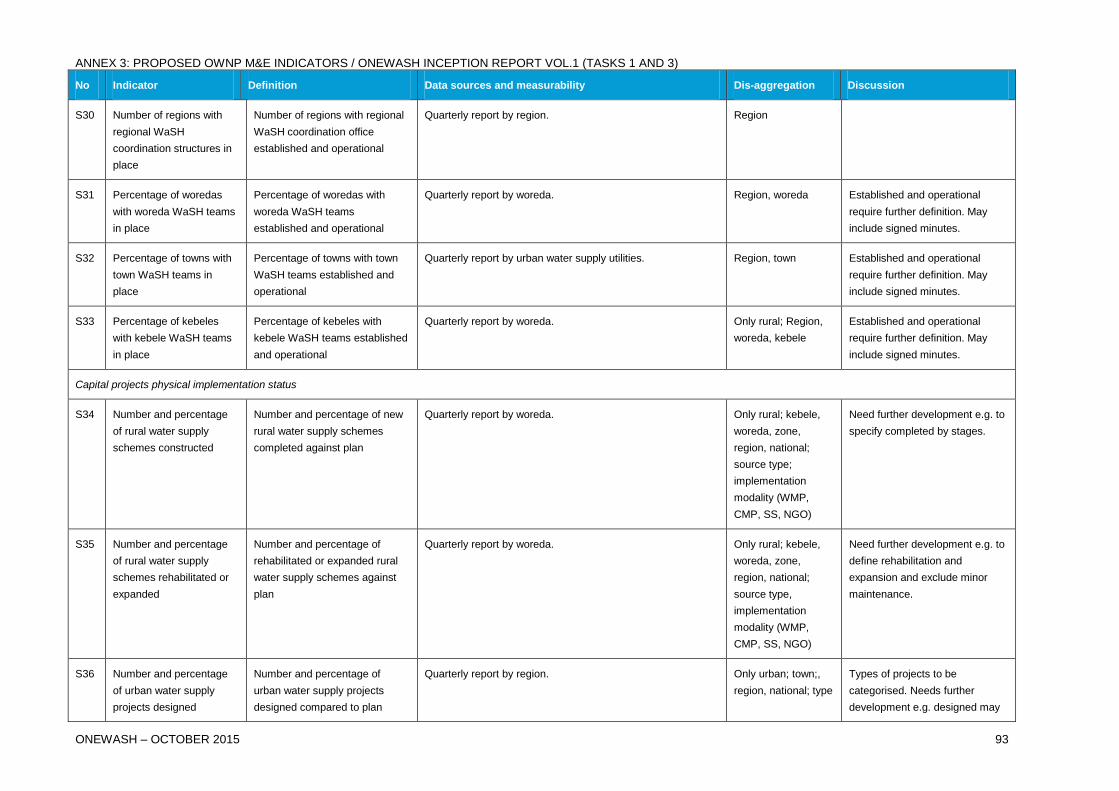
ANNEX 3: PROPOSED OWNP M&E INDICATORS / ONEWASH INCEPTION REPORT VOL.1 (TASKS 1 AND 3)
ONEWASH – OCTOBER 2015 93
No Indicator Definition Data sources and measurability Dis-aggregation Discussion
S30 Number of regions with
regional WaSH
coordination structures in
place
Number of regions with regional
WaSH coordination office
established and operational
Quarterly report by region. Region
S31 Percentage of woredas
with woreda WaSH teams
in place
Percentage of woredas with
woreda WaSH teams
established and operational
Quarterly report by woreda. Region, woreda Established and operational
require further definition. May
include signed minutes.
S32 Percentage of towns with
town WaSH teams in
place
Percentage of towns with town
WaSH teams established and
operational
Quarterly report by urban water supply utilities. Region, town Established and operational
require further definition. May
include signed minutes.
S33 Percentage of kebeles
with kebele WaSH teams
in place
Percentage of kebeles with
kebele WaSH teams established
and operational
Quarterly report by woreda. Only rural; Region,
woreda, kebele
Established and operational
require further definition. May
include signed minutes.
Capital projects physical implementation status
S34 Number and percentage
of rural water supply
schemes constructed
Number and percentage of new
rural water supply schemes
completed against plan
Quarterly report by woreda. Only rural; kebele,
woreda, zone,
region, national;
source type;
implementation
modality (WMP,
CMP, SS, NGO)
Need further development e.g. to
specify completed by stages.
S35 Number and percentage
of rural water supply
schemes rehabilitated or
expanded
Number and percentage of
rehabilitated or expanded rural
water supply schemes against
plan
Quarterly report by woreda. Only rural; kebele,
woreda, zone,
region, national;
source type,
implementation
modality (WMP,
CMP, SS, NGO)
Need further development e.g. to
define rehabilitation and
expansion and exclude minor
maintenance.
S36 Number and percentage
of urban water supply
projects designed
Number and percentage of
urban water supply projects
designed compared to plan
Quarterly report by region. Only urban; town;,
region, national; type
Types of projects to be
categorised. Needs further
development e.g. designed may
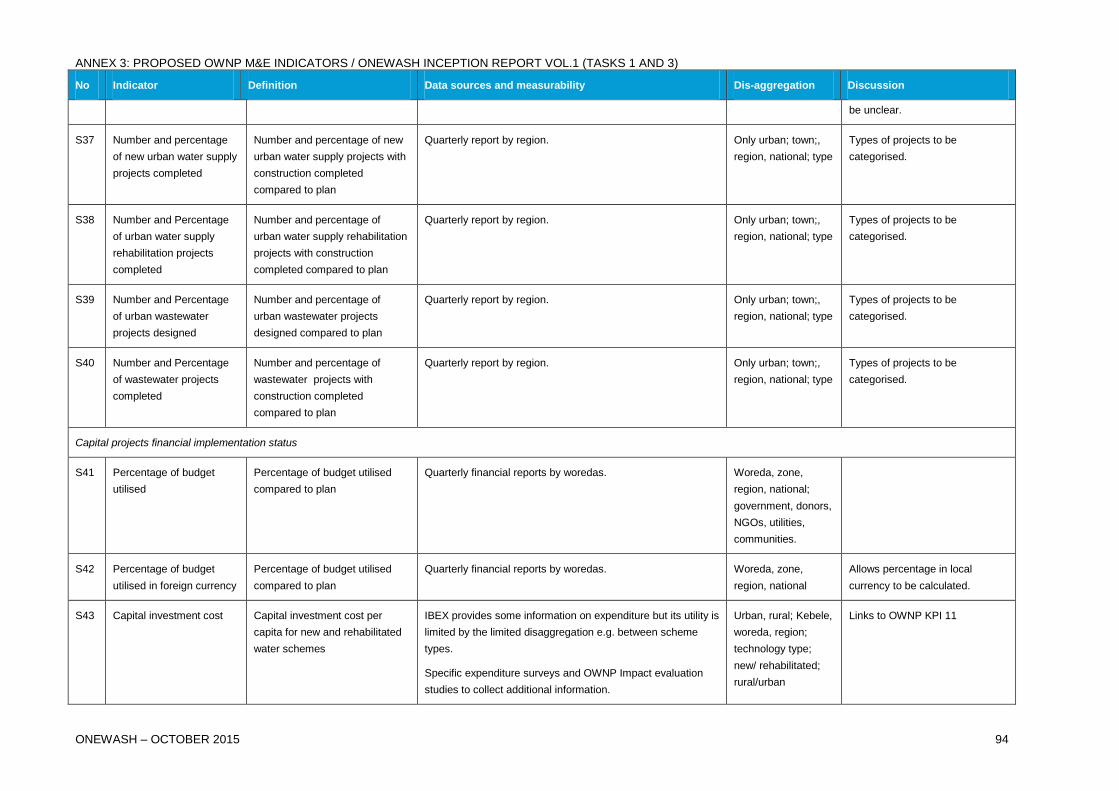
ANNEX 3: PROPOSED OWNP M&E INDICATORS / ONEWASH INCEPTION REPORT VOL.1 (TASKS 1 AND 3)
ONEWASH – OCTOBER 2015 94
No Indicator Definition Data sources and measurability Dis-aggregation Discussion
be unclear.
S37 Number and percentage
of new urban water supply
projects completed
Number and percentage of new
urban water supply projects with
construction completed
compared to plan
Quarterly report by region. Only urban; town;,
region, national; type
Types of projects to be
categorised.
S38 Number and Percentage
of urban water supply
rehabilitation projects
completed
Number and percentage of
urban water supply rehabilitation
projects with construction
completed compared to plan
Quarterly report by region. Only urban; town;,
region, national; type
Types of projects to be
categorised.
S39 Number and Percentage
of urban wastewater
projects designed
Number and percentage of
urban wastewater projects
designed compared to plan
Quarterly report by region. Only urban; town;,
region, national; type
Types of projects to be
categorised.
S40 Number and Percentage
of wastewater projects
completed
Number and percentage of
wastewater projects with
construction completed
compared to plan
Quarterly report by region. Only urban; town;,
region, national; type
Types of projects to be
categorised.
Capital projects financial implementation status
S41 Percentage of budget
utilised
Percentage of budget utilised
compared to plan
Quarterly financial reports by woredas. Woreda, zone,
region, national;
government, donors,
NGOs, utilities,
communities.
S42 Percentage of budget
utilised in foreign currency
Percentage of budget utilised
compared to plan
Quarterly financial reports by woredas. Woreda, zone,
region, national
Allows percentage in local
currency to be calculated.
S43 Capital investment cost Capital investment cost per
capita for new and rehabilitated
water schemes
IBEX provides some information on expenditure but its utility is
limited by the limited disaggregation e.g. between scheme
types.
Specific expenditure surveys and OWNP Impact evaluation
studies to collect additional information.
Urban, rural; Kebele,
woreda, region;
technology type;
new/ rehabilitated;
rural/urban
Links to OWNP KPI 11

ANNEX 3: PROPOSED OWNP M&E INDICATORS / ONEWASH INCEPTION REPORT VOL.1 (TASKS 1 AND 3)
ONEWASH – OCTOBER 2015 95
No Indicator Definition Data sources and measurability Dis-aggregation Discussion
Environment and Social
S44 Percentage of schemes
with completed
environment and social
screening process
Percentage of schemes with
completed environment and
social screening process as
specified in the Environmental
and Social Management
Framework
Quarterly reports by woredas. Initially: CWA-funded
woredas
S45 Percentage of schemes
assigned to each
environmental and social
screening category
The categories are defined in
Environmental and Social
Management Framework
(FDRE, 2013b) as: A: major
adverse impacts, B1: potential
adverse impacts requiring
mitigation measures as specified
in the Environmental and Social
Management Framework, B2:
further environmental and social
impact assessment (ESIA)
required and a specific
Environmental and Social
Management Plan, C: no
significant issues
Quarterly reports by woredas. Initially: CWA-funded
woredas
S46 Percentage of B1
schemes with public
consultation completed
and reported
Percentage of B1 schemes with
public consultation completed
and reported
Quarterly reports by woredas. Initially: CWA-funded
woredas
S47 Percentage of B2
schemes with completed
ESIA and ESMP and
public consultation
completed and reported
Percentage of B2 schemes with
completed ESIA and ESMP and
public consultation completed
and reported
Quarterly reports by woredas. Initially: CWA-funded
woredas
Resettlement
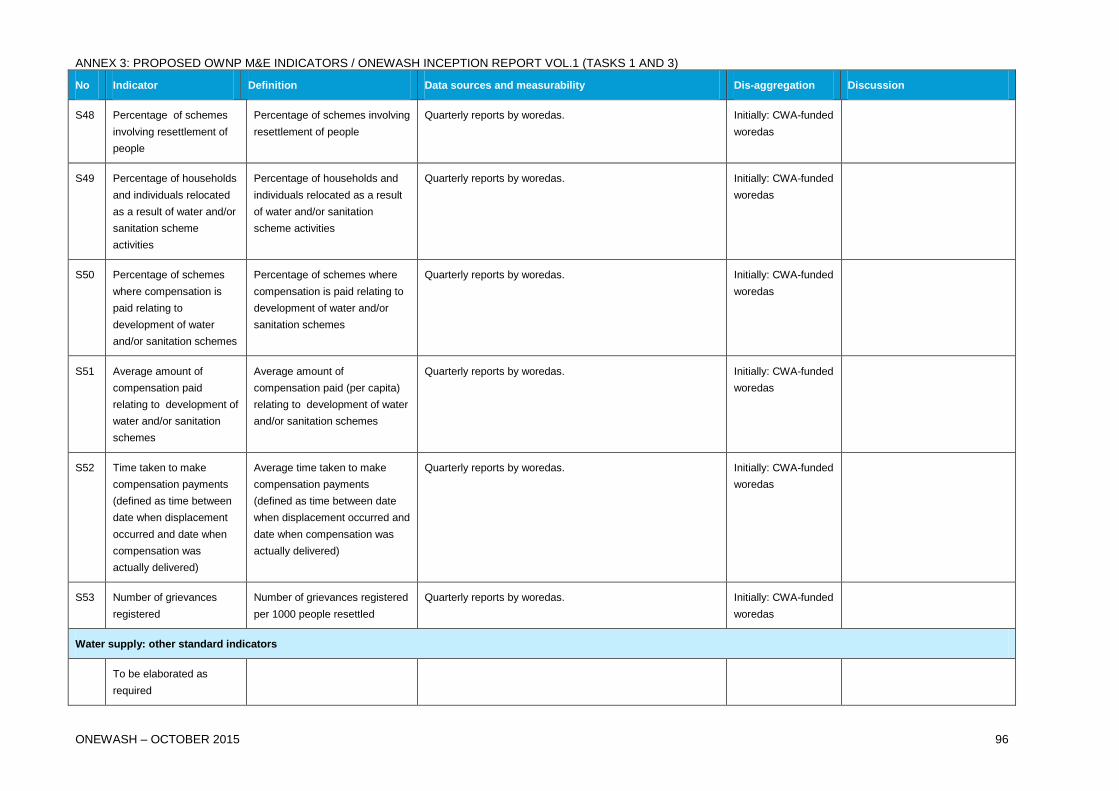
ANNEX 3: PROPOSED OWNP M&E INDICATORS / ONEWASH INCEPTION REPORT VOL.1 (TASKS 1 AND 3)
ONEWASH – OCTOBER 2015 96
No Indicator Definition Data sources and measurability Dis-aggregation Discussion
S48 Percentage of schemes
involving resettlement of
people
Percentage of schemes involving
resettlement of people
Quarterly reports by woredas. Initially: CWA-funded
woredas
S49 Percentage of households
and individuals relocated
as a result of water and/or
sanitation scheme
activities
Percentage of households and
individuals relocated as a result
of water and/or sanitation
scheme activities
Quarterly reports by woredas. Initially: CWA-funded
woredas
S50 Percentage of schemes
where compensation is
paid relating to
development of water
and/or sanitation schemes
Percentage of schemes where
compensation is paid relating to
development of water and/or
sanitation schemes
Quarterly reports by woredas. Initially: CWA-funded
woredas
S51 Average amount of
compensation paid
relating to development of
water and/or sanitation
schemes
Average amount of
compensation paid (per capita)
relating to development of water
and/or sanitation schemes
Quarterly reports by woredas. Initially: CWA-funded
woredas
S52 Time taken to make
compensation payments
(defined as time between
date when displacement
occurred and date when
compensation was
actually delivered)
Average time taken to make
compensation payments
(defined as time between date
when displacement occurred and
date when compensation was
actually delivered)
Quarterly reports by woredas. Initially: CWA-funded
woredas
S53 Number of grievances
registered
Number of grievances registered
per 1000 people resettled
Quarterly reports by woredas. Initially: CWA-funded
woredas
Water supply: other standard indicators
To be elaborated as
required

ANNEX 3: PROPOSED OWNP M&E INDICATORS / ONEWASH INCEPTION REPORT VOL.1 (TASKS 1 AND 3)
ONEWASH – OCTOBER 2015 97
No Indicator Definition Data sources and measurability Dis-aggregation Discussion
Institutional WaSH: Proposed KPIs
KPI8 Percentage of schools
with access to safe
drinking water
Percentage of schools with
access to safe drinking water
(with appropriate tap/student
ratio).
Data collected through the EMIS (annual questionnaire)
includes the schools with water facilities by school type
(including type of facility) and the numbers of enrolled
students.
NWI indicator (form 3) related to presence/absence of water
supply only to be updated.
Urban, rural;
Kebele, Woreda,
Zone; Region;
primary/ secondary
Inconsistency between OWNP
document and POM: OWNP KPI
No.6.: tap / student ratio = 1/100;
POM: tap / student ration = 1/50.
Further discussion is needed on
appropriate tap/student ratio.
Further discussion needed on
provision for other public places
e.g. prisons, market places, bus
stops and other public institutions.
The proposed Sustainable
Development Goals (SDGs) are
expressed in terms of people,
e.g., “% of pupils enrolled in
schools with basic water
services”. This and other
indicators could be revised to put
people at centre of service
delivery. The new institutional
WaSH manual from UNICEF will
also be reviewed to ensure
consistency with indicators.
KPI9 Percentage of schools
with separate latrines for
boys and girls.
Percentage of schools with
separate latrines for boys and
girls with appropriate
stance/student ratio.
Improved sanitation facilities:
Connection to a public sewer;
Connection to a septic system;
Pour-flush latrine; pit latrine with
Data collected through the EMIS (annual questionnaire)
includes the schools with latrines by school type (specifying
the number of pits for girls, boys or combined) and the
numbers of enrolled students.
NWI and EMIS give information on separation boys/girls (yes/
no) but not disaggregated stance figures
Urban, rural;
Kebele, Woreda,
Zone; Region;
primary/ secondary
Inconsistency in definition of
“adequate sanitation facilities”
between OWNP document and
POM: OWNP KPI No. 6:
stance/40 females or 75 male
students (as ESDPiV); POM:
seat/student ratio: 1/50
Privacy, cleanliness and safety of

ANNEX 3: PROPOSED OWNP M&E INDICATORS / ONEWASH INCEPTION REPORT VOL.1 (TASKS 1 AND 3)
ONEWASH – OCTOBER 2015 98
No Indicator Definition Data sources and measurability Dis-aggregation Discussion
slab (slab can be made of
cement or wood/Bamboo/logs
plastered with mud or cow dung
and has hand washing facility);
Ventilated improved pit latrine
Unimproved sanitation facilities:
Public or shared latrine; pit
latrine wit out slab; Bucket latrine
the latrine facilities and the
treatment of the human waste is
not included in this indicator. This
could be included into the
definition of adequate sanitation.
Adequate being “private, safe,
clean facilities with appropriate
treatment of human waste”)
KPI10 Percentage of health
facilities with improved
water supply
Percentage of health facilities
with improved water supply
HMIS indicator CB1.3 provides data on ‘Health institutions
with functional infrastructure’ which combines electricity,
water supply and sanitation facilities.
NWI included presence/absence only
Urban, rural;
Kebele, Woreda,
Zone; Region;
institution type
OWNP KPI No.7
KPI11 Percentage of health
facilities with sanitation
facilities
Percentage of health facilities
with functional sanitation
facilities. Functional sanitation
facilities are defined as placenta
pit, incinerator, drainage, and
latrine.
HMIS indicator CB1.3 provides data on ‘Health institutions
with functional infrastructure’ which combines electricity,
water supply and sanitation facilities.
Urban, rural;
Kebele, Woreda,
Zone; Region;
institution type
OWNP KPI No.7. refers to
improved human excreta
removal”
Improved sanitation facilities:
Connection to a public sewer;
Connection to a septic system;
Pour-flush latrine; pit latrine with
slab (slab can be made of cement
or wood/Bamboo/logo plastered
with mud or cow dung and has
hand washing facility); Ventilated
improved pit latrine
Unimproved sanitation facilities:
Public or shared latrine; pit latrine
wit out slab; Bucket
Institutional WaSH: Supplementary indicators
S54 Percentage of schools
with functional improved
Percentage of schools with
functional improved water
Data collected through existing EMIS (annual) questionnaire Urban, rural;
Kebele, Woreda,
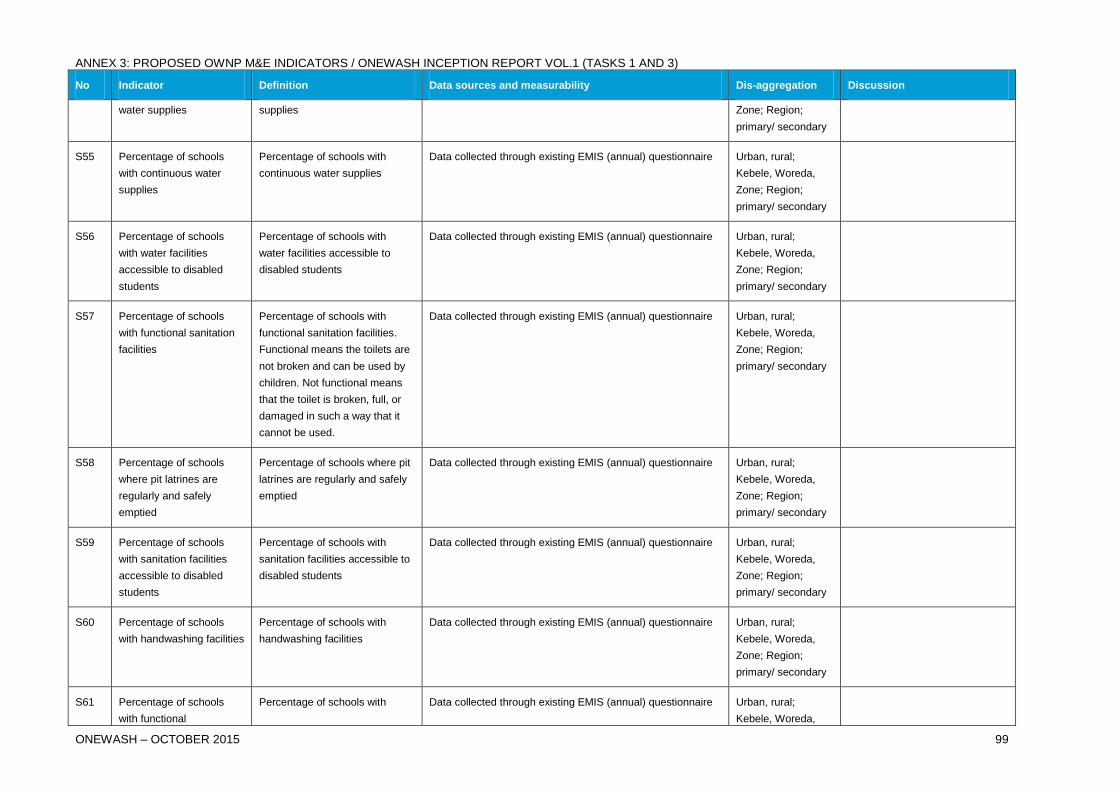
ANNEX 3: PROPOSED OWNP M&E INDICATORS / ONEWASH INCEPTION REPORT VOL.1 (TASKS 1 AND 3)
ONEWASH – OCTOBER 2015 99
No Indicator Definition Data sources and measurability Dis-aggregation Discussion
water supplies supplies Zone; Region;
primary/ secondary
S55 Percentage of schools
with continuous water
supplies
Percentage of schools with
continuous water supplies
Data collected through existing EMIS (annual) questionnaire Urban, rural;
Kebele, Woreda,
Zone; Region;
primary/ secondary
S56 Percentage of schools
with water facilities
accessible to disabled
students
Percentage of schools with
water facilities accessible to
disabled students
Data collected through existing EMIS (annual) questionnaire Urban, rural;
Kebele, Woreda,
Zone; Region;
primary/ secondary
S57 Percentage of schools
with functional sanitation
facilities
Percentage of schools with
functional sanitation facilities.
Functional means the toilets are
not broken and can be used by
children. Not functional means
that the toilet is broken, full, or
damaged in such a way that it
cannot be used.
Data collected through existing EMIS (annual) questionnaire Urban, rural;
Kebele, Woreda,
Zone; Region;
primary/ secondary
S58 Percentage of schools
where pit latrines are
regularly and safely
emptied
Percentage of schools where pit
latrines are regularly and safely
emptied
Data collected through existing EMIS (annual) questionnaire Urban, rural;
Kebele, Woreda,
Zone; Region;
primary/ secondary
S59 Percentage of schools
with sanitation facilities
accessible to disabled
students
Percentage of schools with
sanitation facilities accessible to
disabled students
Data collected through existing EMIS (annual) questionnaire Urban, rural;
Kebele, Woreda,
Zone; Region;
primary/ secondary
S60 Percentage of schools
with handwashing facilities
Percentage of schools with
handwashing facilities
Data collected through existing EMIS (annual) questionnaire Urban, rural;
Kebele, Woreda,
Zone; Region;
primary/ secondary
S61 Percentage of schools
with functional
Percentage of schools with Data collected through existing EMIS (annual) questionnaire Urban, rural;
Kebele, Woreda,

ANNEX 3: PROPOSED OWNP M&E INDICATORS / ONEWASH INCEPTION REPORT VOL.1 (TASKS 1 AND 3)
ONEWASH – OCTOBER 2015 100
No Indicator Definition Data sources and measurability Dis-aggregation Discussion
handwashing facilities functional handwashing facilities Zone; Region;
primary/ secondary
S62 Percentage of schools
with handwashing facilities
accessible to disabled
students
Percentage of schools with
handwashing facilities
accessible to disabled students
Data collected through existing EMIS (annual) questionnaire Urban, rural;
Kebele, Woreda,
Zone; Region;
primary/ secondary
S63 Percentage of schools
with health clubs
Percentage of schools with
health clubs
To be checked. Urban, rural;
Kebele, Woreda,
Zone; Region;
primary/ secondary
Institutional WaSH: Other standard indicators
To be elaborated as
required
Sanitation and hygiene: Proposed Core KPIs
KPI12 Proportion of households’
access to latrine facilities
Proportion of households’
access to any type of latrine
facilities. Access to a latrine
must be accompanied by
appropriate utilization and
availability of hand washing
facilities in use.
Improved Latrine = Hand
washing facility + slab +
Ventilation pipe (superstructure)
Unimproved = simple pit latrine
without ventilation
The HMIS (C1.3.1) provides data that is derived from the
routine visits to each household by Health Extension Workers
(HEWs) that are reported quarterly. Data is also available
from CSA implemented household surveys.
Improved latrine,
unimproved latrine;
Urban, rural; Kebele,
Woreda, Zone;
Region
This replaces OWNP KPI No 4
(access to improved human
excreta removal). Further
discussion needed on how to
deal with shared and public
latrines.
KPI13 Proportion of households
using Latrines
Proportion of households that
use latrine for defecation
purpose properly.
HMIS C1.3.2.
Proxy evidence of use is described as “faeces in pit, visible
access, absence of spider webs, and absence of faeces
Urban, rural; Kebele,
Woreda, Zone;
Region
Data is not disaggregated
between improved and
unimproved latrines. Also need
further discussion on shared and
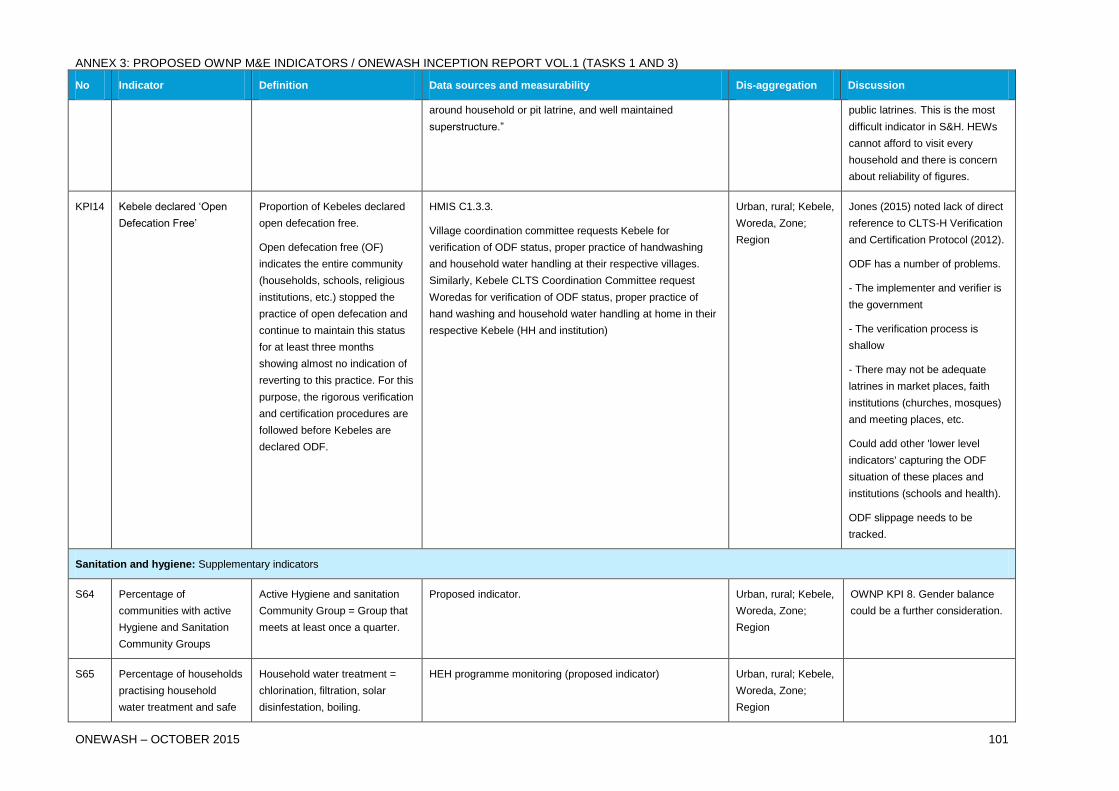
ANNEX 3: PROPOSED OWNP M&E INDICATORS / ONEWASH INCEPTION REPORT VOL.1 (TASKS 1 AND 3)
ONEWASH – OCTOBER 2015 101
No Indicator Definition Data sources and measurability Dis-aggregation Discussion
around household or pit latrine, and well maintained
superstructure.”
public latrines. This is the most
difficult indicator in S&H. HEWs
cannot afford to visit every
household and there is concern
about reliability of figures.
KPI14 Kebele declared ‘Open
Defecation Free’
Proportion of Kebeles declared
open defecation free.
Open defecation free (OF)
indicates the entire community
(households, schools, religious
institutions, etc.) stopped the
practice of open defecation and
continue to maintain this status
for at least three months
showing almost no indication of
reverting to this practice. For this
purpose, the rigorous verification
and certification procedures are
followed before Kebeles are
declared ODF.
HMIS C1.3.3.
Village coordination committee requests Kebele for
verification of ODF status, proper practice of handwashing
and household water handling at their respective villages.
Similarly, Kebele CLTS Coordination Committee request
Woredas for verification of ODF status, proper practice of
hand washing and household water handling at home in their
respective Kebele (HH and institution)
Urban, rural; Kebele,
Woreda, Zone;
Region
Jones (2015) noted lack of direct
reference to CLTS-H Verification
and Certification Protocol (2012).
ODF has a number of problems.
- The implementer and verifier is
the government
- The verification process is
shallow
- There may not be adequate
latrines in market places, faith
institutions (churches, mosques)
and meeting places, etc.
Could add other 'lower level
indicators' capturing the ODF
situation of these places and
institutions (schools and health).
ODF slippage needs to be
tracked.
Sanitation and hygiene: Supplementary indicators
S64 Percentage of
communities with active
Hygiene and Sanitation
Community Groups
Active Hygiene and sanitation
Community Group = Group that
meets at least once a quarter.
Proposed indicator. Urban, rural; Kebele,
Woreda, Zone;
Region
OWNP KPI 8. Gender balance
could be a further consideration.
S65 Percentage of households
practising household
water treatment and safe
Household water treatment =
chlorination, filtration, solar
disinfestation, boiling.
HEH programme monitoring (proposed indicator) Urban, rural; Kebele,
Woreda, Zone;
Region
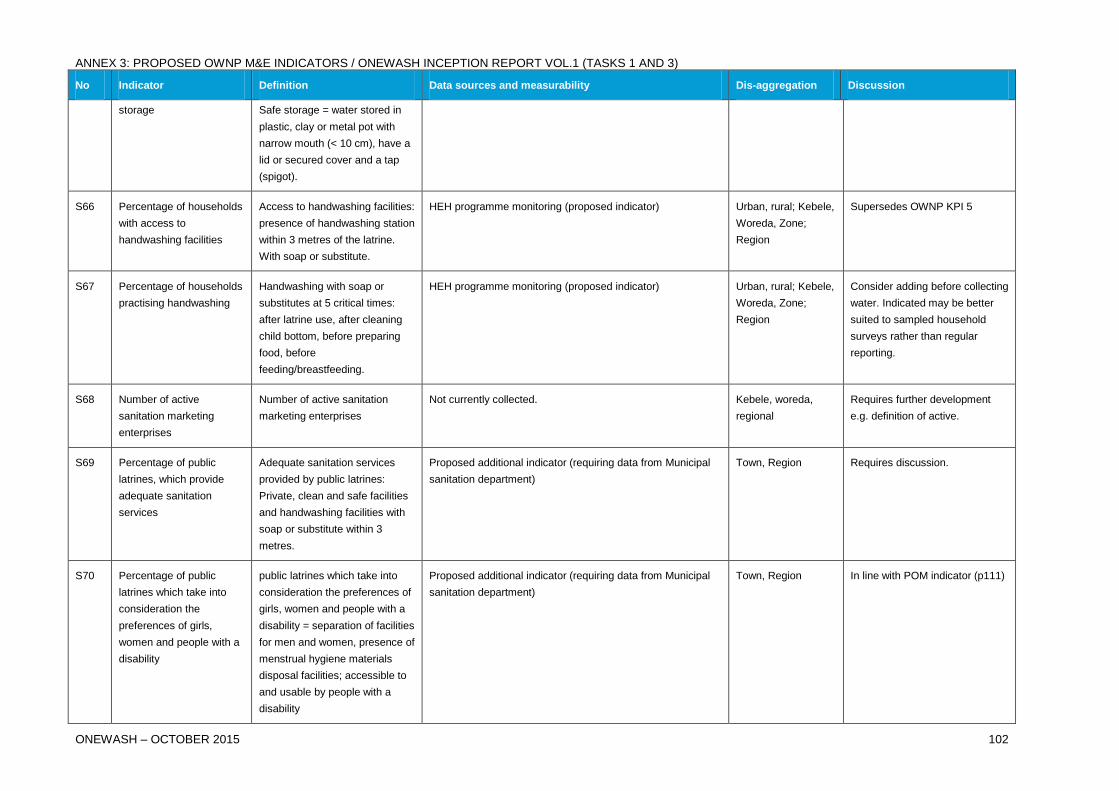
ANNEX 3: PROPOSED OWNP M&E INDICATORS / ONEWASH INCEPTION REPORT VOL.1 (TASKS 1 AND 3)
ONEWASH – OCTOBER 2015 102
No Indicator Definition Data sources and measurability Dis-aggregation Discussion
storage Safe storage = water stored in
plastic, clay or metal pot with
narrow mouth (< 10 cm), have a
lid or secured cover and a tap
(spigot).
S66 Percentage of households
with access to
handwashing facilities
Access to handwashing facilities:
presence of handwashing station
within 3 metres of the latrine.
With soap or substitute.
HEH programme monitoring (proposed indicator) Urban, rural; Kebele,
Woreda, Zone;
Region
Supersedes OWNP KPI 5
S67 Percentage of households
practising handwashing
Handwashing with soap or
substitutes at 5 critical times:
after latrine use, after cleaning
child bottom, before preparing
food, before
feeding/breastfeeding.
HEH programme monitoring (proposed indicator) Urban, rural; Kebele,
Woreda, Zone;
Region
Consider adding before collecting
water. Indicated may be better
suited to sampled household
surveys rather than regular
reporting.
S68 Number of active
sanitation marketing
enterprises
Number of active sanitation
marketing enterprises
Not currently collected. Kebele, woreda,
regional
Requires further development
e.g. definition of active.
S69 Percentage of public
latrines, which provide
adequate sanitation
services
Adequate sanitation services
provided by public latrines:
Private, clean and safe facilities
and handwashing facilities with
soap or substitute within 3
metres.
Proposed additional indicator (requiring data from Municipal
sanitation department)
Town, Region Requires discussion.
S70 Percentage of public
latrines which take into
consideration the
preferences of girls,
women and people with a
disability
public latrines which take into
consideration the preferences of
girls, women and people with a
disability = separation of facilities
for men and women, presence of
menstrual hygiene materials
disposal facilities; accessible to
and usable by people with a
disability
Proposed additional indicator (requiring data from Municipal
sanitation department)
Town, Region In line with POM indicator (p111)
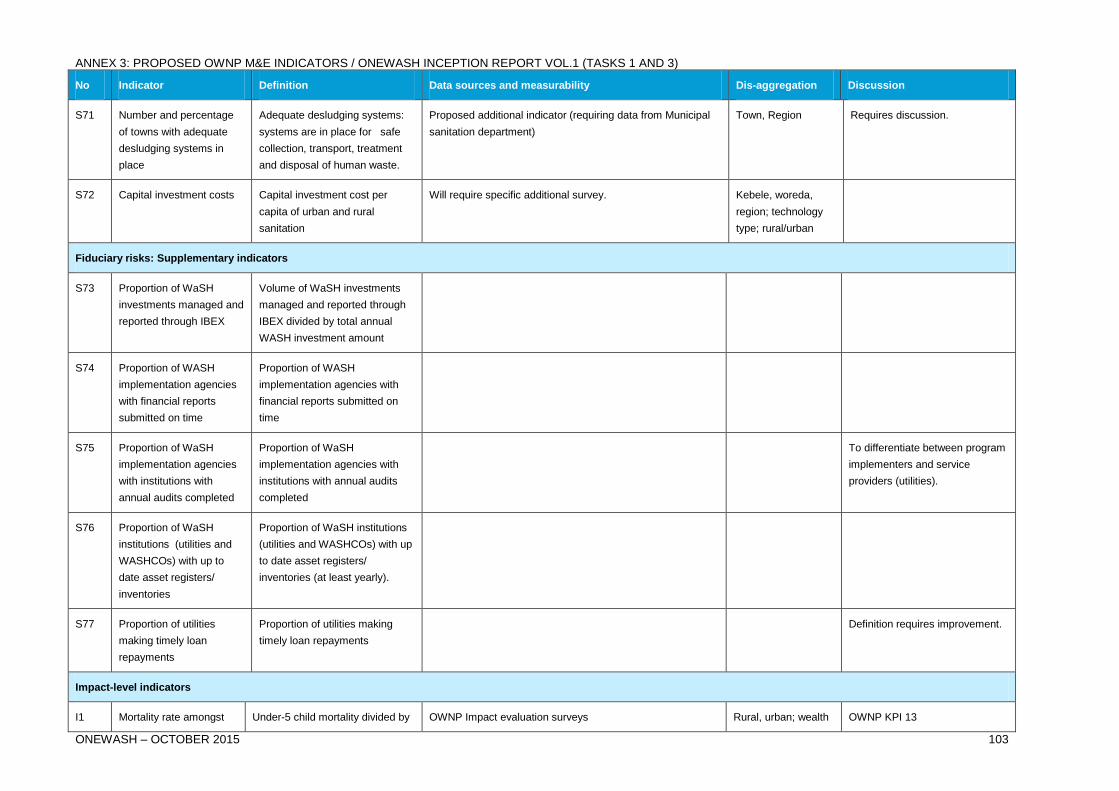
ANNEX 3: PROPOSED OWNP M&E INDICATORS / ONEWASH INCEPTION REPORT VOL.1 (TASKS 1 AND 3)
ONEWASH – OCTOBER 2015 103
No Indicator Definition Data sources and measurability Dis-aggregation Discussion
S71 Number and percentage
of towns with adequate
desludging systems in
place
Adequate desludging systems:
systems are in place for safe
collection, transport, treatment
and disposal of human waste.
Proposed additional indicator (requiring data from Municipal
sanitation department)
Town, Region Requires discussion.
S72 Capital investment costs Capital investment cost per
capita of urban and rural
sanitation
Will require specific additional survey. Kebele, woreda,
region; technology
type; rural/urban
Fiduciary risks: Supplementary indicators
S73 Proportion of WaSH
investments managed and
reported through IBEX
Volume of WaSH investments
managed and reported through
IBEX divided by total annual
WASH investment amount
S74 Proportion of WASH
implementation agencies
with financial reports
submitted on time
Proportion of WASH
implementation agencies with
financial reports submitted on
time
S75 Proportion of WaSH
implementation agencies
with institutions with
annual audits completed
Proportion of WaSH
implementation agencies with
institutions with annual audits
completed
To differentiate between program
implementers and service
providers (utilities).
S76 Proportion of WaSH
institutions (utilities and
WASHCOs) with up to
date asset registers/
inventories
Proportion of WaSH institutions
(utilities and WASHCOs) with up
to date asset registers/
inventories (at least yearly).
S77 Proportion of utilities
making timely loan
repayments
Proportion of utilities making
timely loan repayments
Definition requires improvement.
Impact-level indicators
I1 Mortality rate amongst Under-5 child mortality divided by OWNP Impact evaluation surveys Rural, urban; wealth OWNP KPI 13

ANNEX 3: PROPOSED OWNP M&E INDICATORS / ONEWASH INCEPTION REPORT VOL.1 (TASKS 1 AND 3)
ONEWASH – OCTOBER 2015 104
No Indicator Definition Data sources and measurability Dis-aggregation Discussion
under-5 children the number of under- 5 children in
the kebele (woreda, region and
national)
groups; gender
I2 Diarrheal disease
incidence amongst
under-5 children
Number of under-5 children with
diarrheal diseases in the 2 weeks
prior to survey divided by the total
number of under- 5 children in
(kebele, woreda, region and
national)
OWNP Impact evaluation surveys Rural, urban; wealth
groups; gender
OWNP KPI 14
In order to prevent recollection
bias, it is suggested that the
focus will be on occurrence of
diarrheal diseases in the 2 weeks
prior to survey
I3 Average time for water
collection.
Average time taken for water
collection
OWNP Impact evaluation surveys Rural, urban; wealth
groups; gender
OWNP KPI 15
I4 Female school
enrolment in school
Female school enrolment in
school facilities
OWNP Impact evaluation surveys Rural, urban; wealth
groups; gender
OWNP KPI 16
I5 Dropout rate among
female students
Dropout rates among female
students.
OWNP Impact evaluation surveys Rural, urban; wealth
groups; gender
OWNP KPI 17
The following indicators are illustrative of the kind of indicators that could be developed to support monitoring of the OWNP enabling environment and national
level. There are currently no indicators at this level apart from suggested A31.
No Indicator Definition Data sources and measurability Disaggregation Discussion
OWNP enabling environment: Additional indicators
S78 Presence of
independent water
supply and wastewater
service regulatory
agency
This could be measured using progress markers,
e.g.
0=no regulatory agency
1=studies done
2= set-up of regulatory agency under
MoWIE reports GTP2 goal 4.2
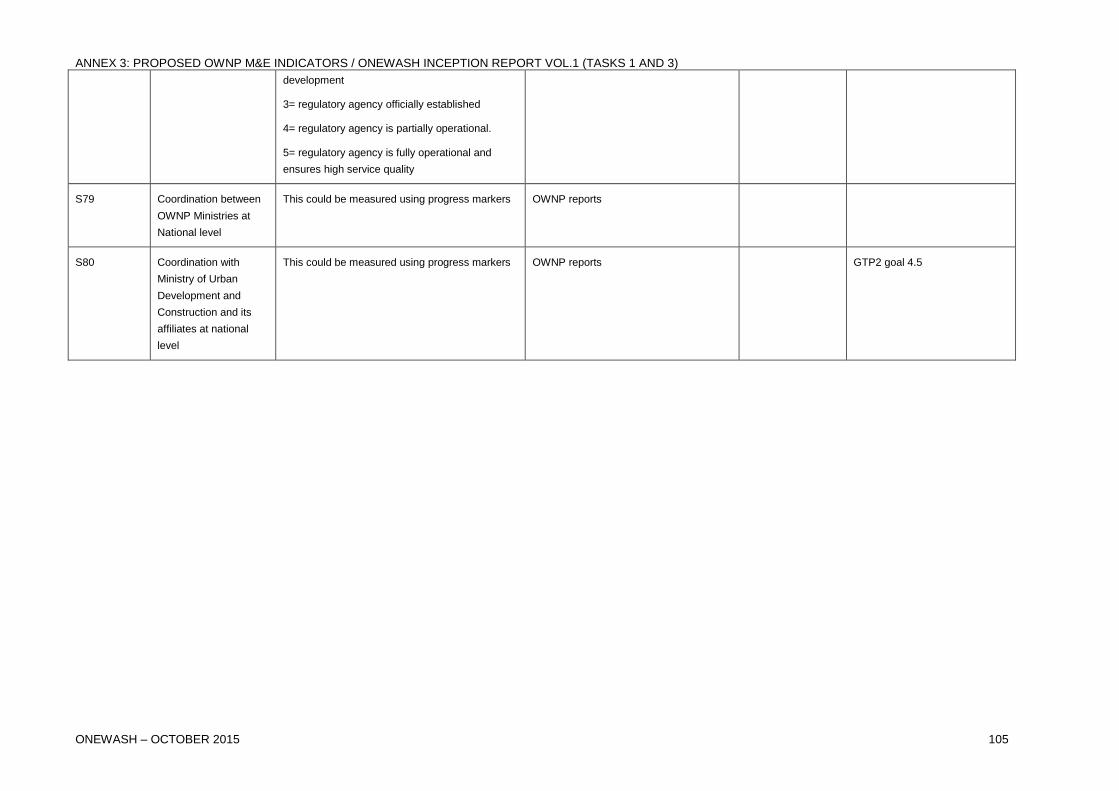
ANNEX 3: PROPOSED OWNP M&E INDICATORS / ONEWASH INCEPTION REPORT VOL.1 (TASKS 1 AND 3)
ONEWASH – OCTOBER 2015 105
development
3= regulatory agency officially established
4= regulatory agency is partially operational.
5= regulatory agency is fully operational and
ensures high service quality
S79 Coordination between
OWNP Ministries at
National level
This could be measured using progress markers OWNP reports
S80 Coordination with
Ministry of Urban
Development and
Construction and its
affiliates at national
level
This could be measured using progress markers OWNP reports GTP2 goal 4.5
ANNEX 4: WORKPLAN / ONEWASH INCEPTION REPORT VOL.1 (TASKS 1 AND 3)
ONEWASH – OCTOBER 2015 106
Annex 4: Work Plan
Key to abbreviations used in work plan
Sub-plans:
Op. = Operationalisation
CB = Capacity Building
DDU = Data Dissemination and Use
PROC = Procurement
NWI = National WaSH Inventory
Syn. = Synergy
Ex. = Exit
Effort:
Int. = International TA days
Nat. = National TA days
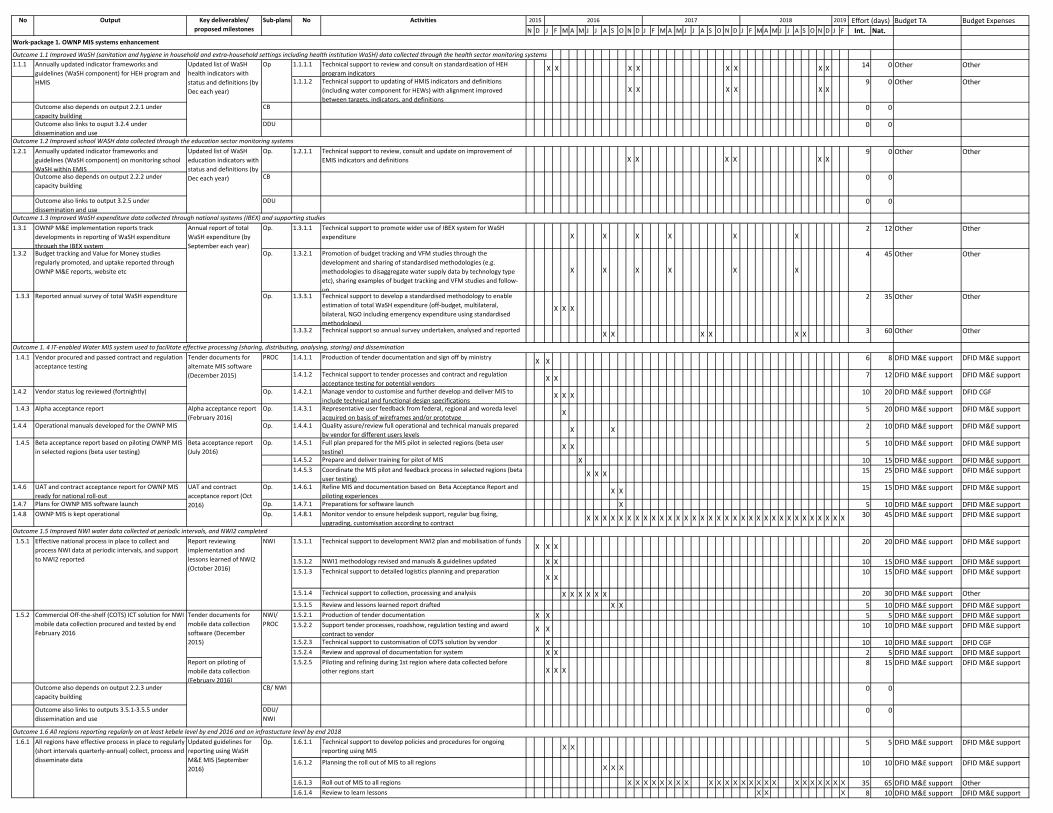
Budget TA Budget ExpensesN D J F M A M J J A S O N D J F M A M J J A S O N D J F M A M J J A S O N D J F Int. Nat.
Outcome 1.1 Improved WaSH (sanitation and hygiene in household and extra‐household settings including health institution WaSH) data collected through the health sector monitoring systems1.1.1 1.1.1.1 Technical support to review and consult on standardisation of HEH
program indicatorsX X X X X X X X 14 0 Other Other
1.1.1.2 Technical support to updating of HMIS indicators and definitions (including water component for HEWs) with alignment improved between targets, indicators, and definitions
X X X X X X9 0 Other Other
Outcome also depends on output 2.2.1 under capacity building
CB 0 0
Outcome also links to ouput 3.2.4 under dissemination and use
DDU 0 0
1.2.1 Annually updated indicator frameworks and guidelines (WaSH component) on monitoring school WaSH within EMIS
Op. 1.2.1.1 Technical support to review, consult and update on improvement of EMIS indicators and definitions X X X X X X
9 0 Other Other
Outcome also depends on output 2.2.2 under capacity building
CB 0 0
Outcome also links to output 3.2.5 under dissemination and use
DDU 0 0
1.3.1 OWNP M&E implementation reports track developments in reporting of WaSH expenditure through the IBEX system
Op. 1.3.1.1 Technical support to promote wider use of IBEX system for WaSH expenditure X X X X X X
2 12 Other Other
1.3.2 Budget tracking and Value for Money studies regularly promoted, and uptake reported through OWNP M&E reports, website etc
Op. 1.3.2.1 Promotion of budget tracking and VFM studies through the development and sharing of standardised methodologies (e.g. methodologies to disaggregate water supply data by technology type etc), sharing examples of budget tracking and VFM studies and follow‐up
X X X X X X
4 45 Other Other
1.3.3.1 Technical support to develop a standardised methodology to enable estimation of total WaSH expenditure (off‐budget, multilateral, bilateral, NGO including emergency expenditure using standardised methodology)
X X X2 35 Other Other
1.3.3.2 Technical support so annual survey undertaken, analysed and reported X X X X X X 3 60 Other Other
PROC 1.4.1.1 Production of tender documentation and sign off by ministry X X 6 8 DFID M&E support DFID M&E support
1.4.1.2 Technical support to tender processes and contract and regulation acceptance testing for potential vendors
X X 7 12 DFID M&E support DFID M&E support
1.4.2 Vendor status log reviewed (fortnightly) Op. 1.4.2.1 Manage vendor to customise and further develop and deliver MIS to include technical and functional design specifications
X X X 10 20 DFID M&E support DFID CGF
1.4.3 Alpha acceptance report Op. 1.4.3.1 Representative user feedback from federal, regional and woreda level acquired on basis of wireframes and/or prototype
X 5 20 DFID M&E support DFID M&E support
1.4.4 Operational manuals developed for the OWNP MIS Op. 1.4.4.1 Quality assure/review full operational and technical manuals prepared by vendor for different users levels
X X 2 10 DFID M&E support DFID M&E support
Op. 1.4.5.1 Full plan prepared for the MIS pilot in selected regions (beta user testing)
X X 5 10 DFID M&E support DFID M&E support
1.4.5.2 Prepare and deliver training for pilot of MIS X 10 15 DFID M&E support DFID M&E support1.4.5.3 Coordinate the MIS pilot and feedback process in selected regions (beta
user testing)X X X 15 25 DFID M&E support DFID M&E support
1.4.6 UAT and contract acceptance report for OWNP MIS ready for national roll‐out
Op. 1.4.6.1 Refine MIS and documentation based on Beta Acceptance Report and piloting experiences
X X 15 15 DFID M&E support DFID M&E support
1.4.7 Plans for OWNP MIS software launch Op. 1.4.7.1 Preparations for software launch X 5 10 DFID M&E support DFID M&E support1.4.8 OWNP MIS is kept operational Op. 1.4.8.1 Monitor vendor to ensure helpdesk support, regular bug fixing,
upgrading, customisation according to contractX X X X X X X X X X X X X X X X X X X X X X X X X X X X X X X X X 30 45 DFID M&E support DFID M&E support
1.5.1.1 Technical support to development NWI2 plan and mobilisation of fundsX X X
20 20 DFID M&E support DFID M&E support
1.5.1.2 NWI1 methodology revised and manuals & guidelines updated X X 10 15 DFID M&E support DFID M&E support1.5.1.3 Technical support to detailed logistics planning and preparation
X X10 15 DFID M&E support DFID M&E support
1.5.1.4 Technical support to collection, processing and analysis X X X X X X 20 30 DFID M&E support Other1.5.1.5 Review and lessons learned report drafted X X 5 10 DFID M&E support DFID M&E support1.5.2.1 Production of tender documentation X X 5 5 DFID M&E support DFID M&E support1.5.2.2 Support tender processes, roadshow, regulation testing and award
contract to vendorX X 10 10 DFID M&E support DFID M&E support
1.5.2.3 Technical support to customisation of COTS solution by vendor X 10 10 DFID M&E support DFID CGF1.5.2.4 Review and approval of documentation for system X X 2 5 DFID M&E support DFID M&E support
Report on piloting of mobile data collection (February 2016)
1.5.2.5 Piloting and refining during 1st region where data collected before other regions start X X X
8 15 DFID M&E support DFID M&E support
Outcome also depends on output 2.2.3 under capacity building
CB/ NWI 0 0
Outcome also links to outputs 3.5.1‐3.5.5 under dissemination and use
DDU/ NWI
0 0
1.6.1.1 Technical support to develop policies and procedures for ongoing reporting using MIS X X
5 5 DFID M&E support DFID M&E support
1.6.1.2 Planning the roll out of MIS to all regionsX X X
10 10 DFID M&E support DFID M&E support
1.6.1.3 Roll out of MIS to all regions X X X X X X X X X X X X X X X X X X X X X X X X 35 65 DFID M&E support Other1.6.1.4 Review to learn lessons X X X 8 10 DFID M&E support DFID M&E support
Outcome 1.3 Improved WaSH expenditure data collected through national systems (IBEX) and supporting studies
Outcome 1.5 Improved NWI water data collected at periodic intervals, and NWI2 completed
Outcome 1.6 All regions reporting regularly on at least kebele level by end 2016 and on infrastucture level by end 2018
Updated list of WaSH education indicators with status and definitions (by Dec each year)
Annual report of total WaSH expenditure (by September each year)
Alpha acceptance report (February 2016)
1.4.1
1.5.1
1.5.2
Op.
No
1.6.1
1.3.3
1.4.5
Key deliverables/ proposed milestones
Vendor procured and passed contract and regulation acceptance testing
Beta acceptance report based on piloting OWNP MIS in selected regions (beta user testing)
Report reviewing implementation and lessons learned of NWI2 (October 2016)
Tender documents for mobile data collection software (December 2015)
Updated guidelines for reporting using WaSH M&E MIS (September 2016)
All regions have effective process in place to regularly (short intervals quarterly‐annual) collect, process and disseminate data
Effective national process in place to collect and process NWI data at periodic intervals, and support to NWI2 reported
2019
NWI/ PROC
Commercial Off‐the‐shelf (COTS) ICT solution for NWI mobile data collection procured and tested by end February 2016
Activities 2015 2016 2017 2018
Reported annual survey of total WaSH expenditure
NoOutput Sub‐plans
Op.
Annually updated indicator frameworks and guidelines (WaSH component) for HEH program and HMIS
Op
NWI
Outcome 1.2 Improved school WASH data collected through the education sector monitoring systems
Outcome 1. 4 IT‐enabled Water MIS system used to facilitate effective processing (sharing, distributing, analysing, storing) and disseminationTender documents for alternate MIS software (December 2015)
Beta acceptance report (July 2016)
UAT and contract acceptance report (Oct 2016)
Updated list of WaSH health indicators with status and definitions (by Dec each year)
Work‐package 1. OWNP MIS systems enhancement
Effort (days)

Budget TA Budget ExpensesN D J F M A M J J A S O N D J F M A M J J A S O N D J F M A M J J A S O N D J F Int. Nat.
No Key deliverables/ proposed milestones
2019Activities 2015 2016 2017 2018NoOutput Sub‐plans Effort (days)
Outcome also depends on output 2.2.4 under capacity building
CB 0 0
1.7.1 Section in OWNP annual report on the quality of WaSH data and with recommendations for improvements
DQA 1.7.1.1 Technical support to implement and upgrade existing data quality assurance mechanisms in each WaSH sector, assess data by triangulation with other data sources and undertake validation surveys where required
X X X X X X X X X20 40 Other Other
1.7.2 OWNP M&E implementation quarterly report includes section on implementation of meaures to address WaSH data quality issues
DQA 1.7.2.1 Technical support to identify and follow up recommendations for improvements to enhance data quality X X X X X X X X X X X X X
13 15 DFID M&E support DFID M&E support
1.8.1 Source code recommendations PROC 1.8.1.1 A\udit source code with PUT X 2 4 DFID M&E support Other
1.8.2 PUT contracted to upgrade existing WASH M&E MIS PROC 1.8.2.1 Support tender process and contractual arrangements XX 2 4 DFID M&E support Other
1.8.3 Vendor status log (fortnightly) Op. 1.8.3.1 Manage PUT to customise and further develop and deliver PUT system to include technical and funcitonal design specifications
X X X 3 5 DFID M&E support Other
1.8.4 Alpha acceptance report Op. 1.8.4.1 Representative user feedback at federal, regional and woreda level acquired on basis of wireframes and/or prototype
X 3 5 DFID M&E support Other
1.8.5 Manuals updated Op. 1.8.5.1 Review full operational and technical manuals for different users levels X X 1 2 DFID M&E support Other
1.8.6 Beta acceptance report Op. 1.8.6.1 Prepare pilot in selected regions and deliver training. Coordinate feedback. Aligned with 1.4.5.
X X X X X X 3 15 DFID M&E support Other
1.8.7 UAT report Op. 1.8.7.1 Refine WaSH M&E MIS (PUT) documentation based on Beta Acceptance Report and piloting experiences X X
5 10 DFID M&E support Other
1.8.8 Existing WASH M&E MIS is kept operational Op. 1.8.8.1 Monitor vendor to ensure helpdesk support, regular bug fixing, upgrading, customisation according to contract
X X X X X X X X X X X X X X X X X X X X X X 3 9 DFID M&E support Other
2.1.1 Benchmarks established and used to track the human, physical and financial resources required to implement the selected M&E system
CB 2.1.1.1 Technical support to develop and use a simple benchmarking approach for OWNP M&E (with supporting guideline) to identify and track capacity gaps and assets
X X X
5 15
DFID M&E support DFID M&E support
2.1.2.1 Technical support to strengthen HRD strategies for M&E staff in each sector including recruitment procedures and criteria, career paths, job descriptions, performance criteria and incentives, staff retention strategies, staff induction and handover procedures, and staff training guidelines
X X X X X
14 18
Other Other
2.1.2.2 Technical support to develop or update WaSH M&E components of HR manuals and guidelines
X X X X X 9 20Other Other
2.1.2.3 Training for HRD officers and leadership to roll out X X X 9 15 Other Other2.1.3 Sector plans include budgeted components to
implement WaSH M&E HRD strategies CB 2.1.3.1 Technical support to sectors and regions to develop a plan to put the
processes, people and systems in place to implement enhanced WaSH M&E
X X X9 19
DFID M&E support DFID M&E support
2.1.4 Reports tracking progress in filling vacant M&E posts and procuring the necessary equipment, ICT, furniture and vehicles
CB/ PROC 2.1.4.1 Follow up support to promote filling vacant posts and to procure the necessary equipment, ICT, furniture and vehicles X X X X X X X X X X X X X X X X X X X X X X X X X X X X X X X X X X X X X
2 17
DFID M&E support Other
2.2.1.1 Technical support to develop standardized national guidelines on HEH monitoring X X
10 10 Other Other
2.2.1.2 Technical support to disseminate guidelines with appropriate orientation, training and supervision
X X X 6 27 Other Other
2.2.1.3 Promote allocation of appropriate human and financial resources to support and implement HEH program monitoring activities X X X
4 8 Other Other
2.2.1.4 Technical develop standard methodology for conducting hygiene and environmental health behaviour change studies
X X 20 10 Other Other
2.2.2.1 Technical support to develop/ update guidelines and materials to support monitoring WaSH in schools
X X 5 10 Other Other
2.2.2.2 Technical support to disseminate guidelines with appropriate orientation, training and supervision
X X X 7 20 Other Other
2.2.3.1 Tracking of Permanent and temporary staff and institutions mobilised by MoWIE at national and regional levels X X
3 5 DFID M&E support Other
2.2.3.2 Manuals and guidelines made available to staff and institutions X X 2 5 DFID M&E support DFID M&E support
2.2.3.3 Training of trainers programme X 10 10 DFID M&E support Other2.2.3.4 Training roll out to all regions X X X X X 5 20 DFID M&E support Other2.2.3.5 Backstopping support in place for regions X X X X X 5 15 DFID M&E support DFID M&E support2.2.4.1 Roles and responsibilities agreed and specified in relevant procedures
X2 5 DFID M&E support DFID M&E support
2.2.4.2 Technical support to MoWIE to mobilise resources X X X X 10 7 DFID M&E support DFID M&E support2.2.4.3 Technical support to adaptation od job descriptions including the
establishment of technical support staff for all MIS users and including user rights administration
X X X2 5 DFID M&E support Other
2.2.4.4 Manuals and guidelines made available X X 2 4 DFID M&E support DFID M&E support2.2.4.5 Training of trainers programme X 5 10 DFID M&E support Other2.2.4.6 Support to training roll out and repeat training (zonal, woreda, town,
kebele)X X X X X X 15 50 DFID M&E support Other
2.2.4.7 Backstopping support in place X X X X X X X X X X X X X X X X X X X X X X X X X X X X X X 13 18 DFID M&E support DFID M&E support2.2.4.8 Stakeholder evaluation of MIS performance in reporting X X 4 5 DFID M&E support DFID M&E support
Outcome 1.7 High level of confidence of sector stakeholders in the validity of WaSH data
Outcome 1.8 WASH M&E MIS on PUT platform upgraded
Report on training of trainers for MIS (March 2016); Report on training roll out for MIS(April 2016); Report of stakeholder evaluation (Sep 2016)
Report on modifcations made to improve HR strategy and guidelines for each WaSH ministry (August 2016)WaSH M&E focused Human Resources Development
strategy developed for each sector (water, health, education and finance) and updated on an annual basis
Water‐sector staff and institutions which have the mandates, capacities and resources to collect, process and disseminate NWI data
Health sector processes, skills and knowledge strengthened in data gathering, reporting and verification in sanitation and hygiene
Report on further operationalisation recommendations linked to alternate MIS (September 2016)
Tender documents for modifcations to existing WaSH M&E MIS software (December 2015)
Report on training of trainers for NWI (March 2016) and Report on training roll out for NWI (April 2016)
Outcome 2.1 Physical, organisational and human resources policies and procedures are in place across all sectors to implement OWNP M&E
Outcome 2.2 Sector capacity with skills and knowledge to collect and process M&E data is in place
Workpackage 2. Capacity development
CB
CB
CB
2.1.2
CB
2.2.2
2.2.3
2.2.1
Water‐sector staff and institutions which have the mandates, capacities and resources to collect, process and disseminate regular data
CB
Education sector processes, skills and knowledge strengthened in data gathering, reporting and verification in sanitation and hygiene
2.2.4
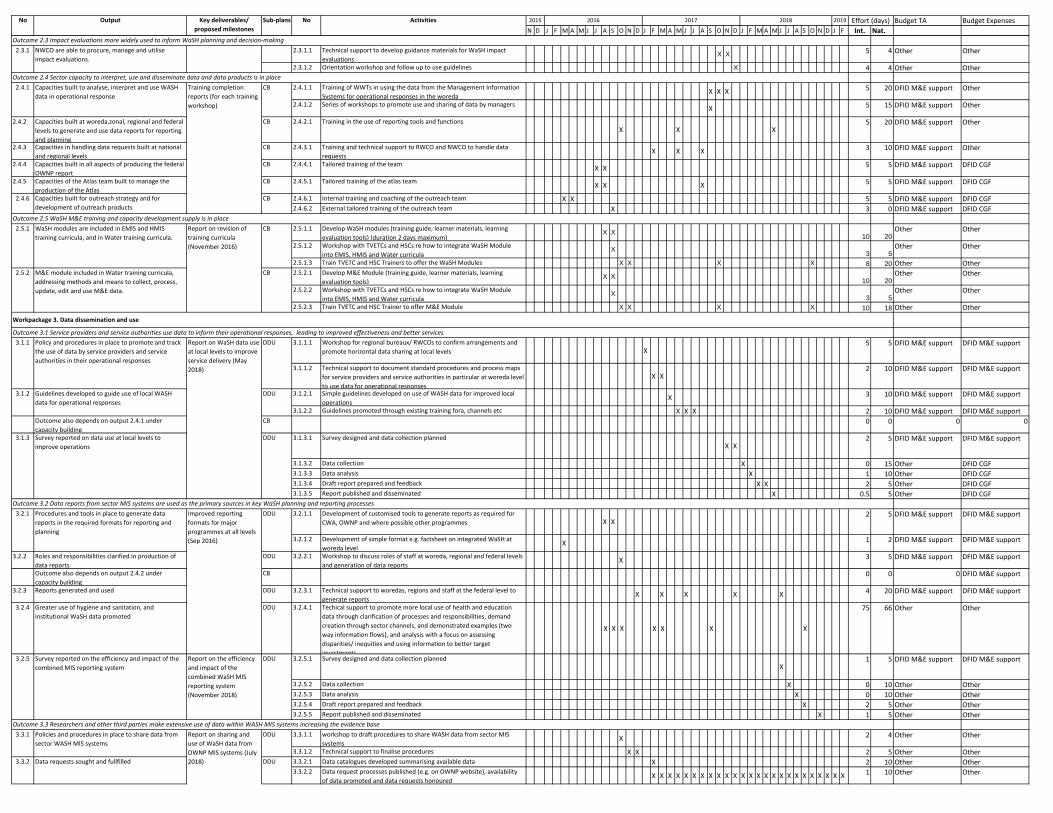
Budget TA Budget ExpensesN D J F M A M J J A S O N D J F M A M J J A S O N D J F M A M J J A S O N D J F Int. Nat.
No Key deliverables/ proposed milestones
2019Activities 2015 2016 2017 2018NoOutput Sub‐plans Effort (days)
2.3.1.1 Technical support to develop guidance materials for WaSH impact evaluations
X X 5 4 Other Other
2.3.1.2 Orientation workshop and follow up to use guidelines X 4 4 Other Other
2.4.1.1 Training of WWTs in using the data from the Management Information Systems for operational responses in the woreda
X X X 5 20 DFID M&E support Other
2.4.1.2 Series of workshops to promote use and sharing of data by managers X 5 15 DFID M&E support Other
2.4.2 Capacities built at woreda,zonal, regional and federal levels to generate and use data reports for reporting and planning
CB 2.4.2.1 Training in the use of reporting tools and functionsX X X
5 20 DFID M&E support Other
2.4.3 Capacities in handling data requests built at national and regional levels
CB 2.4.3.1 Training and technical support to RWCO and NWCO to handle data requests
X X X 3 10 DFID M&E support Other
2.4.4 Capacities built in all aspects of producing the federal OWNP report
CB 2.4.4.1 Tailored training of the team X X 5 5 DFID M&E support DFID CGF
2.4.5 Capacities of the Atlas team built to manage the production of the Atlas
CB 2.4.5.1 Tailored training of the atlas team X X X 5 5 DFID M&E support DFID CGF
2.4.6.1 Internal training and coaching of the outreach team X X 5 5 DFID M&E support DFID CGF2.4.6.2 External tailored training of the outreach team X 3 0 DFID M&E support DFID CGF
2.5.1.1 Develop WaSH modules (training guide, learner materials, learning evaluation tools) (duration 2 days maximum)
X X 10 20Other Other
2.5.1.2 Workshop with TVETCs and HSCs re how to integrate WaSH Module into EMIS, HMIS and Water curricula
X 3 5Other Other
2.5.1.3 Train TVETC and HSC Trainers to offer the WaSH Modules X X X X 8 20 Other Other2.5.2.1 Develop M&E Module (training guide, learner materials, learning
evaluation tools)X X 10 20
Other Other
2.5.2.2 Workshop with TVETCs and HSCs re how to integrate WaSH Module into EMIS, HMIS and Water curricula
X 3 5Other Other
2.5.2.3 Train TVETC and HSC Trainer to offer M&E Module X X X X 10 18 Other Other
3.1.1.1 Workshop for regional bureaux/ RWCOs to confirm arrangements and promote horizontal data sharing at local levels X
5 5 DFID M&E support DFID M&E support
3.1.1.2 Technical support to document standard procedures and process maps for service providers and service authorities in particular at woreda level to use data for operational responses
X X2 10 DFID M&E support DFID M&E support
3.1.2.1 Simple guidelines developed on use of WASH data for improved local operations
X 3 10 DFID M&E support DFID M&E support
3.1.2.2 Guidelines promoted through existing training fora, channels etc X X X 2 10 DFID M&E support DFID M&E supportOutcome also depends on output 2.4.1 under capacity building
CB 0 0 0 0
3.1.3.1 Survey designed and data collection plannedX X
2 5 DFID M&E support DFID M&E support
3.1.3.2 Data collection X 0 15 Other DFID CGF3.1.3.3 Data analysis X 1 10 Other DFID CGF3.1.3.4 Draft report prepared and feedback X X 2 5 Other DFID CGF3.1.3.5 Report published and disseminated X 0.5 5 Other DFID CGF
3.2.1.1 Development of customised tools to generate reports as required for CWA, OWNP and where possible other programmes X X
2 5 DFID M&E support DFID M&E support
3.2.1.2 Development of simple format e.g. factsheet on integrated WaSH at woreda level
X 1 2 DFID M&E support DFID M&E support
3.2.2 Roles and responsibilities clarified in production of data reports
DDU 3.2.2.1 Workshop to discuss roles of staff at woreda, regional and federal levels and generation of data reports
X 3 5 DFID M&E support DFID M&E support
Outcome also depends on output 2.4.2 under capacity building
CB 0 0 0 DFID M&E support
3.2.3 Reports generated and used DDU 3.2.3.1 Technical support to woredas, regions and staff at the federal level to generate reports
X X X X X 4 20 DFID M&E support DFID M&E support
3.2.4 Greater use of hygiene and sanitation, and institutional WaSH data promoted
DDU 3.2.4.1 Techical support to promote more local use of health and education data through clarification of processes and responsibilities, demand creation through sector channels, and demonstrated examples (two way information flows), and analysis with a focus on assessing disparities/ inequities and using information to better target investments
X X X X X X X
75 66 Other Other
3.2.5.1 Survey designed and data collection plannedX
1 5 DFID M&E support DFID M&E support
3.2.5.2 Data collection X 0 10 Other Other3.2.5.3 Data analysis X 0 10 Other Other3.2.5.4 Draft report prepared and feedback X 2 5 Other Other3.2.5.5 Report published and disseminated X 1 5 Other Other
3.3.1.1 workshop to draft procedures to share WASH data from sector MIS systems
X 2 4 Other Other
3.3.1.2 Technical support to finalise procedures X X 2 5 Other Other3.3.2.1 Data catalogues developed summarising available data X 2 10 Other Other3.3.2.2 Data request processes published (e.g. on OWNP website), availability
of data promoted and data requests honouredX X X X X X X X X X X X X X X X X X X X X X X X X 1 10 Other Other
Report on revision of training curricula (November 2016)
Training completion reports (for each training workshop)
3.1.3
Report on sharing and use of WaSH data from OWNP MIS systems (July 2018)
Report on the efficiency and impact of the combined WaSH MIS reporting system (November 2018)
Improved reporting formats for major programmes at all levels (Sep 2016)
NWCO are able to procure, manage and utilise impact evaluations.
Procedures and tools in place to generate data reports in the required formats for reporting and planning
Data requests sought and fullfilled
Policies and procedures in place to share data from sector WASH MIS systems
Capacities built to analyse, interpret and use WASH data in operational response
Outcome 2.3 Impact evaluations more widely used to inform WaSH planning and decision‐making
Outcome 2.4 Sector capacity to interpret, use and disseminate data and data products is in place
2.4.6
DDU
DDU
M&E module included in Water training curricula, addressing methods and means to collect, process, update, edit and use M&E data.
CBCapacities built for outreach strategy and for development of outreach products
CB
2.3.1
2.4.1
DDU
Guidelines developed to guide use of local WASH data for operational responses
Policy and procedures in place to promote and track the use of data by service providers and service authorities in their operational responses
Report on WaSH data use at local levels to improve service delivery (May 2018)
Outcome 2.5 WaSH M&E training and capacity development supply is in place
Workpackage 3. Data dissemination and use
Outcome 3.1 Service providers and service authorities use data to inform their operational responses, leading to improved effectiveness and better services
Outcome 3.2 Data reports from sector MIS systems are used as the primary sources in key WaSH planning and reporting processes
Outcome 3.3 Researchers and other third parties make extensive use of data within WASH MIS systems increasing the evidence base
DDU
Survey reported on data use at local levels to improve operations
3.2.5
3.3.1
3.3.2
3.2.1
2.5.1
2.5.2
3.1.1
3.1.2
DDU
DDU
Survey reported on the efficiency and impact of the combined MIS reporting system
DDU
WaSH modules are included in EMIS and HMIS training curricula, and in Water training curricula.
CB
CB
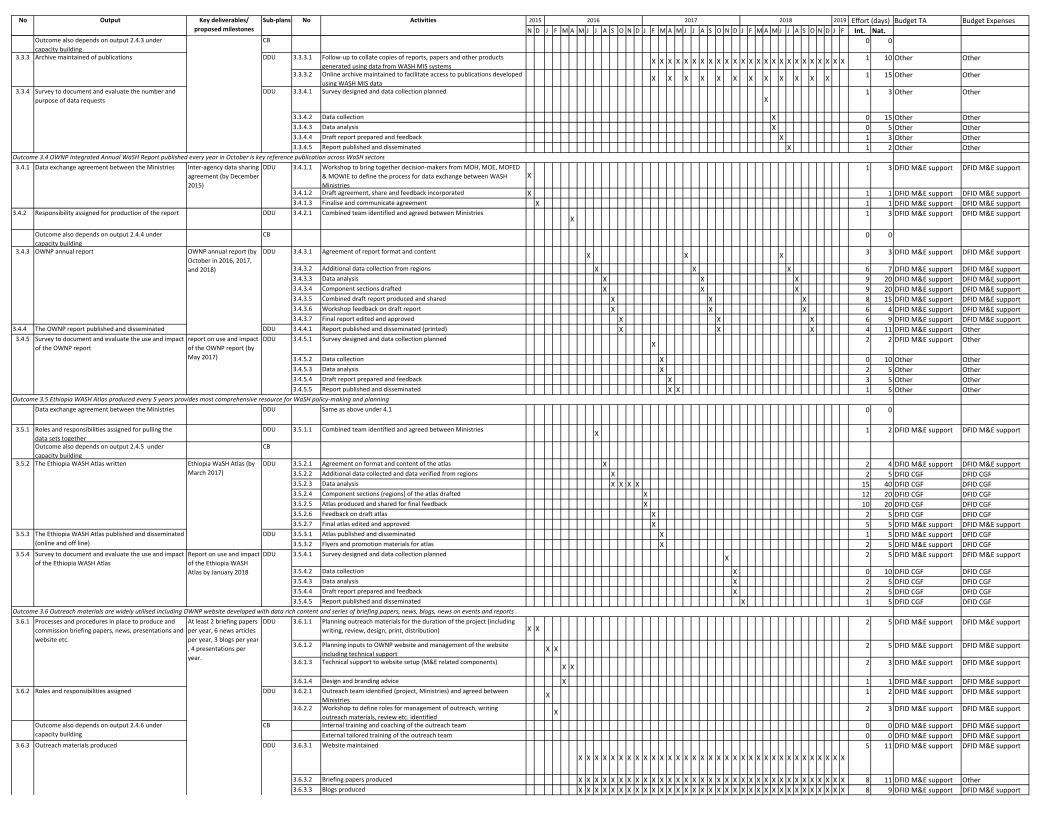
Budget TA Budget ExpensesN D J F M A M J J A S O N D J F M A M J J A S O N D J F M A M J J A S O N D J F Int. Nat.
No Key deliverables/ proposed milestones
2019Activities 2015 2016 2017 2018NoOutput Sub‐plans Effort (days)
Outcome also depends on output 2.4.3 under capacity building
CB 0 0
3.3.3.1 Follow‐up to collate copies of reports, papers and other products generated using data from WASH MIS systems
X X X X X X X X X X X X X X X X X X X X X X X X X 1 10 Other Other
3.3.3.2 Online archive maintained to facilitate access to publications developed using WASH MIS data
X X X X X X X X X X X X 1 15 Other Other
3.3.4.1 Survey designed and data collection plannedX
1 3 Other Other
3.3.4.2 Data collection X 0 15 Other Other3.3.4.3 Data analysis X 0 5 Other Other3.3.4.4 Draft report prepared and feedback X 1 3 Other Other3.3.4.5 Report published and disseminated X 1 2 Other Other
3.4.1.1 Workshop to bring together decision‐makers from MOH, MOE, MOFED & MOWIE to define the process for data exchange between WASH Ministries
X1 3 DFID M&E support DFID M&E support
3.4.1.2 Draft agreement, share and feedback incorporated X 1 1 DFID M&E support DFID M&E support3.4.1.3 Finalise and communicate agreement X 1 1 DFID M&E support DFID M&E support
3.4.2 Responsibility assigned for production of the report DDU 3.4.2.1 Combined team identified and agreed between MinistriesX
1 3 DFID M&E support DFID M&E support
Outcome also depends on output 2.4.4 under capacity building
CB 0 0
3.4.3.1 Agreement of report format and content X X X 3 3 DFID M&E support DFID M&E support
3.4.3.2 Additional data collection from regions X X X 6 7 DFID M&E support DFID M&E support3.4.3.3 Data analysis X X X 9 20 DFID M&E support DFID M&E support3.4.3.4 Component sections drafted X X X 9 20 DFID M&E support DFID M&E support3.4.3.5 Combined draft report produced and shared X X X 8 15 DFID M&E support DFID M&E support3.4.3.6 Workshop feedback on draft report X X X 6 4 DFID M&E support DFID M&E support3.4.3.7 Final report edited and approved X X X 6 9 DFID M&E support DFID M&E support
3.4.4 The OWNP report published and disseminated DDU 3.4.4.1 Report published and disseminated (printed) X X X 4 11 DFID M&E support Other3.4.5.1 Survey designed and data collection planned
X2 2 DFID M&E support Other
3.4.5.2 Data collection X 0 10 Other Other3.4.5.3 Data analysis X 2 5 Other Other3.4.5.4 Draft report prepared and feedback X 3 5 Other Other3.4.5.5 Report published and disseminated X X 1 5 Other Other
Data exchange agreement between the Ministries DDU Same as above under 4.1 0 0
Roles and responsibilities assigned for pulling the data sets together
DDU 3.5.1.1 Combined team identified and agreed between Ministries X 1 2 DFID M&E support DFID M&E support
Outcome also depends on output 2.4.5 under capacity building
CB
3.5.2.1 Agreement on format and content of the atlas X 2 4 DFID M&E support DFID M&E support3.5.2.2 Additional data collected and data verified from regions X 2 5 DFID CGF DFID CGF3.5.2.3 Data analysis X X X X 15 40 DFID CGF DFID CGF3.5.2.4 Component sections (regions) of the atlas drafted X 12 20 DFID CGF DFID CGF3.5.2.5 Atlas produced and shared for final feedback X 10 20 DFID CGF DFID CGF3.5.2.6 Feedback on draft atlas X 2 5 DFID CGF DFID CGF3.5.2.7 Final atlas edited and approved X 5 5 DFID M&E support DFID M&E support3.5.3.1 Atlas published and disseminated X 1 5 DFID M&E support DFID CGF3.5.3.2 Flyers and promotion materials for atlas X 2 5 DFID M&E support DFID CGF3.5.4.1 Survey designed and data collection planned X 2 5 DFID M&E support DFID M&E support
3.5.4.2 Data collection X 0 10 DFID CGF DFID CGF3.5.4.3 Data analysis X 2 5 DFID CGF DFID CGF3.5.4.4 Draft report prepared and feedback X 2 5 DFID CGF DFID CGF3.5.4.5 Report published and disseminated X 1 5 DFID CGF DFID CGF
3.6.1.1 Planning outreach materials for the duration of the project (including writing, review, design, print, distribution) X X
2 5 DFID M&E support DFID M&E support
3.6.1.2 Planning inputs to OWNP website and management of the website including technical support
X X 2 5 DFID M&E support DFID M&E support
3.6.1.3 Technical support to website setup (M&E related components)X X 2 3 DFID M&E support DFID M&E support
3.6.1.4 Design and branding advice X 1 1 DFID M&E support DFID M&E support3.6.2.1 Outreach team identified (project, Ministries) and agreed between
MinistriesX 1 2 DFID M&E support DFID M&E support
3.6.2.2 Workshop to define roles for management of outreach, writing outreach materials, review etc. identified
X 2 3 DFID M&E support DFID M&E support
Internal training and coaching of the outreach team 0 0 DFID M&E support DFID M&E supportExternal tailored training of the outreach team 0 0 DFID M&E support DFID M&E support
3.6.3.1 Website maintained
X X X X X X X X X X X X X X X X X X X X X X X X X X X X X X X X X X5 11 DFID M&E support DFID M&E support
3.6.3.2 Briefing papers produced X X X X X X X X X X X X X X X X X X X X X X X X X X X X X X X X X X 8 11 DFID M&E support Other3.6.3.3 Blogs produced X X X X X X X X X X X X X X X X X X X X X X X X X X X X X X X X X X 8 9 DFID M&E support DFID M&E support
Outcome 3.4 OWNP Integrated Annual WaSH Report published every year in October is key reference publication across WaSH sectorsDDU
DDU
At least 2 briefing papers per year, 6 news articles per year, 3 blogs per year , 4 presentations per year.
Report on use and impact of the Ethiopia WASH Atlas by January 2018
Ethiopia WaSH Atlas (by March 2017)
OWNP annual report (by October in 2016, 2017, and 2018)
report on use and impact of the OWNP report (by May 2017)
Inter‐agency data sharing agreement (by December 2015)
Survey to document and evaluate the use and impact of the OWNP report
3.4.3
3.4.5
3.5.4
3.5.3
3.5.2
3.5.1
Outcome 3.5 Ethiopia WASH Atlas produced every 5 years provides most comprehensive resource for WaSH policy‐making and planning
DDU
DDU3.3.4
3.3.3 Archive maintained of publications
OWNP annual report
Data exchange agreement between the Ministries
DDU
DDU
DDU
DDU
CB
Processes and procedures in place to produce and commission briefing papers, news, presentations and website etc.
DDU
Outcome 3.6 Outreach materials are widely utilised including OWNP website developed with data rich content and series of briefing papers, news, blogs, news on events and reports .
3.6.3
3.4.1
3.6.1
3.6.2
DDU
DDU
Outreach materials produced
Outcome also depends on output 2.4.6 under capacity building
Roles and responsibilities assigned
Survey to document and evaluate the use and impact of the Ethiopia WASH Atlas
The Ethiopia WASH Atlas published and disseminated (online and off line)
The Ethiopia WASH Atlas written
Survey to document and evaluate the number and purpose of data requests
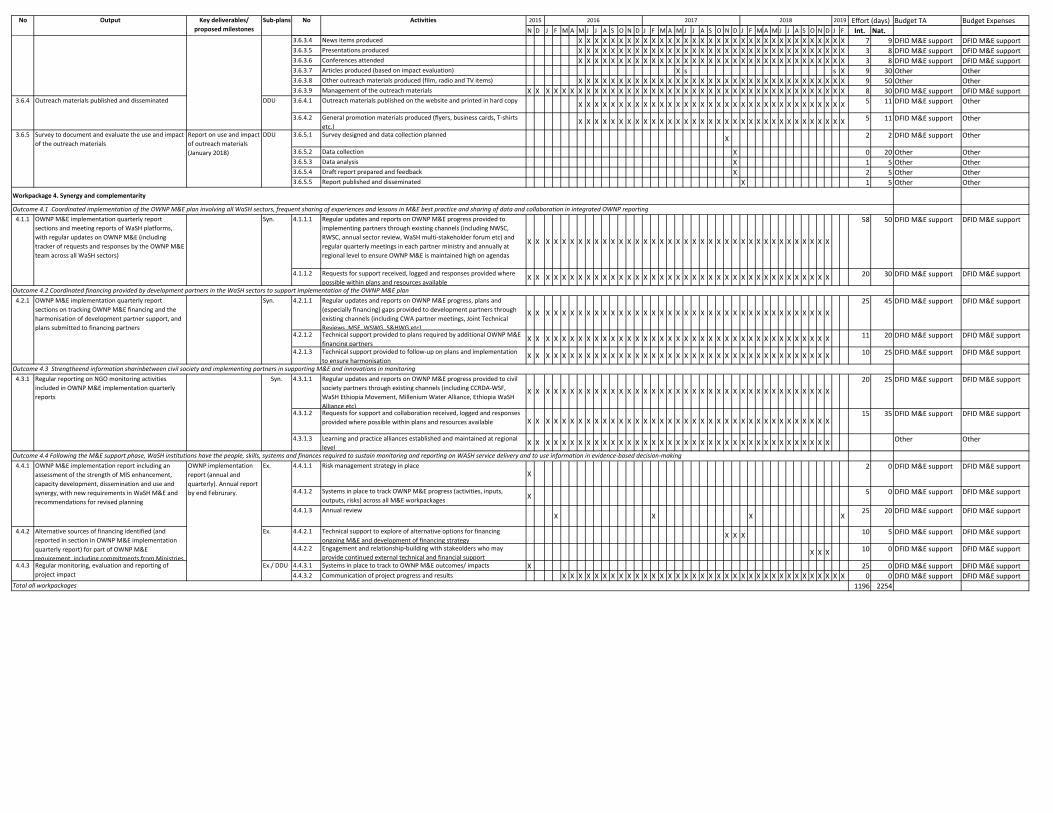
Budget TA Budget ExpensesN D J F M A M J J A S O N D J F M A M J J A S O N D J F M A M J J A S O N D J F Int. Nat.
No Key deliverables/ proposed milestones
2019Activities 2015 2016 2017 2018NoOutput Sub‐plans Effort (days)
3.6.3.4 News items produced X X X X X X X X X X X X X X X X X X X X X X X X X X X X X X X X X X 7 9 DFID M&E support DFID M&E support3.6.3.5 Presentations produced X X X X X X X X X X X X X X X X X X X X X X X X X X X X X X X X X X 3 8 DFID M&E support DFID M&E support3.6.3.6 Conferences attended X X X X X X X X X X X X X X X X X X X X X X X X X X X X X X X X X X 3 8 DFID M&E support DFID M&E support3.6.3.7 Articles produced (based on impact evaluation) X s s X 9 30 Other Other3.6.3.8 Other outreach materials produced (film, radio and TV items) X X X X X X X X X X X X X X X X X X X X X X X X X X X X X X X X X X 9 50 Other Other3.6.3.9 Management of the outreach materials X X X X X X X X X X X X X X X X X X X X X X X X X X X X X X X X X X X X X X X X 8 30 DFID M&E support DFID M&E support3.6.4.1 Outreach materials published on the website and printed in hard copy X X X X X X X X X X X X X X X X X X X X X X X X X X X X X X X X X X 5 11 DFID M&E support Other
3.6.4.2 General promotion materials produced (flyers, business cards, T‐shirts etc.)
X X X X X X X X X X X X X X X X X X X X X X X X X X X X X X X X X X 5 11 DFID M&E support Other
3.6.5.1 Survey designed and data collection planned X 2 2 DFID M&E support Other
3.6.5.2 Data collection X 0 20 Other Other3.6.5.3 Data analysis X 1 5 Other Other3.6.5.4 Draft report prepared and feedback X 2 5 Other Other3.6.5.5 Report published and disseminated X 1 5 Other Other
4.1.1.1 Regular updates and reports on OWNP M&E progress provided to implementing partners through existing channels (including NWSC, RWSC, annual sector review, WaSH multi‐stakeholder forum etc) and regular quarterly meetings in each partner ministry and annually at regional level to ensure OWNP M&E is maintained high on agendas
X X X X X X X X X X X X X X X X X X X X X X X X X X X X X X X X X X X X X X
58 50 DFID M&E support DFID M&E support
4.1.1.2 Requests for support received, logged and responses provided where possible within plans and resources available
X X X X X X X X X X X X X X X X X X X X X X X X X X X X X X X X X X X X X X 20 30 DFID M&E support DFID M&E support
4.2.1.1 Regular updates and reports on OWNP M&E progress, plans and (especially financing) gaps provided to development partners through existing channels (including CWA partner meetings, Joint Technical Reviews, MSF, WSWG, S&HWG etc)
X X X X X X X X X X X X X X X X X X X X X X X X X X X X X X X X X X X X X X25 45 DFID M&E support DFID M&E support
4.2.1.2 Technical support provided to plans required by additional OWNP M&E financing partners
X X X X X X X X X X X X X X X X X X X X X X X X X X X X X X X X X X X X X X 11 20 DFID M&E support DFID M&E support
4.2.1.3 Technical support provided to follow‐up on plans and implementation to ensure harmonisation
X X X X X X X X X X X X X X X X X X X X X X X X X X X X X X X X X X X X X X 10 25 DFID M&E support DFID M&E support
4.3.1.1 Regular updates and reports on OWNP M&E progress provided to civil society partners through existing channels (including CCRDA‐WSF, WaSH Ethiopia Movement, Millenium Water Alliance, Ethiopia WaSH Alliance etc)
X X X X X X X X X X X X X X X X X X X X X X X X X X X X X X X X X X X X X X20 25 DFID M&E support DFID M&E support
4.3.1.2 Requests for support and collaboration received, logged and responses provided where possible within plans and resources available X X X X X X X X X X X X X X X X X X X X X X X X X X X X X X X X X X X X X X
15 35 DFID M&E support DFID M&E support
4.3.1.3 Learning and practice alliances established and maintained at regional level
X X X X X X X X X X X X X X X X X X X X X X X X X X X X X X X X X X X X X X Other Other
4.4.1.1 Risk management strategy in placeX
2 0 DFID M&E support DFID M&E support
4.4.1.2 Systems in place to track OWNP M&E progress (activities, inputs, outputs, risks) across all M&E workpackages X 5 0 DFID M&E support DFID M&E support
4.4.1.3 Annual reviewX X X X
25 20 DFID M&E support DFID M&E support
4.4.2.1 Technical support to explore of alternative options for financing ongoing M&E and development of financing strategy
X X X 10 5 DFID M&E support DFID M&E support
4.4.2.2 Engagement and relationship‐building with stakeolders who may provide continued external technical and financial support
X X X 10 0 DFID M&E support DFID M&E support
4.4.3.1 Systems in place to track to OWNP M&E outcomes/ impacts X 25 0 DFID M&E support DFID M&E support4.4.3.2 Communication of project progress and results X X X X X X X X X X X X X X X X X X X X X X X X X X X X X X X X X X X X 0 0 DFID M&E support DFID M&E support
1196 2254Total all workpackages
OWNP implementation report (annual and quarterly). Annual report by end Februrary.
Report on use and impact of outreach materials (January 2018)
Workpackage 4. Synergy and complementarity
Outcome 4.1 Coordinated implementation of the OWNP M&E plan involving all WaSH sectors, frequent sharing of experiences and lessons in M&E best practice and sharing of data and collaboration in integrated OWNP reporting
Ex.
Alternative sources of financing identified (and reported in section in OWNP M&E implementation quarterly report) for part of OWNP M&E requirement, including commitments from Ministries
Ex.
4.4.1Outcome 4.4 Following the M&E support phase, WaSH institutions have the people, skills, systems and finances required to sustain monitoring and reporting on WASH service delivery and to use information in evidence‐based decision‐making
Outcome 4.2 Coordinated financing provided by development partners in the WaSH sectors to support implementation of the OWNP M&E plan
Outcome 4.3 Strengtheend information sharinbetween civil society and implementing partners in supporting M&E and innovations in monitoring
DDU
DDU
Regular monitoring, evaluation and reporting of project impact
Ex./ DDU
Syn.OWNP M&E implementation quarterly report sections on tracking OWNP M&E financing and the harmonisation of development partner support, and plans submitted to financing partners
Syn.
4.4.2
OWNP M&E implementation quarterly report sections and meeting reports of WaSH platforms, with regular updates on OWNP M&E (including tracker of requests and responses by the OWNP M&E team across all WaSH sectors)
4.2.1
4.4.3
4.1.1
OWNP M&E implementation report including an assessment of the strength of MIS enhancement, capacity development, dissemination and use and synergy, with new requirements in WaSH M&E and recommendations for revised planning
Regular reporting on NGO monitoring activities included in OWNP M&E implementation quarterly reports
4.3.1 Syn.
3.6.4
3.6.5 Survey to document and evaluate the use and impact of the outreach materials
Outreach materials published and disseminated
ANNEX 5: TERMS OF REFERENCE / ONEWASH INCEPTION REPORT VOL.1 (TASKS 1 AND 3)
ONEWASH – OCTOBER 2015 112
Annex 5: Terms of Reference
1
Terms of Reference
Technical and Managerial support for strengthening the Monitoring and
Evaluation (M&E) system of the One WaSH National Programme (OWNP) of
Ethiopia, and for conducting an Impact Evaluation
1. Purpose and Objective
1.1. Purpose
The main purpose of this assignment will be to strengthen accountability of the
Water, Sanitisation and Hygiene (WaSH) sector in Ethiopia by making the WaSH
Monitoring & Evaluation (M&E) system fully operational at all levels (i.e., federal,
regional and Woreda). A functional WaSH M&E system will make it possible to
measure and report progress towards the One WaSH National Programme (OWNP)
results. This assignment forms part of the Department of International Development
Ethiopia’s (DFIDE) wider Evaluation Strategy and will contribute in particular to
monitoring and evaluation of progress against specific WaSH related commitments
set out in DFIDE’s Operational Plan.
1.2. Objectives
The primary objectives of this assignment are:
Provide technical and managerial support to the National WaSH Coordination
Office to strengthen and fully operationalize the WaSH M&E system including
updating of the national inventory data to ensure that reliable, timely and
strategic information are generated at all levels of administration (i.e., federal,
regional and Woreda) to facilitate evidence based decisions;
Assist the National WaSH Coordination Office and the National WASH Inventory
Coordination office to quality assure the data generated through the WaSH M&E
system including the National WaSH Inventory (NWI), and device an approach
for periodic assessment of the data generated by the WaSH M&E system;
Assist the National WaSH Coordination Office to review the OWNP indicators
and establish baseline values;
2
Assist the National WaSH Coordination Office to collect strategic programmatic
(financial, technical and socio economic) data to measure and monitor fairness in
access and utilization, Value for Money and cost drivers throughout the OWNP’s
life time;
Assist the National WaSH Coordination Office to prepare and share quarterly
progress (financial, technical and socio-economic) and annual reports and
quality assure in the consolidation of annual plans to have a sound basis for the
monitoring. Also, assist DFID to carry out annual reviews (ARs) and programme
completion reviews (PCR);
Develop a WaSH Impact Evaluation Framework, carry out a ‘evaluability
assessment’ and suggest a robust evaluation design;
Carry out an independent impact evaluation, in consultation with the Government
of Ethiopia (GOE) partners, donors and other key stakeholders, as per the
WaSH Impact Evaluation Framework; and,
Assist the National WaSH Coordination Office to develop a strategy to
scientifically document and disseminate best practices and lessons learnt by the
programme for the benefit of the WaSH sector in Ethiopia through the different
platforms (Joint Technical Reviews, annual Multi Stakeholder Forums…) as well
as for enhancing the global knowledge. (If need be, the Provider could suggest
and carry out Operational Research to validate best practices/lessons learnt.)
2. Recipient
The immediate recipients of this assignment will be DFID Ethiopia. The primary target audience for the WaSH monitoring findings/reports will be policy makers at the WASH sector Ministries Ministry of Finance and Economic Development (MOFED), Ministry of Water, Irrigation and Energy (MOWIE), Ministry of Health (MOH) and Ministry of Education (MOE) and their experts and professionals, regional bureaus, the pooled fund (CWA) contributing partners and other OWN P partners. The primary target audience for the evaluation findings/reports will be international WaSH funders in addition to the target audience of the monitoring findings/reports.
3. Scope of Work
The scope of this assignment could be broadly divided into three tasks;
Task-1: Strengthening the WASH M&E System
Task-2: Impact Evaluation
Task-3: Dissemination and use of M&E report
3
3.1. Task-1: Strengthening the WASH M&E System
3.1.1. Refinement and Operationalization of the WaSH M&E system:
The Provider, in consultation with the WaSH Coordination Office, the National
WASH Inventory Coordination Office and others, will review and refine the One
WaSH M&E Framework and indicators. In addition to financial and technical
aspects, the One WaSH M&E Framework and indicators should be able to track
and assess the performance of the programme in addressing the fiduciary,
environmental, resettlement and social risks (including the needs of girls, women
and the disabled and other marginalized groups) as outlined in the OWNP
Environmental and Social Management Plan, the OWNP Fiduciary Mitigation
Plan and the OWNP Programme Operational Manual (POM attached).
The Provider, in consultation with the WaSH Coordination Office and the
National WaSH Inventory Coordination Office, will prepare a four year pan to
fully operationalize the One WaSH M&E system, including full operationalization
of the WaSH MIS. The plan, at a minimum, should have:
i. Sound capacity building and sustainability sub-plan that can be delivered
across various reporting levels in a timely manner, and could be sustained
beyond the life of this assignment;
ii. Procurement plan for the goods and services required for the full
operationalization of the One WaSH M&E system. This includes but may not
be limited to the procurement of mobiles phones and solar chargers for
updating the inventory data and provision of training for the rollout of the MIS
system in the woredas (districts).
iii. Strategy to create synergy and complementarity amongst the MIS systems
of the MoH, MoE and MoWIE. In addition, the plan should clearly define the
roles and responsibilities of different WaSH M&E actors in the four Ministries
(MoFED, MoWIE, MoH and MoE) and their lower (regional and Woreda)
organs;
The Provider will provide technical and managerial support to the WASH
Coordination Office and the National WASH Inventory Coordination Office to
implement the One WaSH M&E/four year plan at all levels. In particular, the
Provider will support:
i. The rolling out of the WaSH Management Information System (MIS) to all
Woredas. This includes updating the MIS system of the respective Woredas,
providing training on data capturing using mobile phones and conducting
data analysis.
ii. Updating of the existing (2011) National WaSH Inventory;
4
iii. Development and implementation of a strategy for timely renewal of the
National WaSH Inventory; and,
The Provider will liaise with other partners (i.e., AfDB, the Water Supply
Programme Africa of the World Bank , the World Bank and UNICEF) who are
supporting the One WaSH M&E system to increase the quality, usability and
sustainability of the One WaSH M&E system, and to avoid duplication.
3.1.2. Enhancement of the quality of data generated by the WaSH M&E
system:
The Provider will provide technical and managerial support to verify/quality
assure the data generated through the One WaSH M&E system. This will include
triangulating the reported data with other sources such as reports from Regional
Health Bureaus (RHB), MOWIE, MOH, MOE, Demographic Health Surveys,
UNICEF/WHO Joint Monitoring Reports and others. Make recommendations and
assist in implementing measures to improve data quality.
3.1.3. Compilation, analysis, reviews and reporting:
The Provider will assist the WaSH Coordination Office and the National WaSH
Inventory Coordination Office with timely compilation, analysis and periodic
(quarterly, half yearly and annual) reporting of high quality strategic
programmatic (technical and financial) WaSH data. The WaSH quarterly, half
yearly and annual progress reports should be disaggregated by gender (women
and girls), age (young and elderly), disadvantaged groups (disabled, pastoralists,
urban slum dwellers and rural poor) and location (rural, urban, Woredas and
regions as recommended in the enhanced social assessment report. These
reports should also contain a value-for-money analysis to help identify the main
cost drivers of the programme; and,
The Provider, in collaboration with the government and development partners,
will carry out annual reviews (ARs) and end of project/project completion reviews
(PCR) as per the scope/guidelines developed by the government and WaSH
partners.
3.2. Task-2: Impact Evaluation
3.2.1. Primary objective of the impact evaluation is to determine the
efficiency, effectiveness and sustainability of the OWNP. The evaluation
at a minimum should able to measure:
5
i. The intended as well as unintended outcomes and impacts of the OWNP by
region and population groups;
ii. Measure the relative contributions of major OWNP interventions/components
to the overall change in the WaSH status in Ethiopia between 2014/15 and
2017/18;
iii. Results/WaSH related outcomes and impacts attributed to DFIDE’s support
iv. Cost-effectiveness of the OWNP and DFID’s support to the OWNP. To
achieve these objectives, the Provider is expected to carry out the following
tasks.
The Provider will assist the WaSH Coordination Office to develop an Impact
Evaluation Framework including development/refinement of the One WaSH
theory-of-change.
The Provider, in consultation with the WaSH Coordination Office, will undertake
an ‘evaluability assessment’ of the OWNP. The ‘evaluability assessment’ should
at a minimum be able to answer whether it would be possible to:
i. Measure the intended as well as unintended outcomes and impacts of the
OWNP.
ii. Measure the relative contributions of major programme
interventions/components to the overall change in the WaSH status;
iii. Assess the cost drivers and the value for money of the OWNP (overall and by
component), and test the validity of the assumptions about costs and benefits
at the initiation of the programme.
iv. Calculate how much of the overall change in the WaSH status between
2014/15 and 2017/18 could be attributed to the OWNP, and of which how
much could be attributable to DFIDE’s support.
v. Measure the impact of the OWNP on equity, empowerment, accountability
and transparency, particularly for underserved populations.
vi. Assess the sustainability of the OWNP.
vii. Differentiate between the theory failure and implementation failure.
The Provider on the basis of the ‘evaluability assessment’ will identify a robust
evaluation design to determine the efficiency and effectiveness of the OWNP in
delivering its objectives.
The Provider will identify the potential risks and challenges for implementing the
proposed/suggested evaluation design and prepare and implement a risk
mitigation plan.
6
The Provider, in consultation with the WaSH Coordination Office, will develop an
Impact Evaluation Plan with clear sequential steps and deliverables and clear
timeline.
The Provider will carry out an independent Impact Evaluation including
establishment of a reliable and valid baseline, mid-term and end-term data.
The mid-term evaluation will be used to review the OWNP design, planning,
implementation processes to maximize its impact during the remaining period of
the programme. The end-line evaluation will inform what has been achieved
through OWNP and through DFID support to the programme. It will also be used
to guide next phase of the OWNP. In addition, at least two lessons learnt
reports/policy briefs will be produced (one after the mid-term review and the
other after the end-line evaluation) by the Provider to enhance evidence-based
decision making and global knowledge on how to implement multi-sectoral
WaSH programme.
The evaluation will also address government and development partners need for
accountability around the OWNP and provide evidence about any successor to
this programme.
The service provider is expected to carry out the proposed impact evaluation in
line with the OECD-DAC evaluation criteria, and with DFID’s policy on evaluation
(annexed). The final evaluation questions will be agreed during the inception
phase of this assignment. Illustrative evaluation questions categorized according
to the OECD-DAC evaluation criteria are:
i. Relevance:
To what extent the OWNP implementation framework/design appropriate
for attaining the OWNP goals as per the OWNP’s theory-of-change and
that of the National Development plan the Growth Transformation Plan?
How the OWNP complementing other on-going government and
development partner programmes that directly and/or indirectly contribute
to WaSH objectives?
ii. Effectiveness:
How robust is the programme design in ensuring the transformation of
inputs into outputs, and outputs into outcomes to ensure effectiveness of
the programme?
What is the progress towards achieving the overall program objective and
in reducing the social and regional inequalities?
7
To what extent the programme has enhanced accountability of the service
provider to communities particularly to underserved communities and
groups such as women, girls and disabled people?
iii. Efficiency:
Which programme components/interventions are showing the most
positive impact How can the programme build on or expand these
successes?
How is value for money considered in the overall governance of the
programme?
Does the quantity of and quality of the results justify the quantity and
quality of the means used for achieving them? How cost-effective have
the means been converted into results? Could the same results be
achieved more cost effectively?
iv. Impact:
Has there been any change in the coverage and use of WaSH services
particularly in underserved areas, communities and socially excluded
groups? How does this vary across regions? To what extent can this be
attributed to the programme?
What impact the project had in terms of:
a) Reducing water related diseases and improving health status of
people, particularly underserved people.
b) Improving the nutritional status of poor and vulnerable including
women, girls and disabled.
c) Decreasing the time spent to collect water
d) Ensuring sustainability of schemes constructed and services
provided
What is the extent of the relative contribution of major programme
interventions to the overall change in the WaSH status in the country?
What is the impact of the OWNP on empowerment, accountability and
transparency, particularly for underserved populations?
v. Sustainability:
What is likely to happen to the positive effects of the programme after the
external assistance ends?
8
Was this external technical and managerial technical support able to build
the capacity of the National WaSH Coordination office to refine and
implement the One WaSH M&E beyond the life of this assignment?
Are interventions supported through the OWNP, well integrated with local
institutions, social and cultural conditions?
On the basis of the ‘Evaluability Assessment’, the final evaluation questions,
framework, design methodology and plan will be agreed in consultation with GOE,
DFID, AfDB and others.
3.3. Task-3: Dissemination and use of M&E reports
The primary target audience for the WaSH monitoring findings/reports will be
MOFED, MOWIE, MOH, MOE, regional bureaus, CWA contributing partners and
other OWNP partners. And the primary target audience for the evaluation
findings/reports will be international WaSH funders in addition to the target
audience of the monitoring findings/reports. However, the target audience will be
clearly defined by the Provider during the inception phase to maximize evidence-
based decision making.
The service provider will develop dissemination strategies for the monitoring as
well as for the evaluation findings/products. These strategies will outline the most
effective ways of influencing identified target audience at different level.
The M&E findings will speak directly to beneficiaries, policy makers, policy
influencers, national stakeholders’ and the global community. It will provide
insights into how to plan and implement integrated WaSH programming in low-
resource settings. Therefore, the Provider will assist the National WaSH
Coordination Office to develop M&E dissemination and use strategies to:
i. Scientifically document and disseminate best practices and lessons learnt
for the benefit of the WaSH sector in Ethiopia as well as for enhancing the
global knowledge. (If need be, the Provider could suggest and carry out
Operational Research to validate best practices/lessons learnt.)
ii. Enhance evidenced-based decision making to maximize the impact of the
OWNP.
9
4. Methodology
This assignment will have a six months inception phase. During the inception phase,
the Provider will carry out the following activities:
4.1. Review and synthesize the governance structure of the WaSH M&E and
prepare a WaSH M&E capacity development plan:
Review of the existing OWNP M&E system both its internal makeup in the
National WaSH coordination office at federal, regional and Woreda level and
their linkages to the M&E systems of the implementing agencies MOWIE, MOH,
MOE and MOFED from the perspective of managing and implementing
effective M&E system;
Take stock of the work done so far by others on WaSH related M&E to ensure
complementarity and avoid duplication of efforts; and,
Assess the readiness and capacity of the National, Regional and Woreda level
WASH coordination offices and the WASH sector to implement the OWNP M&E
system at various levels; and assist to prepare capacity development plan and
facilitate its implementation.
4.2. Review and assess the periodicity, quantity and quality of data available on
WaSH in Ethiopia:
Review and compile the WaSH related data in Ethiopia from existing data
sources including the Ethiopia Demographic Health Survey 2011, the mini DHS
2014, the Ethiopian Service Provision Assessment 2014, data from health,
education and WaSH MIS and other data sources; and,
Review the periodicity, validity and reliability of existing WaSH data in the
context of the WaSH M&E framework/OWNP, and suggest data/information
gaps that need to be filled to be able to measure performance of the OWNP
including performance around fiduciary, environmental, resettlement and social
risks management.
4.3. Develop a WaSH M&E system enhancement plan:
Review and asses the piloted WASH Management Information system and the
national WaSH Inventory to identify and advice on additional data requirement
and possible areas of improvement;

10
Propose the M&E system enhancement plan that captures the intervention
packages required to refine and strengthen the system in the programme
period. In doing so, ensure appropriate coordination and complementarity with
other supports geared towards supporting the enhancement of the M&E system
(support from PBS programme , AFDB, World Bank and Water Supply
programme Africa); and,
Conduct consultation workshop to review and finalize the suggested system
enhancement plan in coordination with the WASH coordination office and other
key stakeholders.
4.4. Review and refine the OWNP theory-of-change and logframe:
Review evidence around the theory-of-change of the OWNP and suggest
revision to the theory-of-change; and,
Review log-frame/results framework and (if need be) suggest refinement to
objectively measure progress. The One WASH National Programme log-
frame/results framework should be robust enough to be able to ascertain
progress on planning, (technical and financial) management, value-for-money
(VfM) and equity;
4.5. Carry out an ‘Evaluability assessment’ of the OWNP to measure the impact,
efficiency, effectiveness and sustainability of the OWNP.
develop a WaSH evaluation framework;
develop a robust evaluation design with appropriate evaluation methodologies.
The design document should have clear logical explanations for the types of
methods (quantitative and/or qualitative), analytical frameworks and sources of
data (primary and/or secondary) to be used to carry out the WaSH evaluation;
develop a risk mitigation plan for carrying out the WaSH evaluation; and,
prepare a plan to implement the proposed WaSH evaluation design and the risk-
mitigation plan.
4.6. Develop data dissemination and use strategies
Carry out a quick stakeholders mapping to prioritize target audience for the
monitoring as well as evaluation findings/products to increase evidence
based decision making and transparency in the sector; and,
11
Support the Coordination office in developing effective data dissemination
and use strategies for the: (a) monitoring; and, (b) evaluation products.
4.7. During the post-inception phase, the Provider will:
Provide technical and managerial support to the national WaSH coordination
office to:
o fully operationalize the OWNP M&E system, as per the M&E
enhancement plan prepared in the inception period, by the end of
2015;
o support timely generation of valid and reliable WaSH data and
information at all levels and production of high quality periodic WaSH
progress reports (inputs from Provider to continue during the entire
duration of the programme with a sliding scale);
o facilitate and support strengthening the WaSH Coordination Office
and its cascaded organs, as per the WaSH M&E capacity
development plan done in the inception phase, by the end of 2015;
o support the WASH Coordination office in conducting the periodic and
timely updating the National WASH Inventory done in 2011 as per the
revised indicators and establish baseline for the new ones by the end
of 2015;
o carry out an independent mid-term review in 2016/17 and impact
evaluation in 2018/19; and,
o provide technical and managerial support to the national WaSH
coordination office to disseminate and improve use of the M&E
findings (inputs to continue during the entire duration of the
programme).
.
The service provider is expected to publish in full the evaluation report as per
the DFID’s evaluation policy. Also, data sets pertaining to this evaluation will be
made available to other researchers for analysis, with due consideration given
for the privacy of respondents.

12
5. Staffing Skills & Expertise
5.1. The service provider is expected to engage a high quality team of experts with
skills and expertise in a range of disciplines. The team is expected to be gender
balanced. The team should ideally include a mix of full and part time country
based experts and call down international experts. Ethiopian team members will
be essential for this assignment. Numbers of staff required will be
determined/proposed by the Provider. Consortiums of different organisations to
provide the full range of expertise and experience needed for this assignment,
particularly to carry out an independent impact evaluation, will be acceptable.
5.2. DFID would expect the Provider to demonstrate a high level of experience and
expertise in the following areas:
Able to put together a relevant multi-disciplinary team with expertise in WaSH,
health, social development, M&E, capacity building, information management,
research and evaluation methodologies, and data dissemination and use
(essential);
Demonstrated experience to manage and work as a team and to work with and
through governments and other partner organizations (essential);
Extensive experience in developing theory-of-change, logical frames, and M&E
frameworks for WaSH programmes (essential);
Demonstrated experience in establishing and operationalizing multi-sectoral
M&E System, particularly for WaSH or related sectors (essential);
Expertise in data collection and statistical calculations of WaSH indicators
(essential);
Expertise in calculating and tracking value for money and cost drivers in WASH
or similar programmes (essential);
Extensive experience of designing and implementing data/results verification
and performance audits of programmes implemented by governments (essential)
especially in difficult or fragile environments (desirable);
Adequate experience in designing and providing capacity building supports for
M&E and information management preferably for WASH sector (essential);
Demonstrated experience in developing data dissemination and use plan
(essential) including experience in collating best practice and disseminating
lessons learnt (desirable);
Proven experience in designing and conducting Impact Evaluation of
programmes preferably for WASH programmes (essential);
Proven capacity to work effectively with government alongside other agencies,
maximising efficiencies and avoiding duplication of effort (essential);
Excellent written and verbal communication skills (essential);
Previous knowledge and working experience in Ethiopia and/or other similar
settings (desirable).

13
6. Duty of Care
6.1. The Provider is responsible for the safety and well-being of their personnel and
Third Parties affected by their activities under this contract, including appropriate
security arrangements. They will also be responsible for the provision of suitable
security arrangements for their domestic and business property. All duty of care,
transport, translation and logistical support, office space, and insurances will be
the responsibility of the Provider.
6.2. DFID will share available information with the Provider on security status and
developments in-country where appropriate.
6.3. All Provider personnel will be offered a security briefing by the British
Embassy/DFID on arrival. All such Personnel must register with their respective
Embassies to ensure that they are included in emergency procedures. A copy of
the DFID visitor notes (and a further copy each time these are updated), which
the provider may use to brief their personnel on arrival.
6.4. The Provider is responsible for ensuring appropriate safety and security
briefings for all of their personnel working under this contract and ensuring that
their personnel register and receive briefing as outlined above. Travel advice is
also available on the FCO website and the evaluation supplier must ensure they
(and their Personnel) are up to date with the latest position.
6.5. The Provider is responsible for ensuring that appropriate arrangements,
processes and procedures are in place for their personnel, taking into account
the environment they will be working in and the level of risk involved in delivery
of the Contract (such as working in dangerous, fragile and hostile environments
etc.).
6.6. If bidders are unwilling or unable to accept responsibility for Security and Duty
of Care as detailed above, bids will be viewed as non-compliant and excluded
from further evaluation.
6.7. Acceptance of responsibility must be supported with evidence of capability and
DFID reserves the right to clarify any aspect of this evidence. In providing
evidence Tenderers should consider the following questions:
i. Have you completed an initial assessment of potential risks that
demonstrates your knowledge and understanding, and are you satisfied that
you understand the risk management implications (not solely relying on
information provided by DFID)?
14
ii. Have you prepared an outline plan that you consider appropriate to manage
these risks at this stage (or will you do so if you are awarded the contract)
and are you confident/comfortable that you can implement this effectively?
iii. Have you ensured or will you ensure that your staff are appropriately trained
(including specialist training where required) before they are deployed and
will you ensure that on-going training is provided where necessary?
iv. Have you an appropriate mechanism in place to monitor risk on a live / on-
going basis (or will you put one in place if you are awarded the contract)?
v. Have you ensured or will you ensure that your staff are provided with and
have access to suitable equipment and will you ensure that this is reviewed
and provided on an on-going basis?
vi. Have you appropriate systems in place to manage an emergency / incident if
one arises?
15
7. Logistics and Procedures
7.1. The technical and managerial assistance team/personnel of the service provider
will be placed in the WaSH Coordination office, housed in the Ministry of Water
Irrigation and Energy. The service provider will be expected to supply their own
logistic requirements including undertaking minor alteration/renovation of the
office space, purchasing of office equipment, supplies (if required), and
managing their transportation.
7.2. The service provider is not only expected to work closely with the national
WaSH coordination office to fully operationalize the OWNP M&E system but is
also expected to carry out an independent impact evaluation. Therefore bidders
of this ToR should comment on how independence in carrying out the impact
evaluation will be maintained from the programme implementing entities.
8. Roles and Responsibilities, Governance, Reporting and Contracting
8.1. The roles and responsibilities of the Provider are outlined on section 3 and 4 of
this ToR.
8.2. The Provider will report to the head of WaSH Coordination Office at MOWIE
and DFIDE Human Development Team’s WaSH adviser and deputy programme
manager. While the WaSH Coordination Office will lead on technical and
programmatic areas in consultation with DFID and other partners, DFID will lead
on contractual issues in consultation with the WaSH Coordination Office and
other partners
8.3. At key points of this assignment, the WaSH Coordination Office and DFIDE’s
Human Development Team will call upon the expertise of other federal, regional
and Woreda level bodies and DFIDE’s results, economic and governance
advisors to quality assure the deliverables of the Provider.
8.4. The service provider will engage with The National WASH Inventory office and
the MoH, MOE and MoFED and regional and Woreda level bodies/partners as
appropriate.
8.5. The Provider will submit quarterly progress report to the head of WASH
coordination office and DFID Ethiopia. The content of the report will be agreed
during the inception phase.
8.6. The performance of the team will be jointly assessed by the head of WASH
coordination office, DFID WaSH adviser, DFID project/programme officer and

16
representatives from key stakeholders on a quarterly basis. The WaSH
coordination office and DFIDE will make the final decision on extra activities to
be conducted by either service provider.
8.7. The Providers bidding for this contract should describe how they will nurture
good working relationships whilst at the same time maintaining independence
and impartiality with the One WaSH implementing partners.
8.8. Contracting: DFID Ethiopia will issue the contract for the entire duration of the
programme after the review of the bid documents. DFID and representatives of
the host county counterparts will assess the full bids submitted under this
tender. Implementation will proceed after the Provider provides an inception
report that is to the satisfaction of DFID and the MOWIE. DFID reserves the
right to re-tender for the contract if the inception report does not explicitly and
satisfactorily meet the conditions set forth.
8.9. Deliverables of the Provider will be reviewed and quality assured by the DFID
and MOWIE. DFID and MOWIE will make the final decision on the quality and
acceptability of the deliverables.
8.10. DFIDE requires an output-based contract, linking payments to milestones,
with transparency of anticipated inputs. Financial disbursements will be made
according to an agreed schedule on a satisfactory completion of agreed
activities within the review work plan and framework.
8.11. The Provider will grant DFID and MoWIE/GoE a world-wide, non-exclusive,
irrevocable, royalty-free licence to use all materials/products produced under
this ToR. This may include without limitation, the reproduction, publication and
sub-licence of all materials/products produced under this ToR. The Provider will
also make available to DFID and MoWIE/GoE all primary and secondary
data/information/raw data collected as a part of this ToR, with due consideration
given for the privacy of respondents.
17
9. Key Performance Indicators (KPI’s) for the Provider
9.1. The performance of the Provider will be monitored with the government
counterparts through the joint quarterly meetings and annual reviews. To
incentivize good performance, payments will be made on meeting specific Key
Performance Indicators (KPIs). KPIs will be finalized during the post-tender
contract negotiations but may include:
Quality-related and performance-related targets for service delivery: Quality of
reports/deliverables as per DFID’s standards and requirements. (Measured by
the feedback received from both internal and external quality assurers).
Compliance to regulations and standards: Number of outputs/deliverables that
are error free and in line with DFID’s standards and requirements. (Measured by
the feedback received from both internal and external quality assurers).
Financial management and VfM: Sum of deviation of expenditure against agreed
budget for this assignment. (This will be measure by the level of
accuracy/deviation of monthly/quarterly forecast received from the M&E
provider).
Time: Sum of deviation of planned activities against the agreed work plan. (This
will be measured by the proportion of undertaken activities against planned
activities for the reporting period).
Interaction between stakeholders and service providers: The Provider’s ability to
carry out quality consultation and interactions with the One WaSH stakeholders,
and to offer effective advice. (This can be measured through feedback collected
from stakeholders on the performance of the M&E provider.)
9.2. The KPIs for the M&E provider will be reviewed after the inception phase and
consequently during the lifetime of the contract as needed. All new KPIs will be
agreed by the DFID Ethiopia, MOWIE and the M&E provider prior to
incorporation into contracts.
9.3. DFID will consult with the MOWIE and relevant federal, regional and Woreda
level bodies to assess whether KPIs have been met before payment is made.
Invoice payments will only be made on the satisfactory approval of the
programme manager and the budget holder using Aries to provide an audit trail
of the process. (withholding a % of payment if KPIs are not delivered on time)
will be articulated in the contract between DFID and the Provider.
18
10. Deliverables
10.1. Key deliverables expected from the bidder/Provider will include:
An inception report within four months: The inception report to include:
i. An enhanced OWNP M&E framework
ii. A work plan to fully operationalize the OWNP M&E MIS system / a capacity
building plan with objectively verifiable milestones for the full programme period
iii. An agreed approach to periodically quality assure the data generated by the
OWNP M&E system
iv. A refined theory-of-change and log-frame with additional indicators as indicated
in the scope of work (i.e., section 3 of this TOR)
v. An ‘evaluability assessment’ report, and evaluation design and a plan to carry
out an independent impact evaluation (IE) with objectively verifiable milestones
(such as baseline, mid-term and end-line reports). The IE plan could include a
study design, sampling frame, power calculations, draft tools, proposed
analytical pieces and their strengths and limitations
vi. A data dissemination and use strategy with objectively verifiable milestones
vii. An exit plan/ a plan to sustain the benefits of this technical and managerial
support beyond the life of this project with objectively verifiable milestones.
10.2. Post-inception phase the key deliverables will include, but not limited to:
Preparation and submission of quarterly financial and programmatic progress
reports to the head of the WaSH coordination office and to DFID Ethiopia. These
reports should clearly state progress against the milestones and timeline agreed
during the inception phase;
Biannual and Annual financial and programmatic progress reports;
Final scope of work of the evaluation will be determined on the basis of the
evaluative assessment, and accordingly the baseline, mid-term and end-term
evaluations will be carried out and reports will be produced with clear
recommendations for the future improvement of the programme; and,
Production and dissemination of the M&E findings and best practices/findings
from the evidence reviews.
Deliverables for the post-inception phase will be finalized during the inception
phase.
Table 1 below is a guide of the WaSH M&E programme deliverables.
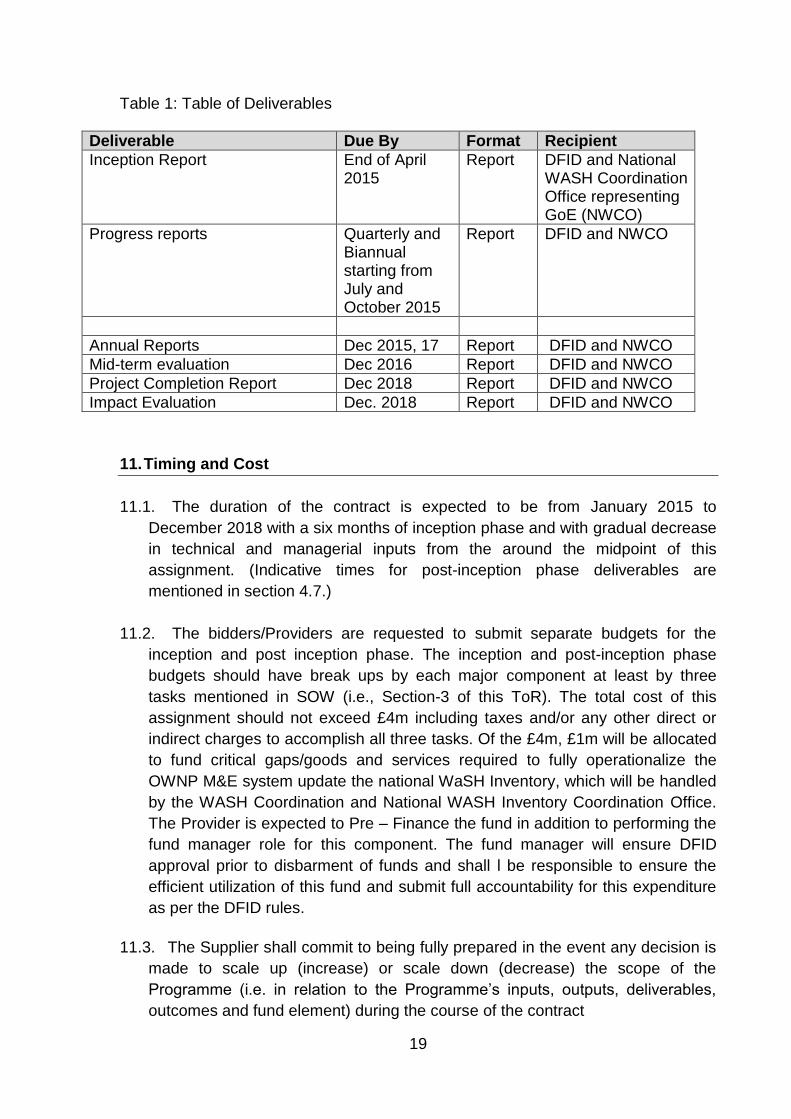
19
Table 1: Table of Deliverables
Deliverable Due By Format Recipient
Inception Report End of April 2015
Report DFID and National WASH Coordination Office representing GoE (NWCO)
Progress reports Quarterly and Biannual starting from July and October 2015
Report DFID and NWCO
Annual Reports Dec 2015, 17 Report DFID and NWCO
Mid-term evaluation Dec 2016 Report DFID and NWCO
Project Completion Report Dec 2018 Report DFID and NWCO
Impact Evaluation Dec. 2018 Report DFID and NWCO
11. Timing and Cost
11.1. The duration of the contract is expected to be from January 2015 to
December 2018 with a six months of inception phase and with gradual decrease
in technical and managerial inputs from the around the midpoint of this
assignment. (Indicative times for post-inception phase deliverables are
mentioned in section 4.7.)
11.2. The bidders/Providers are requested to submit separate budgets for the
inception and post inception phase. The inception and post-inception phase
budgets should have break ups by each major component at least by three
tasks mentioned in SOW (i.e., Section-3 of this ToR). The total cost of this
assignment should not exceed £4m including taxes and/or any other direct or
indirect charges to accomplish all three tasks. Of the £4m, £1m will be allocated
to fund critical gaps/goods and services required to fully operationalize the
OWNP M&E system update the national WaSH Inventory, which will be handled
by the WASH Coordination and National WASH Inventory Coordination Office.
The Provider is expected to Pre – Finance the fund in addition to performing the
fund manager role for this component. The fund manager will ensure DFID
approval prior to disbarment of funds and shall l be responsible to ensure the
efficient utilization of this fund and submit full accountability for this expenditure
as per the DFID rules.
11.3. The Supplier shall commit to being fully prepared in the event any decision is
made to scale up (increase) or scale down (decrease) the scope of the
Programme (i.e. in relation to the Programme’s inputs, outputs, deliverables,
outcomes and fund element) during the course of the contract
20
12. Background and Rationale
12.1. Ethiopia, home to over 90 million people, has not only registered an
impressive annual economic growth of around 11% over the past decade but
also has effectively leveraged the gains from economic growth to make progress
towards the Millennium Development Goals (MDGs), in particular toward
poverty reduction, education and health MDGs. However, the progress towards
MDG-7 pertaining to WaSH has been mixed. Although proportion of people with
access to improved water has increased from 14% in 1990 to 52% in 2011 as
per the National WASH Inventory data, there are large differences between
regions, and between rural and urban areas. Proportion of people with access to
improved sanitation, which has increased from 2% in 1990 to 21% in 2011, is
off-track to meet the MDG target. To accelerate progress towards WaSH MDGs,
the Government of Ethiopia (GOE) has prioritized WaSH in their national Growth
and Transformation Plan (GTP), and has developed a multi-sectoral WaSH
Implementation Framework (WIF), a WaSH Monitoring and Evaluation (M&E)
Framework and a One WaSH National Programme (OWNP). DFID is planning
to invest £106 million over four years on the OWNP.
12.2. DFID support to OWNP is in line with DFID Ethiopia’s Operational plan
(Attachment#1) that sets out its vision to: (i) protect the most vulnerable by
building the resilience of the very poorest, reducing food insecurity, and,
improving livelihoods and security in fragile and/or conflict-affected areas; (ii)
consolidate recent gains and help achieve the MDGs by continuing to support,
extend and improve proven programmes to expand access to quality basic
services; and (iii) make the impact of the UK’s support more transformational.
Based on DFID’s analysis of need in the WaSH sector, the objectives for DFID’s
support for WaSH (as well as for health and education sector) in Ethiopia are:
(a) Increasing access to and quality of services; (b) Increasing and measuring
results and impact, and, (c) Increasing equity. The potential pathways (theory-
of-change) through which these objectives will be achieved in the WaSH sector
is described in the ‘DFID Business Case for supporting the One WaSH National
Program’ (Attachment#2). Other DFID supported on-going and recently
concluded programmes which complement the OWNP are presented in Table-1.
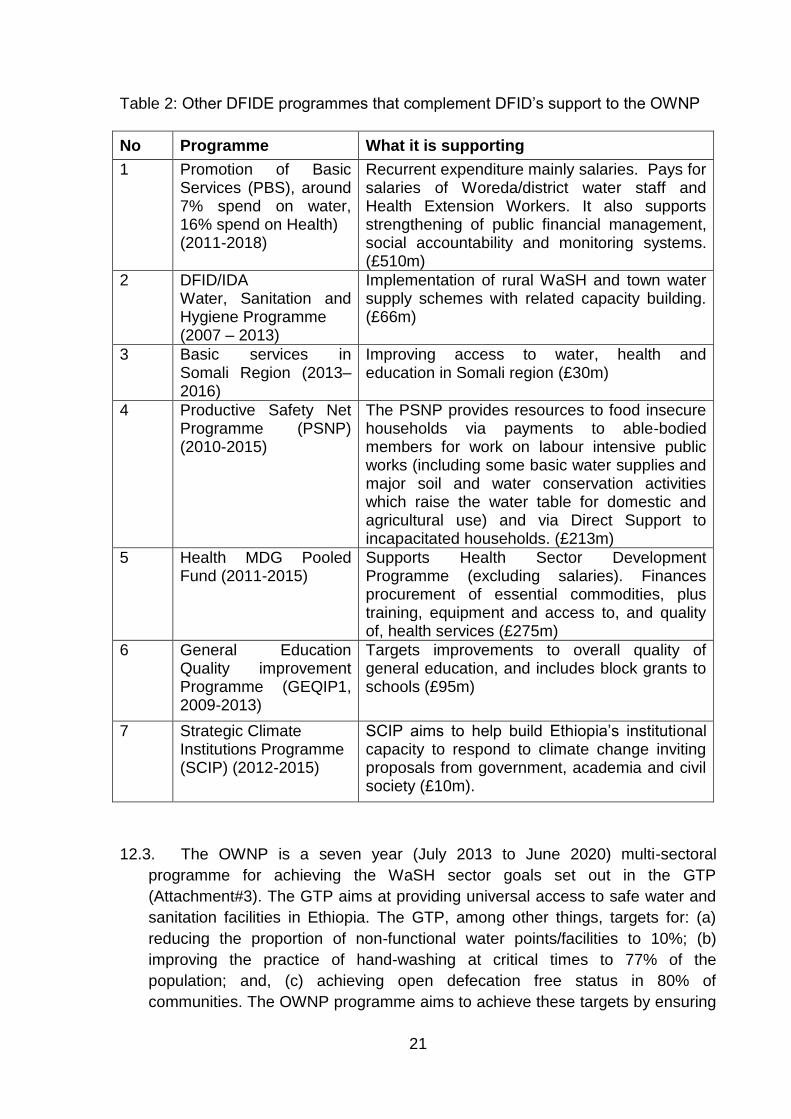
21
Table 2: Other DFIDE programmes that complement DFID’s support to the OWNP
No Programme What it is supporting
1 Promotion of Basic Services (PBS), around 7% spend on water, 16% spend on Health) (2011-2018)
Recurrent expenditure mainly salaries. Pays for salaries of Woreda/district water staff and Health Extension Workers. It also supports strengthening of public financial management, social accountability and monitoring systems. (£510m)
2 DFID/IDA Water, Sanitation and Hygiene Programme (2007 – 2013)
Implementation of rural WaSH and town water supply schemes with related capacity building. (£66m)
3 Basic services in Somali Region (2013– 2016)
Improving access to water, health and education in Somali region (£30m)
4 Productive Safety Net Programme (PSNP) (2010-2015)
The PSNP provides resources to food insecure households via payments to able-bodied members for work on labour intensive public works (including some basic water supplies and major soil and water conservation activities which raise the water table for domestic and agricultural use) and via Direct Support to incapacitated households. (£213m)
5 Health MDG Pooled Fund (2011-2015)
Supports Health Sector Development Programme (excluding salaries). Finances procurement of essential commodities, plus training, equipment and access to, and quality of, health services (£275m)
6 General Education Quality improvement Programme (GEQIP1, 2009-2013)
Targets improvements to overall quality of general education, and includes block grants to schools (£95m)
7 Strategic Climate Institutions Programme (SCIP) (2012-2015)
SCIP aims to help build Ethiopia’s institutional capacity to respond to climate change inviting proposals from government, academia and civil society (£10m).
12.3. The OWNP is a seven year (July 2013 to June 2020) multi-sectoral
programme for achieving the WaSH sector goals set out in the GTP
(Attachment#3). The GTP aims at providing universal access to safe water and
sanitation facilities in Ethiopia. The GTP, among other things, targets for: (a)
reducing the proportion of non-functional water points/facilities to 10%; (b)
improving the practice of hand-washing at critical times to 77% of the
population; and, (c) achieving open defecation free status in 80% of
communities. The OWNP programme aims to achieve these targets by ensuring
22
equity and sustainability. The OWNP is formulated as per the provision of the
WASH Implementation Framework (WIF), which calls for One Plan, One Budget
and One Reprot (Attachment#4). The WIF was officially endorsed and signed by
the WaSH Ministries namely, Ministry of Finance and Economic Development
(MOFED), Ministry of Water, Irrigation and Energy (MOWIE), Ministry of Health
(MOH) and Ministry of Education (MOE) in 2013 to guide the implementation of
the programme. The WIF clearly defines major areas of cooperation between
the four ministries such as joint planning, resource mobilization, implementation;
creation of management and coordination structure and quality assurance, and
the OWNP programme document clearly spells out how the WIF will be
operationalized to maximize efficiency and impacts (Attachment-5). The OWNP
(2013-2020) has four main components:
Component-1 focuses on rural and pastoral WaSH and intends to construct
over 55,000 new water points/water supply schemes, over 42,000 dug-wells
and rehabilitate over 20, 000 existing water schemes. It also aims at
improving access to improved latrines and hygiene services;
Component-2 focus on urban WaSH to augment and expand the urban water
supply schemes, sanitation practices, and management of wastewater and
public toilets in all urban areas;
Component-3 focuses on institutional WaSH for improving water supply and
sanitation facilities and hygiene practices at all health institutions and
schools; and,
Component-4 focuses on programme management and capacity building of
institutions and implementing partners at all level through training, post-
construction management support, equipment, tools and support to
monitoring and reporting.
12.4. A well-functioning M&E system is a critical part of good programme
management. It is also an essential tool for maximizing impact, attaining value-
for-money and ensuring accountability. Timely and reliable M&E provides
information to improve programme implementation, organizational learning and
knowledge sharing, and to reduce fiduciary risks. There is a clear commitment
from the GOE to strengthen the national WaSH M&E systems to ensure
generation of valid and reliable information on the WaSH status in Ethiopia, in a
timely and transparent way, within the framework of the OWNP .
12.5. To encourage timely collection, aggregation, storage, sharing and analysis
of WaSH data, the MOWIE, in consultation with MOH, MOE, development
partners and others, has developed a WaSH M&E framework and manual
(Attachment#6). The WaSH M&E framework and manual have been designed to
carry out sector-wide, joint monitoring, review and evaluation. The WaSH M&E
framework and manual include:

23
i. Analytical narratives for 15 key WASH performance indicators.
ii. A roadmap to develop and implement an integrated web-based Management
Information System (WaSH MIS).
iii. A roadmap to prepare and maintain an up-to-date national WaSH inventory.
iv. Guidelines for the preparation of sector-wide periodic progress reports.
v. Commitment and guidelines for conduction of annual WaSH census in all
schools and health facilities.
As per the WaSH M&E framework and manual, the following two key activities have
been initiated:
A web-based Management Information System (WaSH MIS) is being
currently implemented in 52 Woredas (Districts) and the government is
planning to scale it up to 300 more Woredas by 2014 and to all 900 Woredas
in Ethiopia by 2015; and,
The government has also established a National WASH Inventory
Coordination office in the MOWIE and has prepared a National WaSH
Inventory (NWI) to guide the planning and decision making processes.
In order to support the scale up of these efforts and assist GoE to fully
operationalize the WASH M&E MIS system, DFID Ethiopia (DFIDE), through this
ToR, is looking for a service provider (the “Provider”) to provide technical and
managerial support to the National WaSH Coordination Office (NWCO) to refine and
fully operationalize the WaSH M&E system/framework. The refined WaSH M&E
system will enable the sector to provide reliable data on a timely basis on: (a)
access to clean water, sanitation and hygiene services disaggregated by gender
(women and girls), disadvantaged groups (disabled, pastoralists, urban slum
dwellers and rural poor) and location (rural, urban, Woredas, and regions); (b)
resource allocation and utilization; and, (c) adherence to financial and programmatic
implementation guidelines/frameworks, safeguards and risk mitigation measures.
These guidelines/frameworks include: the OWNP Operational Manual (POM)
(Attachment#7); the OWNP Environmental and Social Management Framework
(ESMF) (Attcahment#8); the OWNP Resettlement Policy Framework
(Attachment#9) and the recommendations of the OWNP (enhanced) Social
Assessment (Attcahment#10). The Provider is also expected to undertake a robust
evaluation, in collaboration with the MOFED, MOWIE, MOH, MOE and others, to
assess the impact of the OWNP in ensuring equity and sustainability.
12.6. The Provider is expected to work closely with the MOWIE, MOH, MOE and
MOFED and their regional and Woreda level organs, as well as with the
development partners supporting the OWNP.
12.7. In addition to DFID, the World Bank, African Development Bank, and
UNICEF have committed to support the OWNP but are at different stages of

24
preparedness to contribute to the government’s Consolidated WaSH Account
(CWA). The Government of Finland and the Government of Italy are considering
supporting the CWA, but have not yet made firm commitments. In order to
coordinate the planning, implementation and reporting of the OWNP the GOE
has established a National WaSH Coordination Office as per the Memorandum
of Understanding signed between the four Ministries.
12.8. Similar to DFID, the Water Supply Programme Africa of the World Bank, the
African Development Bank (AfBD) and UNICEF have earmarked resources to
support the WaSH M&E. While support from the AfDB is likely to focus on
strengthening the WaSH M&E infrastructure, the DFID and World Bank support
are likely to focus on providing technical and managerial support for rolling out
the WaSH MIS, updating the National WaSH Inventory on an annual basis,
monitoring of the 15 key WaSH indicators, mainstreaming gender in the WaSH
planning and delivery processes. Support from other development partners
(DPS) are also being designed to complement each other.
12.9. To facilitate complementarity and collaboration, recently the GOE, through
the National WASH Coordination Office has requested DFID and AfDB to co-
lead on the process of refinement, operationalization of WaSH M&E and also to
coordinate DPs engagement in supporting the sector M&E as per the provision
of the OWNP Programme Operational Manual ( POM) .
12. Appendices
1. DFID Ethiopia Operational Plan
2. DFID Business Case for supporting the One WaSH National Program
3. GOE’s Growth and Transformation Plan (GTP)
4. One WaSH Implementation Framework
5. One WaSH National Program Document August 2013
6. One WaSH National M&E Framework and Manual
7. One WaSH National Program Operational Manual (POM)
8. One WaSH National Program Environmental and Social Management
Framework (ESMF)
9. One WaSH National Programme Resettlement Policy Framework
10. One WaSH National Programme Ethiopia Social Assessment
11. DFID log-frame for supporting the One WaSH National Programme