One Share – One Vote - Royal Institute of Technology · One Share – One Vote ... the expected...
31
- 1 - CESIS Electronic Working Paper Series Paper No. 168 One Share – One Vote - new evidence from the Nordic countries Johan E Eklund (*CESIS, JIBS and RATIO Institute) January 2009 The Royal Institute of technology Centre of Excellence for Science and Innovation Studies (CESIS) http://www.cesis.se
-
Upload
nguyentuyen -
Category
Documents
-
view
218 -
download
2
Transcript of One Share – One Vote - Royal Institute of Technology · One Share – One Vote ... the expected...

- 1 -
CESIS Electronic Working Paper Series
Paper No. 168
One Share – One Vote
- new evidence from the Nordic countries
Johan E Eklund
(*CESIS, JIBS and RATIO Institute)
January 2009
The Royal Institute of technology Centre of Excellence for Science and Innovation Studies (CESIS)
http://www.cesis.se
- 2 -
One Share-One Vote: New Evidence from the Nordic Countries
Johan E. Eklund
Ratio Institute and Jönköping International Business School, Jönköping University 103 64 Stockholm
Box 2303 E-mail: [email protected]
Phone: +46-(0)8-4415900 Fax: +46-(0)-4415929
Abstract. This paper examines how ownership concentration affects investment performance, and in particular how deviations from the one share-one vote principle affect this ownership-performance relationship. Using a unique panel from the Nordic countries the so-called incentive and managerial entrenchment effects are isolated. To this end a measure of marginal q is used to evaluate performance. This is a theoretically and empirically more appropriate measure of performance as compared to Tobin’s q. The main finding is that ownership concentration improves performance, whereas dual-class shares reduce the incentive effect and enhance the managerial entrenchment effect. On average, firms with dual-class shares over-invest.
JEL Codes: G 30, C 23, L25 Keywords: investment, marginal q, ownership concentration, one share-one vote Acknowledgments: Financial support from the Ratio institute and Sparbankernas forskningsstiftelse is gratefully acknowledged. This paper was initiated during a six-months visit to George Mason University, and subsequently benefited a great deal from valuable comments and suggestions given by a large number of people. In particular, I’m grateful for comments provided by Robin H. Hansson. Furthermore, I greatly appreciate valuable discussions during workshops and seminars held at Jönköping International Business School. In particular, I thank Åke E. Andersson, Tom Berglund, Per-Olof Bjuggren, Börje Johansson, Agostino Manduchi, Dennis C. Mueller, Ajit Singh, Steen Thomsen and Daniel Wiberg for valuable insights and helpful comments. Naturally, any remaining errors are my own.

- 3 -
1. Introduction
The way in which corporations are governed has received popular attention in recent years
due to a series of corporate scandals, such as for example the so-called “Skandia scandal” in
Sweden, Parmalat in Italy or Enron in the US. These are cases where the management has
misused corporate resources and failed to serve the interests of the owners. However, the
importance of sound corporate governance institutions and practices is more fundamental, and
goes deeper than merely preventing flagrant fraud and managerial deceitfulness. A large body
of literature show that corporate governance has a much more profound effect on the
efficiency of resource allocation.1 A special corporate governance feature that has received
massive attention in Europe is the so-called proportionality principle and the use of control
enhancing mechanisms (CEMs); such as dual-class shares, pyramidal structures and cross
holdings (for a review of the use of CEMs in Europe see European Corporate Governance
Institute (ECGI), 2007). In particular one share-one vote principle has been debated
intensively. A so-called breakthrough rule has for example been suggested to facilitate a more
active market for corporate control in Europe. This sparked an intense political and academic
debate (e.g. Bebchuk and Hart, 2002). The theoretical and empirical research however
remains inconclusive. Some studies find that dual-class shares have a negative impact on firm
value (e.g. Bjuggren et al., 2007, Claessens et al., 2002, and Cronqvist and Nilsson, 2003),
whilst others find the evidence unconvincing. Burkart and Lee (2008) review the theoretical
literature on the one share-one vote and find the theoretical arguments are inconclusive. In a
review of the empirical literature Adams and Ferreira (2008) conclude that also these
1 In essence, the corporate governance system in a country is the institutional framework that supports the suppliers of finance to corporations and enables firms to raise substantial amounts of capital (Shleifer and Vishny, 1997). For a review of the corporate governance literature see, for example, Shleifer and Vishny (1997), Morck et al. (2005), Mueller, (2003) and Denis and McConnell (2003).

- 4 -
evidences are unclear and call for further research. This paper addresses some of the concerns
raised by Adams and Ferreira (2008).
It can be argued that the corporate governance system in a country determines the speed of
structural change and economic development by affecting (re)allocation of capital. Outright
expropriation of corporate assets by managers is likely to be small in developed economies,
such as the Nordic ones. Over-investment in pursuit of ends other than profit maximization
and misallocation of assets is more likely to be a problem. In this respect, ownership
concentration and composition appear to matter for firm performance, as shown by Morck et
al. (1988) and many subsequent studies.2 Moreover, not only do dual-class shares alter the
ability of owners to exert control, they arguably also alter their incentives. Therefore the
crucial question is whether CEMs induce managers to make good value enhancing
investments decisions, or not. This paper examines how ownership concentration affects
investment performance, and in particular examines how deviations from the one share-one
vote principle affect the ownership-performance relationship.
To this end a measure of marginal q is used. This is a methodology developed by Mueller and
Reardon (1993) which measures the return on investments, i, relative the opportunity cost of
capital, r. Marginal q solves many of the empirical and theoretical problems associated with
other measures, in particular endogeneity problems are reduced (Gugler and Yurtoglu, 2003),
which according to Adams and Ferreira (2008) is one short coming of previous studies. In
contrast to the average Tobin’s q, this method measures the marginal return on capital, which
makes it more appropriate when apprising performance. Moreover, measurement problems
2 There is a large literature on ownership and firm performance/value emanating from the work of Morck et al. (1988). See e.g. McConnell and Servaes (1990). For critique see Demsetz and Lehn (1985). This literature goes back to at least Adam Smith (1776), and contemporary research builds on seminal contribution of Berle and Means (1932) and Jensen and Meckling (1976).

- 5 -
associated with market-to-book measures of Tobin’s q (i.e. Badrinath and Lewellen, 1997) are
also significantly reduced3.
The paper is organized in five sections. Relevant literature on investments, corporate
governance and ownership is reviewed in section two. In section three the method is derived
and the data are described. The fourth section examines how ownership and the extensive use
of dual-class shares affect investment behavior. Section five concludes.
2. Corporate control and investment
Neoclassical investment theory suggests that investments are expanded up to the point where
the expected marginal rate of return equals the opportunity cost of capital. This condition
would be satisfied in a friction-free world without any informational asymmetries or
transaction costs. Capital would automatically flow to the most efficient use and thereby
guarantee that welfare is maximized. However, the corporation, with its separation of owners
from management, there arises a set of agency problems that can cause investment decisions
to deviate from what is expected from neoclassical theory.
Berle and Means (1932) were among the first modern observers to call attention to these
potential agency costs.4 They argued that corporate ownership in large listed firms would
become dispersed up to a point where professional managers would become unaccountable to
the shareholders. Later, Jensen and Meckling (1976) provided a more theoretical
3 The problem of obtaining a correct measure of the replacement cost of capital (proxies with the book value) is avoided with marginal q. 4 Agency costs are costs that arise from the principal-agent problem, i.e. divergence of managerial objectives from the objectives of shareholders.

- 6 -
underpinning to the links between agency costs and ownership structure. Jensen and Meckling
analyze how the interests of utility maximizing owner-managers and minority shareholders
diverge as ownership structure becomes more dispersed. Their basic argument is that the
owner-manager will not bear the full cost of on-the-job consumption.5 Potential minority
investors will realize this and subsequently the share price will reflect the divergence of
interests between owner-managers and minority shareholders. Arguably the conflict of
interests becomes more severe as the equity stake of owner-managers decreases. Jensen and
Meckling (1976) argue that investors with high stakes will also have incentives to maximize
firm value. This is referred to as the incentive effect. From this, hypothesis one follows:
H1: Ownership concentration will improve investment performance.
In this view, agency costs increase as ownership is diluted and becomes dispersed. However,
not all have seen the separation of ownership and control as a potential problem, where the
counter-hypothesis is that separation of control and ownership improve capital allocation.
Thorstein Veblen (1921), for example, argue that this separation would lead to the control
being turned over from “monopoly” seeking owners/businessmen to growth and efficiency
seeking management6.
5 Jensen and Meckling (1976) point out that the most serious problem of not having equity claims is probably that the incentive to seek new profitable investment opportunities and engage in innovative efforts will fall. These problems were observed already by Adam Smith who noted that: “The directors of such companies, however, being the managers rather of other people’s money than of their own, cannot well be expected, that they should watch over it with the same anxious vigilance with which the partners of a private copartnery frequently watch over their own.” (Adam Smith, 1776). 6 Veblen claims that if “(…) industry were completely organized as a systemic whole, and were then managed by competent technicians with an eye single to maximum production of goods and services; instead of, as now, being manhandled by ignorant business men with an eye single to maximum profits; the resulting output of goods and services would doubtless exceed the current output by several hundred per cent.” (Veblen, 1921)
- 7 -
Recognizing that owner-managers are also guided by utility maximization and not pure profit
maximization, Demsetz (1983) argue that it is not clear that diffusion of ownership will
automatically have a detrimental effect. In fact, it has been argued that as the stake of owner-
managers increase, so does their ability to misallocate resources (Stulz, 1988). This effect is
referred to as the managerial entrenchment effect (see Morck et al. 1988, and Stulz, 1988).
Morck et al. (1988) find a non-monotonic relationship between ownership and Tobin’s q.
They find that performance initially increases with ownership concentration, then declines
and finally increases again, which is consistent with incentive effect in combination with an
entrenchment effect. McConnell and Servaes (1990) find similar results.7 Expecting a
managerial entrenchment effect lead to the second hypothesis:
H2: Ownership concentration will have a non-linear effect on performance.
The net outcome depends on the balance between the incentive and the entrenchment effect.
Burkhart and Lee (2008) review the theoretical literature on one share-one vote arguing that
there are both positive and negative effects associated with dual-class shares. Adams and
Ferreira (2008) review the empirical literature and find the empirical evidence inconclusive.8
Bebchuk et al. (1999), on the other hand, argue that these control mechanisms distort the
incentives of the controlling owners and therefore potentially cause a sharp increase in agency
costs. When the incentives are distorted, this may also have a negative impact on the optimal
choice of investment, scope of the firm and transferal of control. Separation of control/voting
7 Cho (1998) criticizes these findings and shows that market value affects ownership concentration. See also Loderer and Martin (1997). 8 In an external study commissioned by the European Commission (ECGI, 2007) the proportionality between ownership and control of listed firm in EU is studied. Among other things this study reports the results from a survey send to institutional investors with Є 4.9 trillion of assets under management. A clear majority of the investors expect a discount of 10% to 30% of the share price of firms using CEM.
- 8 -
rights and cash-flow rights not only alters the control structure of the corporation, but it also
changes the incentives of owner-managers. One effect that can be expected from the
separation of cash-flow and control rights is that the positive incentive effect will be
weakened whereas the entrenchment effect will be amplified. From this, hypothesis three
follows:
H3: Control mechanisms such as dual-class equity structure will weaken the
incentive and enhance the managerial entrenchment effect.
Using a market-to-book measure of Tobin’s q, Claessens et al. (2002) find evidence that is
consistent with this hypothesis. They examine a large number of firms in East Asia and find
that cash-flow rights are positively correlated with performance. However, control rights in
excess of cash-flow rights have a negative effect on firm value.
2.1 Corporate Ownership in the Nordic Countries
The generality of the Berle and Means (1932) observation is, however, empirically
challenged. Looking at ownership structure around the world, most corporations have
concentrated ownership and are controlled by families (Morck et al., 2005, and La Porta et al.,
1999). Faccio and Lang (2002) find that families predominantly control corporations in
continental Europe. This control is achieved without corresponding capital by means of
primarily three different control enhancing mechanisms (CEM): vote-differentiation of shares,
pyramid ownership and cross-holdings. Most European countries allow at least one of the
three principal instruments for enhancing ownership control (ECGI, 2007 and Söderström et
al., 2003). This means that the division between what Berle and Means (1932) call “nominal
- 9 -
ownership” and the corporate control is further enhanced by separating the capital stake and
voting power, making it possible for a small group of investors, often the founding family, to
maintain control of the firm.
Like most firms in continental Europe, Nordic firms very often have controlling owners that
have maintained their control even as their capital stake has declined and the firm has grown.
In particular, the extensive use of vote-differentiated shares has had a substantial impact on
the way in which the ownership structure has evolved in the Nordic countries. In Norway
about 14 percent of listed firms use dual-class shares, in Denmark and Finland more than 30
percent, and in Sweden it is as high as 55 percent (Bøhren and Ødegaard, 2006, and
Söderström et al., 2003). The frequent use of dual-class shares, with strong separation of
voting rights and equity claims, has produced very strong and stable ownership structures
(Henrekson and Jakobsson, 2006 and Högfeldt, 2004). Supposed advantages of strong and
stable owners provide the underpinning argument for the Nordic legislation that allow vote-
differentiation of shares and pyramid ownership. By using vote-differentiation, the founding
families may retain control of firms even with a very small equity share. In fact, most Nordic
firms have a single controlling owner, and very few firms are characterized by dispersed
ownership. Bennedsen and Nielsen (2005) report significant differences in the frequency of
control mechanisms for a sample of 4096 European firms (see Table 1). For a review of
control enhancing mechanism in Europe see also ECGI (2007).
- 10 -
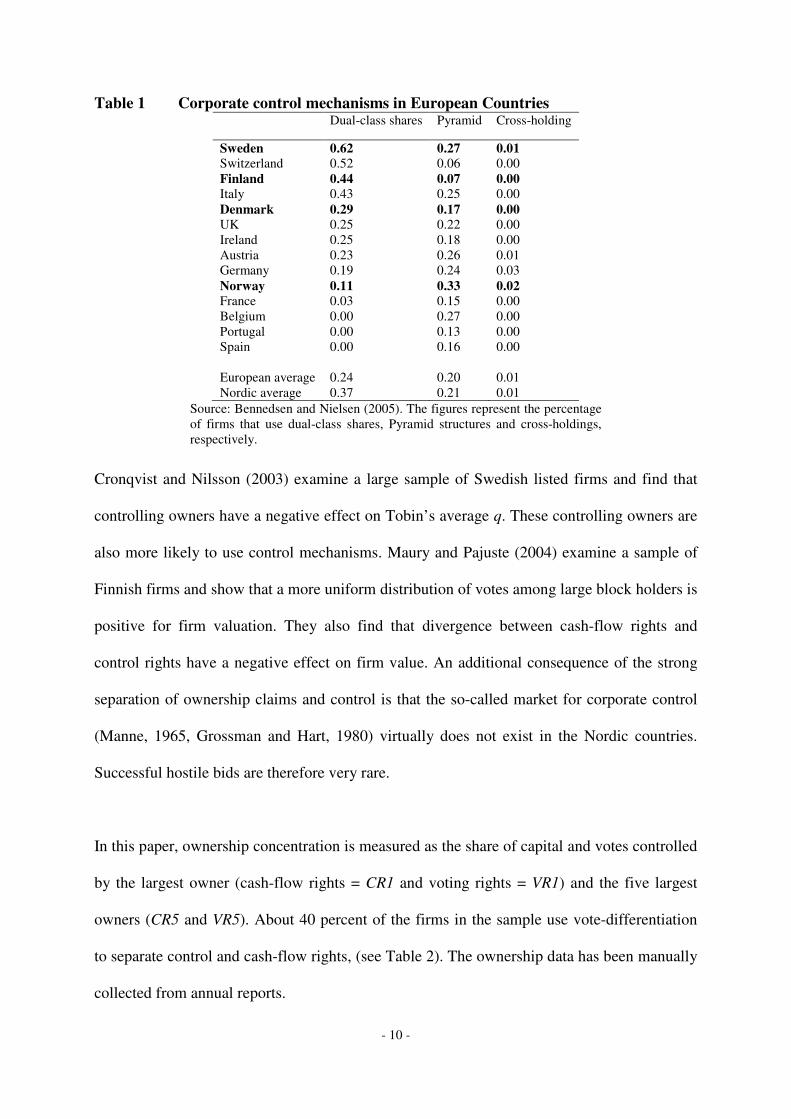
Table 1 Corporate control mechanisms in European Countries
Dual-class shares Pyramid Cross-holding
Sweden 0.62 0.27 0.01
Switzerland 0.52 0.06 0.00 Finland 0.44 0.07 0.00
Italy 0.43 0.25 0.00 Denmark 0.29 0.17 0.00
UK 0.25 0.22 0.00 Ireland 0.25 0.18 0.00 Austria 0.23 0.26 0.01 Germany 0.19 0.24 0.03 Norway 0.11 0.33 0.02
France 0.03 0.15 0.00 Belgium 0.00 0.27 0.00 Portugal 0.00 0.13 0.00 Spain 0.00 0.16 0.00 European average 0.24 0.20 0.01 Nordic average 0.37 0.21 0.01
Source: Bennedsen and Nielsen (2005). The figures represent the percentage of firms that use dual-class shares, Pyramid structures and cross-holdings, respectively.
Cronqvist and Nilsson (2003) examine a large sample of Swedish listed firms and find that
controlling owners have a negative effect on Tobin’s average q. These controlling owners are
also more likely to use control mechanisms. Maury and Pajuste (2004) examine a sample of
Finnish firms and show that a more uniform distribution of votes among large block holders is
positive for firm valuation. They also find that divergence between cash-flow rights and
control rights have a negative effect on firm value. An additional consequence of the strong
separation of ownership claims and control is that the so-called market for corporate control
(Manne, 1965, Grossman and Hart, 1980) virtually does not exist in the Nordic countries.
Successful hostile bids are therefore very rare.
In this paper, ownership concentration is measured as the share of capital and votes controlled
by the largest owner (cash-flow rights = CR1 and voting rights = VR1) and the five largest
owners (CR5 and VR5). About 40 percent of the firms in the sample use vote-differentiation
to separate control and cash-flow rights, (see Table 2). The ownership data has been manually
collected from annual reports.
- 11 -
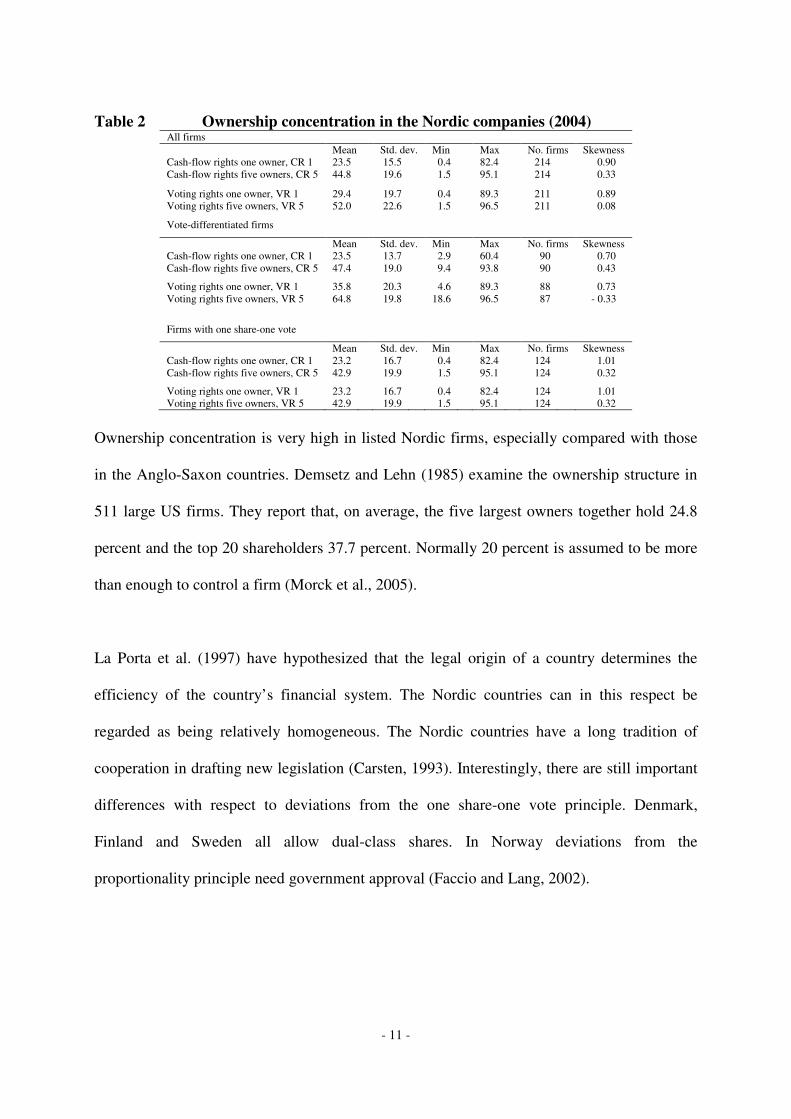
Table 2 Ownership concentration in the Nordic companies (2004)
All firms Mean Std. dev. Min Max No. firms Skewness Cash-flow rights one owner, CR 1 23.5 15.5 0.4 82.4 214 0.90 Cash-flow rights five owners, CR 5 44.8 19.6 1.5 95.1 214 0.33
Voting rights one owner, VR 1 29.4 19.7 0.4 89.3 211 0.89 Voting rights five owners, VR 5 52.0 22.6 1.5 96.5 211 0.08
Vote-differentiated firms
Mean Std. dev. Min Max No. firms Skewness Cash-flow rights one owner, CR 1 23.5 13.7 2.9 60.4 90 0.70 Cash-flow rights five owners, CR 5 47.4 19.0 9.4 93.8 90 0.43
Voting rights one owner, VR 1 35.8 20.3 4.6 89.3 88 0.73 Voting rights five owners, VR 5 64.8 19.8 18.6 96.5 87 - 0.33
Firms with one share-one vote
Mean Std. dev. Min Max No. firms Skewness Cash-flow rights one owner, CR 1 23.2 16.7 0.4 82.4 124 1.01 Cash-flow rights five owners, CR 5 42.9 19.9 1.5 95.1 124 0.32
Voting rights one owner, VR 1 23.2 16.7 0.4 82.4 124 1.01 Voting rights five owners, VR 5 42.9 19.9 1.5 95.1 124 0.32
Ownership concentration is very high in listed Nordic firms, especially compared with those
in the Anglo-Saxon countries. Demsetz and Lehn (1985) examine the ownership structure in
511 large US firms. They report that, on average, the five largest owners together hold 24.8
percent and the top 20 shareholders 37.7 percent. Normally 20 percent is assumed to be more
than enough to control a firm (Morck et al., 2005).
La Porta et al. (1997) have hypothesized that the legal origin of a country determines the
efficiency of the country’s financial system. The Nordic countries can in this respect be
regarded as being relatively homogeneous. The Nordic countries have a long tradition of
cooperation in drafting new legislation (Carsten, 1993). Interestingly, there are still important
differences with respect to deviations from the one share-one vote principle. Denmark,
Finland and Sweden all allow dual-class shares. In Norway deviations from the
proportionality principle need government approval (Faccio and Lang, 2002).
- 12 -
3 Methodology
This paper applies a method to measure marginal q developed by Mueller and Reardon
(1993). Marginal q is simply a marginal version of Tobin’s q. Tobin’s q is defined as the
market value of a firm over the replacement cost of its assets, which translates to the average
return on total assets. Marginal q, on the other hand, measures the return on investments, i, (or
the marginal return on capital) relative to the cost of capital, r, (qm = i/r) (Mueller, 2003). This
is in effect a measure of what Tobin (1984) calls the “functional form” of stock market
efficiency.9 Marginal q is also a more appropriate measure of performance since average q
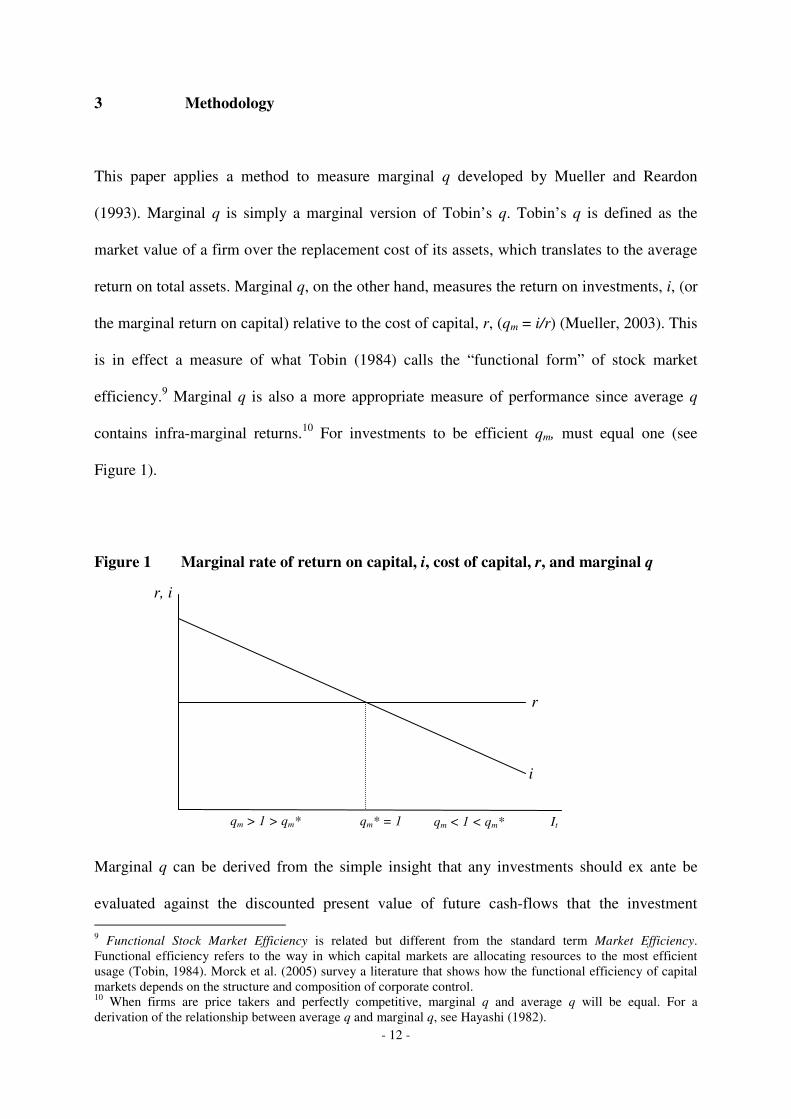
contains infra-marginal returns.10 For investments to be efficient qm, must equal one (see
Figure 1).
Figure 1 Marginal rate of return on capital, i, cost of capital, r, and marginal q
Marginal q can be derived from the simple insight that any investments should ex ante be
evaluated against the discounted present value of future cash-flows that the investment 9 Functional Stock Market Efficiency is related but different from the standard term Market Efficiency. Functional efficiency refers to the way in which capital markets are allocating resources to the most efficient usage (Tobin, 1984). Morck et al. (2005) survey a literature that shows how the functional efficiency of capital markets depends on the structure and composition of corporate control. 10 When firms are price takers and perfectly competitive, marginal q and average q will be equal. For a derivation of the relationship between average q and marginal q, see Hayashi (1982).
It qm* = 1
r, i
i
r
qm > 1 > qm* qm < 1 < qm*

- 13 -
generate11. Obviously, only projects that have an expected positive net present value should
be carried out. Consider an investment, It, made by a firm in period t. This investment
generates cash flows, CFt+j in j periods. The expected present value, PVt, of this cash-flow
can be expressed as follows:
( )∑=
+ +=n
j
j
tjtt rCFPV1
1/ (1)
where rt is the discount rate. For the sake of simplicity expectations operators are not included
in the derivation. This equation can be expressed in the following way, where it can be
regarded as a quasi-permanent rate of return:
tttt riIPV /= (2)
For investments to be efficient from a shareholder perspective the investment being
considered must generate future cash flows that, discounted to the present value, equal or
exceed the investment cost.
Equation (2) can be rearranged and expressed as follows:
tmtt
t
t qriI
PV,== (3)
For investments to be meaningful, we must have that tt IPV ≥ . This implies that qm ≥ 1. If
firms are investing at qm = 1, investments are efficient, which in turn implies that there are no 11 This methodology can also be derived from Tobin’s average q, by taking first difference.

- 14 -
further profitable investment opportunities. Whereas if qm < 1, firms are receiving a return on
their investment that is less than the cost of capital. A qm below one can only be interpreted as
over-investment and a managerial failure of some sort.
At the end of period t the market value of a firm may be decomposed into the market value in
period t-1 (Mt-1), the present value of investments made in period t (PVt), the change in market
value of the old capital stock (δt), and an error term for the errors the market may make in its
evaluation of the firm (µt).12
tttttt MPVMM µδ +−+≡ −− 11 (4)
Assuming that qm and δ both are constant over time and across firms, we can use equation (4)
to estimate qm and δ directly. Taking equation (4) and subtracting Mt-1 from both sides we get:
ttmttt IqMMM µδ ++−=− −− 11 (5)
Dividing by Mt-1 we normalize the equation and get the following relationship that can be
empirically estimated:
12 If the market makes errors in their valuation of the firm, the error component, µ, may contain a revaluation factor in the following period. Note that we from the efficient market hypothesis
have: 0)( =tE µ and 0),( 1 =−ttE µµ , and therefore also 00
=
∑
=+
n
jjtE µ . More resent research suggests
that in the short run the efficient market hypothesis fails (i.e. Farmer and Geanakoplos, 2008 and Lo, 2004). Casti (2008) argue that once one recognize the possibility that investors are forming expectation based on assumptions regarding the behavior of other investors this leads to a world of induction rather than deduction. In computer models of stock markets taking this behavior (i.e. trading based on technical analysis) in account prices have been found to settle down in random fluctuations around its fundamental value. Within these oscillations very complex patterns overshooting, crashes et cetera are found (see Arthur et al., 1996). It should be noted that the panel data methodology used in section 4 mitigates these concerns. For a discussion of stock market bubbles and implications for marginal q see Bjuggren and Wiberg, (2008).
- 15 -
111
1
−−−
− ++−=−
t
t
t
tm
t
tt
MM
Iq
M
MM µδ (6)
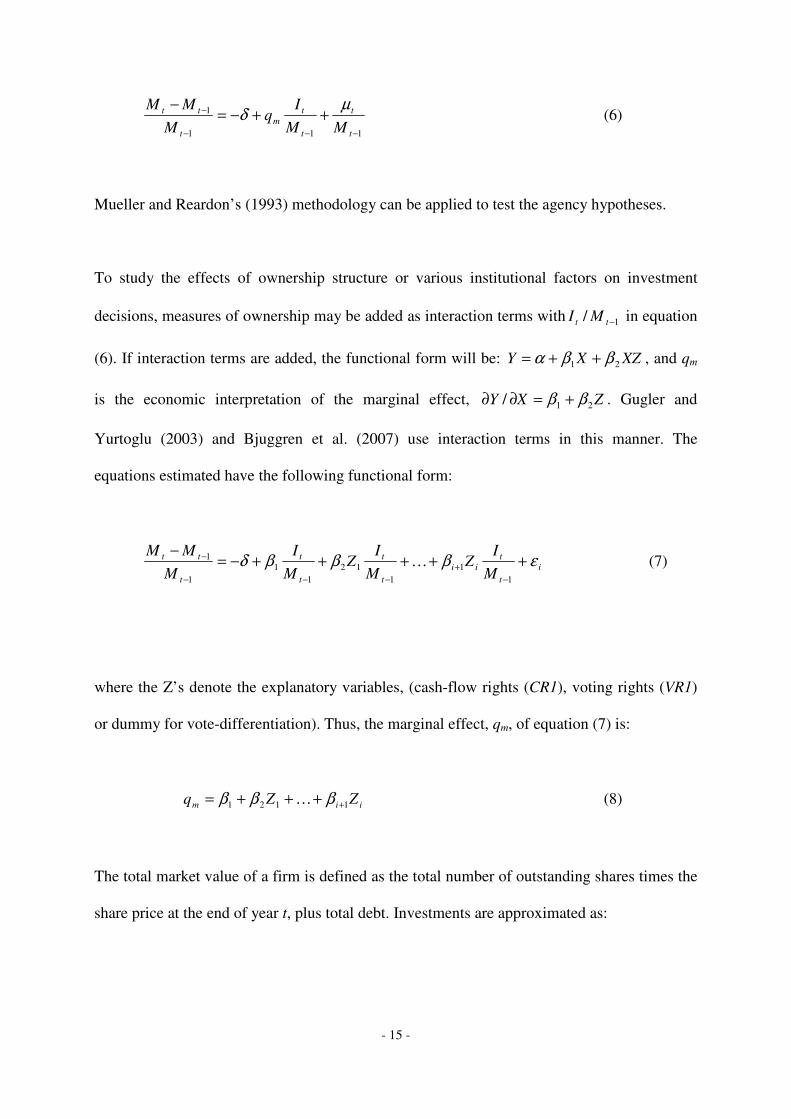
Mueller and Reardon’s (1993) methodology can be applied to test the agency hypotheses.
To study the effects of ownership structure or various institutional factors on investment
decisions, measures of ownership may be added as interaction terms with 1/ −tt MI in equation
(6). If interaction terms are added, the functional form will be: XZXY 21 ββα ++= , and qm
is the economic interpretation of the marginal effect, ZXY 21/ ββ +=∂∂ . Gugler and
Yurtoglu (2003) and Bjuggren et al. (2007) use interaction terms in this manner. The
equations estimated have the following functional form:
i
t
tii
t
t
t
t
t
tt
M
IZ
M
IZ
M
I
M
MMεβββδ +++++−=
−
−
+
−−−
−
11
112
11
1
1… (7)
where the Z’s denote the explanatory variables, (cash-flow rights (CR1), voting rights (VR1)
or dummy for vote-differentiation). Thus, the marginal effect, qm, of equation (7) is:
iim ZZq 1121 ++++= βββ … (8)
The total market value of a firm is defined as the total number of outstanding shares times the
share price at the end of year t, plus total debt. Investments are approximated as:

- 16 -
I = After tax profit – Dividends + Depreciation + ∆Equity + ∆Debt
+ R&D + Advertising & Marketing
The market and accounting data have been collected from Compustat Global database13. The
firms included were listed at one of the four Nordic Stock Exchanges (Copenhagen Stock
exchange in Denmark, Helsinki Stock exchange in Finland, Oslo Stock Exchange in Norway
and Stockholm Stock Exchange in Sweden) between 1998 or 1999 and 2005, in total 292
firms (2004 observations). Bjuggren and Wiberg (2008) find that qm is sensitive to stock
market swings and that depending on period selection the qm may either be over- or under-
estimated. The choice of a 5-6 year period approximately coincides with the average length of
a business cycle reduce this problem. All figures have been adjusted by harmonized consumer
price indexes to 2005 constant prices. Eurostat have compiled the indexes. Naturally, the
standard caveats apply to the data.
The depreciation rate can be assumed to vary across firms and industries, depending on the
durability of assets employed. Equation (6) has the advantage that no assumption regarding
the size of δ is necessary. This makes a fixed effects approach appropriate since it allows for
variation in depreciation rates across groups and time. In an empirical estimation of equation
(6) the intercept (δ) will capture the depreciation rate plus any systematic changes in market
valuations of the stock of old capital (see note 10). The estimated δ has no bearing on the
interpretation of qm.
13 Accounting data and market prices has been collected from Standard & Poor’s Compustat Global Database, 2006 version. Following variables have been collected from Compustat (mnemonics in brackets): after tax profit (IB), depreciation (DP) dividends (DVT), total debt (DT), research and development (XRD), market price (MKVAL), Advertising and marketing expenditures (XSGA), ∆ equity (SSTK minus PRSTKC).

- 17 -
4 Corporate return and ownership structure
This study covers 142 large Nordic firms that are listed at one of the four stock exchanges.
This accounts for about 18 percent of all listed firms and approximately 40 percent of the total
stock market capitalization.14 The firms approximately follow a rank size distribution, where
the second largest firm is about half the size of the largest.15
Matching accounting and financial data with the 142 firms for which ownership information
was available resulted in a total of 806 observations, with no less than five observations for
each firm. Since the data consists of a cross-sectional time series, a fixed effect model is used
(industry and time fixed effects model). This allows for systematic changes in market value
over time and varying depreciation across industries. From an empirical point of view the
choice between industry and firm effects are of minor importance. The stock market may fail
to make a correct valuation in a single period, but assuming efficient markets, this error will
approach zero as time span increases. To take the possibility for market errors into account,
time dummies were used in the estimations. Both industry and time dummies are restricted to
sum to zero, so that the effects are measured as the deviation from the average depreciation
rate.
There are a few extreme values that have a large impact on the estimates of qm. These are
typically smaller firms that, for some reason, either have a very high return on invested
capital, or a massive loss in market value. There are several plausible explanations for these
extreme values. Firms may for example introduce radical innovations that do not require any
14 These 142 firms represent all non-financial firms for which sufficient ownership information was available. In 2004, there were a total of 796 listed firms in the Nordic countries (185 in Denmark, 143 in Finland, 177 in Norway and 282 in Sweden). 15 The formula iMM i /1= , where 1M is the largest firm and i the firm rank, approximates the size distribution of the firms in the sample.

- 18 -
substantial investments, but nevertheless substantially increase firm value. In order to reduce
the weight of outliers, some of the observations have been removed from the data set. The
absolute deviation between the dependent variable and the explanatory variable16, has been
used to identify outliers. Observations that had an absolute deviation above two (12
observations) were removed. This captures for example firms that have large swings in
market value without corresponding changes in investments. The excluded firms are
predominantly found among relatively small high-tech firms within the biotechnology and
ICT sector. Bjuggren and Wiberg (2008) have shown that the marginal q measure is sensitive
to swings in valuation of new high-tech firms.
As a first step marginal q was estimated for the Nordic countries. Details on these estimates
are reported in Appendix 1. The Nordic average is significantly below one. For Denmark
marginal q is 0.66, 1.07 for Norway, 0.93 for Finland and 0.77 for Sweden. These findings
seem to corroborate previous estimates of marginal q for the Nordic countries. In a large
cross-country study, Gugler et al. (2002) find similar estimates for the Nordic countries.
Between 1985 and 2000, they estimate 0.65 for Denmark, 0.96 for Finland, 1.04 for Norway
and 0.65 for Sweden. Bjuggren et al. (2007) have also estimated an average qm to 0.65 for
Sweden. The findings are, in other words, consistent with previous estimates for Finland and
Norway. Gugler et al. (2002) have estimated the Nordic average at 0.7817.
By using interaction terms, equation (7) is used to test the effects of ownership concentration
and separation of control from cash-flow rights on performance. As measures of ownership
16 |(Mt – Mt-1)/Mt-1 – It/Mt-1| identify observations that have very large swings in market value without commensurate investment. In practice this excludes variables that have missing observations or contain accounting errors. Observations that were excluded were only among the small firms in the sample. Using a robust estimation technique, such as iteratively reweighed least squares or simple trimming of the data would yields consistent results. 17 Their findings support the legal origin hypothesis. Anglo-Saxon countries perform best with qm = 1.02. Average qm for Germanic and French origin is 0.74 and 0.59, respectively.

- 19 -
concentration, the share of cash-flow rights held by the largest owner (CR1) and the five
largest owners together (CR5) are used. The voting right held by the largest owner (VR1) and
the five largest owners (VR5) together is used to measure control. Dummies are used to
control for dual-class shares. See Table 2. In the sample, 49 percent of the firms use a dual-
class share structure. Matching accounting and market data with the ownership data leaves
142 firms. Correlations are reported in Table 3.
Table 3 Correlation matrix Sales It/Mt-1 Mt-Mt-1/Mt-1 CR1 CR5 VR1 VR5 Sales 1 It/Mt-1 0.012 1 Mt-Mt-1/Mt-1 - 0.043 0.422* 1 CR1 - 0.088* 0.069 0.033 1 CR5 - 0.224* 0.068 0.022 0.847* 1 VR1 - 0.031 0.118* 0.019 0.812* 0.710* 1 VR5 - 0.119* 0.102* 0.014 0.678* 0.835* 0.817* 1 Vote-differentiation 0.082* 0.071* - 0.049 - 0.053 0.033 0.310* 0.422*
* indicates significance at 5 percent.
Naturally all ownership variables display high and significant correlations. Sales are
negatively correlated with all ownership variables, but weaker for VR1 and VR5 as compared
to CR1 and CR5. In other words, ownership concentration measured by cash-flow rights is
inversely related to firm size. This means that controlling owners remain in large firms by
resorting to dual-class equity structure. It is also interesting to note that investments are
significantly correlated with control rights and vote-differentiation, but not with cash-flow
rights.
In order to control for unobserved, time-invariant heterogeneity across firms, a fixed effect
model with firm and time effects is applied. The fixed time effect is motivated by the efficient
markets hypothesis; the stock market may be under- or over-estimated in any single period,
but for a longer period of time the expected error in stock market evaluations is zero, E(µt) =
0. To control for this possibility, annual dummy variables are included and estimated under
- 20 -
the restriction that they summarize to zero. The annual stoack market evaluation effects are
measured as deviations from the average. To control for the possibility that the Nordic
countries have systematic differences in returns, country dummies are also included. These
are also estimated under the restriction that they summarize to zero, such that any deviation is
measured as the deviation from the Nordic average. Time, industry and country effects are not
reported.
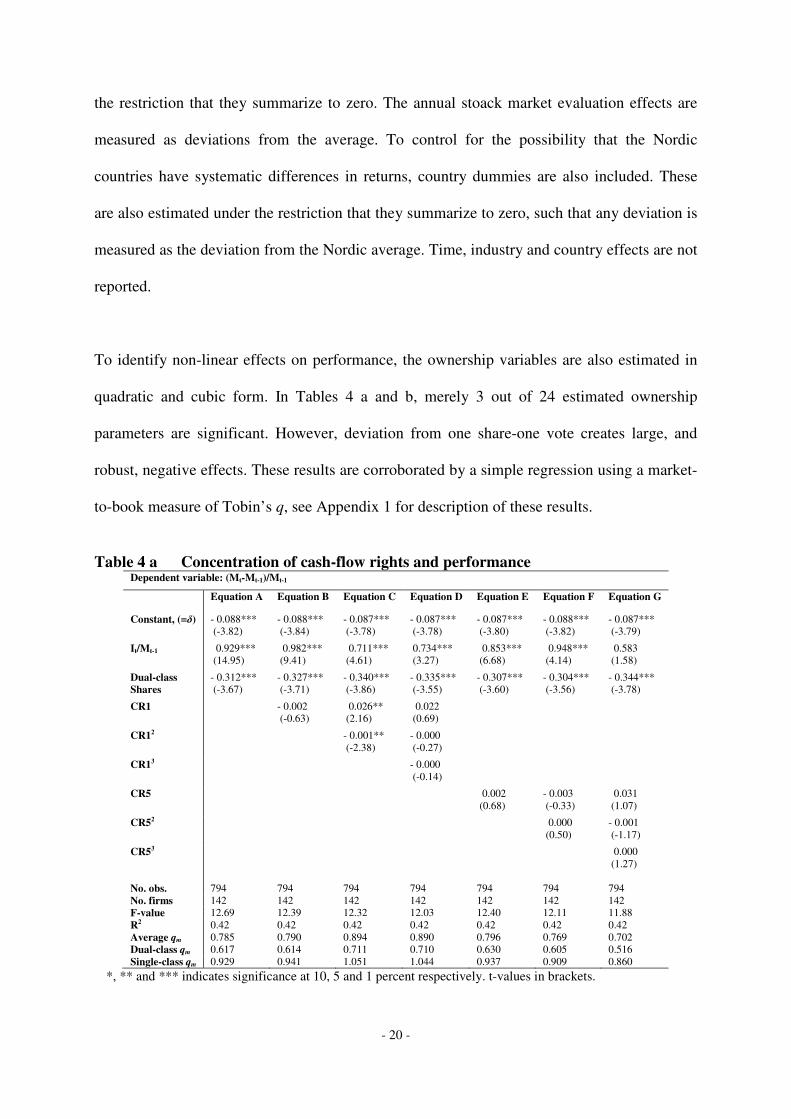
To identify non-linear effects on performance, the ownership variables are also estimated in
quadratic and cubic form. In Tables 4 a and b, merely 3 out of 24 estimated ownership
parameters are significant. However, deviation from one share-one vote creates large, and
robust, negative effects. These results are corroborated by a simple regression using a market-
to-book measure of Tobin’s q, see Appendix 1 for description of these results.
Table 4 a Concentration of cash-flow rights and performance Dependent variable: (Mt-Mt-1)/Mt-1
Equation A Equation B Equation C Equation D Equation E Equation F Equation G
Constant, (=δ) - 0.088*** (-3.82)
- 0.088*** (-3.84)
- 0.087*** (-3.78)
- 0.087*** (-3.78)
- 0.087*** (-3.80)
- 0.088*** (-3.82)
- 0.087*** (-3.79)
It/Mt-1 0.929*** (14.95)
0.982*** (9.41)
0.711*** (4.61)
0.734*** (3.27)
0.853*** (6.68)
0.948*** (4.14)
0.583 (1.58)
Dual-class
Shares
- 0.312*** (-3.67)
- 0.327*** (-3.71)
- 0.340*** (-3.86)
- 0.335*** (-3.55)
- 0.307*** (-3.60)
- 0.304*** (-3.56)
- 0.344*** (-3.78)
CR1 - 0.002 (-0.63)
0.026** (2.16)
0.022 (0.69)
CR12 - 0.001** (-2.38)
- 0.000 (-0.27)
CR13 - 0.000 (-0.14)
CR5 0.002 (0.68)
- 0.003 (-0.33)
0.031 (1.07)
CR52 0.000 (0.50)
- 0.001 (-1.17)
CR53 0.000 (1.27)
No. obs. 794 794 794 794 794 794 794 No. firms 142 142 142 142 142 142 142 F-value 12.69 12.39 12.32 12.03 12.40 12.11 11.88 R2 0.42 0.42 0.42 0.42 0.42 0.42 0.42 Average qm 0.785 0.790 0.894 0.890 0.796 0.769 0.702 Dual-class qm 0.617 0.614 0.711 0.710 0.630 0.605 0.516 Single-class qm 0.929 0.941 1.051 1.044 0.937 0.909 0.860
*, ** and *** indicates significance at 10, 5 and 1 percent respectively. t-values in brackets.

- 21 -
Firms with only a single class of shares invest efficiently, that is, qm is not different from one,
whereas firms that rely on dual-class equity shares on average have a return on dual-class
shares that is 30 percent below the opportunity cost of capital.
Table 4 b Concentration of control/voting rights and performance
Dependent variable: (Mt-Mt-1)/Mt-1
Equation B Equation C Equation D Equation E Equation F Equation G
Constant, (=δ) - 0.088*** (-3.80)
- 0.085*** (-3.69)
- 0.084*** (-3.63)
- 0.085*** (-3.72)
- 0.089*** (-3.86)
- 0.090*** (-3.90)
It/Mt-1 0.911*** (9.56)
0.818*** (6.02)
0.709*** (3.60)
0.702*** (5.51)
0.966*** (4.29)
0.649* (1.82)
Dual-class
Shares
- 0.317*** (-3.62)
- 0.317*** (-3.61)
- 0.331*** (-3.69)
- 0.390*** (-4.19)
- 0.396*** (-4.26)
- 0.404*** (-4.33)
VR1 0.001 (0.24)
0.007 (0.99)
0.022 (1.07)
VR12 - 0.001 (-0.96)
- 0.001 (-0.92)
VR13 0.000 (0.76)
VR5 0.005** (2.03)
- 0.007 (-0.82)
0.021 (0.80)
VR52 0.000 (1.42)
- 0.001 (-0.92)
VR53 0.000 (1.15)
No. obs. 794 794 794 794 794 794 No. firms 142 142 142 142 142 142 F-value 12.38 12.12 11.86 12.54 12.32 12.08 R2 0.42 0.42 0.42 0.42 0.42 0.42 Average qm 0.812 0.836 0.836 0.774 0.728 0.730 Dual-class qm 0.612 0.657 0.665 0.564 0.514 0.512 Single-class qm 0.929 0.988 0.982 0.954 0.910 0.916
*, ** and *** indicates significance at 10, 5 and 1 percent respectively. t-values in brackets.
The fact that vote-differentiation has a significant negative effect on firm performance
indicates that the ownership-performance relationship may differ between firms with one
class of shares and those having separated cash-flow rights and control rights. This negative
effect increases in equations A to G, when the ownership variables are added. One possible
interpretation is that the ownership variables are picking up a positive incentive effect. This,
in turn, suggests that the ownership effects differ between the two categories of firms.
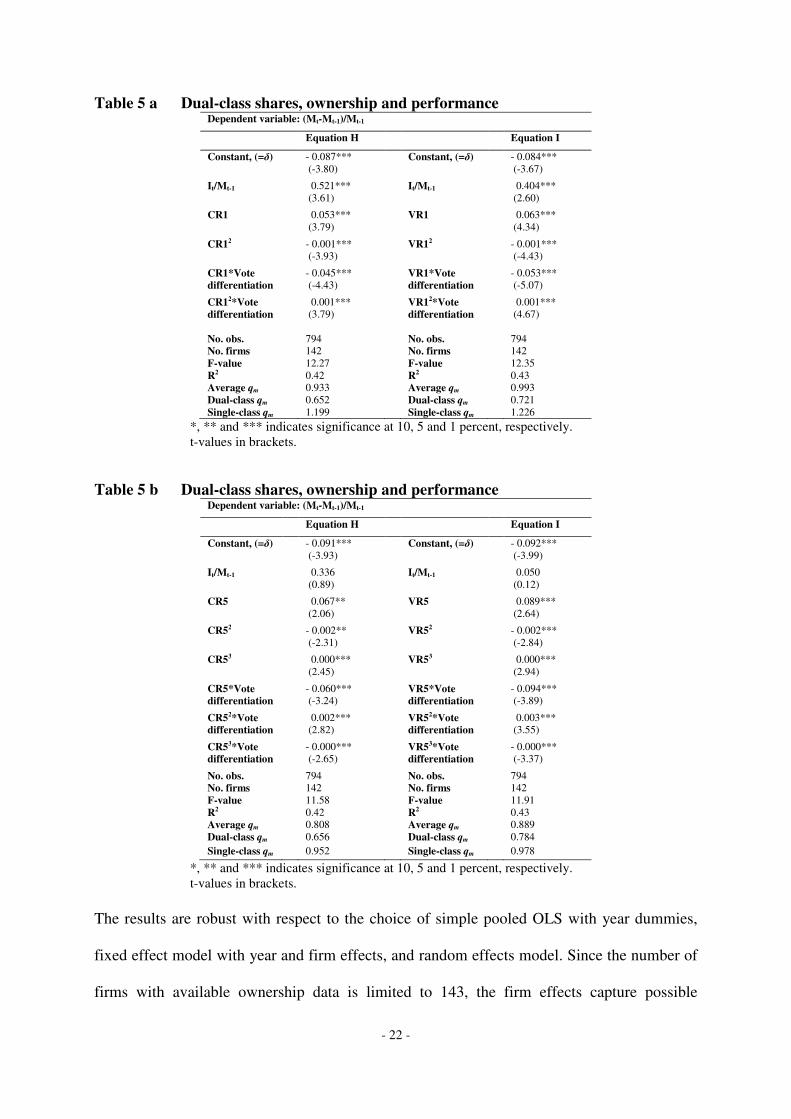
In Table 5 ownership variables are interacted with the dummy variable for dual-class share
structure. Different specifications of the functional form have been estimated.
- 22 -
Table 5 a Dual-class shares, ownership and performance Dependent variable: (Mt-Mt-1)/Mt-1
Equation H Equation I
Constant, (=δ) - 0.087*** (-3.80)
Constant, (=δ) - 0.084*** (-3.67)
It/Mt-1 0.521*** (3.61)
It/Mt-1 0.404*** (2.60)
CR1 0.053*** (3.79)
VR1 0.063*** (4.34)
CR12 - 0.001*** (-3.93)
VR12 - 0.001*** (-4.43)
CR1*Vote
differentiation - 0.045*** (-4.43)
VR1*Vote
differentiation
- 0.053*** (-5.07)
CR12*Vote
differentiation
0.001*** (3.79)
VR12*Vote
differentiation
0.001*** (4.67)
No. obs. 794 No. obs. 794 No. firms 142 No. firms 142 F-value 12.27 F-value 12.35 R2 0.42 R2 0.43 Average qm 0.933 Average qm 0.993 Dual-class qm 0.652 Dual-class qm 0.721 Single-class qm 1.199 Single-class qm 1.226
*, ** and *** indicates significance at 10, 5 and 1 percent, respectively. t-values in brackets.
Table 5 b Dual-class shares, ownership and performance Dependent variable: (Mt-Mt-1)/Mt-1
Equation H Equation I
Constant, (=δ) - 0.091*** (-3.93)
Constant, (=δ) - 0.092*** (-3.99)
It/Mt-1 0.336 (0.89)
It/Mt-1 0.050 (0.12)
CR5 0.067** (2.06)
VR5 0.089*** (2.64)
CR52 - 0.002** (-2.31)
VR52 - 0.002*** (-2.84)
CR53 0.000*** (2.45)
VR53 0.000*** (2.94)
CR5*Vote
differentiation
- 0.060*** (-3.24)
VR5*Vote
differentiation
- 0.094*** (-3.89)
CR52*Vote
differentiation
0.002*** (2.82)
VR52*Vote
differentiation
0.003*** (3.55)
CR53*Vote
differentiation
- 0.000*** (-2.65)
VR53*Vote
differentiation
- 0.000*** (-3.37)
No. obs. 794 No. obs. 794 No. firms 142 No. firms 142 F-value 11.58 F-value 11.91 R2 0.42 R2 0.43 Average qm 0.808 Average qm 0.889 Dual-class qm 0.656 Dual-class qm 0.784 Single-class qm 0.952 Single-class qm 0.978
*, ** and *** indicates significance at 10, 5 and 1 percent, respectively. t-values in brackets.
The results are robust with respect to the choice of simple pooled OLS with year dummies,
fixed effect model with year and firm effects, and random effects model. Since the number of
firms with available ownership data is limited to 143, the firm effects capture possible
- 23 -
industry effects, and vice versa. Bjuggren et al. (2007) also find that qm is robust with respect
to model specification. Consequently, all equations have been estimated with two-digit
industry SIC codes.
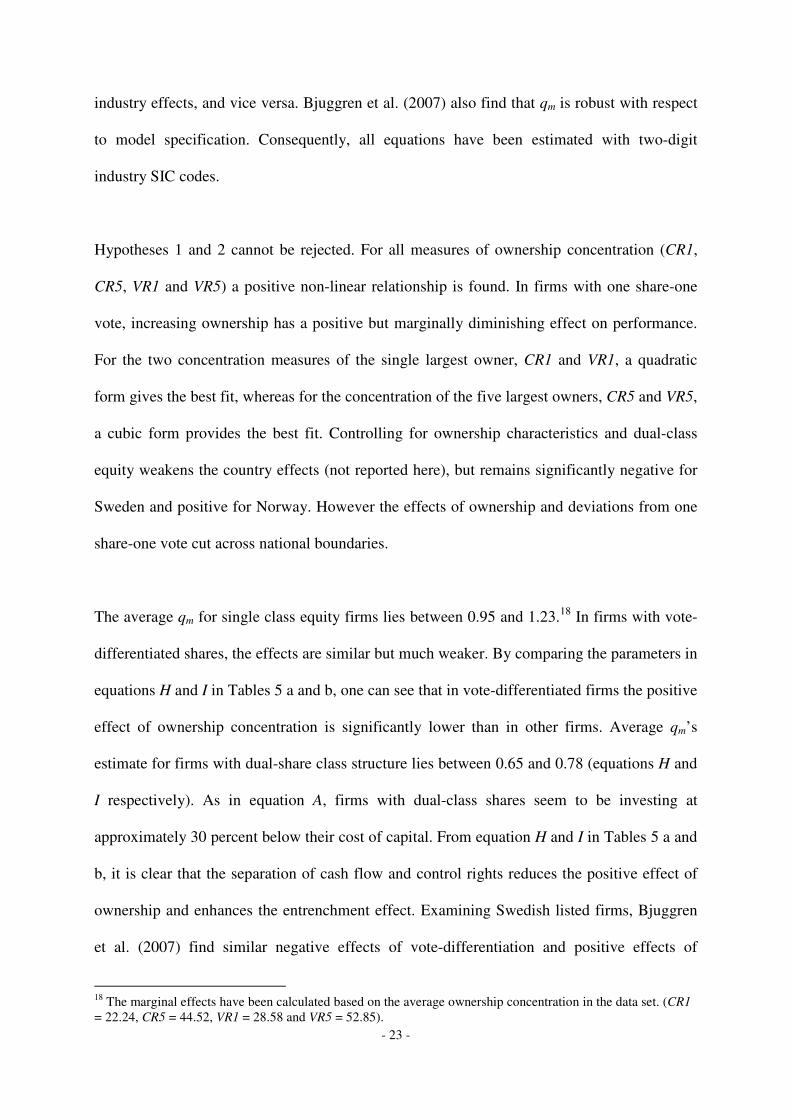
Hypotheses 1 and 2 cannot be rejected. For all measures of ownership concentration (CR1,
CR5, VR1 and VR5) a positive non-linear relationship is found. In firms with one share-one
vote, increasing ownership has a positive but marginally diminishing effect on performance.
For the two concentration measures of the single largest owner, CR1 and VR1, a quadratic
form gives the best fit, whereas for the concentration of the five largest owners, CR5 and VR5,
a cubic form provides the best fit. Controlling for ownership characteristics and dual-class
equity weakens the country effects (not reported here), but remains significantly negative for
Sweden and positive for Norway. However the effects of ownership and deviations from one
share-one vote cut across national boundaries.
The average qm for single class equity firms lies between 0.95 and 1.23.18 In firms with vote-
differentiated shares, the effects are similar but much weaker. By comparing the parameters in
equations H and I in Tables 5 a and b, one can see that in vote-differentiated firms the positive
effect of ownership concentration is significantly lower than in other firms. Average qm’s
estimate for firms with dual-share class structure lies between 0.65 and 0.78 (equations H and
I respectively). As in equation A, firms with dual-class shares seem to be investing at
approximately 30 percent below their cost of capital. From equation H and I in Tables 5 a and
b, it is clear that the separation of cash flow and control rights reduces the positive effect of
ownership and enhances the entrenchment effect. Examining Swedish listed firms, Bjuggren
et al. (2007) find similar negative effects of vote-differentiation and positive effects of
18 The marginal effects have been calculated based on the average ownership concentration in the data set. (CR1 = 22.24, CR5 = 44.52, VR1 = 28.58 and VR5 = 52.85).
- 24 -
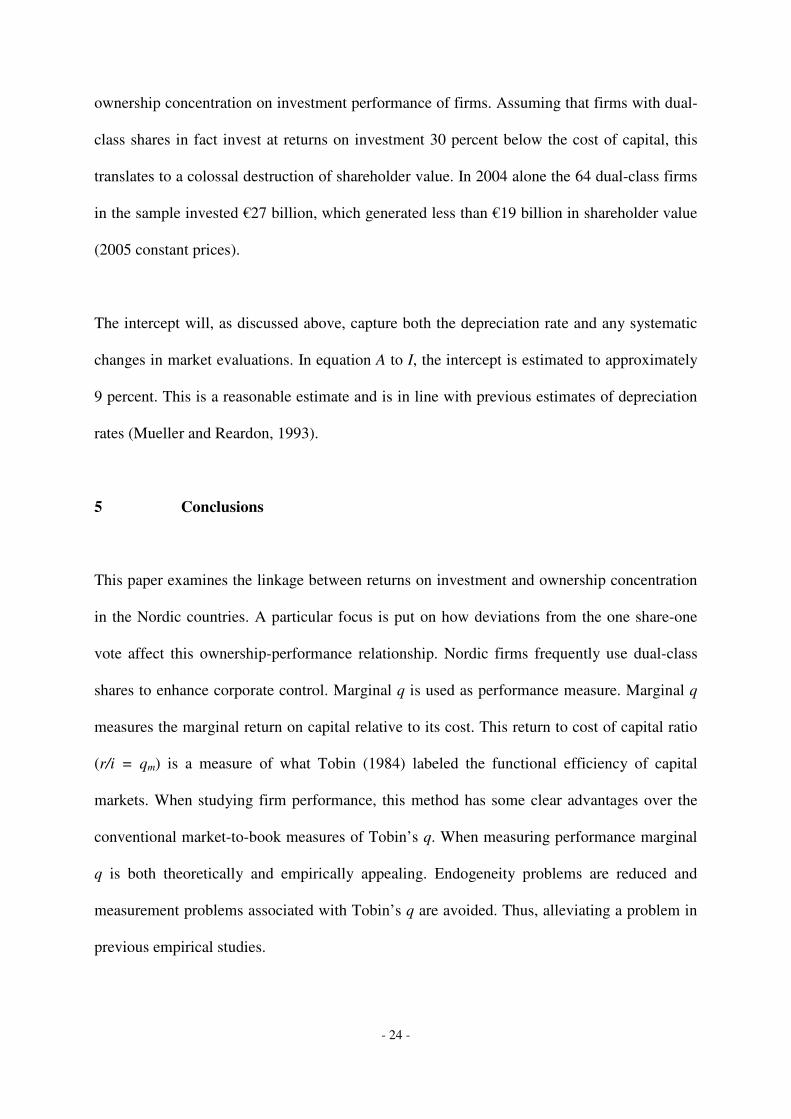
ownership concentration on investment performance of firms. Assuming that firms with dual-
class shares in fact invest at returns on investment 30 percent below the cost of capital, this
translates to a colossal destruction of shareholder value. In 2004 alone the 64 dual-class firms
in the sample invested €27 billion, which generated less than €19 billion in shareholder value
(2005 constant prices).
The intercept will, as discussed above, capture both the depreciation rate and any systematic
changes in market evaluations. In equation A to I, the intercept is estimated to approximately
9 percent. This is a reasonable estimate and is in line with previous estimates of depreciation
rates (Mueller and Reardon, 1993).
5 Conclusions
This paper examines the linkage between returns on investment and ownership concentration
in the Nordic countries. A particular focus is put on how deviations from the one share-one
vote affect this ownership-performance relationship. Nordic firms frequently use dual-class
shares to enhance corporate control. Marginal q is used as performance measure. Marginal q
measures the marginal return on capital relative to its cost. This return to cost of capital ratio
(r/i = qm) is a measure of what Tobin (1984) labeled the functional efficiency of capital
markets. When studying firm performance, this method has some clear advantages over the
conventional market-to-book measures of Tobin’s q. When measuring performance marginal
q is both theoretically and empirically appealing. Endogeneity problems are reduced and
measurement problems associated with Tobin’s q are avoided. Thus, alleviating a problem in
previous empirical studies.
- 25 -
Berle and Means (1932) notion of dispersed ownership structure characterize few Nordic
firms. Vote-differentiation is a common tool for creating and maintaining strong and
concentrated ownership structures. Nordic firms make more frequent use of control
mechanisms than firms in comparable countries. On average the largest owner holds more
than 20 percent of the capital (CR1) and close to 30 percent of the voting rights (VR1).
The hypothesis that ownership concentration improves resource allocation is supported in this
paper. Ownership concentration is found to have a non-linear effect on firm performance
(cubic or quadratic). This is consistent with previous studies that find both positive incentive
effects and negative managerial entrenchment effects of ownership concentration. For firms
with one share-one vote ownership has a positive impact but marginally diminishing, whereas
for firms controlled by dual-class shares this effect is weaker. These firms have a
systematically worse performance than other firms. Dual-class shares drive a wedge between
cash-flow rights and control rights. Not only does this change the control structure, but it also
changes the incentive structure. Firms with one class of shares are, on average, investing
efficiently, whereas firms with dual-class equity structure are over-investing. The separation
of cash-flow rights and control rights reduces the positive incentive effect and enhances the
negative entrenchment effect. By impairing capital reallocation, corporate control
mechanisms are in the long run harmful for industry dynamics and economic renewal.
Vote-differentiation creates massive entrenchment effects and destroys large values. In the
long run, they are likely to harm the functional efficiency of the Nordic capital markets. On
average, “entrenched” firms have returns on investments that are approximately 30 percent
below their cost of capital.
- 26 -
Differences in investment performance across firms can largely be explained by differences in
ownership structure and, in particular, to what extent dual-class shares uphold corporate
control. Separation of cash-flow rights from control appears to distort the incentives of the
controlling owner by significantly reducing the incentive effect.
- 27 -
References
Adams, R. and Ferreira, D., (2008), One Share-One Vote: The Empirical Evidence, Review of Finance, vol. 12, no. 1, 51-91. Arthur, W. B., Holland, J. H., LeBaron, B., Palmer, R. G. and Tayer, P., (1996), “Asset Pricing Under Endogenous Expectations in an Artificial Stock Market,” Santa Fe Institute Working Paper no. 96-12-093. Badrinath, S. G. and Lewellen, G. W., (1997), “On the measurement of Tobin’s Q,” Journal of Financial Economics, vol. 44, 78-122. Bebchuk, L. A., and Hart, O., (2002), “A Threat to Dual-Class Shares: The Recommendation of Breakthrough Rule fails to Recognize its Broader Implications,” Financial Times, 31 May, 2002. Bebchuk, L., Kraakman, R. and Triantis, G., (1999), Stock Pyramids, Cross-Ownership, and Dual-Class Equity: The Creation and Agency Costs of Separating Control from Cash Flow Rights. NBER Working Paper, No. 6951. Bennedsen M. B., and Nielsen, K. M., (2005), “The Principle of Proportionality: Separating the Impact of Dual Class Shares, Pyramids and Cross-ownership on Firm Value Across Legal Regimes in Western Europe,” Centre for Industrial Economics Discussion papers, University of Copenhagen. Berle, A. A. and Means, G., (1932), The Modern Corporation and Private Property, The Macmillan Company, New York. Bjuggren, P-O., Eklund, J. E. and Wiberg, D., (2007), “Ownership Structure, Control and Firm Performance: the Effects of Vote Differentiated Shares,” Applied Financial Economics, vol. 17, 1323-1334. Bjuggren, P-O. and Wiberg, D., (2008), “Industry Specific Effects in Investment Performance and Valuation of Firms; Marginal q in a Stock Market Bubble,” Forthcoming: Empirica. Burkart, M. and Lee, S., (2008), One Share-One Vote: The Theory, Review of Finance, vol. 12, no.1, 1-49. Bøhren, Ø, and Ødegaard, A. B., (2005), “Governance and performance revisited,” Forthcoming in: Gregouriu, G., and Ali, P., (ed), International Corporate Governance after Sarbanes-Oxley, Wiley. Carsten, G., (1993), “Europäische Integration und Nordische Zusammenarbeit auf dem Gebiet des Zivilrechts,“ Zeitschrift für Europäisches Privatrecht, 335. Casti, J. L., (2008), “The Simply Complex,” White paper from Complexica, unpublished. Cho, M-H., (1998), “Ownership Structure, Investments, and the Corporate Value: An Empirical Analysis”, Journal of Financial Economics, vol. 47, no.1, 103-121.
- 28 -
Claessens, S., Djankov, S., Fan, J. P H. and Lang, L. H. P., (2002), “Disentangling the Incentive and Entrenchment Effects of Large Shareholdings,” Journal of Finance, vol. 57, no. 6, 2741-2771. Cronqvist, H. and Nilsson, M., (2003), “Agency Costs of Controlling Minority Shareholders,” Journal of Financial and Quantitative Analysis, vol. 38, no. 4, 695-707. Demsetz, H., (1983), “The Structure of Ownership and the Theory of the Firm”, Journal of Law and Economics, vol. 26, no. 2, 375-390. Demsetz, H. and Lehn, K., (1985), “The Structure of Corporate Ownership: Causes and Consequences,” Journal of Political Economy, vol. 93, no. 6, 1155-1177. Denis, D. K. and McConnell, (2003), “International Corporate Governance,” Journal of Financial and Quantitative Analysis, vol. 38, no. 1, 1-36. ECGI, (2007), “Report on the Proportionality Principle in the European Union,” External Study Commissioned by the European Commission, European Corporate Governance Institute, ECGI. Faccio, M. and Lang L.H.P., (2002), “The ultimate ownership of Western European corporations,” Journal of Financial Economics, vol. 65, no. 3, 365-395. Farmer, D. J. and Geanakoplos, J., (2008), The Virtues and Vices of Equilibrium and the Future of Financial Economics, Cowels Foundation Discussion paper no. 1647, Yale University. Grossman, S, J., and Hart, O., (1980), Takeover bids, the free-rider problem and the theory of the corporation, Bell Journal of Economics, vol. 11, 42-64. Gugler, K., and Yurtoglu, B. B, (2003), “Average q, marginal q, and the relation between ownership and performance.” Economics Letters, vol. 78, no. 3, 379-384. Gugler, K., Mueller, D. C. and Yurtoglu, B. B., (2002), ”Corporate Goverance, Capital Market Discipline and Return on Investments,” miemo Universty of Vienna. Hayashi, F., (1982), “Tobin’s Marginal q and Average q: A Neoclassical Interpretation,” Econometrica, vol. 50, no. 1, 213-224. Henrekson, M. and Jakobsson, U., (2006), Den svenska modellen för företagsägande och företagskontroll vid skiljevägen, Institutet för näringslivsforskning, Policy Paper No. 1, Stockholm. Högfeldt, P., (2004), The History of Politics of Corporate Ownership in Sweden, NBER Working Paper No. 10641. Jensen, J. and Meckling, W., (1976), “Theory of the firm; managerial behavior, agency costs and ownership structure,” Journal of Financial Economics, vol. 3, no. 4, 305-360.

- 29 -
La Porta, R., Lopez-de-Silanes, F. and Shleifer, A., (1999), ”Corporate Ownership around the World,” Journal of Finance, vol. 54, no. 2, 471-517. La Porta, R., Lopez-de-Silanes, F., Shleifer, A. and Vishny, R. W., (1998), ”Law and Finance,” Journal of Political Economy, vol. 106, no. 6, 1113-1155. La Porta, R., Lopez-de-Silanes, F., Shleifer, A. and Vishny, R. W., (1997), ”Legal Determinants of External Finance,” Journal of Finance, vol. 52, no. 3, 1131-1150. Lo, A. W., (2004), The Adaptive Market Hypothesis: Market Efficiency from an Evolutionary Perspective, Journal of Portfolio Management, vol. 30, 15-29. Loderer, C. and Martin, K., (1997), “Executive Stock Ownership and Performance: Tracking Faint Traces,” Journal of Financial Economics, vol. 45, no. 2, 223-255. McConnell, J. J. and Servaes, H., (1990), “Additional Evidence on Equity Ownership and Corporate Value,” Journal of Financial Economics, vol. 27, no. 2, 595-612. Manne, H., (1965), “Mergers and the Market for Corporate Control,” Journal of Political Economy, vol. 75, no. 2, 110-120. Maury, B. and Pajuste, A., (2004), Multiple Large Shareholders and Firm Value, SSRN working paper series. Morck, R., Shleifer, A. and Vishny, R., (1988), Management Ownership and Market Valuation: An Empirical Analysis,” Journal of Financial Economics, vol. 20, no. 1, 293-316. Morck, R., Wolfenzon, D. and Yeung, B., (2005), “Corporate Governance, Economic, Entrenchment, and Growth,” Journal of Economic Literature, vol. 43, no. 3, 655-720. Mueller, D. C., (2003), The Corporation; Investments, mergers and growth, Routledge, London. Mueller, D. C. and Reardon, E. A., (1993), “Rates of Return on Corporate Investment,” Southern Economic Journal, vol. 60, no. 2, 430-453. Shleifer, A. and Vishny, R. W., (1997), “A Survey of Corporate Governance,” Journal of Finance, vol. 52, no. 2, 737-783. Smith, A., (1776), An Inquiry into the Nature and Causes of the Wealth of Nations. Modern Library (2000), New York. Söderström, H. T., (ed.) Berglöf, E., Holmström B., Högfeldt, P. and Mayersson Milgrom, E. M., (2003), Ägarmakt och omvandling - Den svenska modellen utmanad, Ekonomirådets rapport 2003, SNS, Stockholm. Stulz, R. M., (1988), Managerial Control of Voting Rights, Financing Policies and the Market for Corporate Control, Journal of Financial Economics, vol. 20, 25-54.
- 30 -
Tobin, J., (1984), “On the Efficiency of Financial Systems,” Lloyd’s Banking Review. 153, vol. 1, no. 1, 1-15. Veblen, T., (1921), The Engineers and the Price System, Viking, New York.

- 31 -
Appendix 1 Nordic qm’s (1999-2005)
Dependent variable: (Mt – Mt-1)/Mt-1
Constant, ( = δ)
- 0.034** (-2.25)
- 0.039** (-2.52)
It / Mt-1 0.868*** (27.79)
0.794*** (34.06)
Denmark* It / Mt-1
- 0.205*** (-5.32)
Norway* It / Mt-1
0.244*** (4.87)
Finland* It / Mt-1 0.057 (0.88)
Sweden* It / Mt-1 - 0.097*** (-2.85)
No. obs. 1963 1963 No. firms 292 292 R2 0.48 0.47 R2-adjusted 0.46 0.45 F-value 32.45 32.78
*** indicates significance at 1 percent, ** at 5 percent and * at 10 percent level. t-values in brackets. Since no ownership variables are included more observation could be obtained. Data for 292 firms between 1999 and 2005 were available. 41 observations have been identifies as outliers and consequently deleted. The regressions in Table 3 were estimated with country specific intercepts, δ, for the; these were however insignificant and were therefore dropped out of the regression. In order to test for national differences in marginal q, country dummy variables were interacted with It/Mt-1, (see equation (7)). These too were also estimated under the restriction to sum to zero, such that the country effects measures the deviation from the average Nordic marginal q.
OLS-estimation, Dual-class shares and Tobin’s q
Dependent variable: Tobin’s Q
Dual-class shares - 0.347** (- 2.16)
Sales - 0.000 (- 0.55)
Growth in Sales - 0.014*** (2.90)
Constant 1.554*** (13.7)
No. obs. 142 R2 0.10 F-value 4.96
*** and ** indicates significance at 1 and 5 percent respectively. t-values in brackets. The regression is made with data available for 2004.