
One Pass Distinct Sampling - Oracle Scratchpad | Just ... procedures in dbms_stats package ... One...
67
Amit Poddar http://www.oraclegeek.net One Pass Distinct Sampling
Transcript of One Pass Distinct Sampling - Oracle Scratchpad | Just ... procedures in dbms_stats package ... One...
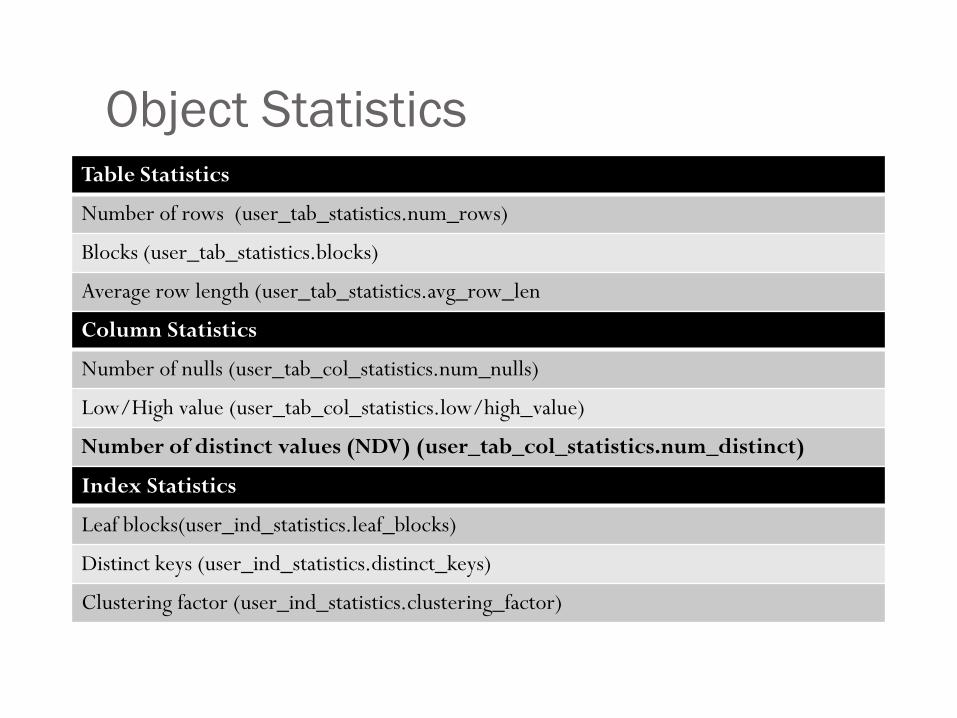
Object StatisticsTable Statistics
Number of rows (user_tab_statistics.num_rows)
Blocks (user_tab_statistics.blocks)
Average row length (user_tab_statistics.avg_row_len
Column Statistics
Number of nulls (user_tab_col_statistics.num_nulls)
Low/High value (user_tab_col_statistics.low/high_value)
Number of distinct values (NDV) (user_tab_col_statistics.num_distinct)
Index Statistics
Leaf blocks(user_ind_statistics.leaf_blocks)
Distinct keys (user_ind_statistics.distinct_keys)
Clustering factor (user_ind_statistics.clustering_factor)
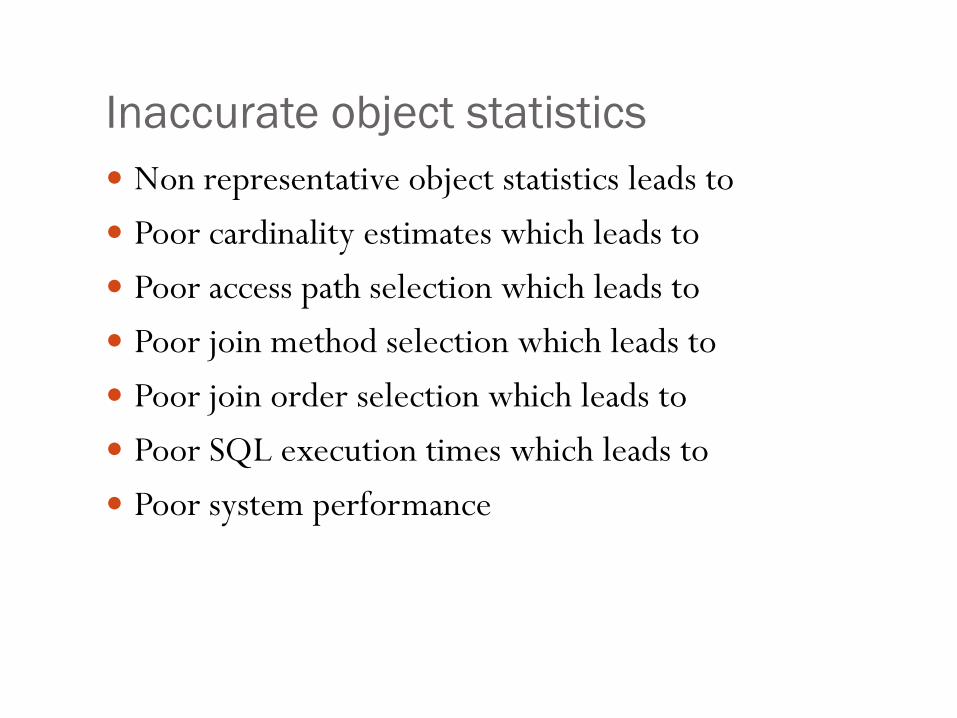
Inaccurate object statistics
Non representative object statistics leads to
Poor cardinality estimates which leads to
Poor access path selection which leads to
Poor join method selection which leads to
Poor join order selection which leads to
Poor SQL execution times which leads to
Poor system performance
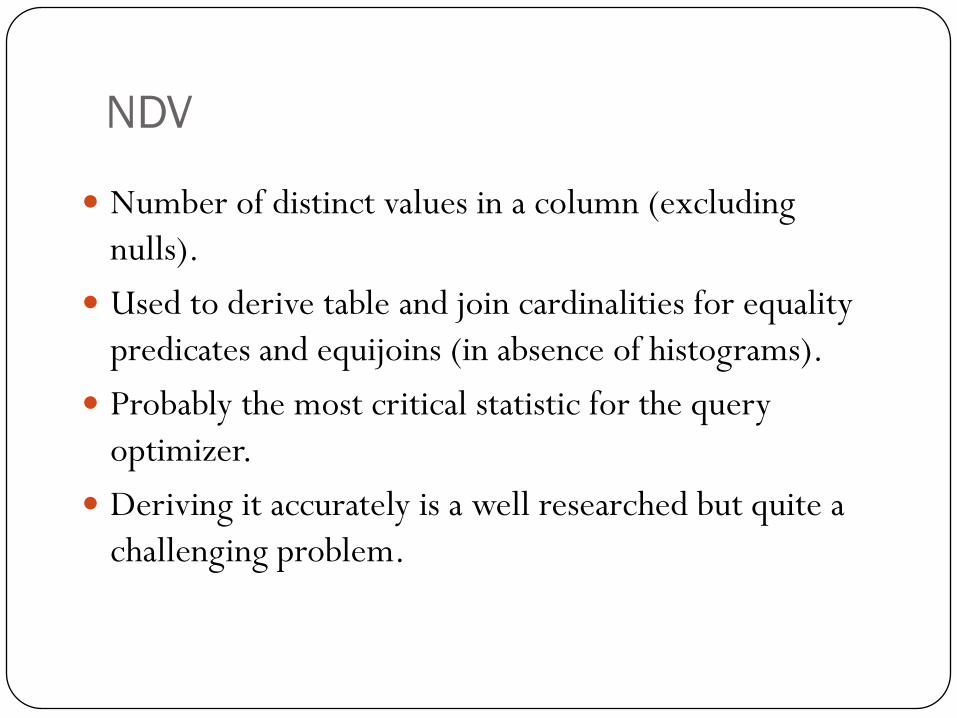
NDV
Number of distinct values in a column (excluding
nulls).
Used to derive table and join cardinalities for equality
predicates and equijoins (in absence of histograms).
Probably the most critical statistic for the query
optimizer.
Deriving it accurately is a well researched but quite a
challenging problem.
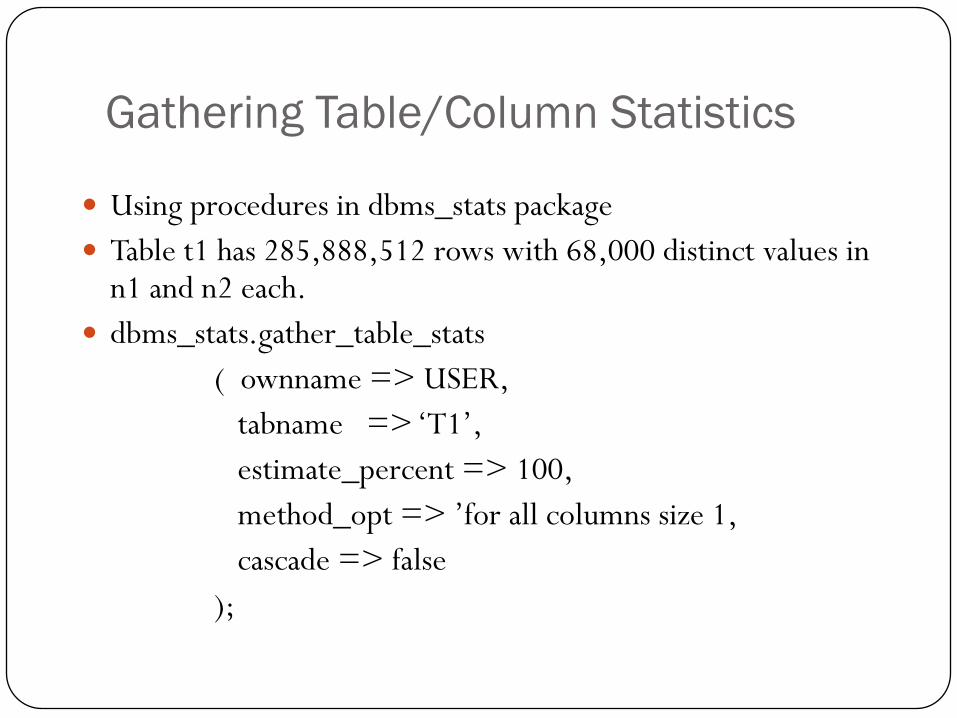
Gathering Table/Column Statistics
Using procedures in dbms_stats package
Table t1 has 285,888,512 rows with 68,000 distinct values in n1 and n2 each.
dbms_stats.gather_table_stats
( ownname => USER,
tabname => „T1‟,
estimate_percent => 100,
method_opt => ‟for all columns size 1,
cascade => false
);
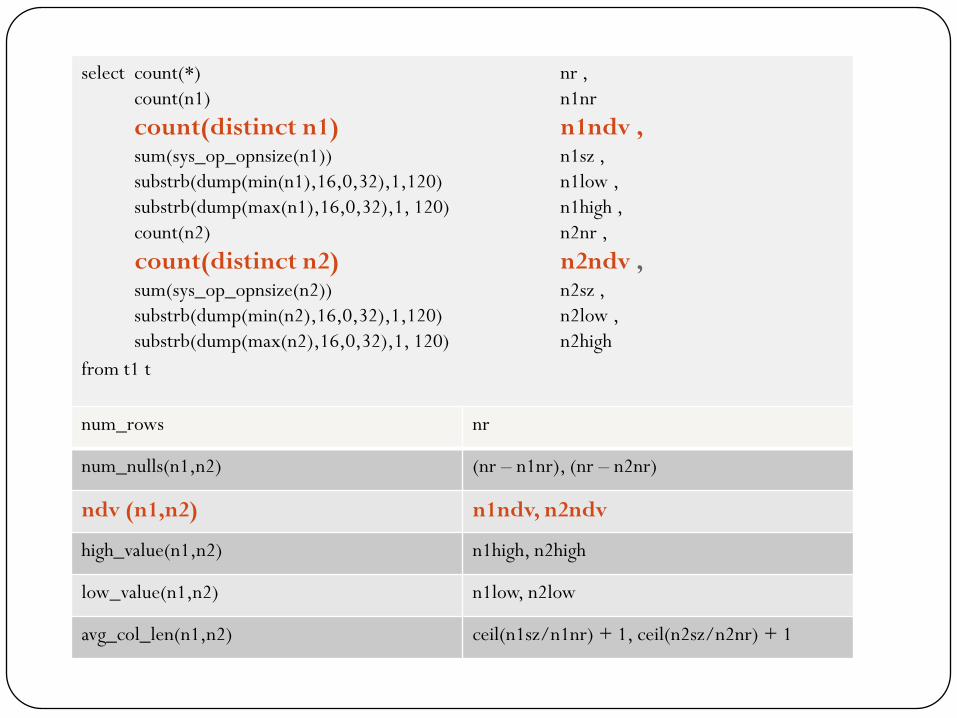
select count(*) nr ,
count(n1) n1nr ,
count(distinct n1) n1ndv , sum(sys_op_opnsize(n1)) n1sz ,
substrb(dump(min(n1),16,0,32),1,120) n1low ,
substrb(dump(max(n1),16,0,32),1, 120) n1high ,
count(n2) n2nr ,
count(distinct n2) n2ndv , sum(sys_op_opnsize(n2)) n2sz ,
substrb(dump(min(n2),16,0,32),1,120) n2low ,
substrb(dump(max(n2),16,0,32),1, 120) n2high
from t1 t
num_rows nr
num_nulls(n1,n2) (nr – n1nr), (nr – n2nr)
ndv (n1,n2) n1ndv, n2ndv
high_value(n1,n2) n1high, n2high
low_value(n1,n2) n1low, n2low
avg_col_len(n1,n2) ceil(n1sz/n1nr) + 1, ceil(n2sz/n2nr) + 1
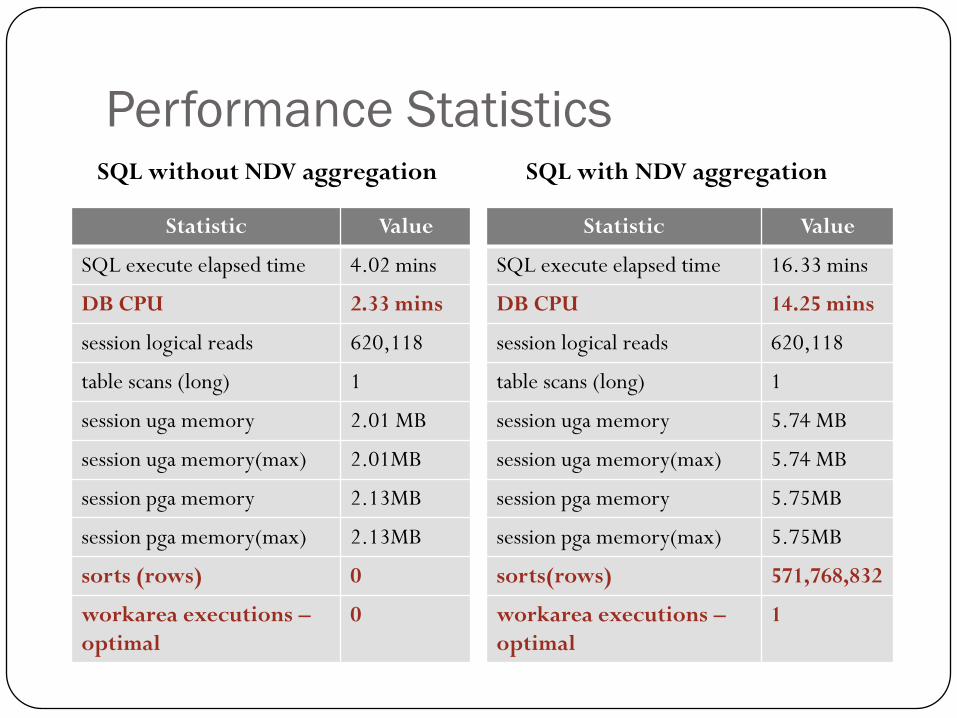
Performance StatisticsSQL without NDV aggregation SQL with NDV aggregation
Statistic Value
SQL execute elapsed time 4.02 mins
DB CPU 2.33 mins
session logical reads 620,118
table scans (long) 1
session uga memory 2.01 MB
session uga memory(max) 2.01MB
session pga memory 2.13MB
session pga memory(max) 2.13MB
sorts (rows) 0
workarea executions –
optimal
0
Statistic Value
SQL execute elapsed time 16.33 mins
DB CPU 14.25 mins
session logical reads 620,118
table scans (long) 1
session uga memory 5.74 MB
session uga memory(max) 5.74 MB
session pga memory 5.75MB
session pga memory(max) 5.75MB
sorts(rows) 571,768,832
workarea executions –
optimal
1
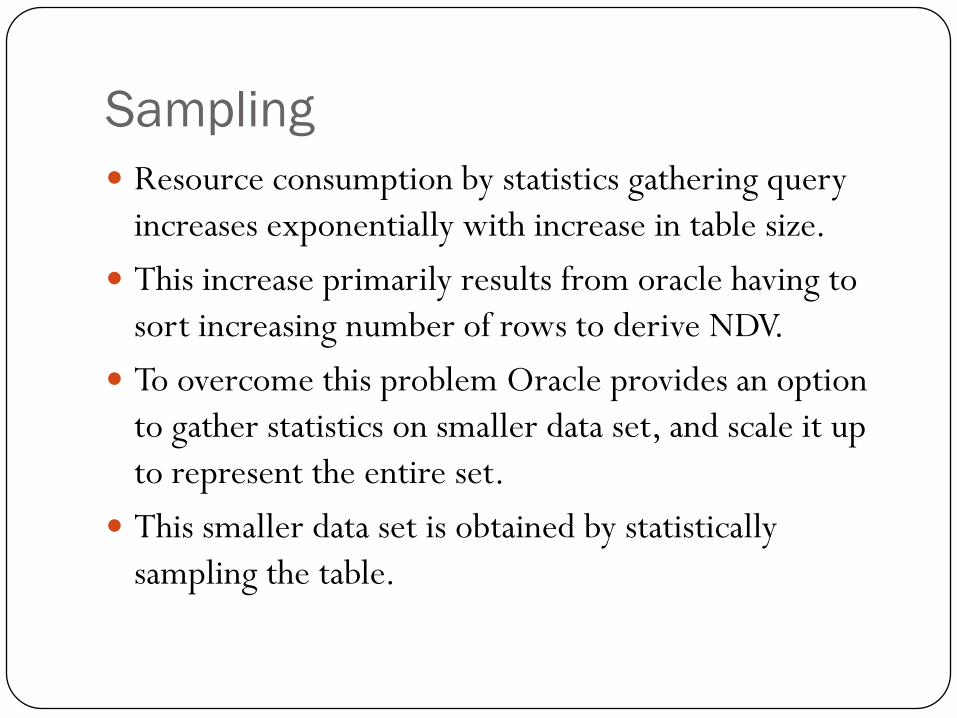
Sampling
Resource consumption by statistics gathering query
increases exponentially with increase in table size.
This increase primarily results from oracle having to
sort increasing number of rows to derive NDV.
To overcome this problem Oracle provides an option
to gather statistics on smaller data set, and scale it up
to represent the entire set.
This smaller data set is obtained by statistically
sampling the table.
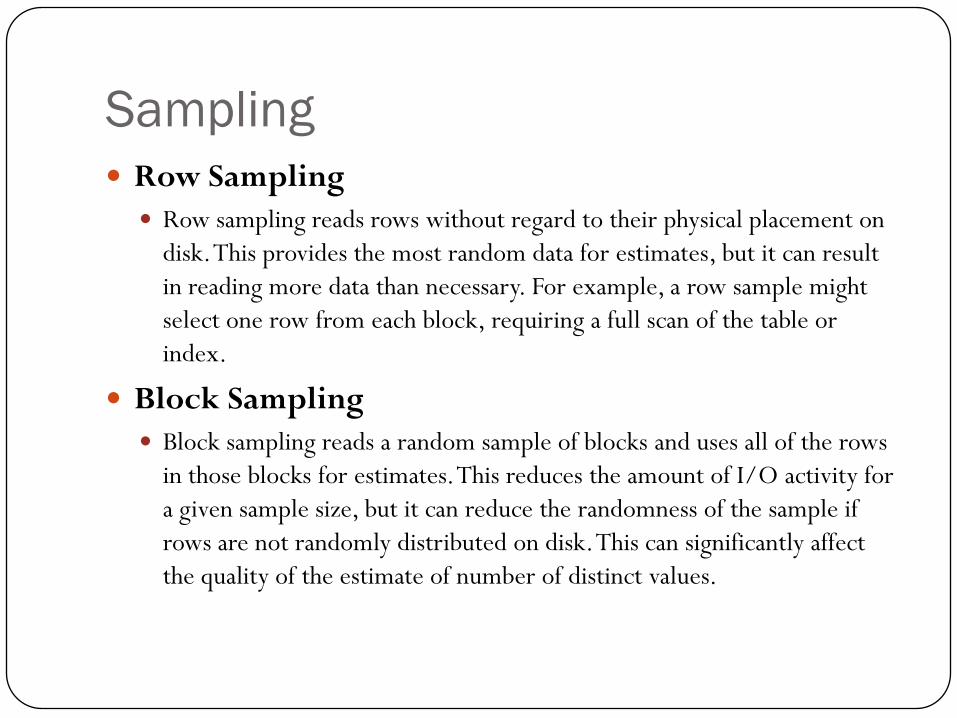
Sampling
Row Sampling
Row sampling reads rows without regard to their physical placement on
disk. This provides the most random data for estimates, but it can result
in reading more data than necessary. For example, a row sample might
select one row from each block, requiring a full scan of the table or
index.
Block Sampling
Block sampling reads a random sample of blocks and uses all of the rows
in those blocks for estimates. This reduces the amount of I/O activity for
a given sample size, but it can reduce the randomness of the sample if
rows are not randomly distributed on disk. This can significantly affect
the quality of the estimate of number of distinct values.
Row Sampling
Each row has a probability ρ of making into the sample where ρ =
Sampling Percent/100.
Sample size is normally distributed with mean (μ) = N*ρ and variance
(σ2) = N*ρ*(1- ρ).
Scans the entire table for all practical purposes.
Assumes uniform distribution of distinct values i.e. each distinct value has
the same cardinality.
In a non uniform distribution, values with higher cardinality has a higher
probability of making into the sample which makes it much more difficult
to get a representative sample of all the distinct values.
Accuracy of NDV derived is good with bounded variance for uniform and
close to uniform distributions. But is no guarantee of accuracy of the
derived NDV in cases of non uniform distribution.
µ - 2σ (644)
µ (696)
µ + 2σ (748)
0
0.002
0.004
0.006
0.008
0.01
0.012
0.014
0.016
0.018
600 620 640 660 680 700 720 740 760 780 800
Pro
bab
ilit
y O
f O
ccu
ren
ce
Sample Size (Number of Rows)
N = 69635
p = 0.01
n = 1000000
µ = (N*p) = 696
σ² = (N * p * (p-1)) = 626
σ = (√N * p * (p-1)) =26
CI = µ - 2σ < Sn < µ + 2σ
CL = 95%
p - 2∆ <= Sn//N <= p + 2∆(95% of all values)
where ∆ = (p*(p-1)/N)1/2
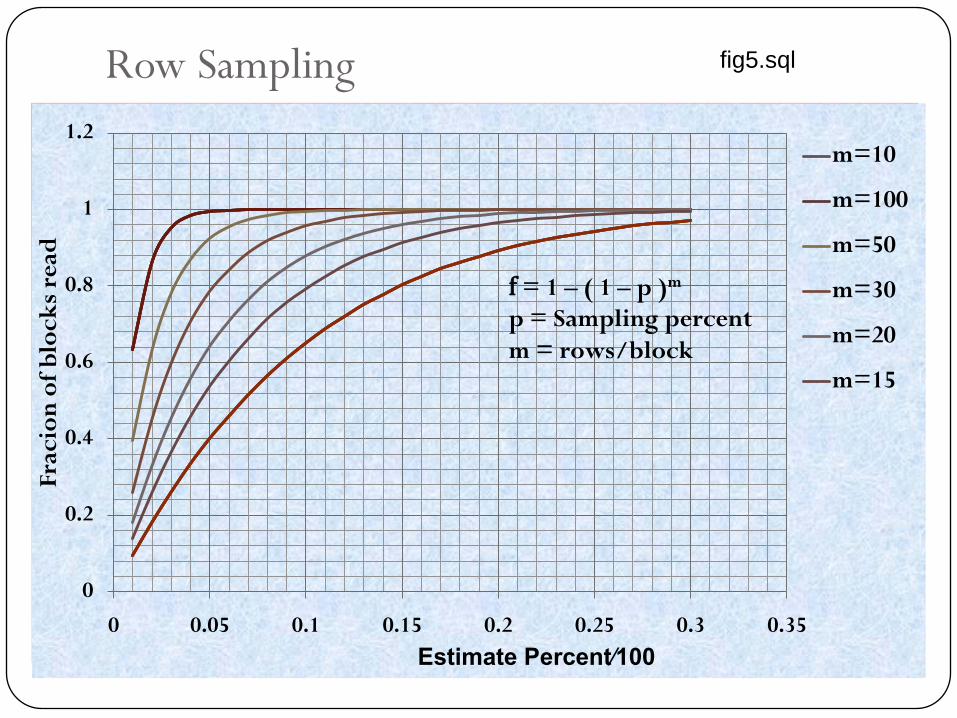
0
0.2
0.4
0.6
0.8
1
1.2
0 0.05 0.1 0.15 0.2 0.25 0.3 0.35
Fra
cio
n o
f b
loc
ks
read
Estimate Percent∕100
m=10
m=100
m=50
m=30
m=20
m=15
f = 1 – ( 1 – p )m
p = Sampling percent
m = rows/block
fig5.sql
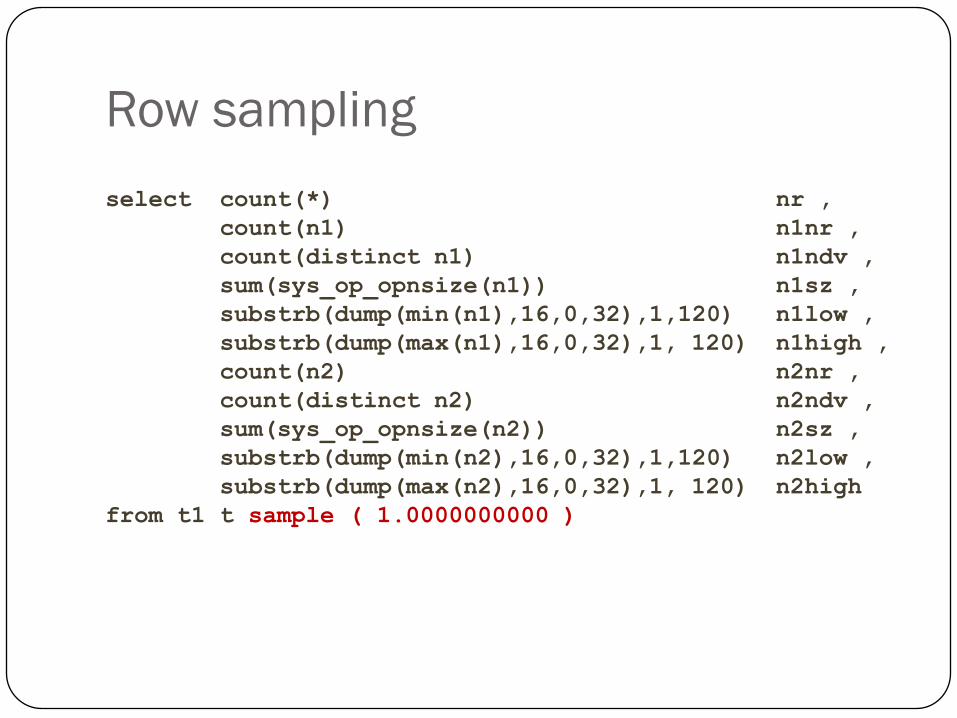
Row sampling
select count(*) nr ,
count(n1) n1nr ,
count(distinct n1) n1ndv ,
sum(sys_op_opnsize(n1)) n1sz ,
substrb(dump(min(n1),16,0,32),1,120) n1low ,
substrb(dump(max(n1),16,0,32),1, 120) n1high ,
count(n2) n2nr ,
count(distinct n2) n2ndv ,
sum(sys_op_opnsize(n2)) n2sz ,
substrb(dump(min(n2),16,0,32),1,120) n2low ,
substrb(dump(max(n2),16,0,32),1, 120) n2high
from t1 t sample ( 1.0000000000 )
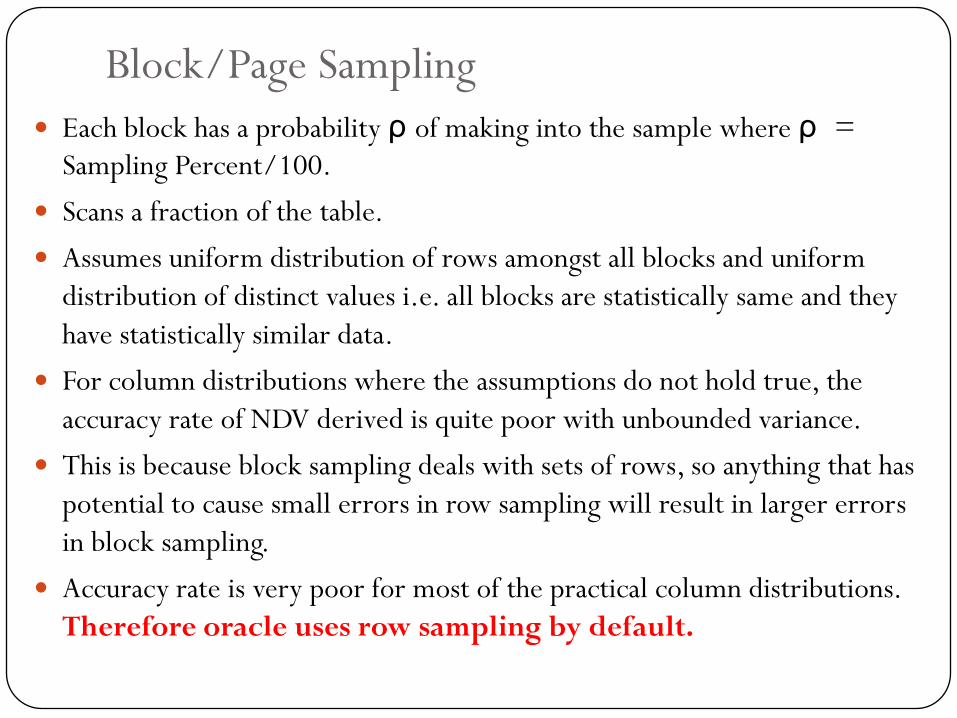
Block/Page Sampling
Each block has a probability ρ of making into the sample where ρ =
Sampling Percent/100.
Scans a fraction of the table.
Assumes uniform distribution of rows amongst all blocks and uniform
distribution of distinct values i.e. all blocks are statistically same and they
have statistically similar data.
For column distributions where the assumptions do not hold true, the
accuracy rate of NDV derived is quite poor with unbounded variance.
This is because block sampling deals with sets of rows, so anything that has
potential to cause small errors in row sampling will result in larger errors
in block sampling.
Accuracy rate is very poor for most of the practical column distributions.
Therefore oracle uses row sampling by default.
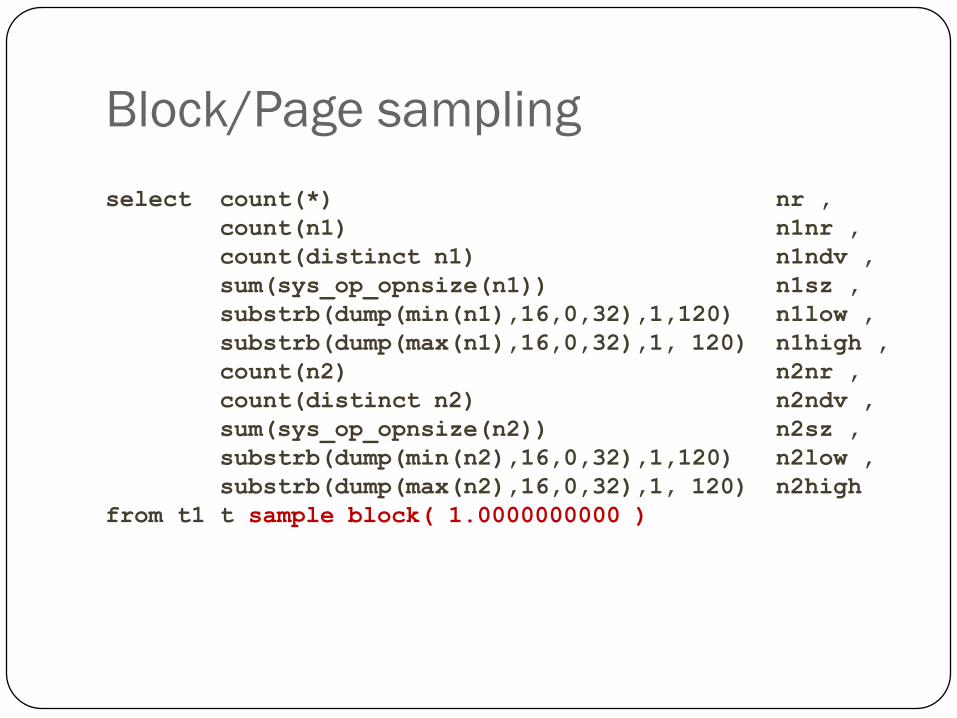
Block/Page sampling
select count(*) nr ,
count(n1) n1nr ,
count(distinct n1) n1ndv ,
sum(sys_op_opnsize(n1)) n1sz ,
substrb(dump(min(n1),16,0,32),1,120) n1low ,
substrb(dump(max(n1),16,0,32),1, 120) n1high ,
count(n2) n2nr ,
count(distinct n2) n2ndv ,
sum(sys_op_opnsize(n2)) n2sz ,
substrb(dump(min(n2),16,0,32),1,120) n2low ,
substrb(dump(max(n2),16,0,32),1, 120) n2high
from t1 t sample block( 1.0000000000 )
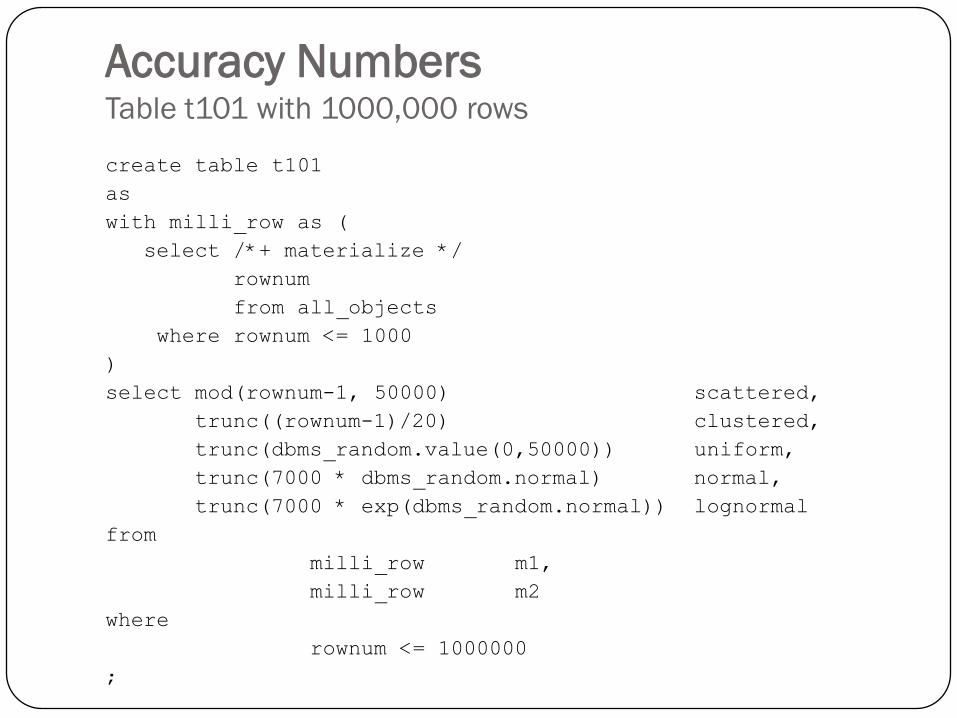
Accuracy NumbersTable t101 with 1000,000 rows
Scattered
Each distinct value has the
same cardinality (i.e. 20) and
they are distributed uniformly
amongst all the table blocks.
Clustered
Each distinct value has the
same cardinality (i.e. 20) but
they are clustered in groups.
Each block has very few
distinct values.
Scattered and Clustered
Uniform
There are 50,000 distinct
values and they are spread
evenly i.e. each distinct
value has similar cardinality
Uses dbms_random.random
procedure to distribute the
values uniformly amongst all
the rows.
Uniform Normal
Cardinality of distinct values
are distributed normally
This distribution is generated
by using the “normal
distribution” function
available in dbms_random
package (i.e.
dbms_random.normal).
Normal Lognormal
Cardinality of distinct values
are distributed log normally
i.e. Logarithms of the
cardinalities is normally
distributed
This distribution is the value
obtained by exponentiation
of dbms_random.normal to
the base of natural logarithm
“e”.
Lognormalcreate table t101
as
with milli_row as (
select /*+ materialize */
rownum
from all_objects
where rownum <= 1000
)
select mod(rownum-1, 50000) scattered,
trunc((rownum-1)/20) clustered,
trunc(dbms_random.value(0,50000)) uniform,
trunc(7000 * dbms_random.normal) normal,
trunc(7000 * exp(dbms_random.normal)) lognormal
from
milli_row m1,
milli_row m2
where
rownum <= 1000000
;
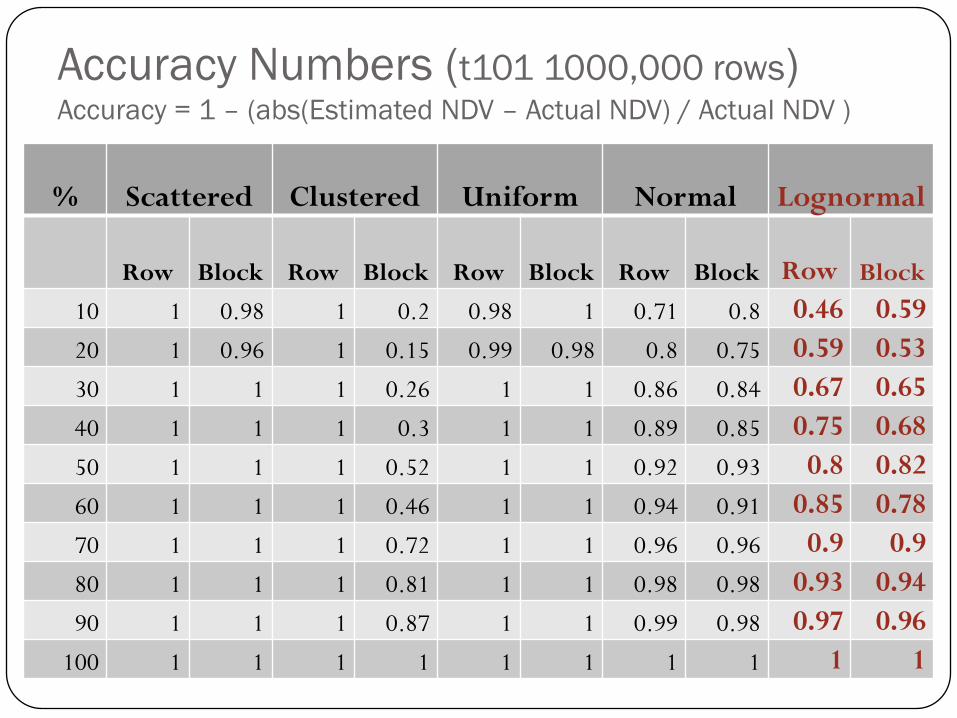
Accuracy Numbers (t101 1000,000 rows)Accuracy = 1 – (abs(Estimated NDV – Actual NDV) / Actual NDV )
% Scattered Clustered Uniform Normal Lognormal
Row Block Row Block Row Block Row Block Row Block
10 1 0.98 1 0.2 0.98 1 0.71 0.8 0.46 0.59
20 1 0.96 1 0.15 0.99 0.98 0.8 0.75 0.59 0.53
30 1 1 1 0.26 1 1 0.86 0.84 0.67 0.65
40 1 1 1 0.3 1 1 0.89 0.85 0.75 0.68
50 1 1 1 0.52 1 1 0.92 0.93 0.8 0.82
60 1 1 1 0.46 1 1 0.94 0.91 0.85 0.78
70 1 1 1 0.72 1 1 0.96 0.96 0.9 0.9
80 1 1 1 0.81 1 1 0.98 0.98 0.93 0.94
90 1 1 1 0.87 1 1 0.99 0.98 0.97 0.96
100 1 1 1 1 1 1 1 1 1 1
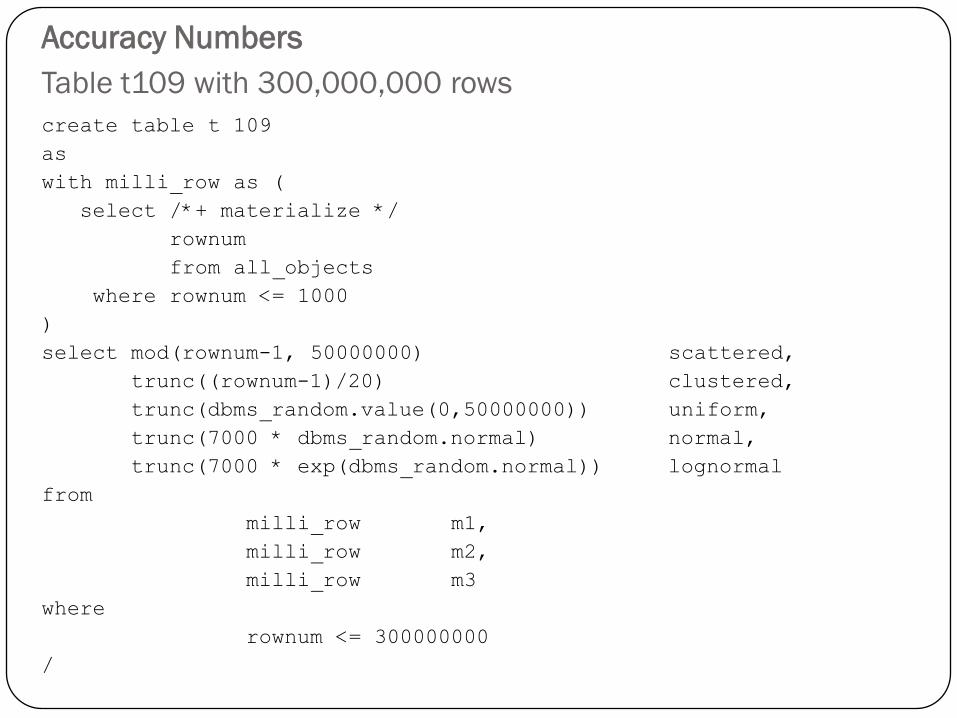
Accuracy Numbers
Table t109 with 300,000,000 rows
create table t 109
as
with milli_row as (
select /*+ materialize */
rownum
from all_objects
where rownum <= 1000
)
select mod(rownum-1, 50000000) scattered,
trunc((rownum-1)/20) clustered,
trunc(dbms_random.value(0,50000000)) uniform,
trunc(7000 * dbms_random.normal) normal,
trunc(7000 * exp(dbms_random.normal)) lognormal
from
milli_row m1,
milli_row m2,
milli_row m3
where
rownum <= 300000000
/
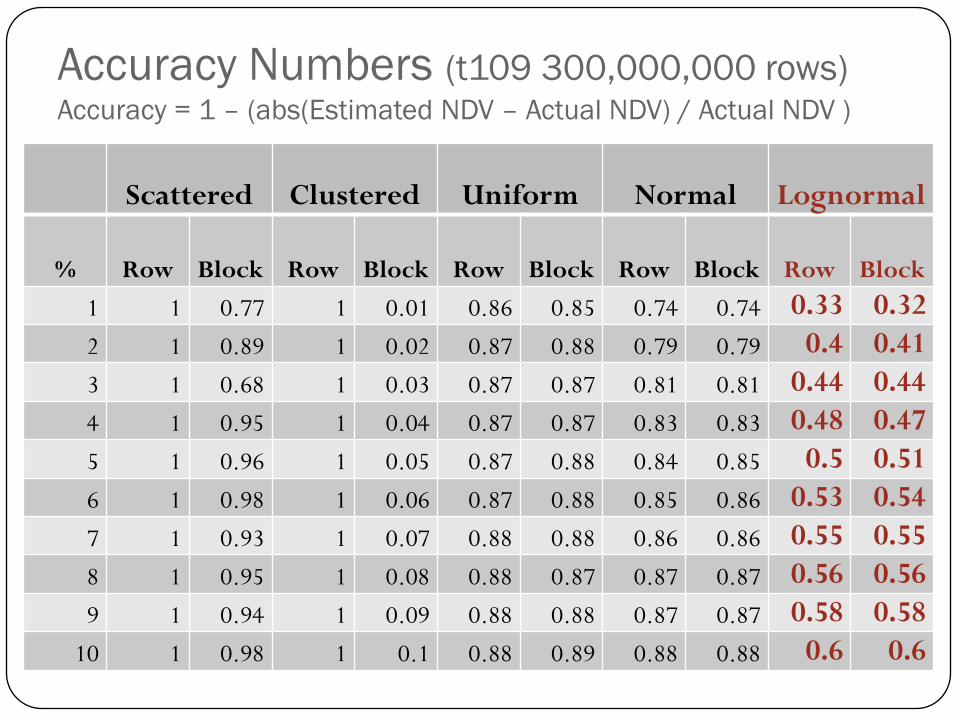
Accuracy Numbers (t109 300,000,000 rows)Accuracy = 1 – (abs(Estimated NDV – Actual NDV) / Actual NDV )
Scattered Clustered Uniform Normal Lognormal
% Row Block Row Block Row Block Row Block Row Block
1 1 0.77 1 0.01 0.86 0.85 0.74 0.74 0.33 0.32
2 1 0.89 1 0.02 0.87 0.88 0.79 0.79 0.4 0.41
3 1 0.68 1 0.03 0.87 0.87 0.81 0.81 0.44 0.44
4 1 0.95 1 0.04 0.87 0.87 0.83 0.83 0.48 0.47
5 1 0.96 1 0.05 0.87 0.88 0.84 0.85 0.5 0.51
6 1 0.98 1 0.06 0.87 0.88 0.85 0.86 0.53 0.54
7 1 0.93 1 0.07 0.88 0.88 0.86 0.86 0.55 0.55
8 1 0.95 1 0.08 0.88 0.87 0.87 0.87 0.56 0.56
9 1 0.94 1 0.09 0.88 0.88 0.87 0.87 0.58 0.58
10 1 0.98 1 0.1 0.88 0.89 0.88 0.88 0.6 0.6
Row Sampling drawbacks Randomness in sampling results in randomness in sample sizes. This can
result in over/under estimation of NDV. The error due to this problem is
generally very low in row sampling, but can be significant in case of block
sampling.
Accuracy and variance of derived NDV is highly dependent on the data
distribution in the column.
Different kinds of data distribution may need different sample sizes.
Maintaining different sample sizes for different tables (may be for
different columns in the same table) can be a maintenance nightmare for
the DBA.
Row Sampling treats all the rows the same. That means every row has an
equal chance of making it to the sample which is good for calculating
number of rows in the table but it can be very inaccurate for calculating
number of distinct values in a column.
Inaccurate NDV workarounds
Hints
Outlines (9i and 10g)
SQL Profiles (10g)
dbms_stats.set_column_stats
Dynamic Sampling (9i and 10g)
Adaptive sampling by dbms_stats (9i and 10g)
Distinct Sampling
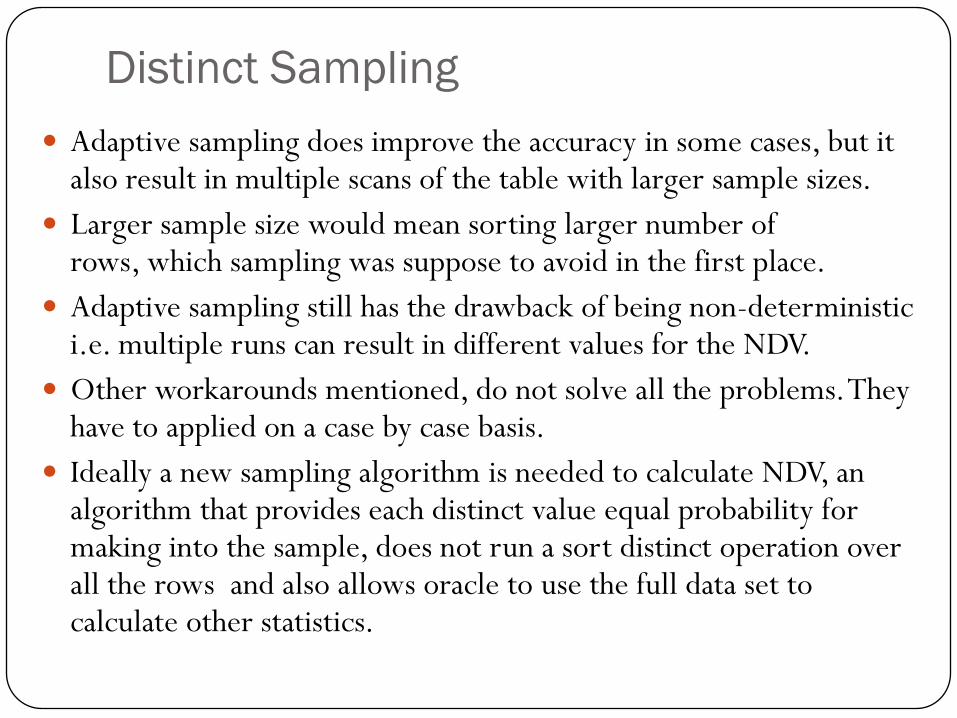
Adaptive sampling does improve the accuracy in some cases, but it also result in multiple scans of the table with larger sample sizes.
Larger sample size would mean sorting larger number of rows, which sampling was suppose to avoid in the first place.
Adaptive sampling still has the drawback of being non-deterministic i.e. multiple runs can result in different values for the NDV.
Other workarounds mentioned, do not solve all the problems. They have to applied on a case by case basis.
Ideally a new sampling algorithm is needed to calculate NDV, an algorithm that provides each distinct value equal probability for making into the sample, does not run a sort distinct operation over all the rows and also allows oracle to use the full data set to calculate other statistics.
Distinct Sampling
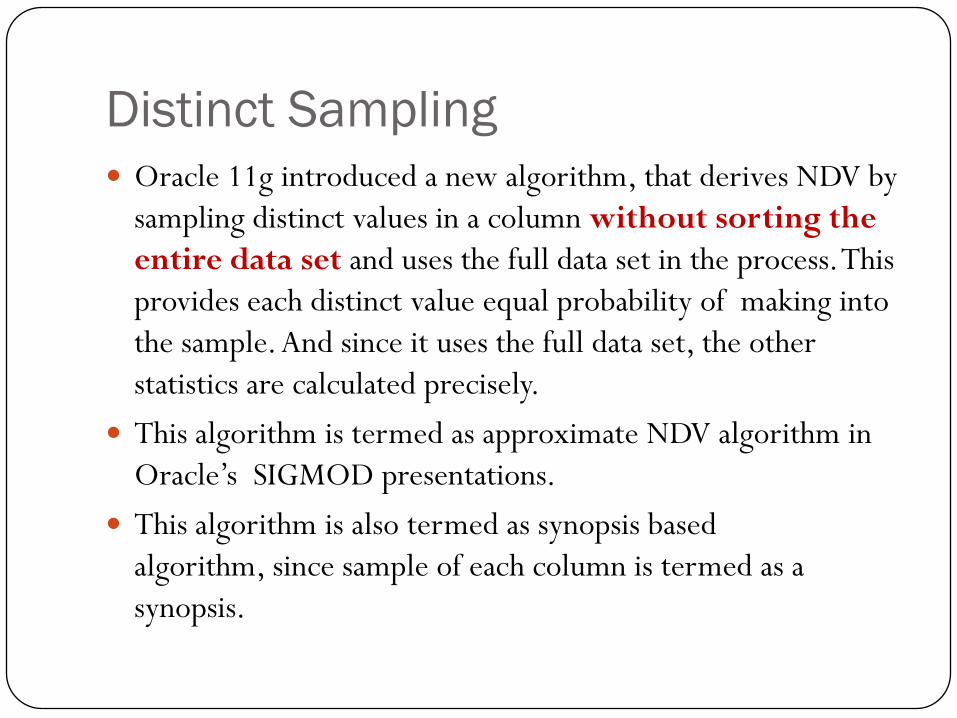
Oracle 11g introduced a new algorithm, that derives NDV by
sampling distinct values in a column without sorting the
entire data set and uses the full data set in the process. This
provides each distinct value equal probability of making into
the sample. And since it uses the full data set, the other
statistics are calculated precisely.
This algorithm is termed as approximate NDV algorithm in
Oracle‟s SIGMOD presentations.
This algorithm is also termed as synopsis based
algorithm, since sample of each column is termed as a
synopsis.
One pass distinct sampling
(Approximate NDV algorithm)
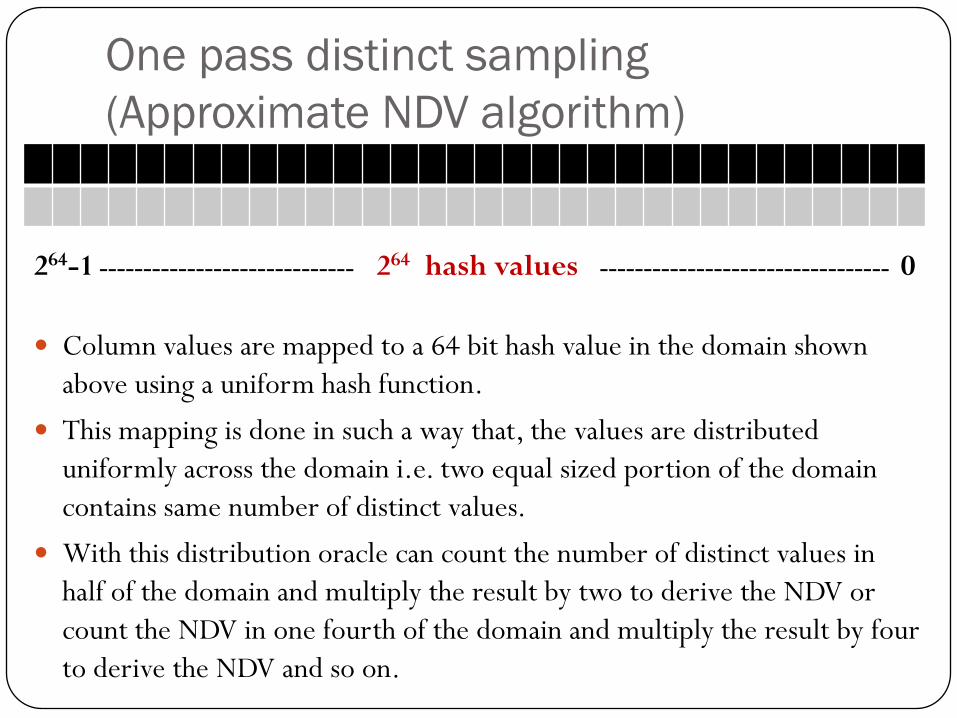
264-1 ----------------------------- 264 hash values --------------------------------- 0
Column values are mapped to a 64 bit hash value in the domain shown
above using a uniform hash function.
This mapping is done in such a way that, the values are distributed
uniformly across the domain i.e. two equal sized portion of the domain
contains same number of distinct values.
With this distribution oracle can count the number of distinct values in
half of the domain and multiply the result by two to derive the NDV or
count the NDV in one fourth of the domain and multiply the result by four
to derive the NDV and so on.
Column synopsis
At the start of the algorithm a memory area is allocated for each column in the table. This memory area is allocated in the PGA.
While scanning the table each column value is mapped to a 64 bit hash value. This hash value is stored in the memory only if it does not exist already.
At the end of the scan, the number of hash values in this memory area is the number of distinct values in the full selected domain which is same as number of distinct values in the column.
This memory area is called column synopsis. The memory consumption by each synopsis is bounded at storing only 16384 hash values. Every time the synopsis reaches its limit oracle splits the selected domain into two parts and discards all the values from lower half of the domain.
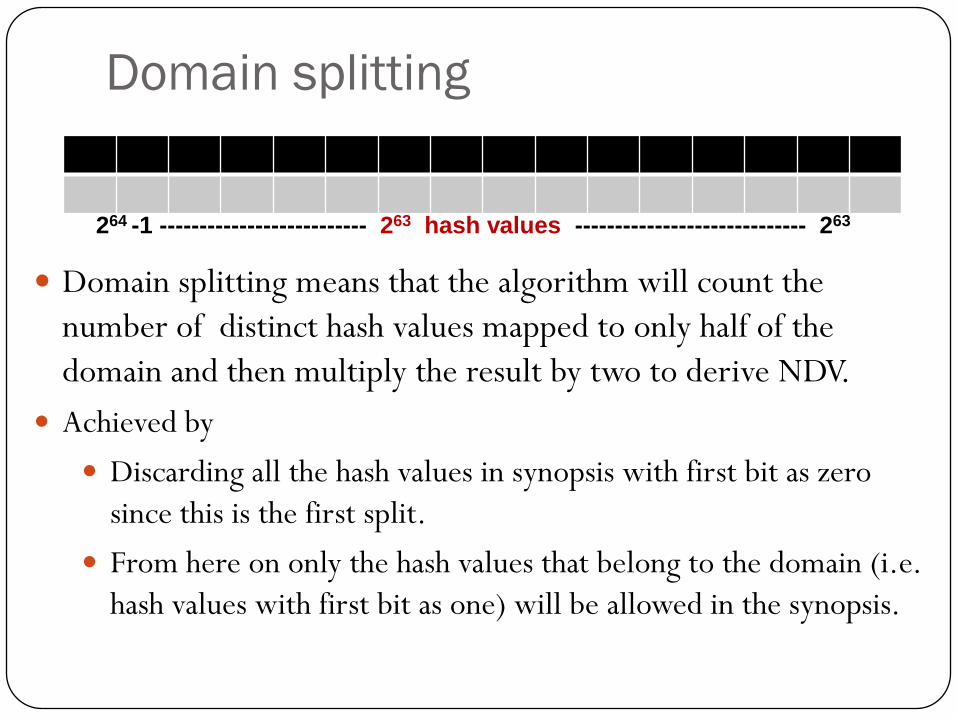
Domain splitting
264 -1 -------------------------- 263 hash values ----------------------------- 263
Domain splitting means that the algorithm will count the
number of distinct hash values mapped to only half of the
domain and then multiply the result by two to derive NDV.
Achieved by
Discarding all the hash values in synopsis with first bit as zero
since this is the first split.
From here on only the hash values that belong to the domain (i.e.
hash values with first bit as one) will be allowed in the synopsis.
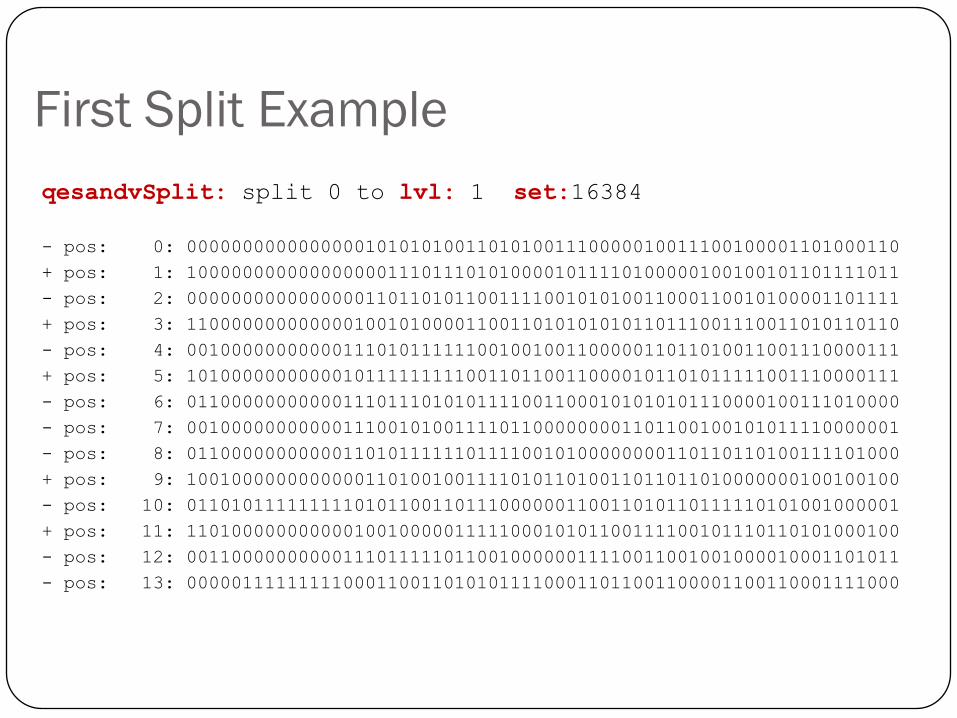
First Split Example
qesandvSplit: split 0 to lvl: 1 set:16384
- pos: 0: 0000000000000000101010100110101001110000010011100100001101000110
+ pos: 1: 1000000000000000001110111010100001011110100000100100101101111011
- pos: 2: 0000000000000000110110101100111100101010011000110010100001101111
+ pos: 3: 1100000000000001001010000110011010101010110111001110011010110110
- pos: 4: 0010000000000011101011111100100100110000011011010011001110000111
+ pos: 5: 1010000000000010111111111001101100110000101101011111001110000111
- pos: 6: 0110000000000011101110101011110011000101010101110000100111010000
- pos: 7: 0010000000000011100101001111011000000001101100100101011110000001
- pos: 8: 0110000000000011010111111011110010100000000110110110100111101000
+ pos: 9: 1001000000000000110100100111101011010011011011010000000100100100
- pos: 10: 0110101111111110101100110111000000110011010110111110101001000001
+ pos: 11: 1101000000000001001000001111100010101100111100101110110101000100
- pos: 12: 0011000000000011101111101100100000011110011001001000010001101011
- pos: 13: 0000011111111100011001101010111100011011001100001100110001111000
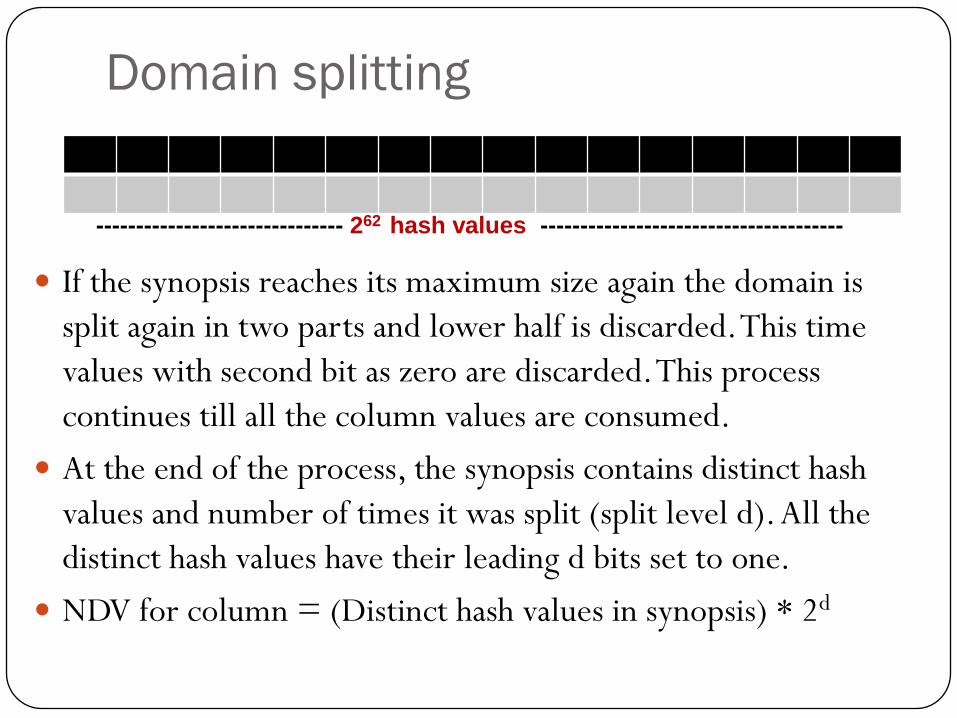
Domain splitting
------------------------------- 262 hash values --------------------------------------
If the synopsis reaches its maximum size again the domain is
split again in two parts and lower half is discarded. This time
values with second bit as zero are discarded. This process
continues till all the column values are consumed.
At the end of the process, the synopsis contains distinct hash
values and number of times it was split (split level d). All the
distinct hash values have their leading d bits set to one.
NDV for column = (Distinct hash values in synopsis) * 2d
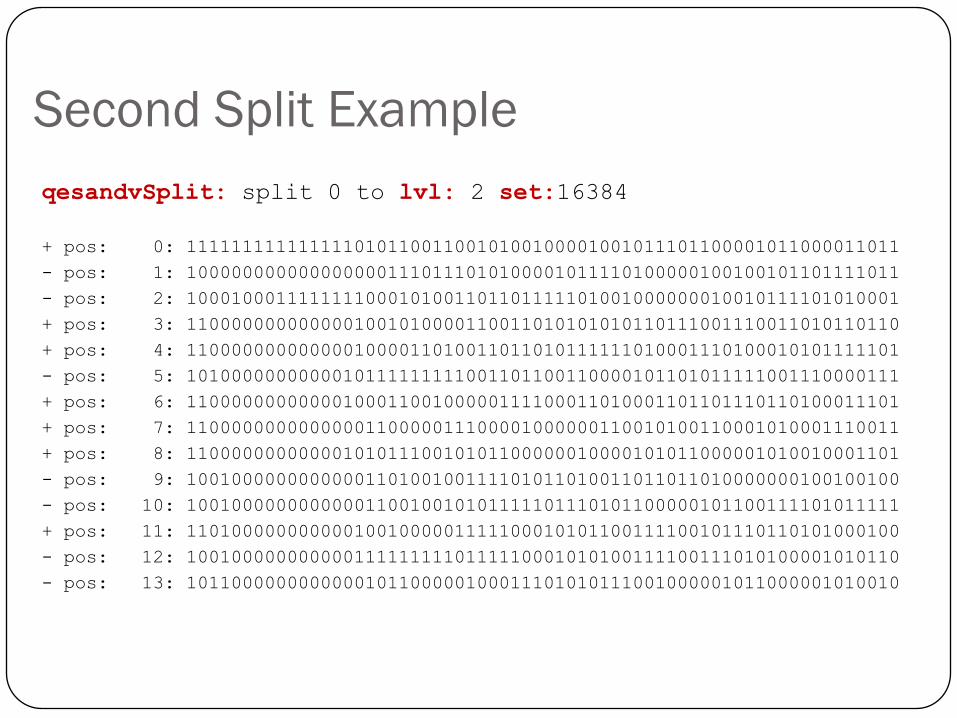
Second Split Example
qesandvSplit: split 0 to lvl: 2 set:16384
+ pos: 0: 1111111111111110101100110010100100001001011101100001011000011011
- pos: 1: 1000000000000000001110111010100001011110100000100100101101111011
- pos: 2: 1000100011111111000101001101101111101001000000010010111101010001
+ pos: 3: 1100000000000001001010000110011010101010110111001110011010110110
+ pos: 4: 1100000000000001000011010011011010111111010001110100010101111101
- pos: 5: 1010000000000010111111111001101100110000101101011111001110000111
+ pos: 6: 1100000000000010001100100000111100011010001101101110110100011101
+ pos: 7: 1100000000000000110000011100001000000110010100110001010001110011
+ pos: 8: 1100000000000010101110010101100000010000101011000001010010001101
- pos: 9: 1001000000000000110100100111101011010011011011010000000100100100
- pos: 10: 1001000000000000110010010101111101110101100000101100111101011111
+ pos: 11: 1101000000000001001000001111100010101100111100101110110101000100
- pos: 12: 1001000000000001111111110111110001010100111100111010100001010110
- pos: 13: 1011000000000000101100000100011101010111001000001011000001010010
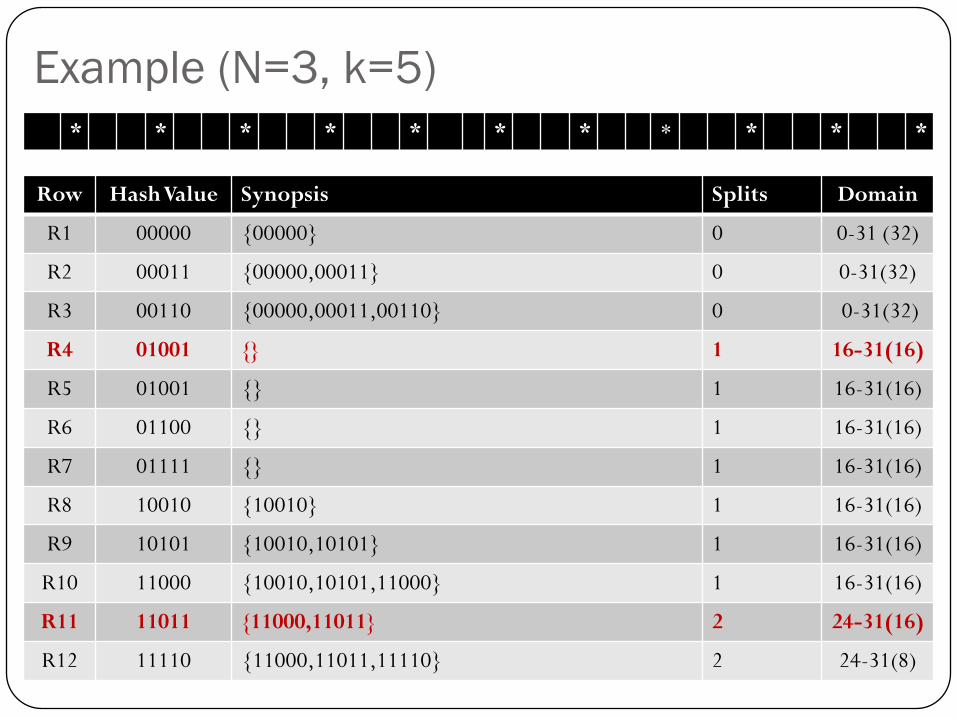
Example (N=3, k=5)
Row Hash Value Synopsis Splits Domain
R1 00000 {00000} 0 0-31 (32)
R2 00011 {00000,00011} 0 0-31(32)
R3 00110 {00000,00011,00110} 0 0-31(32)
R4 01001 {} 1 16-31(16)
R5 01001 {} 1 16-31(16)
R6 01100 {} 1 16-31(16)
R7 01111 {} 1 16-31(16)
R8 10010 {10010} 1 16-31(16)
R9 10101 {10010,10101} 1 16-31(16)
R10 11000 {10010,10101,11000} 1 16-31(16)
R11 11011 {11000,11011} 2 24-31(16)
R12 11110 {11000,11011,11110} 2 24-31(8)
* * * * * * * * * * *
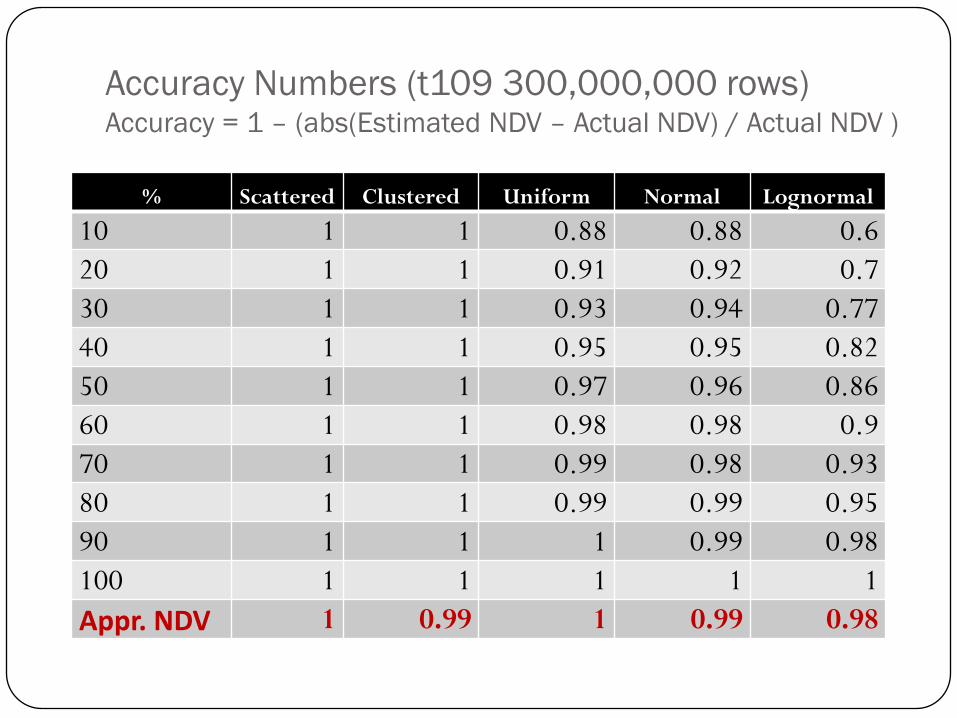
Accuracy Numbers (t109 300,000,000 rows)Accuracy = 1 – (abs(Estimated NDV – Actual NDV) / Actual NDV )
% Scattered Clustered Uniform Normal Lognormal
10 1 1 0.88 0.88 0.6
20 1 1 0.91 0.92 0.7
30 1 1 0.93 0.94 0.77
40 1 1 0.95 0.95 0.82
50 1 1 0.97 0.96 0.86
60 1 1 0.98 0.98 0.9
70 1 1 0.99 0.98 0.93
80 1 1 0.99 0.99 0.95
90 1 1 1 0.99 0.98
100 1 1 1 1 1
Appr. NDV 1 0.99 1 0.99 0.98
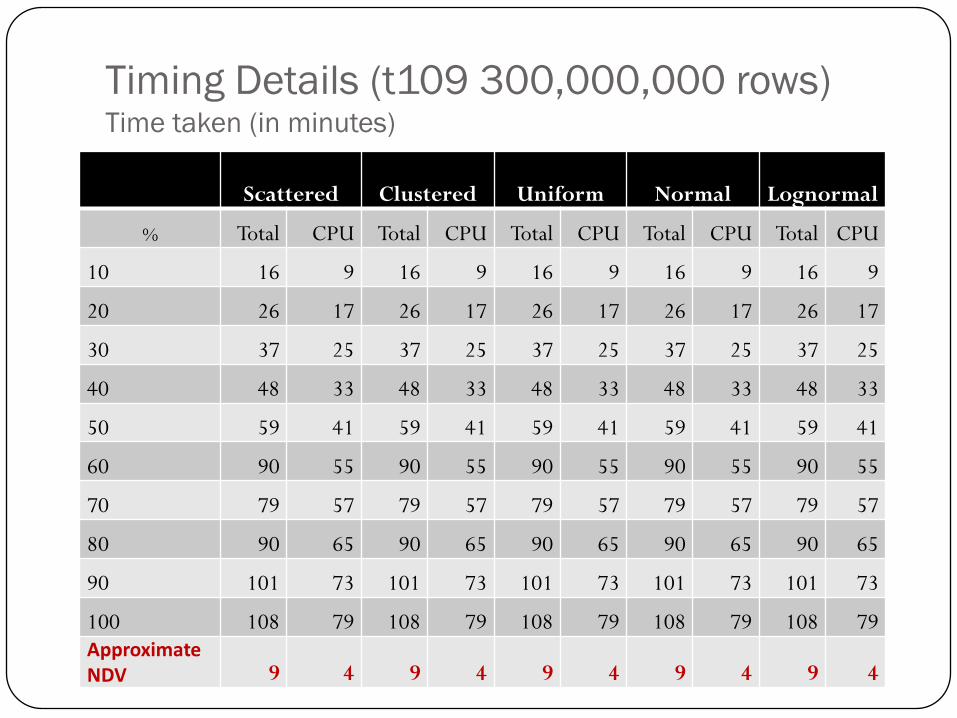
Timing Details (t109 300,000,000 rows)Time taken (in minutes)
Scattered Clustered Uniform Normal Lognormal
% Total CPU Total CPU Total CPU Total CPU Total CPU
10 16 9 16 9 16 9 16 9 16 9
20 26 17 26 17 26 17 26 17 26 17
30 37 25 37 25 37 25 37 25 37 25
40 48 33 48 33 48 33 48 33 48 33
50 59 41 59 41 59 41 59 41 59 41
60 90 55 90 55 90 55 90 55 90 55
70 79 57 79 57 79 57 79 57 79 57
80 90 65 90 65 90 65 90 65 90 65
90 101 73 101 73 101 73 101 73 101 73
100 108 79 108 79 108 79 108 79 108 79ApproximateNDV 9 4 9 4 9 4 9 4 9 4
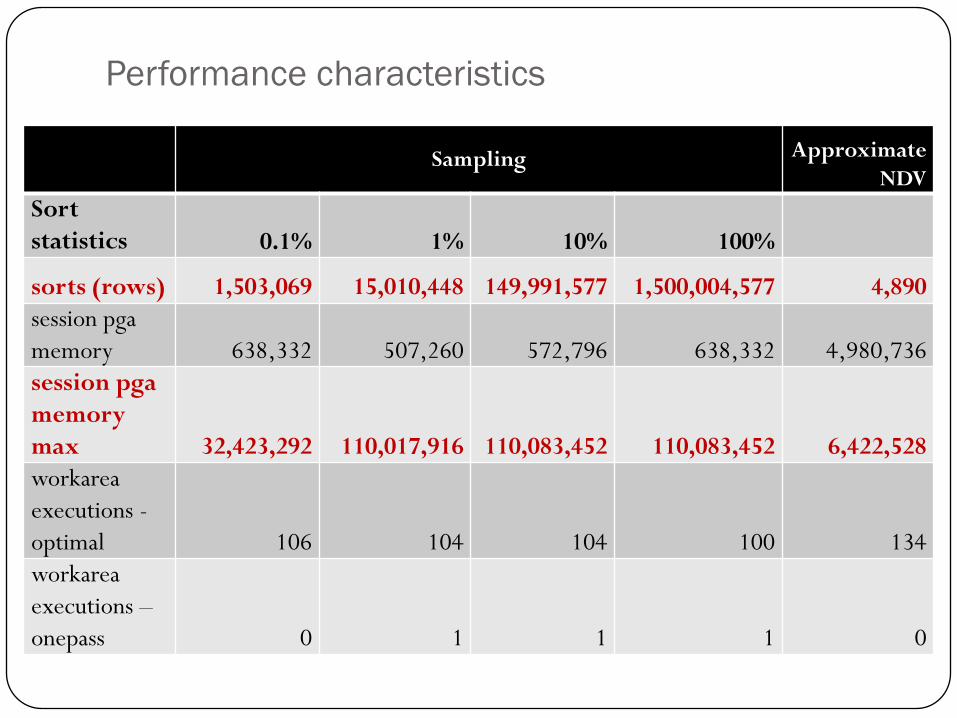
Performance characteristics
Sampling Approximate
NDV
Sort
statistics 0.1% 1% 10% 100%
sorts (rows) 1,503,069 15,010,448 149,991,577 1,500,004,577 4,890
session pga
memory 638,332 507,260 572,796 638,332 4,980,736
session pga
memory
max 32,423,292 110,017,916 110,083,452 110,083,452 6,422,528
workarea
executions -
optimal 106 104 104 100 134
workarea
executions –
onepass 0 1 1 1 0
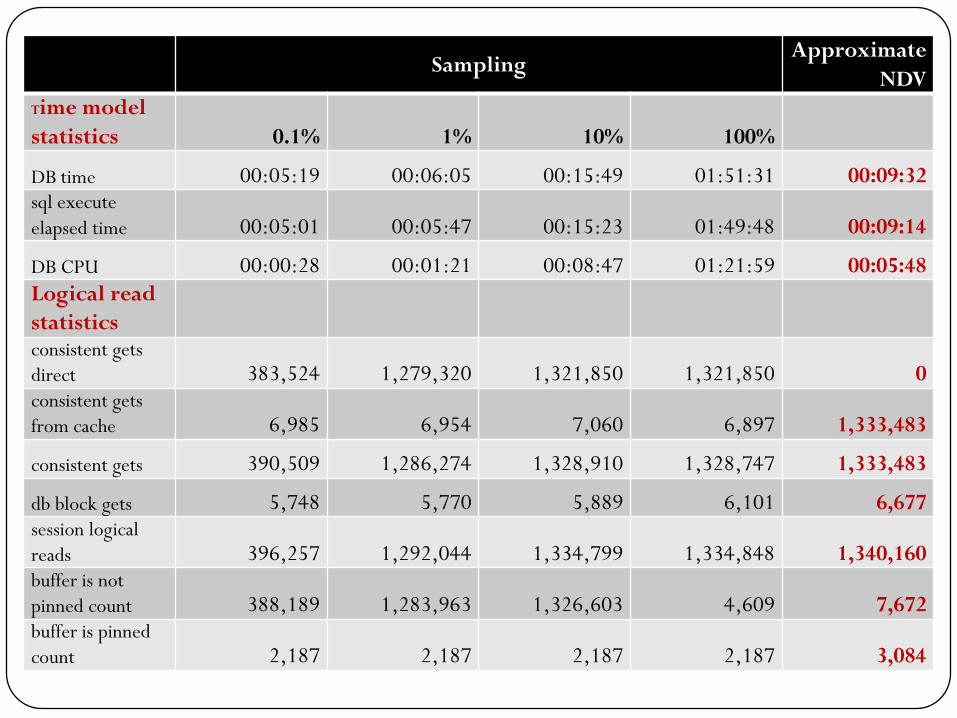
Performance characteristicsSamplingApproximate
NDV
Time model
statistics 0.1% 1% 10% 100%
DB time 00:05:19 00:06:05 00:15:49 01:51:31 00:09:32sql execute
elapsed time 00:05:01 00:05:47 00:15:23 01:49:48 00:09:14
DB CPU 00:00:28 00:01:21 00:08:47 01:21:59 00:05:48
Logical read
statisticsconsistent gets
direct 383,524 1,279,320 1,321,850 1,321,850 0consistent gets
from cache 6,985 6,954 7,060 6,897 1,333,483
consistent gets 390,509 1,286,274 1,328,910 1,328,747 1,333,483
db block gets 5,748 5,770 5,889 6,101 6,677session logical
reads 396,257 1,292,044 1,334,799 1,334,848 1,340,160buffer is not
pinned count 388,189 1,283,963 1,326,603 4,609 7,672buffer is pinned
count 2,187 2,187 2,187 2,187 3,084
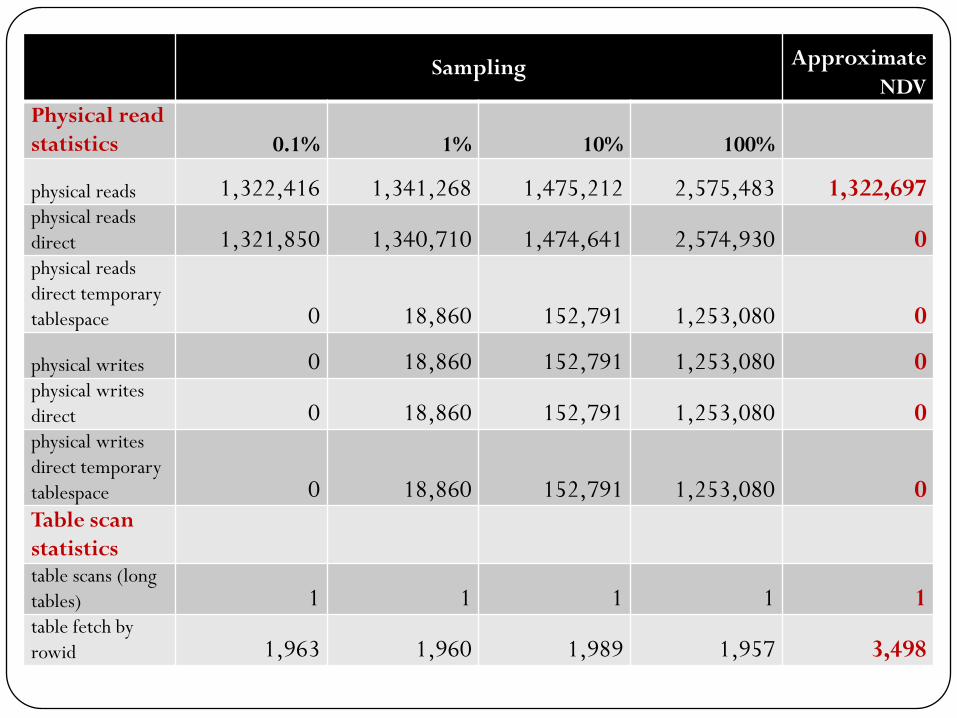
Performance characteristicsSampling Approximate
NDV
Physical read
statistics 0.1% 1% 10% 100%
physical reads 1,322,416 1,341,268 1,475,212 2,575,483 1,322,697physical reads
direct 1,321,850 1,340,710 1,474,641 2,574,930 0physical reads
direct temporary
tablespace 0 18,860 152,791 1,253,080 0
physical writes 0 18,860 152,791 1,253,080 0physical writes
direct 0 18,860 152,791 1,253,080 0physical writes
direct temporary
tablespace 0 18,860 152,791 1,253,080 0Table scan
statisticstable scans (long
tables) 1 1 1 1 1table fetch by
rowid 1,963 1,960 1,989 1,957 3,498
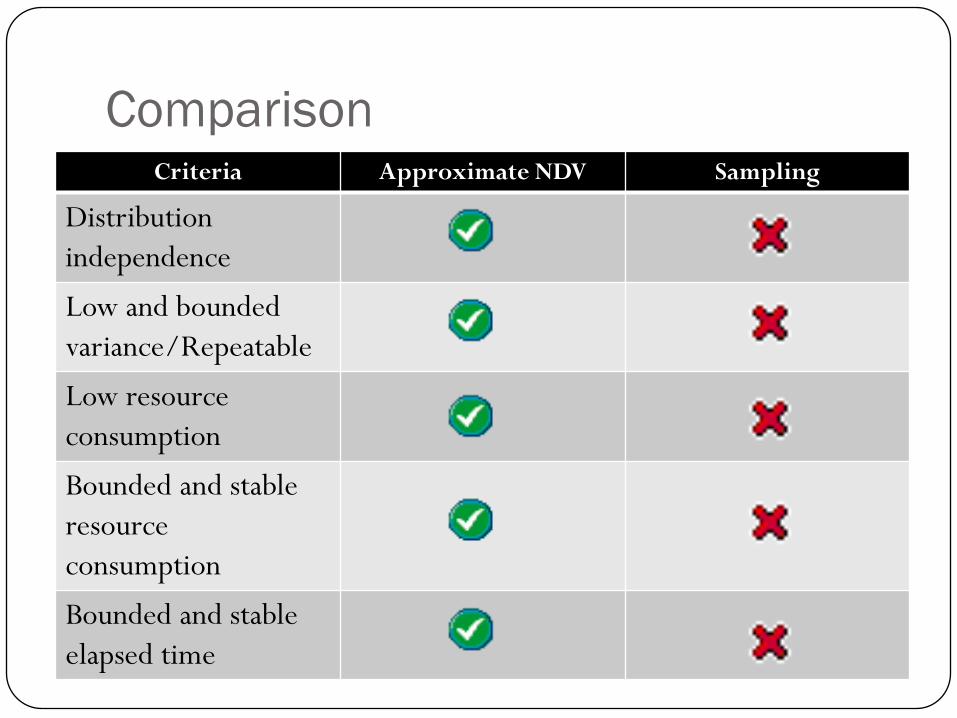
ComparisonCriteria Approximate NDV Sampling
Distribution
independence
Low and bounded
variance/Repeatable
Low resource
consumption
Bounded and stable
resource
consumption
Bounded and stable
elapsed time
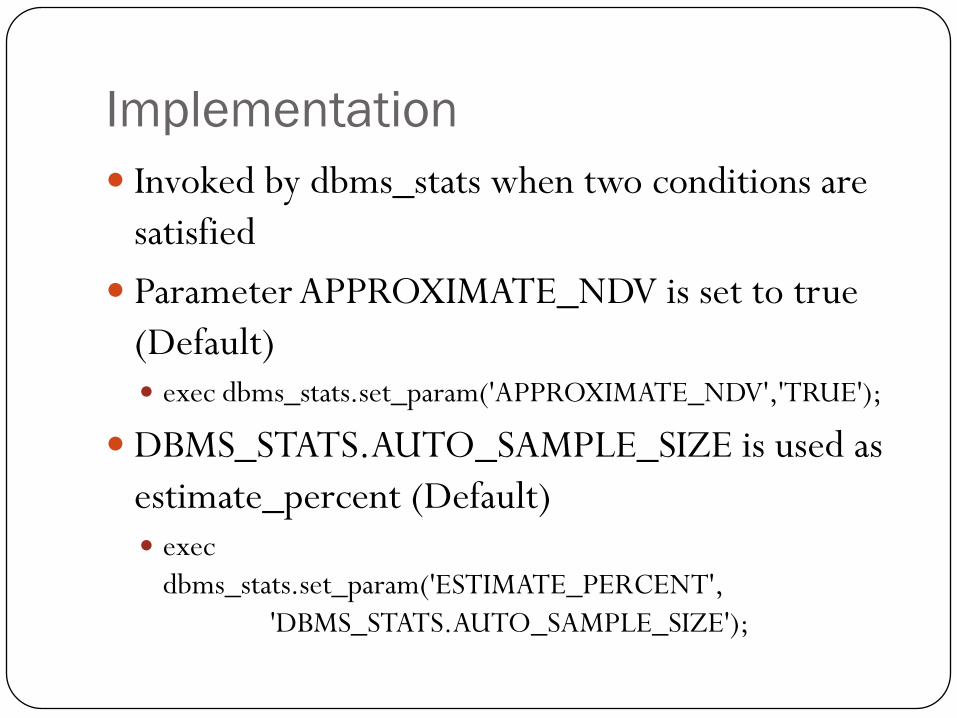
Implementation
Invoked by dbms_stats when two conditions are
satisfied
Parameter APPROXIMATE_NDV is set to true
(Default) exec dbms_stats.set_param('APPROXIMATE_NDV','TRUE');
DBMS_STATS.AUTO_SAMPLE_SIZE is used as
estimate_percent (Default) exec
dbms_stats.set_param('ESTIMATE_PERCENT',
'DBMS_STATS.AUTO_SAMPLE_SIZE');
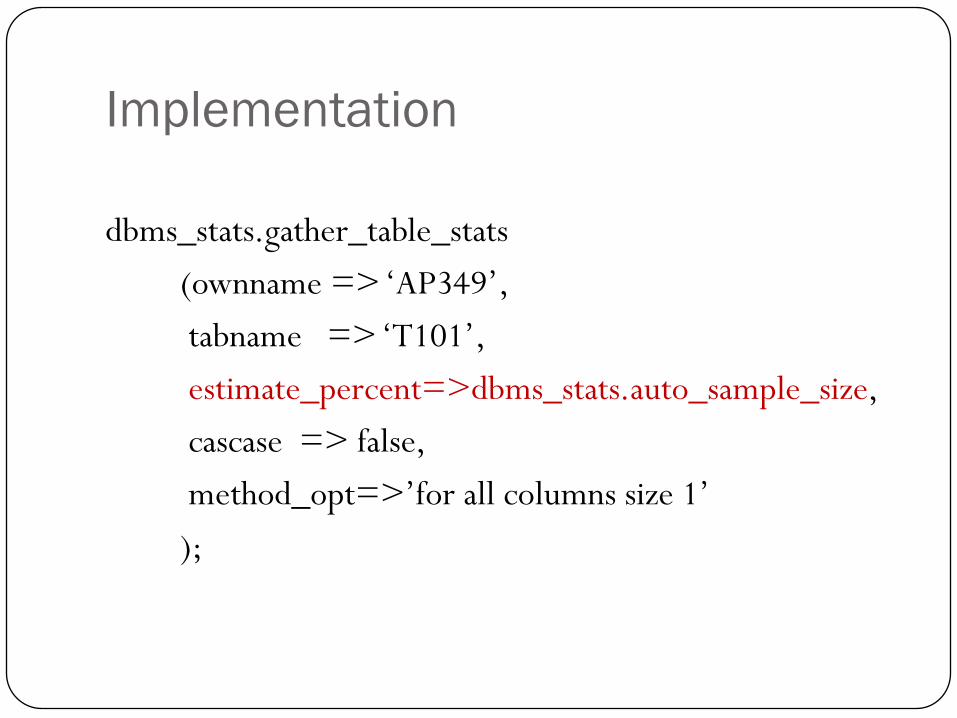
Implementation
dbms_stats.gather_table_stats
(ownname => „AP349‟,
tabname => „T101‟,
estimate_percent=>dbms_stats.auto_sample_size,
cascase => false,
method_opt=>‟for all columns size 1‟
);
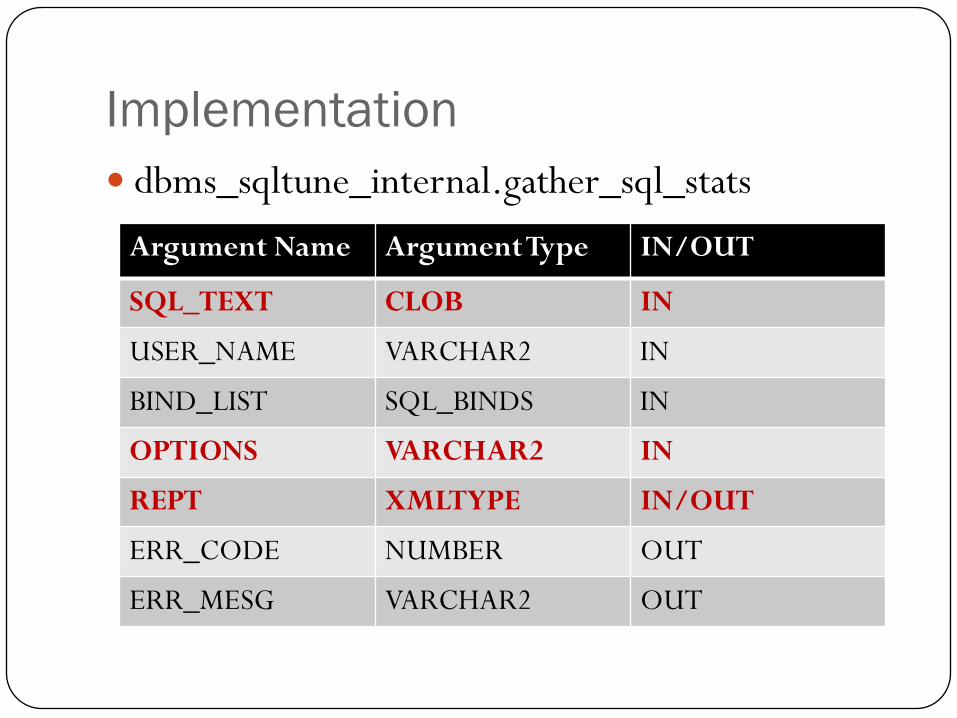
Implementation
dbms_sqltune_internal.gather_sql_stats
Argument Name Argument Type IN/OUT
SQL_TEXT CLOB IN
USER_NAME VARCHAR2 IN
BIND_LIST SQL_BINDS IN
OPTIONS VARCHAR2 IN
REPT XMLTYPE IN/OUT
ERR_CODE NUMBER OUT
ERR_MESG VARCHAR2 OUT
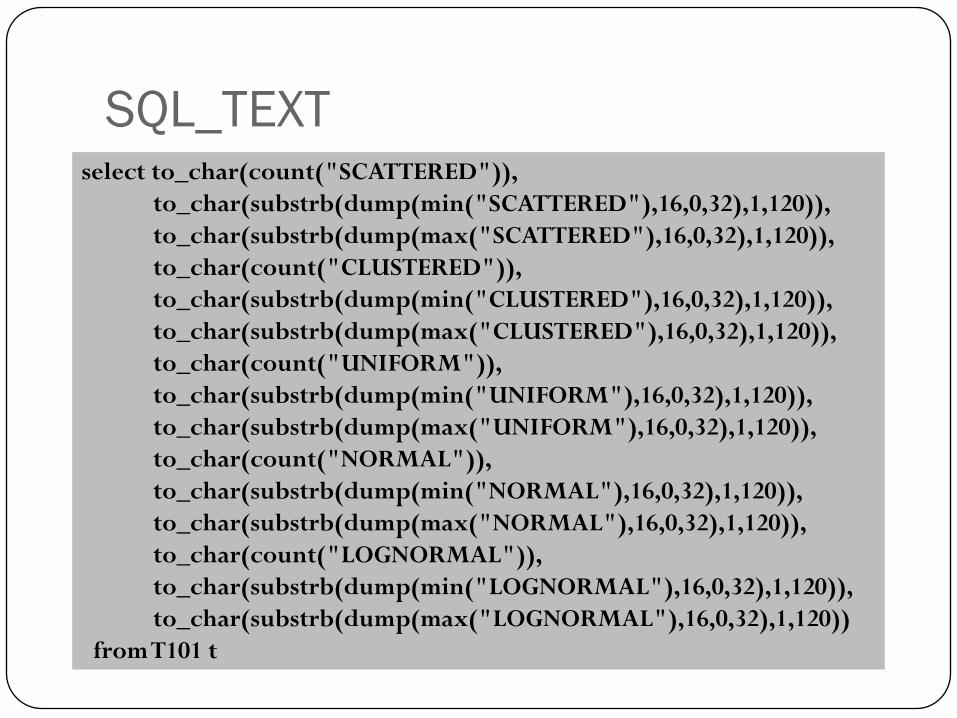
SQL_TEXTselect to_char(count("SCATTERED")),
to_char(substrb(dump(min("SCATTERED"),16,0,32),1,120)),
to_char(substrb(dump(max("SCATTERED"),16,0,32),1,120)),
to_char(count("CLUSTERED")),
to_char(substrb(dump(min("CLUSTERED"),16,0,32),1,120)),
to_char(substrb(dump(max("CLUSTERED"),16,0,32),1,120)),
to_char(count("UNIFORM")),
to_char(substrb(dump(min("UNIFORM"),16,0,32),1,120)),
to_char(substrb(dump(max("UNIFORM"),16,0,32),1,120)),
to_char(count("NORMAL")),
to_char(substrb(dump(min("NORMAL"),16,0,32),1,120)),
to_char(substrb(dump(max("NORMAL"),16,0,32),1,120)),
to_char(count("LOGNORMAL")),
to_char(substrb(dump(min("LOGNORMAL"),16,0,32),1,120)),
to_char(substrb(dump(max("LOGNORMAL"),16,0,32),1,120))
from T101 t
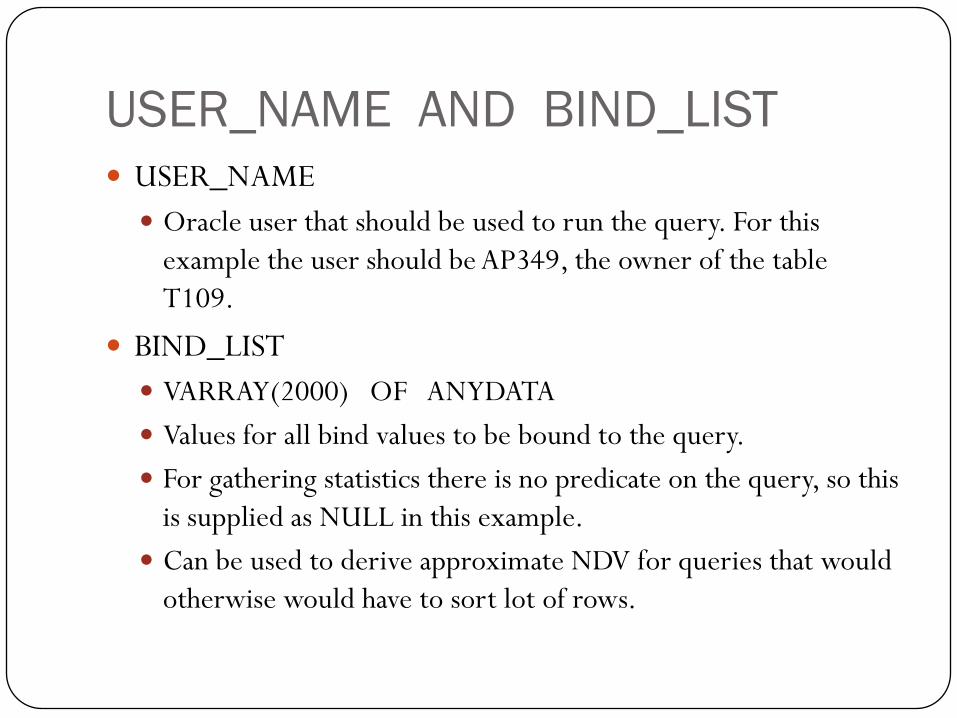
USER_NAME AND BIND_LIST
USER_NAME
Oracle user that should be used to run the query. For this
example the user should be AP349, the owner of the table
T109.
BIND_LIST
VARRAY(2000) OF ANYDATA
Values for all bind values to be bound to the query.
For gathering statistics there is no predicate on the query, so this
is supplied as NULL in this example.
Can be used to derive approximate NDV for queries that would
otherwise would have to sort lot of rows.
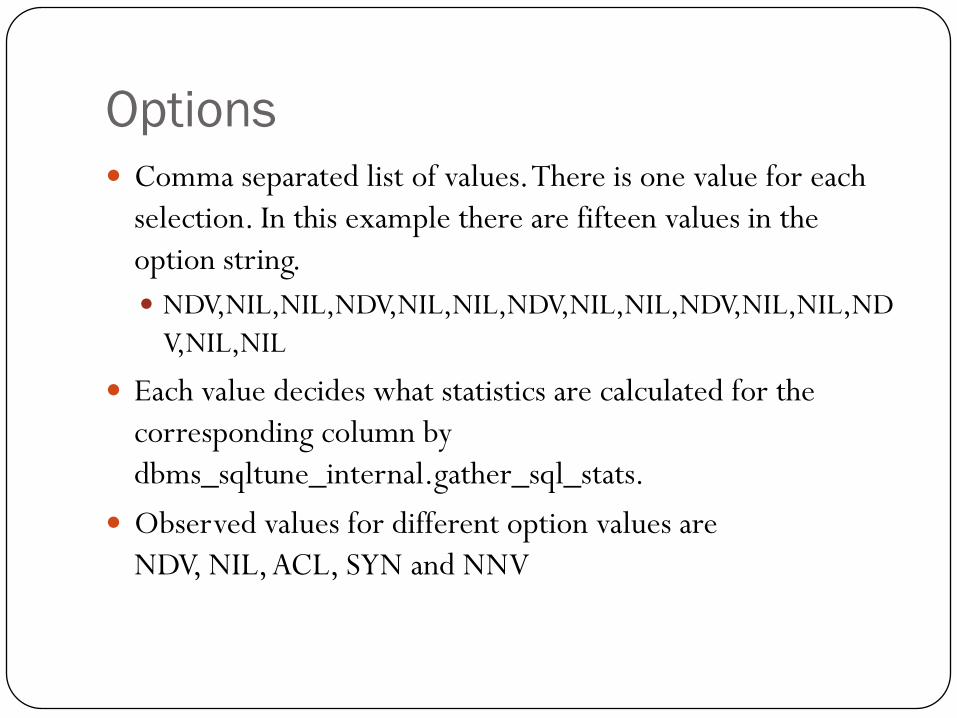
Options
Comma separated list of values. There is one value for each
selection. In this example there are fifteen values in the
option string.
NDV,NIL,NIL,NDV,NIL,NIL,NDV,NIL,NIL,NDV,NIL,NIL,ND
V,NIL,NIL
Each value decides what statistics are calculated for the
corresponding column by
dbms_sqltune_internal.gather_sql_stats.
Observed values for different option values are
NDV, NIL, ACL, SYN and NNV
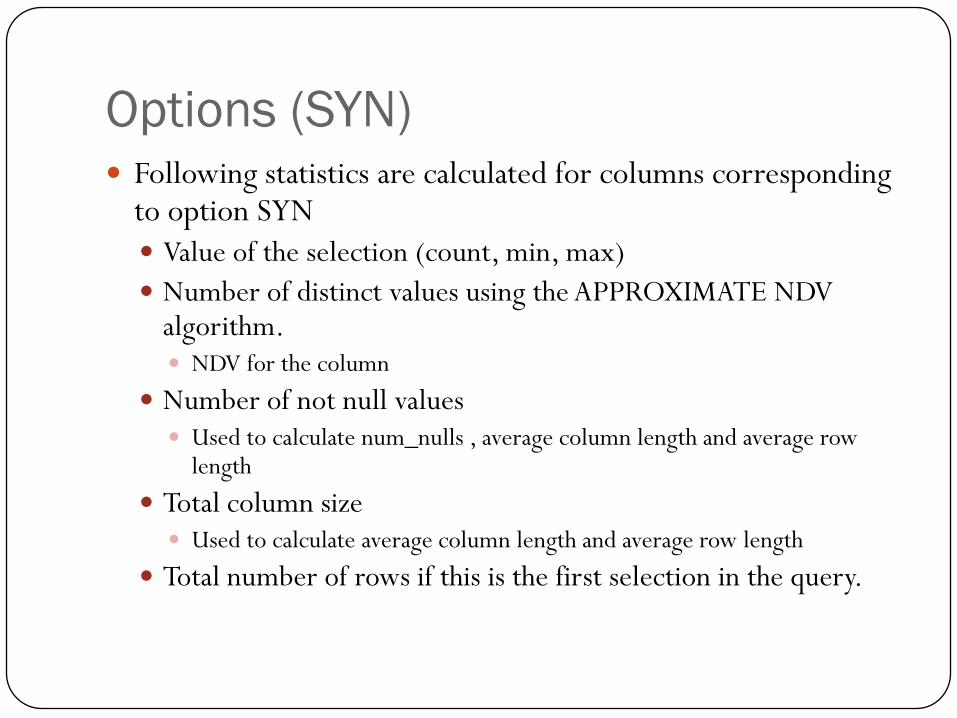
Options (SYN) Following statistics are calculated for columns corresponding
to option SYN
Value of the selection (count, min, max)
Number of distinct values using the APPROXIMATE NDV algorithm. NDV for the column
Number of not null values Used to calculate num_nulls , average column length and average row
length
Total column size Used to calculate average column length and average row length
Total number of rows if this is the first selection in the query.
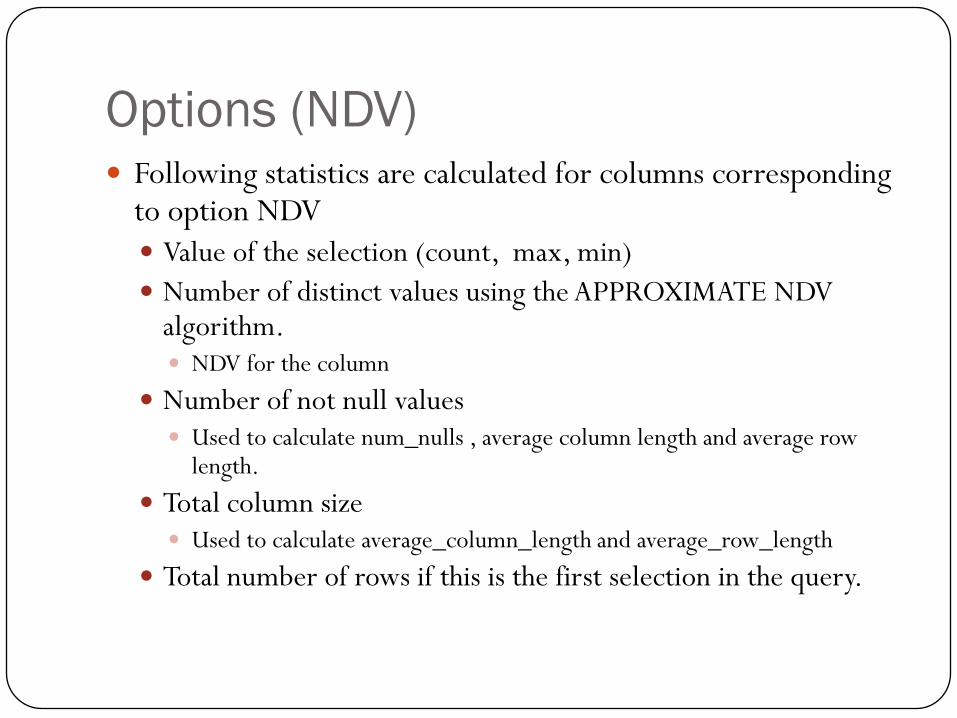
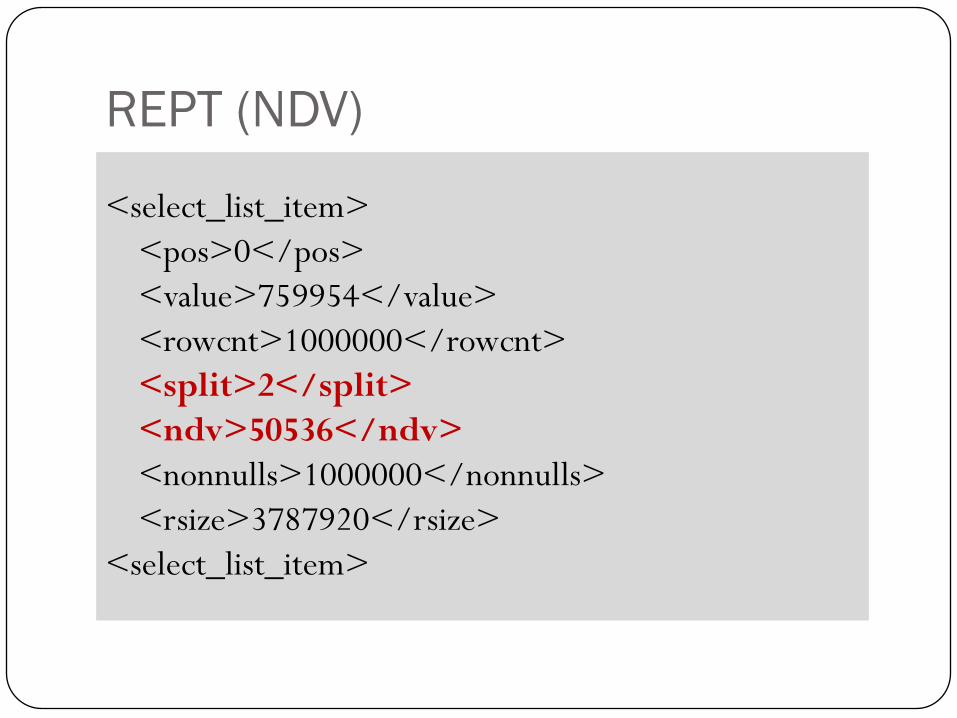
Options (NDV) Following statistics are calculated for columns corresponding
to option NDV
Value of the selection (count, max, min)
Number of distinct values using the APPROXIMATE NDV algorithm. NDV for the column
Number of not null values Used to calculate num_nulls , average column length and average row
length.
Total column size Used to calculate average_column_length and average_row_length
Total number of rows if this is the first selection in the query.
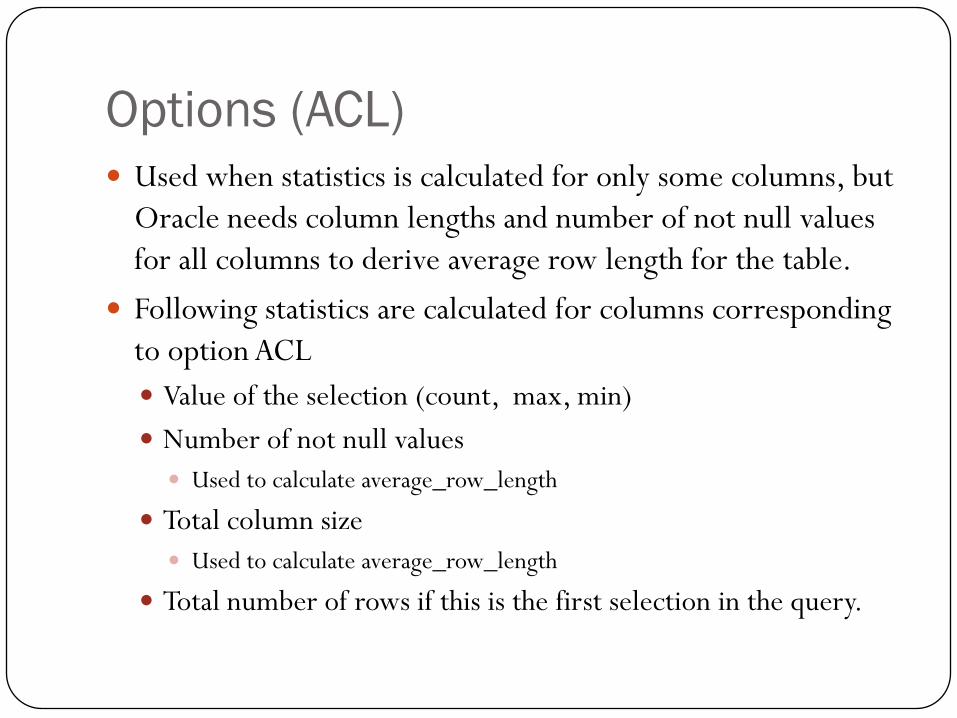
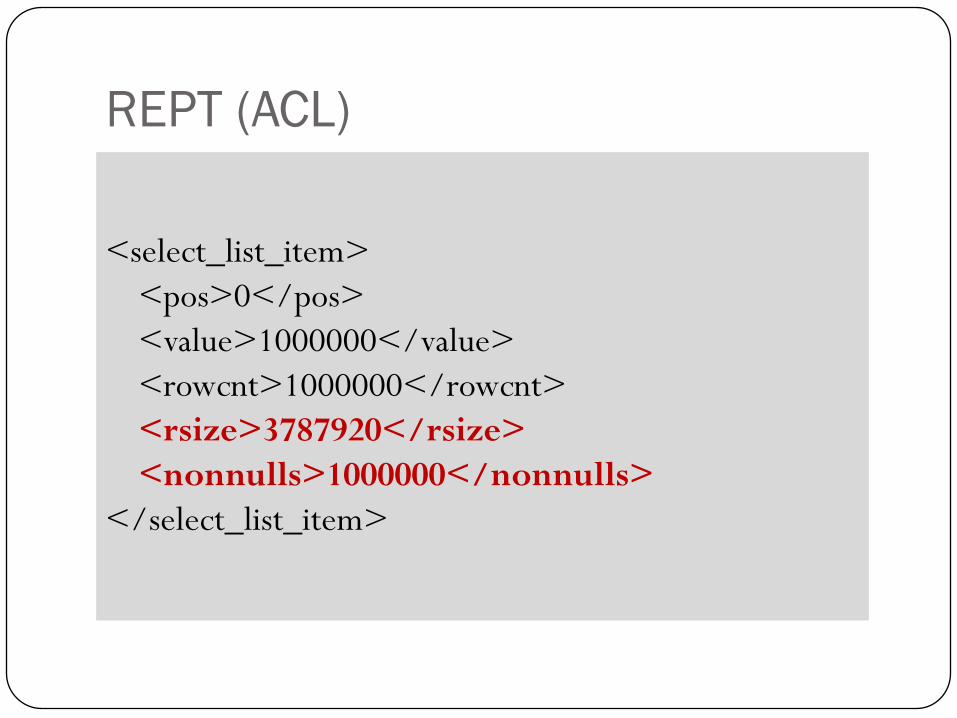
Options (ACL)
Used when statistics is calculated for only some columns, but
Oracle needs column lengths and number of not null values
for all columns to derive average row length for the table.
Following statistics are calculated for columns corresponding
to option ACL
Value of the selection (count, max, min)
Number of not null values
Used to calculate average_row_length
Total column size
Used to calculate average_row_length
Total number of rows if this is the first selection in the query.
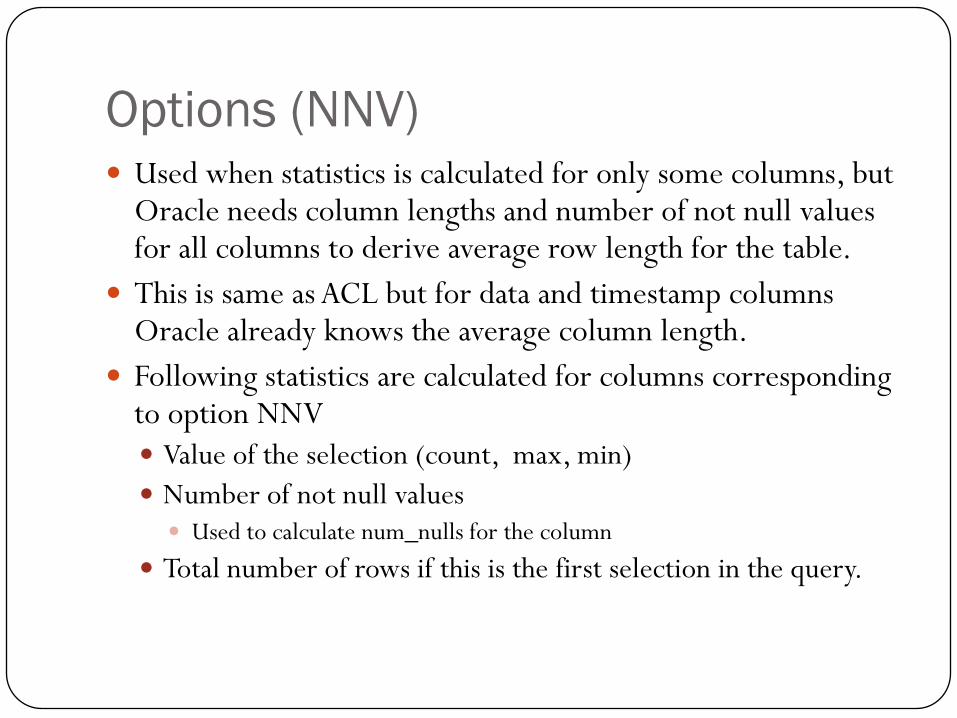
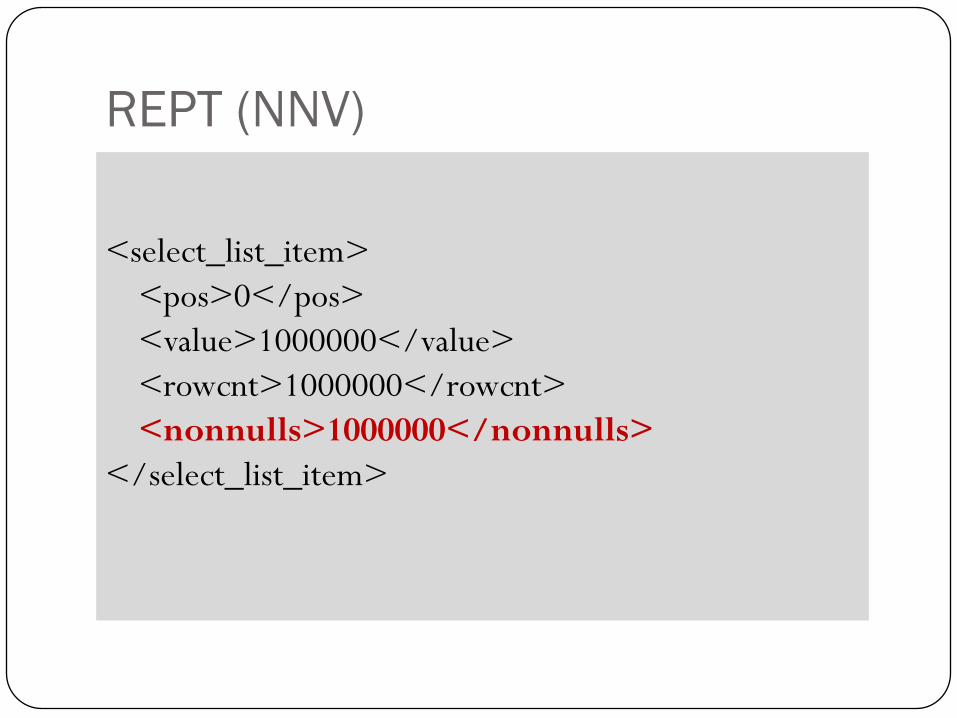
Options (NNV) Used when statistics is calculated for only some columns, but
Oracle needs column lengths and number of not null values for all columns to derive average row length for the table.
This is same as ACL but for data and timestamp columns Oracle already knows the average column length.
Following statistics are calculated for columns corresponding to option NNV
Value of the selection (count, max, min)
Number of not null values Used to calculate num_nulls for the column
Total number of rows if this is the first selection in the query.
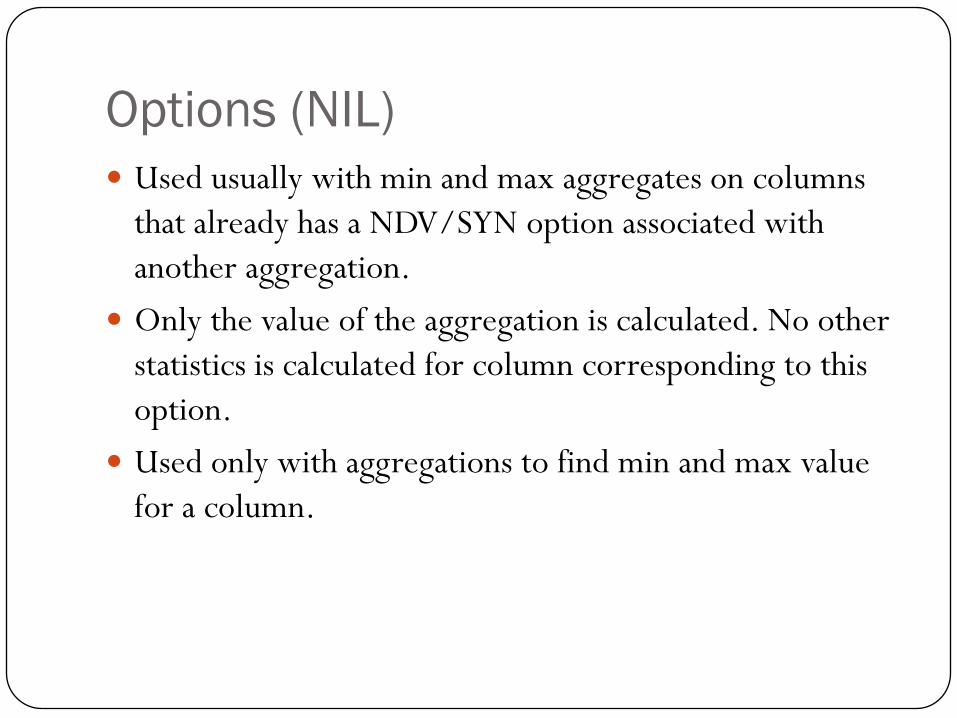
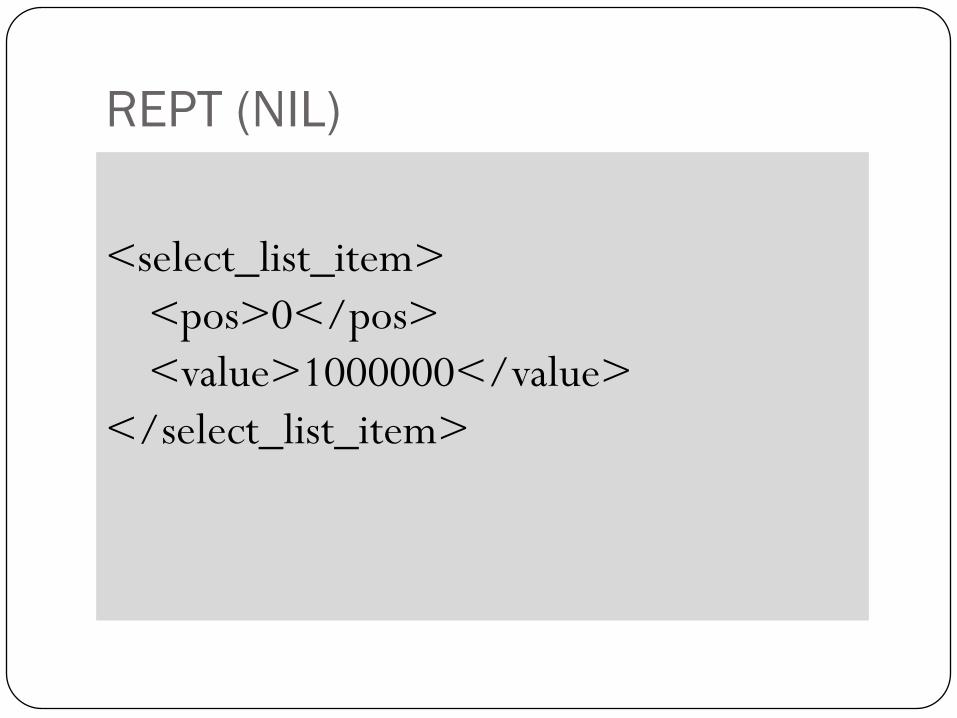
Options (NIL)
Used usually with min and max aggregates on columns
that already has a NDV/SYN option associated with
another aggregation.
Only the value of the aggregation is calculated. No other
statistics is calculated for column corresponding to this
option.
Used only with aggregations to find min and max value
for a column.
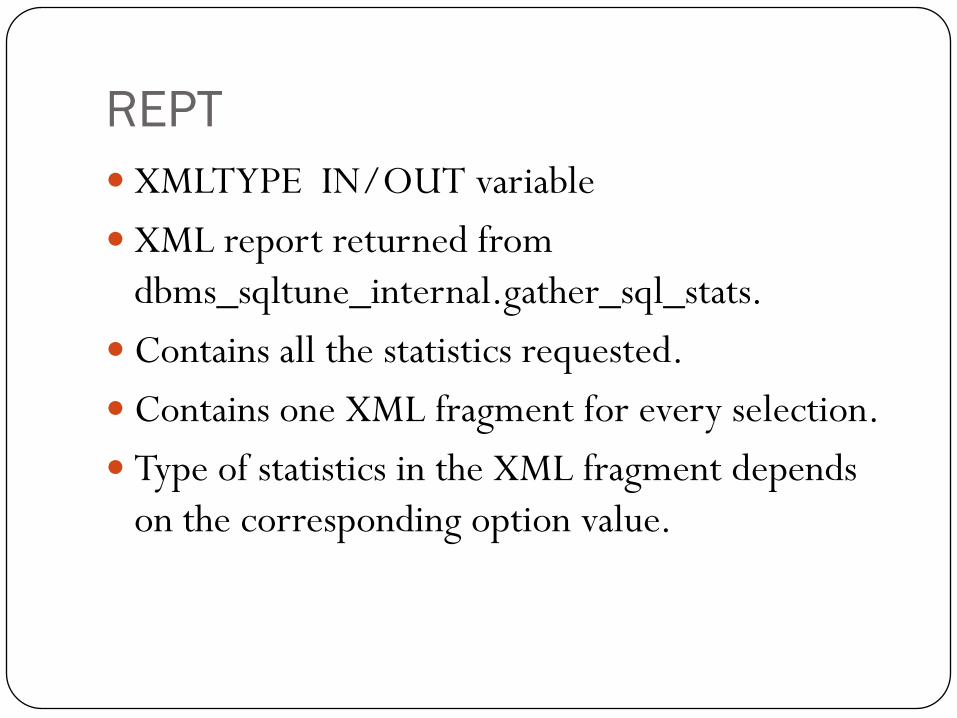
REPT
XMLTYPE IN/OUT variable
XML report returned from
dbms_sqltune_internal.gather_sql_stats.
Contains all the statistics requested.
Contains one XML fragment for every selection.
Type of statistics in the XML fragment depends
on the corresponding option value.
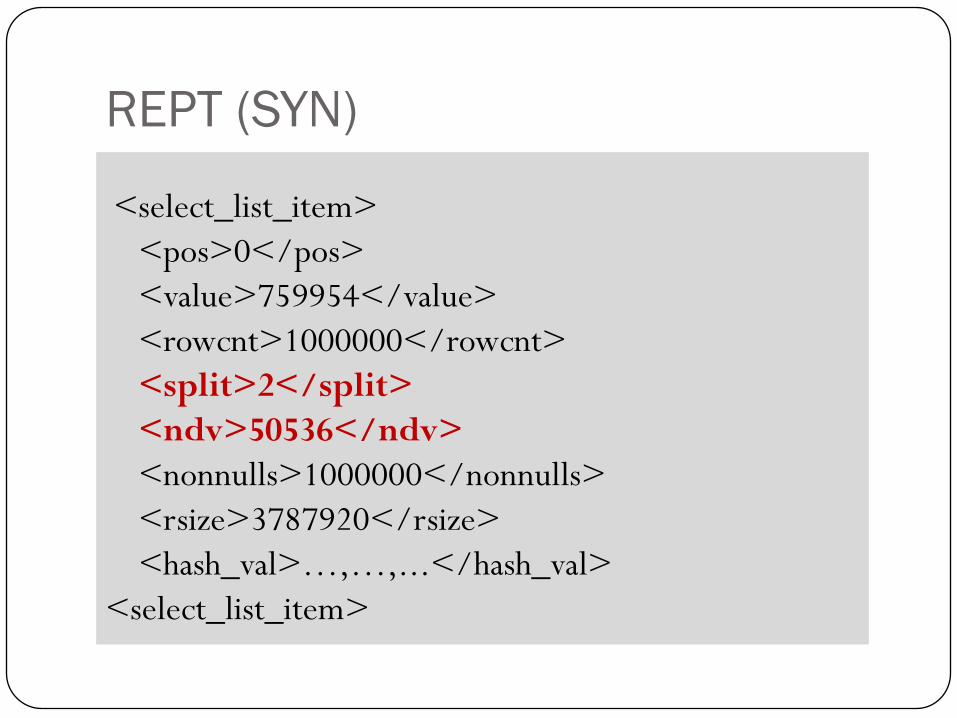
REPT (SYN)
<select_list_item>
<pos>0</pos>
<value>759954</value>
<rowcnt>1000000</rowcnt>
<split>2</split>
<ndv>50536</ndv>
<nonnulls>1000000</nonnulls>
<rsize>3787920</rsize>
<hash_val>…,…,...</hash_val>
<select_list_item>
REPT (NDV)
<select_list_item>
<pos>0</pos>
<value>759954</value>
<rowcnt>1000000</rowcnt>
<split>2</split>
<ndv>50536</ndv>
<nonnulls>1000000</nonnulls>
<rsize>3787920</rsize>
<select_list_item>
REPT (ACL)
<select_list_item>
<pos>0</pos>
<value>1000000</value>
<rowcnt>1000000</rowcnt>
<rsize>3787920</rsize>
<nonnulls>1000000</nonnulls>
</select_list_item>
REPT (NNV)
<select_list_item>
<pos>0</pos>
<value>1000000</value>
<rowcnt>1000000</rowcnt>
<nonnulls>1000000</nonnulls>
</select_list_item>
REPT (NIL)
<select_list_item>
<pos>0</pos>
<value>1000000</value>
</select_list_item>
10832 trace file
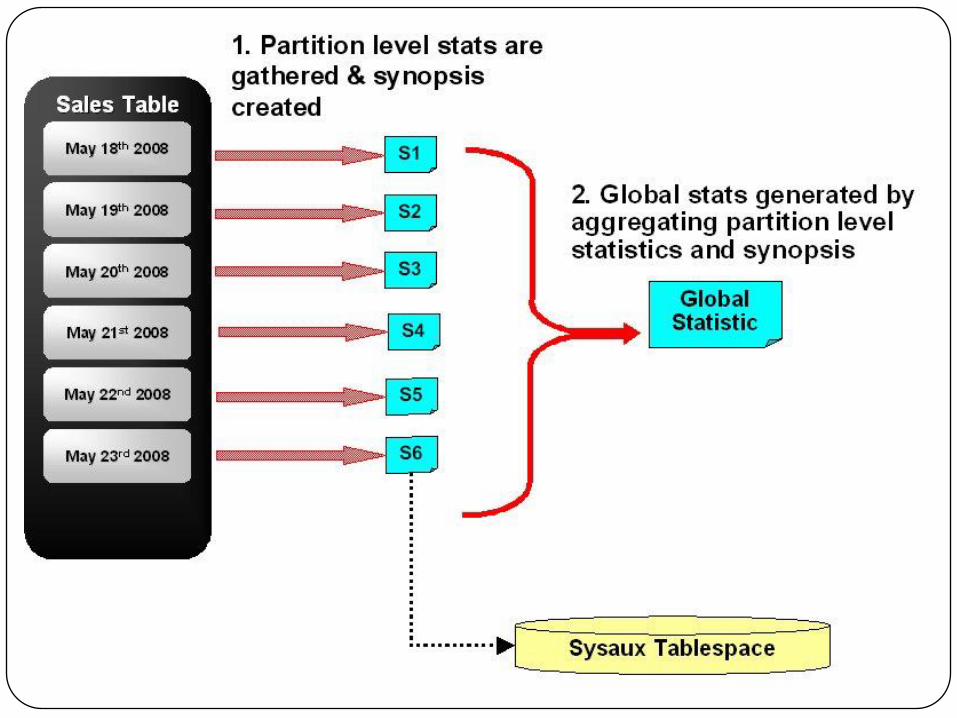
Partition/Global Statistics
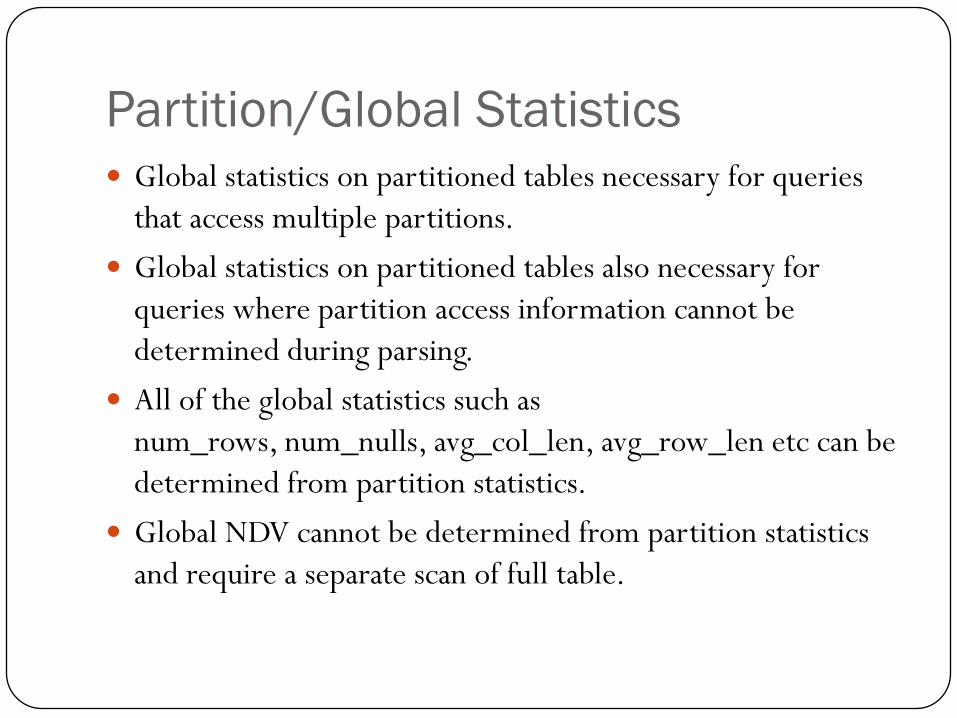
Global statistics on partitioned tables necessary for queries
that access multiple partitions.
Global statistics on partitioned tables also necessary for
queries where partition access information cannot be
determined during parsing.
All of the global statistics such as
num_rows, num_nulls, avg_col_len, avg_row_len etc can be
determined from partition statistics.
Global NDV cannot be determined from partition statistics
and require a separate scan of full table.
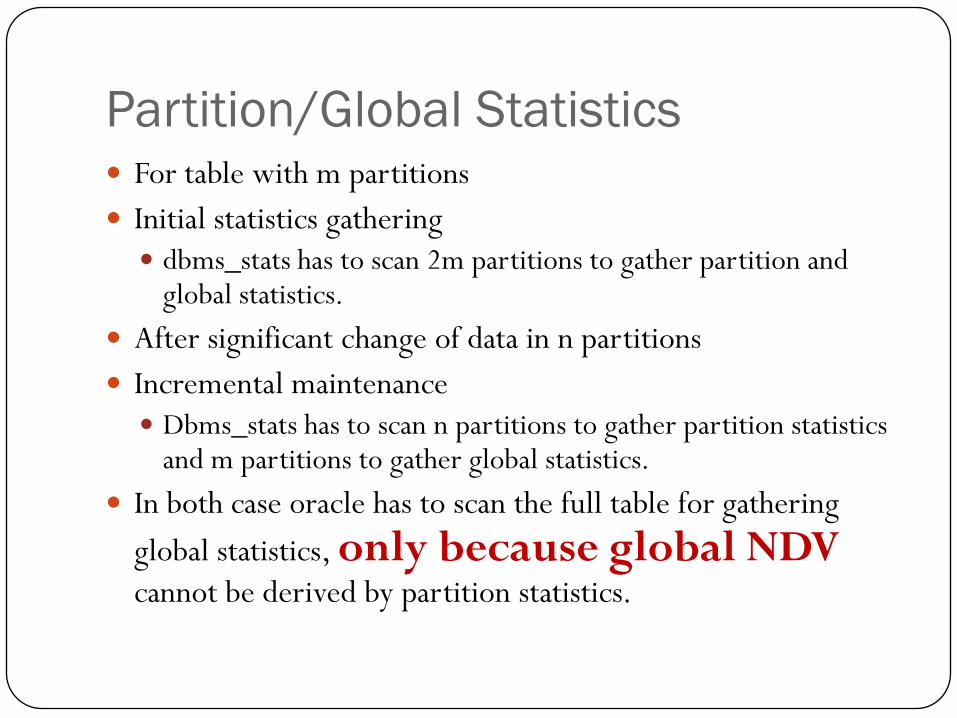
Partition/Global Statistics For table with m partitions
Initial statistics gathering
dbms_stats has to scan 2m partitions to gather partition and global statistics.
After significant change of data in n partitions
Incremental maintenance
Dbms_stats has to scan n partitions to gather partition statistics and m partitions to gather global statistics.
In both case oracle has to scan the full table for gathering
global statistics, only because global NDVcannot be derived by partition statistics.
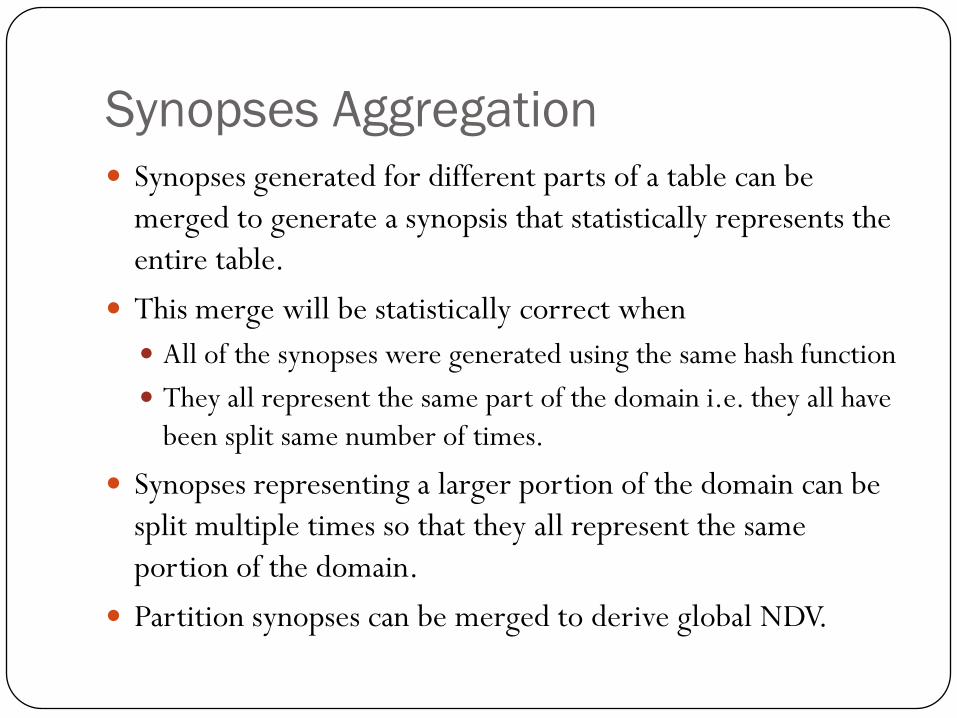
Synopses Aggregation
Synopses generated for different parts of a table can be
merged to generate a synopsis that statistically represents the
entire table.
This merge will be statistically correct when
All of the synopses were generated using the same hash function
They all represent the same part of the domain i.e. they all have
been split same number of times.
Synopses representing a larger portion of the domain can be
split multiple times so that they all represent the same
portion of the domain.
Partition synopses can be merged to derive global NDV.
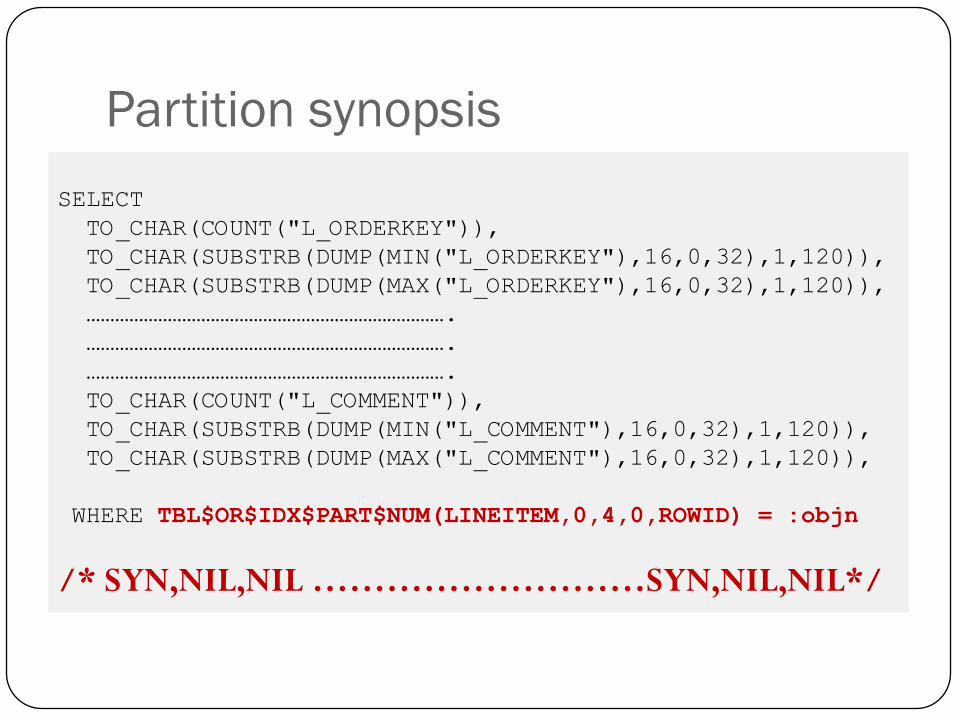
Partition synopsis
SELECT
TO_CHAR(COUNT("L_ORDERKEY")),
TO_CHAR(SUBSTRB(DUMP(MIN("L_ORDERKEY"),16,0,32),1,120)),
TO_CHAR(SUBSTRB(DUMP(MAX("L_ORDERKEY"),16,0,32),1,120)),
………………………………………………………………….
………………………………………………………………….
………………………………………………………………….
TO_CHAR(COUNT("L_COMMENT")),
TO_CHAR(SUBSTRB(DUMP(MIN("L_COMMENT"),16,0,32),1,120)),
TO_CHAR(SUBSTRB(DUMP(MAX("L_COMMENT"),16,0,32),1,120)),
WHERE TBL$OR$IDX$PART$NUM(LINEITEM,0,4,0,ROWID) = :objn
/* SYN,NIL,NIL ………………………SYN,NIL,NIL*/
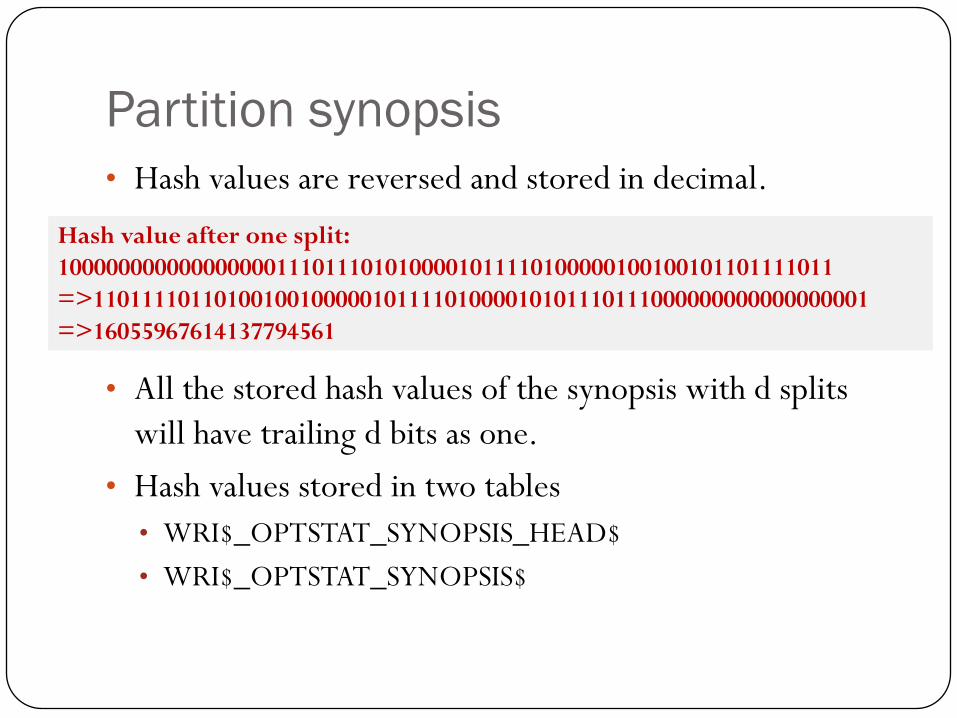
Partition synopsis
• Hash values are reversed and stored in decimal.
• All the stored hash values of the synopsis with d splits
will have trailing d bits as one.
• Hash values stored in two tables
• WRI$_OPTSTAT_SYNOPSIS_HEAD$
• WRI$_OPTSTAT_SYNOPSIS$
Hash value after one split:
1000000000000000001110111010100001011110100000100100101101111011
=>1101111011010010010000010111101000010101110111000000000000000001
=>16055967614137794561
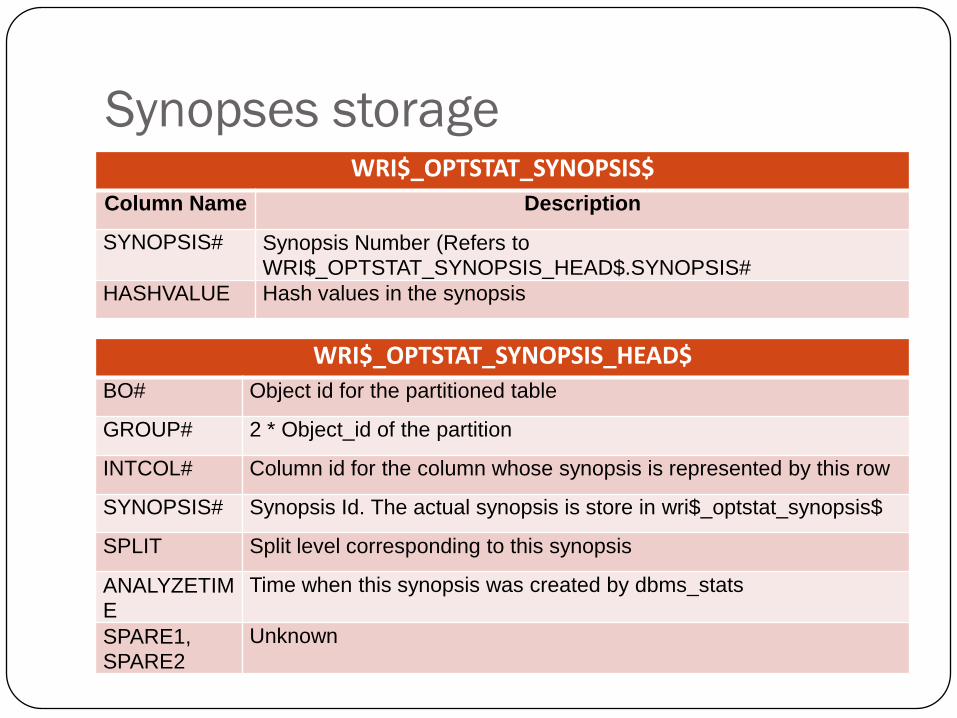
Synopses storageWRI$_OPTSTAT_SYNOPSIS$
Column Name Description
SYNOPSIS# Synopsis Number (Refers to
WRI$_OPTSTAT_SYNOPSIS_HEAD$.SYNOPSIS#
HASHVALUE Hash values in the synopsis
WRI$_OPTSTAT_SYNOPSIS_HEAD$
BO# Object id for the partitioned table
GROUP# 2 * Object_id of the partition
INTCOL# Column id for the column whose synopsis is represented by this row
SYNOPSIS# Synopsis Id. The actual synopsis is store in wri$_optstat_synopsis$
SPLIT Split level corresponding to this synopsis
ANALYZETIM
E
Time when this synopsis was created by dbms_stats
SPARE1,
SPARE2
Unknown
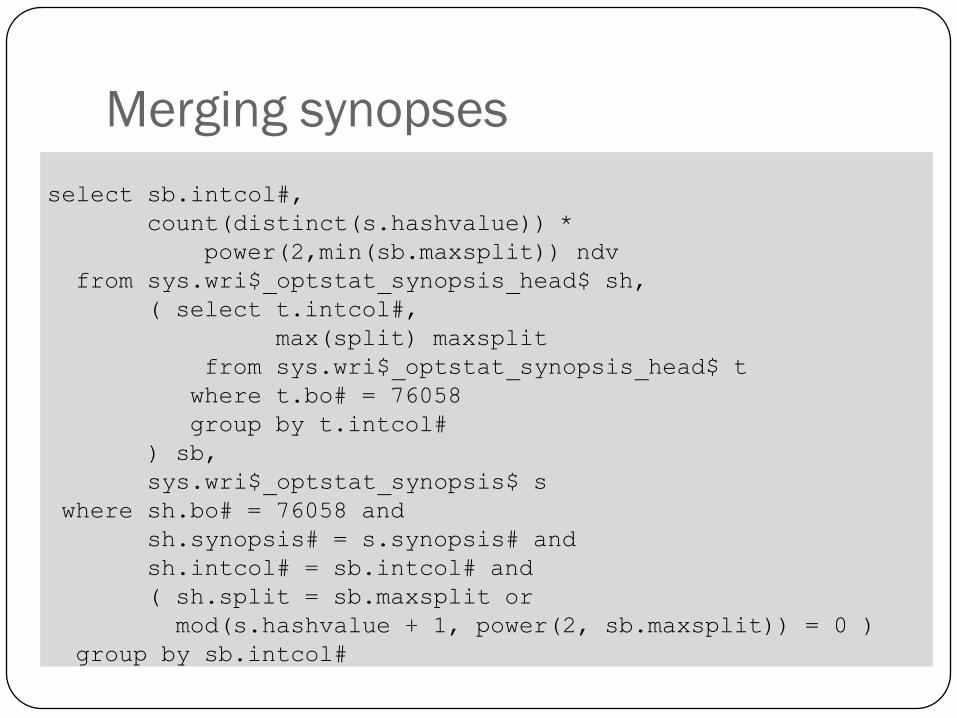
Merging synopses
select sb.intcol#,
count(distinct(s.hashvalue)) *
power(2,min(sb.maxsplit)) ndv
from sys.wri$_optstat_synopsis_head$ sh,
( select t.intcol#,
max(split) maxsplit
from sys.wri$_optstat_synopsis_head$ t
where t.bo# = 76058
group by t.intcol#
) sb,
sys.wri$_optstat_synopsis$ s
where sh.bo# = 76058 and
sh.synopsis# = s.synopsis# and
sh.intcol# = sb.intcol# and
( sh.split = sb.maxsplit or
mod(s.hashvalue + 1, power(2, sb.maxsplit)) = 0 )
group by sb.intcol#
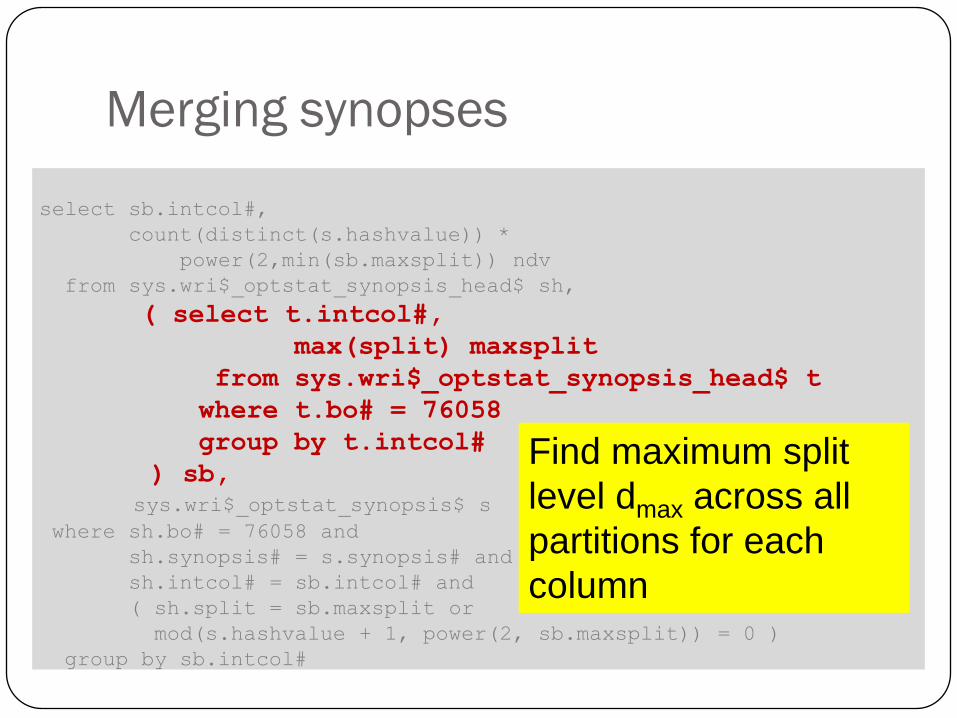
Find maximum split
level dmax across all
partitions for each
column
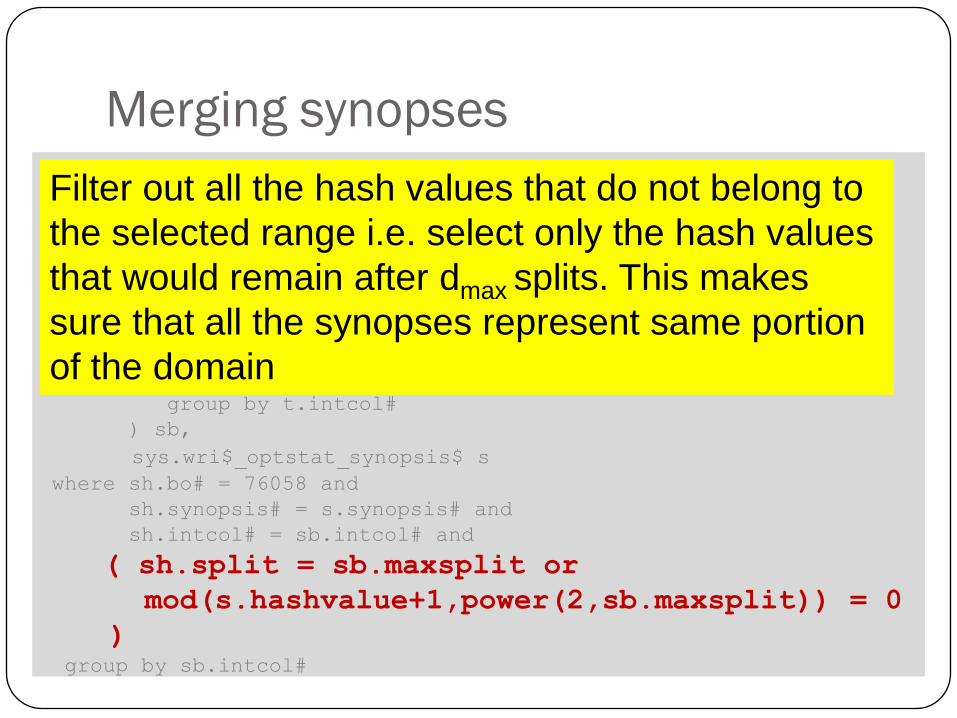
Merging synopses
select sb.intcol#,
count(distinct(s.hashvalue)) *
power(2,min(sb.maxsplit)) ndv
from sys.wri$_optstat_synopsis_head$ sh,
( select t.intcol#,
max(split) maxsplit
from sys.wri$_optstat_synopsis_head$ t
where t.bo# = 76058
group by t.intcol#
) sb,
sys.wri$_optstat_synopsis$ s
where sh.bo# = 76058 and
sh.synopsis# = s.synopsis# and
sh.intcol# = sb.intcol# and
( sh.split = sb.maxsplit or
mod(s.hashvalue+1,power(2,sb.maxsplit)) = 0
)group by sb.intcol#
Filter out all the hash values that do not belong to
the selected range i.e. select only the hash values
that would remain after dmax splits. This makes
sure that all the synopses represent same portion
of the domain
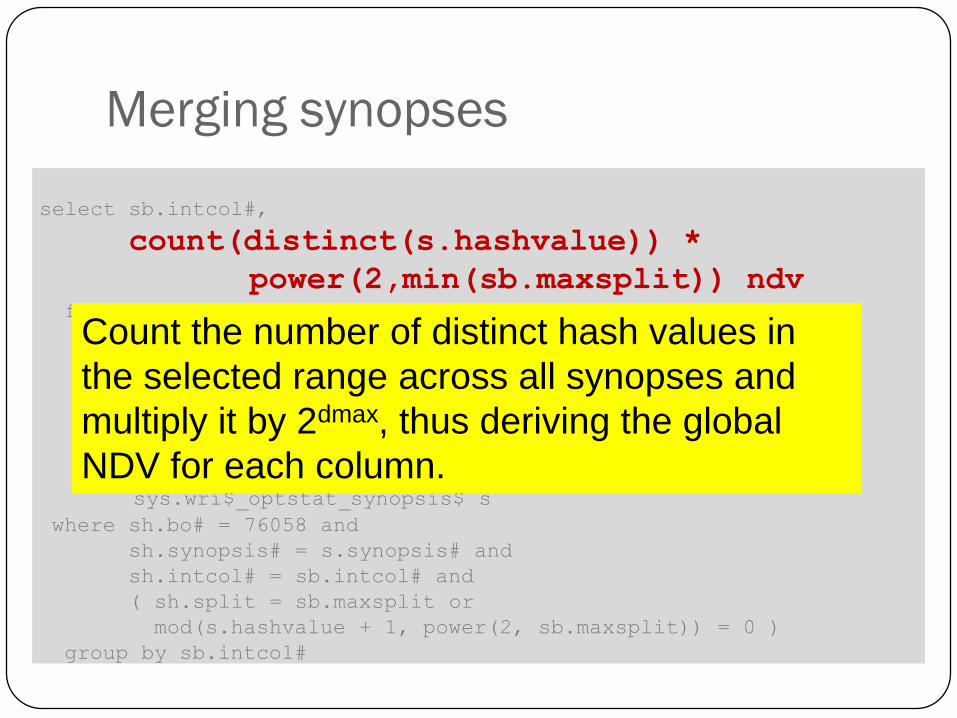
Merging synopses
select sb.intcol#,
count(distinct(s.hashvalue)) *
power(2,min(sb.maxsplit)) ndvfrom sys.wri$_optstat_synopsis_head$ sh,
( select t.intcol#,
max(split) maxsplit
from sys.wri$_optstat_synopsis_head$ t
where t.bo# = 76058
group by t.intcol#
) sb,
sys.wri$_optstat_synopsis$ s
where sh.bo# = 76058 and
sh.synopsis# = s.synopsis# and
sh.intcol# = sb.intcol# and
( sh.split = sb.maxsplit or
mod(s.hashvalue + 1, power(2, sb.maxsplit)) = 0 )
group by sb.intcol#
Count the number of distinct hash values in
the selected range across all synopses and
multiply it by 2dmax, thus deriving the global
NDV for each column.
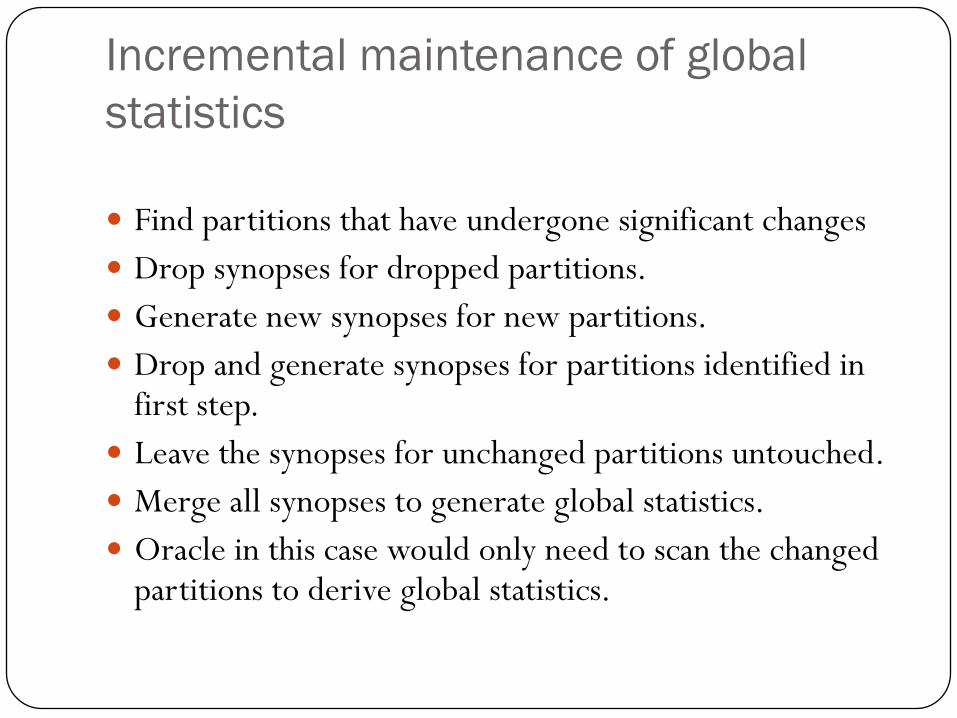
Incremental maintenance of global
statistics
Find partitions that have undergone significant changes
Drop synopses for dropped partitions.
Generate new synopses for new partitions.
Drop and generate synopses for partitions identified in first step.
Leave the synopses for unchanged partitions untouched.
Merge all synopses to generate global statistics.
Oracle in this case would only need to scan the changed partitions to derive global statistics.
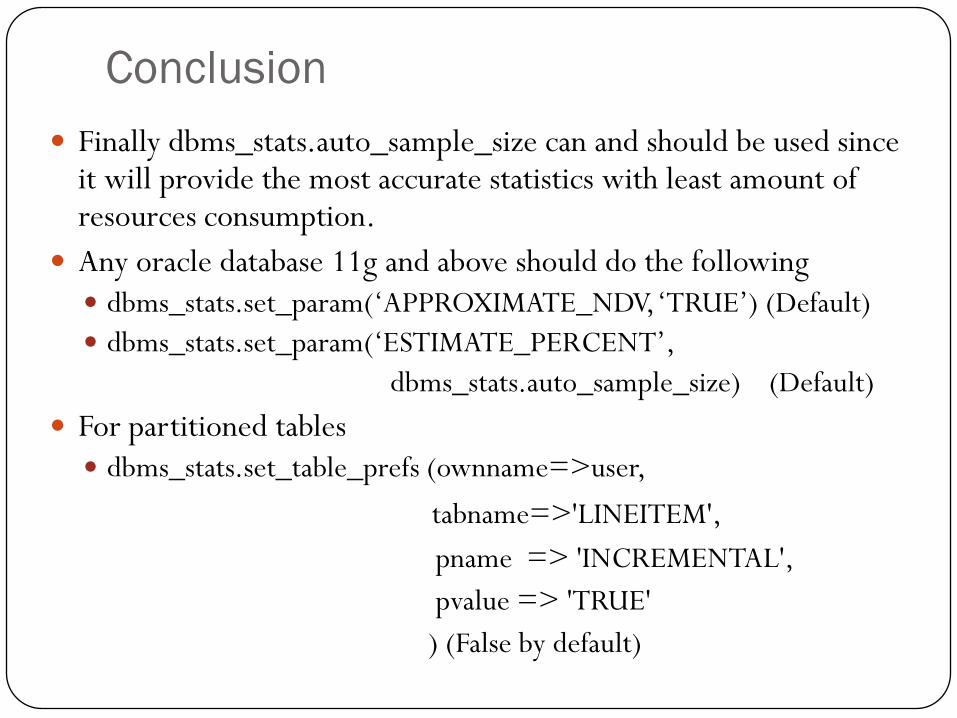
Conclusion
Finally dbms_stats.auto_sample_size can and should be used since it will provide the most accurate statistics with least amount of resources consumption.
Any oracle database 11g and above should do the following
dbms_stats.set_param(„APPROXIMATE_NDV, „TRUE‟) (Default)
dbms_stats.set_param(„ESTIMATE_PERCENT‟,
dbms_stats.auto_sample_size) (Default)
For partitioned tables
dbms_stats.set_table_prefs (ownname=>user,
tabname=>'LINEITEM',
pname => 'INCREMENTAL',
pvalue => 'TRUE'
) (False by default)
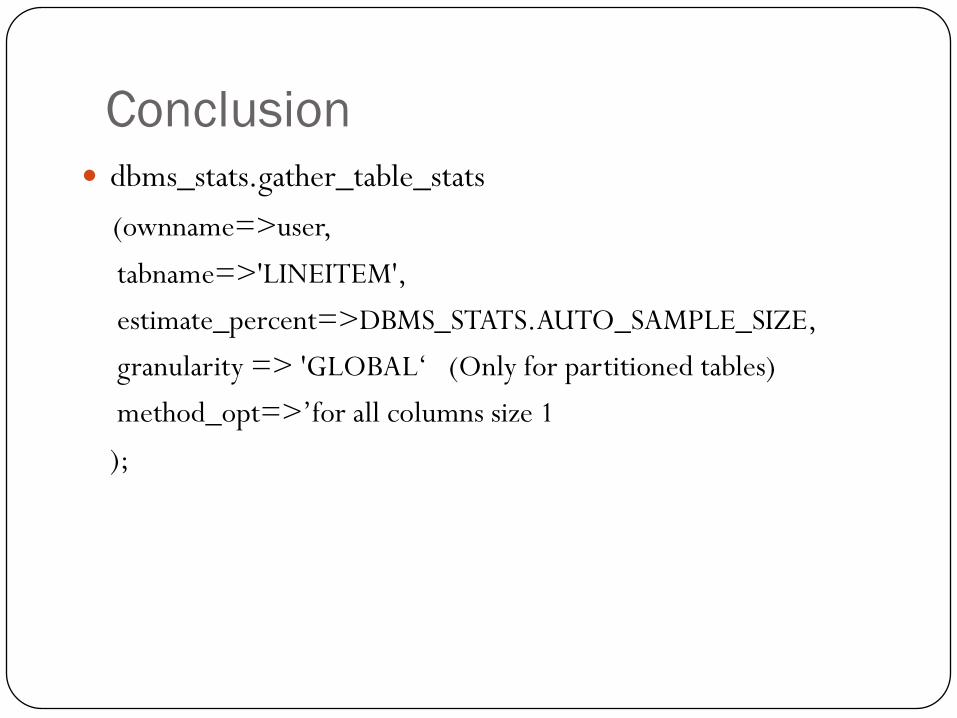
Conclusion
dbms_stats.gather_table_stats
(ownname=>user,
tabname=>'LINEITEM',
estimate_percent=>DBMS_STATS.AUTO_SAMPLE_SIZE,
granularity => 'GLOBAL„ (Only for partitioned tables)
method_opt=>‟for all columns size 1
);
Reference
Oracle patent application 20080120275. Merging synopses
to determine number of distinct values in large databases
Oracle patent 6732085, Method and system for sample size
determination for database optimizers
Oracle presentation at SIGMOD 2008 Efficient and scalable
statistics gathering for large databases in Oracle 11g.
Greg Rahn‟s blog posting about dbms_stats enhancements
and incremental global statistics.
Optimizer team‟s blog posting on managing statistics on large
partitioned tables and improvement of auto sampling in 11g