One More Piece of the RTI Puzzle: Zones of Growth for Students Receiving Tier 2 Instructional...
17
One More Piece of the RTI Puzzle: Zones of Growth for Students Receiving Tier 2 Instructional Supports Hank Fien, Ph.D. Center for Teaching and Learning October, 23, 2007
-
date post
21-Dec-2015 -
Category
Documents
-
view
214 -
download
0
Transcript of One More Piece of the RTI Puzzle: Zones of Growth for Students Receiving Tier 2 Instructional...

One More Piece of the RTI Puzzle:
Zones of Growth for Students Receiving Tier 2 Instructional
Supports
Hank Fien, Ph.D.
Center for Teaching and Learning
October, 23, 2007

Objectives
1. RTI: Not just for Tier 3 or SPED decision-making
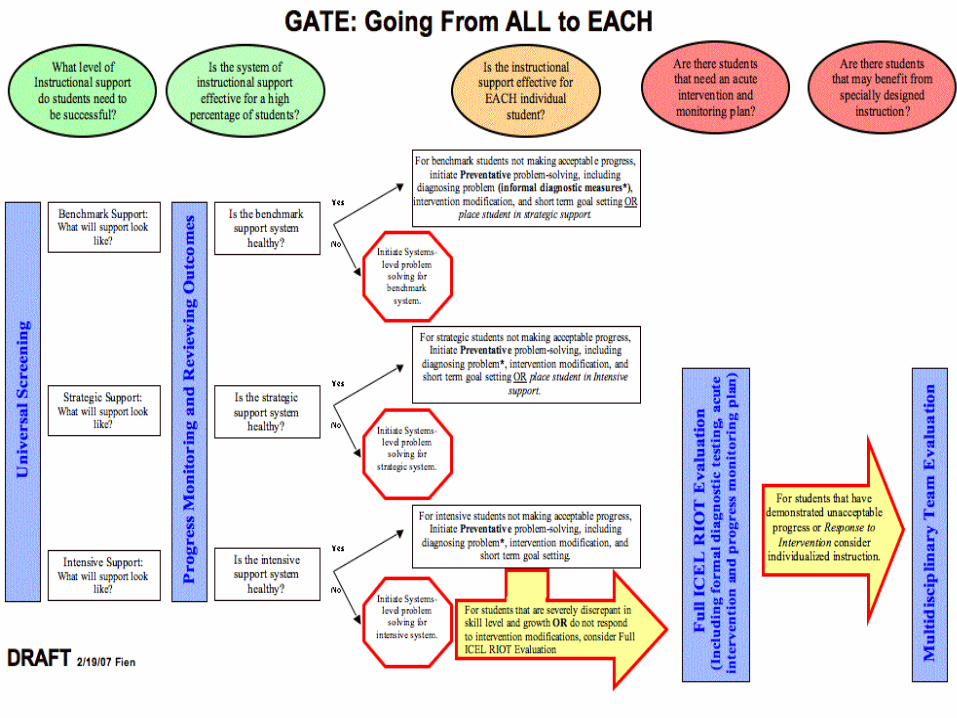
2. Review Going from All to Each (GATE) Map
3. Moving from Systems to Students 4. Introduction to Zones of Growth and
Data Analyses5. Zones of Growth Case Example and
Practice
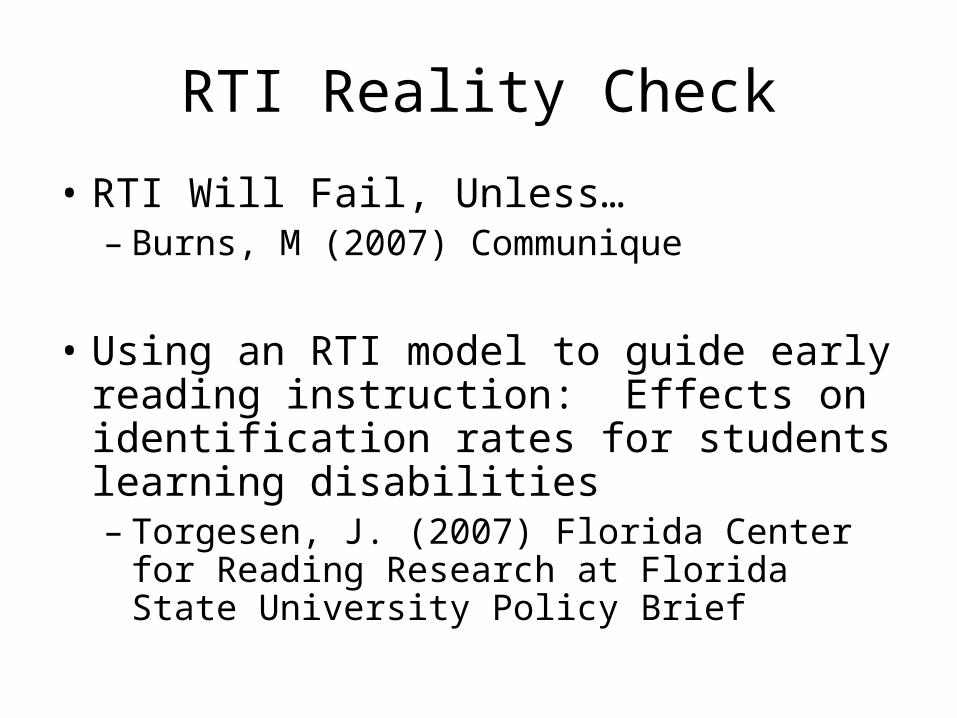
RTI Reality Check
• RTI Will Fail, Unless…– Burns, M (2007) Communique
• Using an RTI model to guide early reading instruction: Effects on identification rates for students learning disabilities– Torgesen, J. (2007) Florida Center for
Reading Research at Florida State University Policy Brief

Tier 2 Supports
TIER DIBELS INSTRUCTIONAL
RECOMMENDATION
INSTRUCTIONAL PLACEMENT
ASSESSMENT PLAN
Tertiary Intensive/At Risk/Deficit
Part Core + Replacement
Program
•Progress Monitoring: 2-4 x Month•In-Program Assessments•Diagnostic Assessment•Screening & Outcome Assessment
Secondary Strategic/Some Risk/Emerging
Core Reading Program + Supplement
• Progress Monitoring: 2-4 x Month
• In-Program Assessments• Screening & Outcome
Assessment
Primary Benchmark/Low Risk/Established
Core Reading Program
•Progress Monitoring: Term•In-Program Assessments•Screening & Outcome Assessment

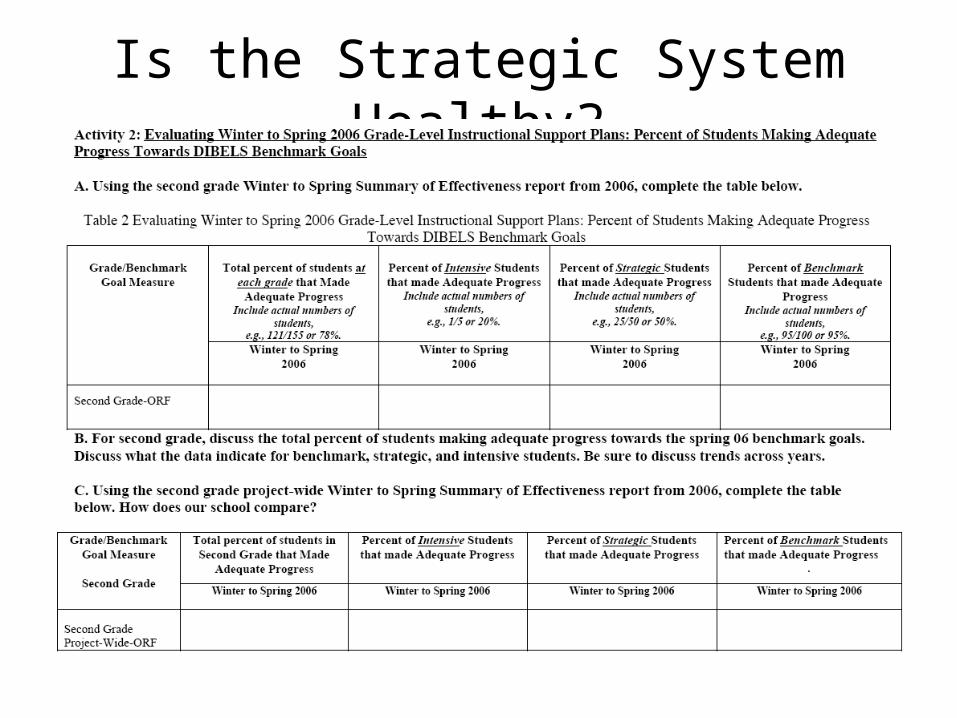
Is the Strategic System Healthy?

School A: Is the Strategic System Healthy?
Let’s look at the Oregon Norms.
Not quite.

Initiate Systems-level problem solving for Strategic System
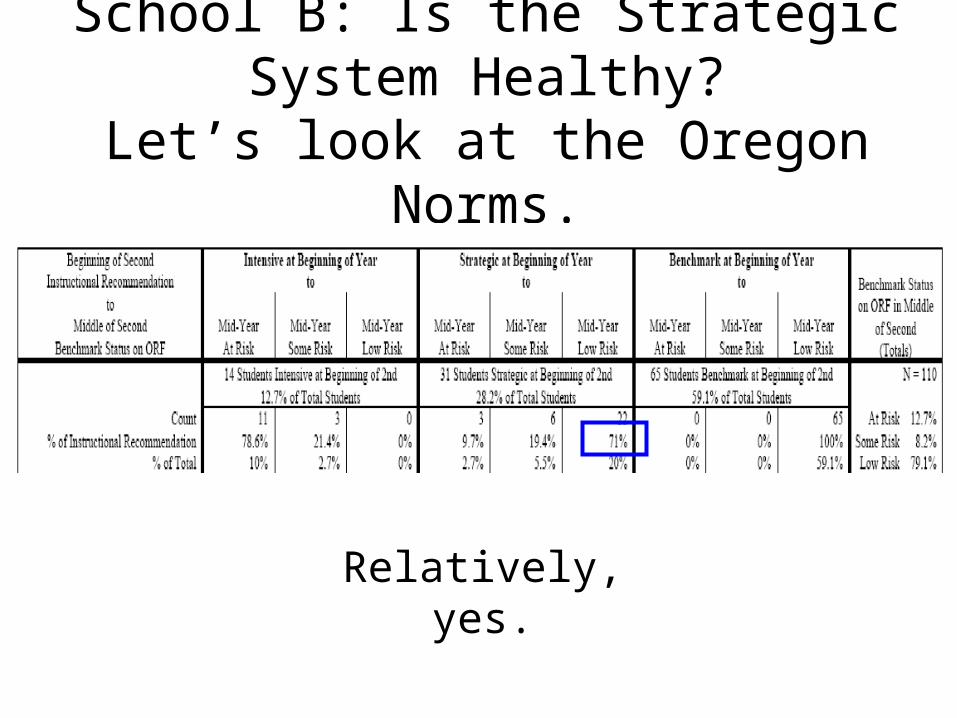
School B: Is the Strategic System Healthy?
Let’s look at the Oregon Norms.
Relatively, yes.
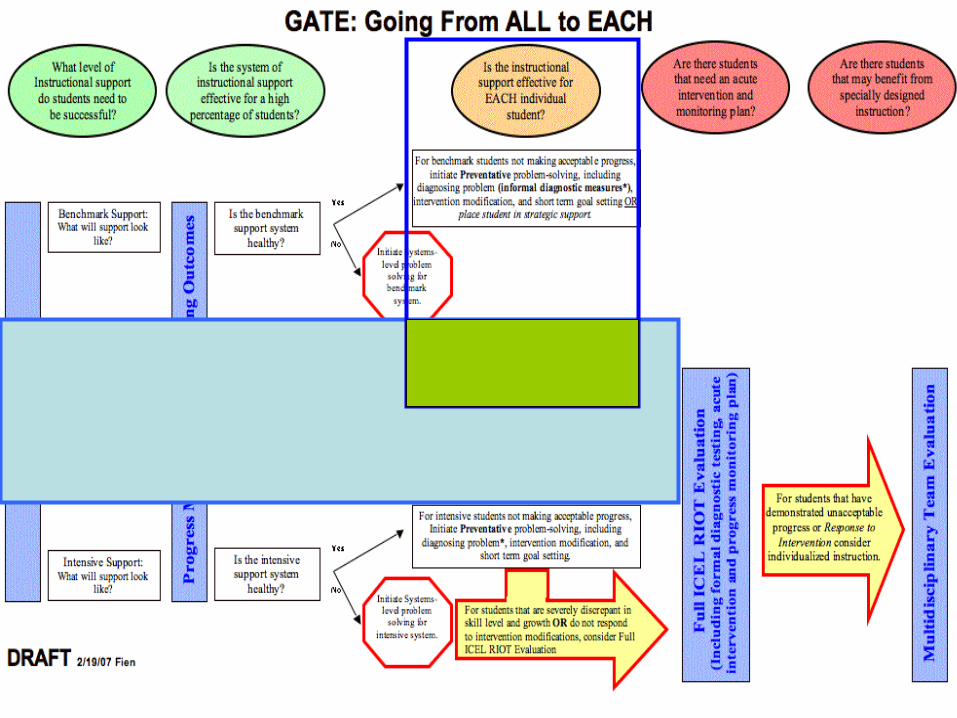

Is the Strategic instructional support effective for EACH individual student?
• No, it is effective for over 70 percent, but not all.
• For the students not making adequate progress Initiate Preventative problem-solving, including diagnosing problem*, intervention modification, and short term goal setting OR place student in Intensive support.
• How should we set short term goals? What would adequate growth look like? What kind of growth would put the odds in the favor of strategic students to reach grade level goals? What kind of growth rates would significantly place a strategic student at risk for not reaching grade level goals?
• Let’s look at Zones of Growth Analyses…
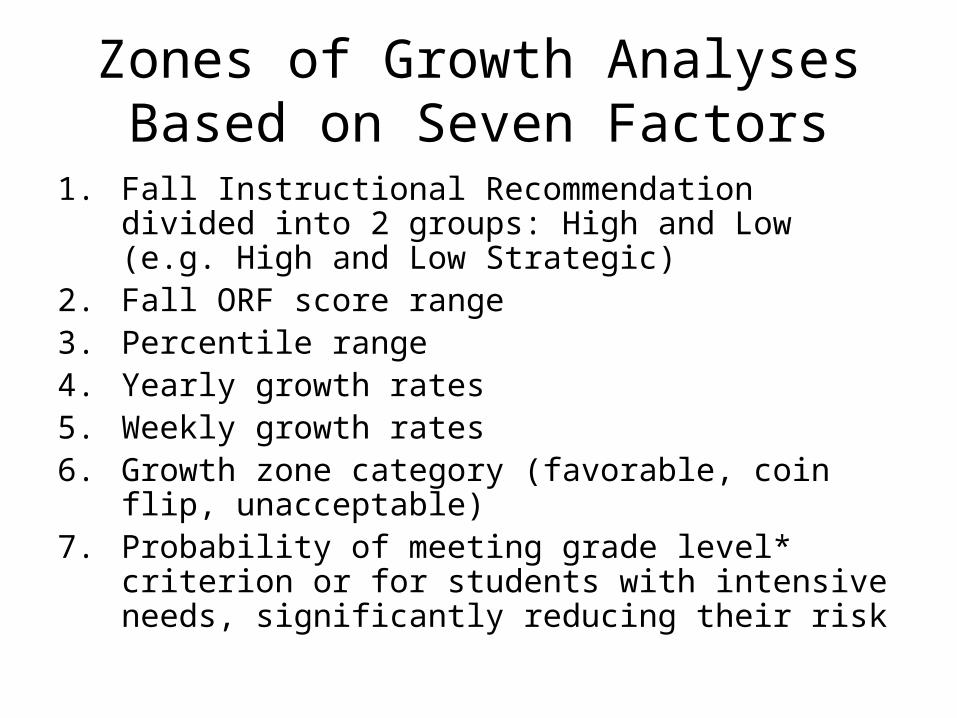
Zones of Growth Analyses Based on Seven Factors
1. Fall Instructional Recommendation divided into 2 groups: High and Low (e.g. High and Low Strategic)
2. Fall ORF score range3. Percentile range4. Yearly growth rates5. Weekly growth rates6. Growth zone category (favorable, coin flip,
unacceptable)7. Probability of meeting grade level* criterion or for
students with intensive needs, significantly reducing their risk

Zones of Growth for 2nd Grade Students that Begin the Year with High and Low Benchmark
Instructional Recommendations
Fall Instructional Recommendation
Fall ORF Score
Percentile Ranks (Tech
Report 9)
Yearly Growth Weekly Growth
Zone of Growth
Probability of Meeting Grade
Level Goals (40th Percentile SAT-
10)
High Benchmark 67 and above
61st-99th 45 or greater 1.25 or more Favorable .80 meet 60th Percentile
Low Benchmark 44-66 40th-60th 73 or higher 2.1 or more Favorable .70 meet 60th Percentile
41-72 1.14-2.0 Acceptable* .82
40 or lower 1.11 or less Unacceptable .20
Note: Weekly growth rates based on 36 weeks of instruction from mid-September to mid-June

Zones of Growth for 2nd Grade Strategic Students that Begin the Year with High and Low Strategic
Instructional Recommendations
Fall Instructional Recommendation
Fall ORF Score
Percentile Ranks (Tech
Report 9)
Yearly Growth
Weekly Growth Zone of Growth Probability of Meeting Grade
Level Goals (40th Percentile
SAT-10)
High Strategic 33-43 28th-39th 51 or greater 1.4 or more Favorable .70
36-50 1-1.39 Coin Flip* .51
35 or below .97 or less Unacceptable .19
Low Strategic 26-32 20th-27th 61 or higher 1.7 or more Favorable .70
35-60 .97-1.6 Coin Flip* .47
34 or lower .94 or less Unacceptable .20
Note: Weekly growth rates based on 36 weeks of instruction from mid-September to mid-June.

Zones of Growth for 2nd Grade Students that Begin the Year with High and Low Intensive
Instructional Recommendations
Fall Instructional Recommendation
Fall ORF Score
Percentile Ranks (Tech
Report 9)
Yearly Growth
Weekly Growth
Zone of Growth
Probability of Meeting Grade Level Goals
(30th Percentile SAT-10)
High Intensive 12-25 7th-19th 62 or greater 1.7 or more Favorable .70
44.-61 1.2-1.69 Coin Flip* .52
43 or below 1.19 or less Unacceptable .20
Probability of Meeting Grade Level Goals
(25th Percentile SAT-10)
Low Intensive 0-11 1st-6th 61 or higher 1.69 or more Favorable .50
27-60 .75-1.68 Unacceptable .07
26 or lower .72 or less Unacceptable .02
Note:Weekly growth rates based on 36 weeks of instruction from mid-September to mid-June.


![Response to Intervention (RtI) Handbook and RtI Resources · 2016-12-09 · OASD RtI Handbook [2] Response to Intervention (RtI) Overview Core Principles of RtI RtI is grounded in](https://static.fdocuments.us/doc/165x107/5f04175d7e708231d40c46b9/response-to-intervention-rti-handbook-and-rti-resources-2016-12-09-oasd-rti.jpg)