Goods and Service Tax-Constitution (122nd Amendment) Bill,2014

CHAPTER
One Economic India: For Goods and in the Eyes of the Constitution
11
Where the world has not been broken up into fragments by narrow domestic walls.
– Rabindranath Tagore
The popular impression is one of an India having achieved political integration but an incommensurate economic integration. Based on a novel source of Big Data—invoice-level transactions from the Goods and Services Tax Network (GSTN)—the chapter documents high levels of internal trade in goods. India’s internal trade-GDP ratio at about 54 percent is comparable to that in other large countries. The chapter also documents patterns of trade flows across states which are consistent with priors but also throw up surprises, for example, that Uttar Pradesh is a net exporter of, and hence competitive in, manufacturing. The extent to which the Constitutional provisions facilitate the creation of one economic India is discussed in a final section.
IntroductIon
11.1 When, several decades ago, an earnest Raj Kapoor famously sang “Phir bhi dil hai Hindustani,” (“Still, my heart is Indian”), he was expressing what in hindsight appears to be a deep insight on comparative national development. To the Bismarckian sequence “We have created Europe. Now we must create Europeans,” the Raj Kapoor counter seems to be that India’s founding fathers certainly created (and rightly favored creating) Indians in spirit and political consciousness.1 The open question is whether they created one economic India, one market place for the free, unimpeded movement of goods and people. A cautious reading of
the Constitution and the Constitutional Assembly debates intimates uncertainty; a less cautious reading indicates that the needs of creating one economic India were actually subordinated to the imperatives of preserving sovereignty for the states (Section 2 below).2 11.2 This chapter attempts to assess the extent to which India, which for nearly seventy years has affirmed and re-affirmed the political “idea of India,” is de facto and de jure one economic India. At a time when international integration is under siege and when India is on the cusp of implementing transformational reforms to create “One India, One Market, One Tax,” via the Goods
1 This is a paraphrase of “We have created Italy. Now we must create Italians,” by Italian statesman Massimo d’Azeglio after Italian unification.
2 The difficulties of European integration reflected in the Brexit vote and in the acrimonious debates on the design of the euro seem to suggest that perhaps the Indian sequencing was not just not inappropriate but prescient.

232 Economic Survey 2016-17
and Services Tax (GST), it seems appropriate to ask how much internal integration India has achieved. To be clear, unless otherwise specified, hereafter, trade will refer to trade between states within India.11.3 This is done on the basis of a new “Big Data” set available from the Goods and Service Tax Network (GSTN- invoice level data on interstate movement of goods). Box 1 describes in detail how these data have been prepared but for now the main findings are summarised.
11.4 Contrary to perception and to some current estimates, it seems that India is highly integrated internally, with considerable flows of both people and goods. The headline findings are:• The first-ever estimates for interstate
trade flows indicate that cross-border exchanges between and within firms amount to at least 54 per cent of GDP, implying that interstate trade is 1.7 times larger than international trade. Both figures compare favourably with other jurisdictions: de facto at least, India seems well integrated internally. A more technical analysis confirms this, finding that trade costs reduce trade by roughly the same extent in India as in other countries.
• A potentially exciting finding for which we have tentative not conclusive evidence is that while political borders impede the flow of people, language (Hindi specifically) does not seem to be a demonstrable barrier to the flow of goods.
• The patterns of flows of goods are broadly consistent with priors but also throw up some surprises: o For example, on trade as a per
cent of GSDP, smaller states like Uttarakhand, Himachal Pradesh and Goa trade more; the net exporters are the manufacturing powerhouses of Tamil Nadu and Gujarat but otherwise agricultural Haryana and Uttar Pradesh are also powerhouses because of Gurugram and NOIDA, respectively which have become part of the great Delhi urban agglomeration.
• Another finding is that the costs of moving are about twice as great for people as they are for goods (Chapter 12).
• There is a potential dampener on our finding that trade in goods is high within India. This may be a consequence of the current system of indirect taxes which perversely favours interstate trade over intra-state trade, especially in the cases of final consumption items, exempted goods, or goods that are input tax credit ineligible. If true, the GST by ironing out these oddities may normalise interstate trade3.
• A final finding is that we are able to quantify not just arms-length interstate trade (that is trade between firms), but also intrafirm trade across states. The latter is, surprisingly large (at least 68 per cent of interfirm trade), and is affected by trade costs to a greater extent than interfirm trade. It is also surprising given the constitution favours preserving state sovereignity over one market.
11.5 This chapter is organized as follows. In Section 1, we document our findings on trade. Section 2 examines the Constitutional provisions on promoting internal integration by comparing it with other models. The open question is whether laws can more proactively facilitate the economic integration of India.
3 GST may still improve revenue collection through increased compliance, competitive enhancement benefits and other channels

233One Economic India: For Goods and in the Eyes of the Constitution
4 A detailed review of intra-national studies for India returns a single study, undertaken by the Directorate General of Commercial Intelligence and Statistics (DGCIS) Kolkata. The data captures trade flows between states only of goods moved through rail, air and inland waterways, failing to capture the most important component of trade via roads. Crucially, this data also fails to capture the rupee value of the trade flows and only captures quantities. http://www.dgciskol.nic.in/vaanijya/Indiaper cent20Internalper cent20Trade.pdf
SectIon 1. one IndIa: Internal trade In GoodS
Figure 1. Freight trucks queued up close to a border (© Yann Forget / Wikimedia Commons / CC-BY- SA-3.0)
11.6 Images of queues of trucks in India, idling at state borders with their drivers haggling for official clearances or being subject to extortion are legion (Figure 1). The consequent damages to trade and economic activity too have been extensively catalogued. But is there empirical truth to these disparaging descriptions of India?
11.7 While international barriers to trade have been studied extensively, less attention has been devoted to studying the impact of trading networks and other barriers (political and cultural) to trade within countries. The estimation of these barriers to intra-national trade for India has hitherto been challenging due to the absence of a comprehensive interstate trade dataset. This chapter presents the first estimates of internal trade within
India using a novel data source – transactions recorded in the process of Central Sales Tax (CST) collection as provided by Tax Information Exchange System (TINXSYS)4. This data covers all modes of transportation, including over road, which had been missing from previous attempts to study interstate trade flows.
I. Does India Trade More Than Other Countries?
11.8 Table 1 compares India’s international and intra-national trade flows with that of other countries. The results here are surprising: India’s aggregate interstate trade (54 per cent of GDP) is not as high as that of the United States (78 per cent of GDP) or China (74 per cent of GDP) but substantially

234 Economic Survey 2016-17
greater than provincial trade within Canada and greater than trade between Europe Union (EU) countries (which is governed by the “four freedoms”: allowing unfettered movement of goods, services, capital, and people). This is all the more striking given that the data here covers mainly manufactured goods, excludes agricultural products, and is therefore an underestimate of total internal
Table 1. Comparisons of International and Interstate Trade Flows
Country Year Interstate/GDP International/GDP Ratio of Interstate to International
Brazile 1999 76% 14% 5.4USAa 2015 78% 31% 2.5India (C+F form) 2015 54% 32% 1.7India (C Form) 2015 32% 32% 1Chinad 2009 74% 45% 1.6Canadab 2012 20% 62% 0.3European Unionc 2015 20% 84% 0.2Indonesiaf 2005 12% 63% 0.2
a: Freight Analysis Framework Data Tabulation Tool, b: Statistics Canada, c: Eurostat, d: Xing, Whalley and Li(2015), e: Vasconcelos (2001), f: Firdaus and Widiyasanti (2010)
trade in goods.5 A substantial portion (almost half) of trade across states in India occurs as stock transfers within firms. That is, intrafirm trade is high relative to arms-length trade.6
11.9 Another way of gauging the magnitude of trade is to compare countries’ internal trade with their international trade. India’s internal trade is about 1.7 times its international trade
Figure 2. Ratio of Interstate to International Trade by Log of Area
5 In the present study the commodities are limited to those that are liable for CST. In broad terms, the trade patterns shown here pertain to manufactured goods more than agricultural goods or services. Box 1 outlines the data preparation strategies we have employed to bring the TINXSYS data into “shape” for conducting the analysis of interstate trade.
6 In the following sections, arms-length and intrafirm trades are referred to, respectively as C-Form and F-Form trade in deference to the procedural requirements imposed by the administration of the CST. C-forms impose a 2% CST on goods trade, whereas F-form do not incur any taxes on account of the trades being stock transfers

235One Economic India: For Goods and in the Eyes of the Constitution
7 Manufacturing as a share of GSDP is a simple average of manufacturing share obtained from CSO 2011-12 base series for the financial years 2012-2015.
8 This relationship holds even between exports as a per cent of GSDP and manufacturing share of GSDP. 9 The trade flows for interfirm trades (C Forms) are a close measure of what it would be for all states since we capture
flows between all states except north-eastern states, Punjab and union territories.
of 32 per cent of GDP. By this criterion, India’s trade profile more similar to that of China, whose internal trade is 1.6 times its international trade but less than the United States whose internal trade is 2.5 times its international.
11.10 The intuition from standard gravity models of trade is that large countries trade more within their own borders than beyond them because of the size of their domestic markets. Figure 2 illustrates this relationship for India and other countries by plotting the ratio of internal to international trade against a country’s size. By this metric, the real outliers are Canada whose internal-external trade seems unusually low for its size and Brazil for whom this ratio seems unusually high. In contrast, India seems quite standard: the caricature of a country that is closed to international trade now seems dated (Chapter 2, Figure 1B), but so too does the caricature of a country closed to internal trade.
II. relatIonShIp between InterState trade and ManufacturInG
11.11 Figure 3 plots arms-length (between two different firms) and intrafirm trade flows against the manufacturing share of states’ GSDP7. There is a strong correlation between a state’s manufacturing share of GSDP and its trade volumes (as a per cent of GSDP) along expected lines because our data captures trades in manufacturing items only8. The other key observation to be made from the figure is the exceptional manufacturing share of Uttarakhand, Himachal Pradesh and Goa relative to other states. This manufacturing prowess in turn is associated
with higher interstate trades. The reasons are discussed in the following sections.
Figure 3. Relationship between Interstate Trade and Manufacturing Output
III. patternS of InterState trade: arMS-lenGth trade9 Openness to Interstate Trade (Exports + Imports)
11.12 Figure 4 plots the value of domestic trade in Indian states as a per cent of their GSDP. The most open states by this measure are Uttarakhand, Goa, Himachal Pradesh and Gujarat with Assam, Bihar and Uttar Pradesh bringing up the rear. High GSDP states such as Maharashtra and Tamil Nadu are conspicuous in their absence from the top of the list – though their trade to GSDP ratio is still substantial at 33 per cent and 24 per cent, respectively. This is the first of many indications that while India’s borders seem porous, this might be because of its complex regulations rather than inspite of it.
11.13 This is illustrated for two of the positive outliers - Himachal Pradesh and Uttarakhand, whose exceptional trade volumes might be explained by the exemption from central excise tax for manufacturing in these

236 Economic Survey 2016-17
Figure 4. Arms-Length Trade (Per cent of GSDP)
states10. The outlier status of these states is even more apparent when we examine the gravity relationship across states in the later sections – that is, whether smaller states trade more than larger ones.
11.14 The outliers on the under-performing side are Assam (5.3 per cent), Bihar (9.9 per cent) and Kerala (17.9 per cent), who have much lower trade openness than what their size would predict. This is not surprising in view of Figure 3 which shows that these states have small manufacturing share in their GSDP. The other possibility is the exclusion of north-eastern states that may be important trading partners for Assam and Bihar.
11.15 Figure 5 plots the relationship between trade within India, Canada and US states and the log of their land area. Indian states exhibit a negative relationship between the size of the state and the openness to both inter- and intrafirm trade. Also of note is that Canadian and US states contrary to India show a weak relationship between land area and openness to trade. The linear fit is flat and even positive for the United States. So, the gravity intuition that small jurisdictions
should trade more outside than inside is borne out to a greater extent for the Indian states than the United States or the provinces within Canada. Given this relationship, Uttarakhand, Himachal Pradesh and Gujarat stand out with much higher trade than other states of similar size in India which could be explained by domestic taxes. Figure 5. Trade Volume for Indian, American
and Canadian states (per cent of GDP)
Balance of Interstate Trade: Net exporters and net importers
11.16 If the sum of exports and imports measures how open a jurisdiction is, the balance of trade is a useful, if imperfect, measure of that jurisdiction’s manufacturing competitiveness. The mercantilist view of trade is that exports are good and imports are bad and that the measure of a jurisdiction’s economic strength is the net balance on its trade, with net exports (especially in manufacturing) signifying strength and net imports signifying weakness.
11.17 Figure 6 uses the GSTN database to show state-wise trade balances of arms-length trade flows.11 The variation is enormous, from a trade deficit of nearly
10 In Himachal Pradesh, for example, there is a high concentration of flows into firms registered in the Baddi/Solan/ Guru Majra area of the state, whereas for Uttarakhand the trade concentration is high in addresses originating in SIDCUL zones of the state. These are the areas with high industrial concentrations in the two states.
11 The sample of states in intrafirm data is different from interfirm trades due to differences in reporting requirements between C and F-forms. It is not compulsory for states to be uploading their F-form data on the TINXSYS system causing the import flows of these states to be missing from the dataset. Their trade flows are excluded to produce a balanced panel of importer and exporter states.

237One Economic India: For Goods and in the Eyes of the Constitution
trade data (using the F-forms) exists, the corresponding import side of trade has not been reported for these states.
IV. patternS of InterState trade: IntrafIrM trade 11.20 Figure 7 plots the intrafirm patterns of trade across states as a percentage of their GSDP (See Box 1 for how the numbers were obtained.). Goa, Gujarat and Maharashtra, relative to other states, are as open to intrafirm trades as they are to arms-length trades. On the lower end of intrafirm trade openness are Uttar Pradesh (8.4 per cent), Rajasthan (11.8 per cent) and West Bengal (15.5 per cent). The fixed cost of setting up companies in these states may potentially be causing frictions in intrafirm trade flows in these states.
Figure 7. Intrafirm Trade (as a per cent of GSDP)
11.21 Comparing intrafirm and arms-length trade for the same sample of state pairs in Figure 812 indicates that there is no discernible correlation between the two types of trades – a state open to arms-length trade may not be equally amenable to intrafirm trade. Madhya Pradesh stands out as having much higher intrafirm trade than interfirm trade, possibly owing to its
Figure 6. Trade Balance (Net Exports as per cent of GSDP)
12 The relative ranking of states in terms of arms-length trade in Figure 4 is different from Figure 8 is because of the differences in sample of state pairs. In the latter, to make the comparisons with intrafirm trades, we consider only the 15-by-15 state pairs which are the same states as those that are available in the F-form dataset.
45 per cent of GSDP in Uttarakhand and a trade surplus of nearly 25 per cent of GSDP in Haryana.
11.18 The large manufacturing states – Gujarat, Maharashtra and Tamil Nadu have a positive balance of trade highlighting their competitive manufacturing capabilities. This positive balance is also a feature of Delhi (7.4 per cent), Haryana (26.1 per cent) and UP (4.2 per cent), reflecting the large value additions occurring in the manufacturing hubs of the National Capital Region, namely Gurugram and NOIDA. Gurugram and NOIDA, respectively, make otherwise-agricultural Haryana and UP manufacturing powerhouses (by Indian standards).
11.19 Uttarakhand, Himachal Pradesh and Goa (seen earlier to possess the highest trade to GSDP ratios) are predominantly trade balance deficient. This may be because we do not observe import side intrafirm trade flows. It is likely that these states’ special status (in terms of tax exemptions) would encourage firms to allocate some intermediate stages of their production process there, followed by intrafirm exports. Observing the intrafirm net export flows is, however, not possible because even though the export side of this

238 Economic Survey 2016-17
Figure 8. Intrafirm and Interfirm Trade (per cent of GSDP)
central location in the country, making it ideally suited to logistics supply chains.
variation in the underlying commodities represented in the two types of flows. Such disparities have also been documented in the context of international trade by Bernard et al (2007). Appendix Table 4 shows the top 15 commodities by value represented in the intrafirm and arms-length trade imports in Andhra Pradesh and Telangana in FY 2015 (two states which have good quality commodity information). Only five of these 15 product categories (highlighted in green) are common to both types of flows. Thus the types of products produced in each state, their suitability to F-form related transfers and the fixed costs of setting up subsidiaries may jointly determine these flow trends across states.
11.22 These differences in intrafirm trade could also be due to the considerable
Box 1. Interstate Trade in India: Data Preparation and ChallengesThe estimates for interstate trade values and trade balances were calculated using the TINXSYS dataset, administered and hosted by the Goods and Services Tax Network (GSTN). TINXSYS contains CST tax invoices for trades occurring between two states. The dataset is populated by the states individually uploading different CST-related forms – i.e, the trade values reported are imports into a state because CST forms are issued by the importing states. In the ideal case, each reported transaction is expected to have the Tax Identification Numbers (TINs) of the importing and exporting firms, the invoice date and value, date of issue of the CST form, the nature of these firms, a code for the commodity and the commercial tax office at which the firms are registered. The data is however not reported in this consistent format, with the most crucial data point – the name or the code of the exporting state or the TIN of the exporting firm – is misreported in the dataset - about 5% of the time. The level of misreporting varies slightly across states with Gujarat having the highest proportions at 10%.
Given that the name of origin and destination state for any trade flow is key to understanding interstate trade patterns, we apply several techniques to impute exporting state identifiers for missing observations. First, we attempt to purge the exporting firm TIN numbers of special characters or simple typographical errors that might have occurred during the data uploading process. For the resulting 11-digit TIN numbers, we are able to correctly identify the exporting state using the first two digits of the TIN (the first two digits of the TIN corresponds to the state’s census code).
For the remaining set of missing data transactions, we query the unique serial number and series number of these missing observations on the GSTN website to explore if states may have manually entered the exporting firm’s address. For these addresses, we conducted a fuzzy string match with census names for district, sub-districts and towns. For the matched observations, we are then able to identify the corresponding state names from the Census.
In the third round, for the observations that still continued to be missing, we used Geographic Information Systems (GIS) mapping APIs to identify the geolocation for these firms as best as possible. These geolocations were then taken to QGIS (GIS software) and spatially merged with a state shapefile to arrive at the exporting state name. In the final round, to trim outlier trade values that seemed to be typographical errors, a filter of 1% of GSDP was applied on individual transactions. This implied that all transaction of value greater than 1% were excluded from the dataset. This strategy is not comprehensive in correcting the data for all errors (or minimising misclassification errors). A comprehensive data correction exercise would require review of all high value transactions, which has not been conducted in the interest of time. However, the CST collection implied by the exercise is 85% of the States' reported CST collections based on their own administrative dataset indicating are coverage of the actual trade data.

239One Economic India: For Goods and in the Eyes of the Constitution
V. IS IndIan InterState trade unuSual? forMal eVIdence froM a GraVIty Model
11.23 The evidence shown so far suggests that contrary to the received wisdom, India’s internal trade does not seem unusually low. But what about the distance cost of trade? Gravity models of trade are one of the most empirically robust relationships and theoretically grounded toolkits used in the analysis of estimating trade costs and their impacts on trade flows13. The basic intuition is that trade between two jurisdictions will be greater: the richer they are, the closer together they are, and fewer the policy and other cultural barriers between them.
11.24 All these predictions are borne out by the Indian data. Table 2 shows that richer states trade more with each other; states that are closer together trade more; contiguity matters as does the distance between
economic agents. For the interested reader, an extensive set of robustness checks and interpretation for the different coefficients is provided in Appendix Table 5.
11.25 Model (1) in Table 2 captures the basic gravity specification: log of arms-length trades regressed on distances (between economic capitals of the states), a dummy to capture Hindi-speaking trading partners and the GDP of the importing and exporting state. Model (2) uses fixed effects to capture time-invariant state level unobservable characteristics which also absorbs their GSDPs. Model (4) is the same fixed effects specification on log of intrafirm trades; Model (3) has interfirm flows as the dependent variable but includes only those states for which intrafirm flows are also known. Models (5) and (6) estimates the gravity model on US-data to benchmark the coefficients for India.14 Models (2), (4) and (6) are our preferred specifications for arms-
Table 2. Gravity Specification for Interstate Trade in India and the US
13 The derivation for the gravity specification has been outlined in Economic Survey 2015-16’s statistical appendix.14 We exclude the agriculture flows from the US data to make the products comparable to the Indian dataset.
Dependent Variable: Log(Value of Imports)
India United StatesInter-Firm Intra-Firm Excluding Agriculture
(1) (2) (3) (4) (5) (6)Log(Distance): Economic Capital
-0.928*** -0.565*** -0.539*** -0.810*** -0.965*** -0.938***(0.169) (0.0952) (0.116) (0.1674) (0.024) (0.068)
Adjoining State Dummy 0.349* 0.638*** 0.704*** 0.495** 0.994*** 0.937***(0.193) (0.117) (0.123) (0.1999) (0.072) (0.097)
Hindi Dummy -0.391** -0.0225 -0.037 0.406* (0.187) (0.133) (0.16) (0.2330)
Log(Importer GSDP) 0.816*** 1.101*** (0.0934) (0.017)
Log(Exporter GSDP) 0.958*** 0.928***(0.0568) (0.017)
Importer State FE No Yes Yes Yes No YesExporter State FE No Yes Yes Yes No YesR-squared 0.522 0.903 0.91 0.83 0.83 0.9Observations 380 380 210 210 2450 2450
Robust standard errors in parentheses*** p<0.01, ** p<0.05, * p<0.1
Table 2. Regression Coefficients for gravity model

240 Economic Survey 2016-17
length trade, intra-firm trade and trades in the US, respectively.
11.26 The results from these models can be interpreted as follows:
• Distance - The most remarkable finding is that India’s elasticity of trade flows with respect to distance is much lower than one might have expected – a 10 percentage point increase in distances between economic capitals results in a fall in trade of only 5.65 percentage points15. Contrast this with the US, which enjoys a much better freight infrastructure, where a 10 percentage point increase in distance results in trade falling by 9.3 percentage points. In Section VI, an attempt is made to explain why India might have a lower distance elasticity than the US.
• State GDP coefficients – The elasticity of trade with respect to income is positively correlated with trade flows: a 10 percentage point increase in GDP of an importing or exporting state is associated with an 8.2 and 9.6 percentage points increase in trade, respectively. The elasticity of trade with respect to income is higher in the US at 11 and 9 percentage point for 10 percentage point increase in GDP.
• Proximity coefficient – Adjoining states in India tend to trade with each other about 90 per cent16 more than other states17. This effect is lower than the US, where
interstate trade patterns are dominated by adjoining state pairs.
• Language coefficient – In the international trade literature, the language dummy has been found to be persistently positive and significant, implying that countries with shared languages tend to trade with each other more than with others. Subramanian and Wei (2007), for example, find that trade between countries sharing a common language is 16 per cent higher than others, whereas, Rose (2003) reports a 30 per cent higher trade for such country pairs. It is therefore surprising that there is insufficient evidence for this to be true within India; the Hindi dummy is insignificant for interfirm interstate trade but positive and weakly significant for intrafirm trade18.
VI. Explaining the puzzle: Why Does India Trade so Much?
11.27 Contrary to priors, it seems that India may be have a pro-trade bias. Why might this be the case? One plausible answer is that the current structure of domestic taxes as well as area-based tax exemptions might actually bias economic activity towards more internal trade.
Area-based exemptions
11.28 Since our data is derived from declarations filed for tax purposes, this is particularly pertinent.
15 For intrafirm flows a 10 percentage point increase in distance between two states is associated with a decrease in intrafirm trade of about 8.1 percentage points. The coefficient of trade with respect to distance is higher for intrafirm trade than for interfirm trade within India even when the gravity model is estimated on the same set of state-pairs (model (3)). The appendix indicates why this might be plausible.
16 Exp(.638)-1=.89217 For intrafirm trades, the adjoining states still trade more than states further away (about 63 per cent more).18 For intrafirm trades, the coefficient is significant at 90 per cent confidence, perhaps reflecting the fact that it is easier
for firms to establish subsidiaries in states where they share a common language and where they are able to navigate the regulatory requirements of the state in setting up their companies. When instead trading at an arms-length this linguistic dependence seems statistically insignificant.

241One Economic India: For Goods and in the Eyes of the Constitution
11.29 The Central Excise Act exempts manufacturing in certain states from excise duty, including all the North-eastern states, Sikkim, Jammu and Kashmir, Uttarakhand, Himachal Pradesh and Kutch in Gujarat.19 This exemption creates a strong incentive to shift real or reported production to these areas over what might be dictated by comparative advantage, trade costs and other traditional determinants of trade and firm location.
The CST and VAT
11.30 Under the current system, states levy a value-added tax on most goods sold within the state, the centre levies a near VAT-able excise tax at the production stage. Sales of goods across states fall outside the VAT system and are subjected to an origin-based non-VATable tax (the Central Sales Tax, CST). It turns out that the CST – far from acting as a tariff on interstate trade – may actually provide an arbitrage opportunity away from a higher VAT rate on intra-state sales in some cases.
11.31 The crucial determinant of whether the CST acts as a tariff is whether the buyer can receive an input tax credit (ITC) on the purchase if done within state20. The input tax credit is the defining feature of a VAT – without this you are taxed not just on your value addition but on the entire sale value– as
with the CST. In such cases a buyer would much prefer to pay the lower 2 per cent CST rate than the higher VAT rate. In general, this situation arises whenever the firm is a final consumer, or when the firm is a manufacturer of tax exempt goods21. Far from being a rare occurrence, there are some big ticket items that fall into this category, like petrol, diesel, construction material and some machinery. In addition, most states provide a “negative list” of commodities that do not receive input tax credits even within state. This negative list of items represents at least 22 per cent22 of imports in Andhra Pradesh. Within this negative list, automobiles and automobile parts alone constitute 16 per cent of the value of imports into Andhra. ITC non-eligible items constitute at least 30 per cent of imports in Odisha23.
11.32 For all other goods, purchasing goods out of state would mean foregoing any input tax credits accrued, thereby raising costs and making it a less attractive proposition. Without a counterfactual, it is not possible to measure to what extent interstate trade in these goods is suppressed by the tax distortion. However, the relatively low elasticity of trade in India with respect to distance and the comparability of India’s trade to international norms seems to suggest that the pro-trade bias wins over the disincentives to trade.
19 The excise duty is a value added tax levied at the point of production. The tax applies to the value addition declared at factory gate.
20 See appendix for a detailed explanation. 21 A detailed review of these possible cases is available in the appendix.22 Rule 20 (2) of AP VAT Act. This is based on a conservative reading of which goods are ITC ineligible. For example,
input used in construction and maintenance of buildings are not eligible for ITC. Iron and steel might fall into this category and but we exclude because iron and steel can be ITC deductible if it is used in execution of a works contract. Since there are some invoices that do not contain commodity identifiers, this number may be even higher. Finally, inputs in the manufacture of tax exempts goods are also ineligible for ITC but are excluded in the 22 per cent since it is not possible to identify which of these imports were used in manufacture of exempt goods.
23 https://odishatax.gov.in/Schedules/VAT/VAT-SCHEDULE-D-20-01-2016.pdf, https://odishatax.gov.in/Schedules/VAT/VAT-SCHEDULE-C-20-01-2016.pdf

242 Economic Survey 2016-17
11.33 In this case, when the Goods and Service Tax (GST) is implemented, by eliminating these distortions, it will actually lead to a normalisation in internal trade.
VII. concluSIon
11.34 Contrary to the caricature, India’s internal trade in goods seems surprisingly robust. This is true whether it is compared to India’s external trade, internal trade of other countries, or gravity-based trade patterns in the United States. For example, the effect of distance on trade seems lower in India than in the US. Hearteningly, it seems that language is not a serious barrier to trade.
11.35 There is enormous variation across states in their internal trade patterns.
Smaller states tend to trade more, while the manufacturing states of Tamil Nadu, Maharashtra and Gujarat tend to have trade surpluses (exporting more than importing). Belying their status as agricultural and/or less developed, Haryana and Uttar Pradesh appear to be manufacturing powerhouses because of their proximity to NCR.
11.36 The analysis does leave open the possibility that some proportion of India’s internal trade could be a consequence of current tax distortions, which are likely to be normalised under the GST. One market and greater tax policy integration but less actual trade is an intriguing future prospect.

243One Economic India: For Goods and in the Eyes of the Constitution
I. IntroductIon
11.37 The GST was justly touted as leading to the creation of One Tax, One Market, One India. But it is worth reflecting how far India is from that ideal. Indian states have levied any number of charges on goods that hinder free trade in India—octroi duties, entry taxes, Central Sales Tax (CST) to name a few. The most egregious example of levying charges of services coming from other states is the cross-state power surcharge that raises the cost of manufacturing, fragments the Indian power market and sustains inefficient cross-subsidization of power within states. In agriculture, Agriculture Produce Market Committee (APMCs) still proliferate which prevent the easy sales of agricultural produce across states, depriving the farmer of better returns and higher incomes, and reducing agricultural productivity in India. These measures in agriculture, goods, and services make light of claims that there is one economic India.
11.38 It is also worth reflecting on the strength of the Constitutional arrangements in facilitating the creation of an Indian common market. Discussions around the Constitution are inevitably inward focused but in this instance it is worth analysing these arrangements from a cross-country perspective. There is an obvious conceptual commonality of public policy objectives in large federations or supra-national entities: balancing the imperative of creating a common market so that all producers and consumers are treated alike, with the imperative of not undermining the legitimate sovereignty of the sub-federal units. Three comparators suggest themselves: other federal countries such as the United States; other federal structures comprising countries such as the European Union; or multilateral trading agreements such as the World Trade Organization (WTO).
SectIon 2: one IndIa: before the law
II. IndIa’S conStItutIonal proVISIonS and JurISprudence
11.39 That comparison requires understanding the constitutional provisions on both achieving and circumscribing the common market. Articles 301-304 provide a layered set of rights and obligations. Article 301 establishes the fundamental principle that India must be a common market:
301. Freedom of trade, commerce and intercourse. Subject to the other provisions of this Part, trade, commerce and intercourse throughout the territory of India shall be free.
Articles 302-304 both qualify and elaborate on that principle.
Article 302 gives Parliament the power to restrict free trade between and within states on grounds of public interest.
302. Power of Parliament to impose restrictions on trade, commerce and intercourse. Parliament may by law impose such restrictions on the freedom of trade, commerce or intercourse between one State and another or within any part of the territory of India as may be required in the public interest
Article 303 (a) then imposes a most-favored-nation type obligation on both Parliament and state legislatures; that is no law or regulation by either can favor one state over another.
303. Restrictions on the legislative powers of the Union and of the States with regard to trade and commerce
(1) Notwithstanding anything in Article 302, neither Parliament nor the Legislature of a State shall have power to make any law giving, or authorising the giving of, any preference to one State over another, or making, or authorising the making of, any discrimination between one State and another, by virtue of any entry relating to trade and commerce

244 Economic Survey 2016-17
in any of the Lists in the Seventh Schedule
Article 304 (a) then imposes a national treatment-type obligation on state legislatures (apparently not on Parliament); that is, no taxes can be applied to the goods originating in another state that are also not applied on goods produced within a state. This Article refers only to taxes and not to regulations more broadly.
304. Restrictions on trade, commerce and intercourse among States Notwithstanding anything in Article 301 or Article 303, the Legislature of a State may by law
(a) impose on goods imported from other States or the Union territories any tax to which similar goods manufactured or produced in that State are subject, so, however, as not to discriminate between goods so imported and goods so manufactured or produced; and
But then Article 304 (b) allows state legislatures to restrict trade and commerce on grounds of public interest.
(b) impose such reasonable restrictions on the freedom of trade, commerce or intercourse with or within that State as may be required in the public interest: Provided that no Bill or amendment for the purposes of clause shall be introduced or moved in the Legislature of a State without the previous sanction of the President
11.40 Interestingly, this freedom to the states in Article 304 (b) is only different from that provided to Parliament in Article 302 in that states have to impose “reasonable restrictions” whereas Parliament may impose “restrictions.” Of course, states can only impose restrictions in areas that are either on the state or concurrent list.
11.41 The gist of these provisions is that both the Centre and the States have considerable freedom to restrict trade and commerce that hinder the creation of one India.
11.42 Moreover, the jurisprudence has unsurprisingly come down in favor of even more permissiveness. Evidently, while the purpose of Part XIII was to ensure free trade in the entire territory of India, this is far from how its practical operation has panned out. Financial levies as well as non-financial barriers imposed by the States have become a major impediment to a common market. Levies in the nature of motor vehicles taxes, taxes at the point of entry of goods into specified local areas, sales tax on manufacturers of goods from outside a particular State, have always existed between States. At the same time, many of such levies are constitutionally valid and have been upheld, in principle, by the Supreme Court. For instance, in Shree Mahavir Oil Mills v. State of Jammu and Kashmir,24 the Supreme Court upheld a notification issued under the Jammu and Kashmir General Sales Tax Act, 1962 which exempted the local producers of edible oil from sales tax in order to protect their businesses from facing closure. At the same time, the notification increased the tax to be paid by the manufacturers of edible oil from other States from 4per cent to 8 per cent. When challenged, the Supreme Court refused to quash this notification on the ground that it was necessary to protect the edible oil industry in the State of Jammu and Kashmir and was an adequate measure under the scheme of Part XIII of the Constitution.25 In several cases where entry taxes have been challenged, the Supreme Court has upheld their validity on the ground that these taxes are ‘compensatory’26 in nature, which means that the proceeds from
24 1996) 11 SCC 39. 25 Ibid., para 26. 26 The ‘compensatory tax’ theory was evolved in by Justice SK Das in Automobile Transport (Rajasthan) Ltd. v. State
of Rajasthan, AIR 1962 SC 1406 who said that “Regulatory measures or measures imposing compensatory taxes for the use of trading facilities do not come within the purview of the restrictions contemplated by Article 301 and such measures need not comply with the requirements of the proviso to Article 304(b) of the Constitution.” (para 17)

245One Economic India: For Goods and in the Eyes of the Constitution
the taxes are used for facilitating trade in the charging State.27
11.43 This was not entirely unexpected— in looking to achieve free trade while protecting the sovereignty of states to raise revenue would always have led to trade-offs. With nearly seventy years of experience, it is clear that the trade-offs have been such that any hopes of a common market have been effectively crippled. In 2016, even though the Supreme Court has rejected the compensatory tax theory, it has upheld the right of States to levy entry taxes.28 It is submitted that this view of the Court is entirely consonant with the constitutional scheme of Part XIII, which when read as a whole, seeks economic integration while ensuring considerable leeway for states to differentiate their own products from those from other states.
III. proVISIonS In other countrIeS
11.44 How does this compare with other jurisdictions? The United States has a very strong interstate commerce clause in the Constitution. Article I, Section 8, Clause 3 vests Congress with the power: “to regulate commerce with foreign nations, and among the several states, and with the Indian tribes.”
11.45 The rationale for this provision was best explained by James Madison in the Federalist Papers. He wrote, “A very material object of this power was the relief of the States which import and export through other States, from the improper contributions levied on them by the latter.
Were these at liberty to regulate the trade between State and State, it must be foreseen that ways would be found out, to load the articles of import and export, during the passage through their jurisdiction, with duties which would fall on the makers of the latter, and the consumers of the former. We may be assured by past experience, that such a practice would be introduced by future contrivances; and both by that and a common knowledge of human affairs, that it would nourish unceasing animosities, and not improbably terminate in serious interruptions of the public tranquility.”29
11.46 This is to be read with the Tenth Amendment to the Constitution which provides, “The powers not delegated to the United States by the Constitution, nor prohibited by it to the states, are reserved to the states respectively, or to the people.”
11.47 A combined reading of these provisions makes it apparent that even in a Constitution where residuary powers are reserved to the states (and not the Union, as is the case in India), states are constitutionally barred from regulating interstate trade and commerce as it was felt that such power would fundamentally hamper free trade and movement.
11.48 The Supreme Court has largely interpreted the Commerce Clause liberally, ensuring that the power of Congress to regulate interstate commerce is not excessively curtailed, thereby leading to protectionist legislation from particular states.30 A pertinent example, in direct contradistinction
27 See, for instance, Meenakshi v. State of Karnataka, 1984 Supp SCC 326, where enhanced rate of taxes payable by operators of omnibuses, mini buses or stage carriages under the Karnataka Taxation and Certain Other Laws (Amendment) Act, 1979 were justified by the Court on the ground that the proceeds from such taxes would be utilised for construction and maintenance of roads and providing other facilities for free flow of traffic. However the jurisprudence pertaining to compensatory taxes has been rejected by majority in Jindal Stainless Ltd. v. State of Haryana, 2016 SCC OnLine SC 1260 (‘Jindal Stainless’).
28 See, Order of the Supreme Court in Jindal Stainless (n 4) para 6. 29 Federalist No. 42 in Alexander Hamilton, James Madison and John Jay, The Federalist (The Belknap Press,
Cambridge 2009).30 Key to this jurisprudential approach was the “substantial effects” test laid down by the Court in National Labour
Relations Board v. Jones and Laughlin Steel Corp., 301 US 1, that even if an activity is intrastate, if they have a substantial connection or effect on interstate commerce, Congress can exercise power under the Commerce Clause.

246 Economic Survey 2016-17
to the Supreme Court of India’s approach in Shree Mahavir Oil Mills (noted above) is the decision of the US Supreme Court in West Lynn Creamery Inc. v. Healy.31 In Healy, a Massachusetts Pricing Order that required all milk dealers to provide a premium payment into an Equalization Fund was challenged for violating the Commerce Clause. Though the Court found that the premium payments were to be made by all producers, their effect was primarily on out-of-state producers, given that milk producers in Massachusetts were to be compensated by a subsidy from the state. It was thus struck down as its “avowed purpose and its undisputed effect are to enable higher cost Massachusetts dairy farmers to compete with lower cost dairy farmers in other States.”32
11.49 Of course, there are some de facto restrictions, especially in services, reflected in state-specific accreditation or licensing requirements. At the same time, certain judgments have tended to read the Commerce Clause more restrictively.33 But these are exceptions to the general rule of maintaining one common US market.
11.50 Since the Maastricht Treaty that created the common market in Europe, it is now accepted that countries within the EU must not, except under narrow circumstances, restrict the four freedoms of movement: of goods, services, capital, and people. Now, it could be argued that both the US and EU are very different from India because of their long and particular histories of nationhood: for example, it could be argued that Indian states are more diverse than states within the US and hence require greater freedom of tax and regulatory
maneuver. The counter-argument would of course be that the American states were always fiercely jealous of their sovereignty and that the Constitution embodies that. In this view, the strong interstate commerce clause exists despite strong states. It could also be argued, with even less plausibility however, that states within India should have more regulatory freedom than sovereign countries within Europe.
IV. coMparable wto law
11.51 But there is a third and much weaker standard by which Indian rules should be assessed: the WTO. The WTO has a membership of 164 countries with widely varying income levels and political systems: for example, the ratio of per capita GDP of the richest countries is more than 60 times that of the poorest, while the corresponding ratio within India is less than 5. Also, the WTO has democracies like the US and Europe and non-democracies like China whereas all Indian states are democratic. So, it cannot possibly be argued that the Indian states should have greater freedom than countries in the WTO on the issue of creating a common market.
11.52 If that is reasonable, then the comparison between WTO rules and the provisions of the Constitution is not inappropriate. That is, it is reasonable to compare the common-market/regulatory freedom balance provided for countries in the WTO with the same provided for states in the Constitution.
11.53 What then are the comparable WTO rules? The WTO imposes a most-favoured-nation and national treatment
31 512 US 186.32 Ibid. at 194. 33 For an illustrative example, see Kidd v. Pearson, 128 US 1 where the Court held that state regulation of intrastate
production of liquor even when intended for export purposes is valid and not violative of the Commerce Clause.

247One Economic India: For Goods and in the Eyes of the Constitution
requirement just as the Constitution does. But the key difference with the Constitution is the freedom provided to depart from these anti-protectionism requirements. The contrast is really between Articles 302 and 304 (b) of the Constitution and Article XX of the General Agreement On Tariff and Trade (GATT) WTO.
Article XX - General Exceptions
Subject to the requirement that such measures are not applied in a manner which would constitute a means of arbitrary or unjustifiable discrimination between countries where the same conditions prevail, or a disguised restriction on international trade, nothing in this Agreement shall be construed to prevent the adoption or enforcement by any contracting party of measures:
(a) necessary to protect public morals;(b) necessary to protect human, animal or
plant life or health;(c) relating to the importations or
exportations of gold or silver;(d) necessary to secure compliance with laws
or regulations which are not inconsistent with the provisions of this Agreement, including those relating to customs enforcement, the enforcement of monopolies operated under paragraph 4 of Article II and Article XVII, the protection of patents, trade marks and copyrights, and the prevention of deceptive practices;
(e) relating to the products of prison labour;(f) imposed for the protection of national
treasures of artistic, historic or archaeological value;
(g) relating to the conservation of exhaustible natural resources if such measures are made effective in conjunction with restrictions on domestic production or consumption;
(h) undertaken in pursuance of obligations
under any intergovernmental commodity agreement which conforms to criteria submitted to the CONTRACTING PARTIES and not disapproved by them or which is itself so submitted and not so disapproved;*
(i) involving restrictions on exports of domestic materials necessary to ensure essential quantities of such materials to a domestic processing industry during periods when the domestic price of such materials is held below the world price as part of a governmental stabilization plan; Provided that such restrictions shall not operate to increase the exports of or the protection afforded to such domestic industry, and shall not depart from the provisions of this Agreement relating to non-discrimination;
(j) essential to the acquisition or distribution of products in general or local short supply; Provided that any such measures shall be consistent with the principle that all contracting parties are entitled to an equitable share of the international supply of such products, and that any such measures, which are inconsistent with the other provisions of the Agreement shall be discontinued as soon as the conditions giving rise to them have ceased to exist…
11.54 The two striking differences between the two are first that the reasons for invoking departures from free trade/common market principles are more clearly and narrowly specified in the WTO than in the Constitution which instead refers to an open-ended “public interest.” Second, and more important are the criteria that have to be met before the departure can be justified. In the WTO, the measure must not constitute arbitrary discrimination; must not be a form of disguised protectionism; and above all must be “necessary.”

248 Economic Survey 2016-17
11.55 WTO jurisprudence has over the years elaborated on all these three criteria and others. For example, the burden of proof is on the party invoking the exception provision (i.e. invoking the right to depart from a common market); measures adopted must be the least restrictive amongst the alternatives available; strict rules must apply to prevent arbitrary and unjustifiable discrimination.
11.56 The key point is that in the WTO the departures from a common market across widely varying countries is quite heavily circumscribed whereas similar departures between states within India is easily condoned by the Constitution and consequent constitutional jurisprudence.34
11.57 At a time when India is embracing cooperative federalism, the question to ponder is this: even if India cannot embrace the strong standards of a common market prevalent in the US and EU, should not the law in India at least aspire to the weak standards of a common international market embraced by countries around the world?
V. concluSIon
11.58 At the time of the drafting of the Constitution, and given the considerable anxieties of holding together a large and disparate nation, the demands for respecting states’ sovereignty were understandably strong. Nearly 70 years on, the sense of nationhood and unity is strong, and anxieties about territorial integrity have faded. Cooperative federalism is becoming an increasingly important governance dynamic. Reflecting this, the country has unanimously passed a landmark Constitutional amendment to implement the GST which should result in a common market for domestic indirect
taxes.
11.59 Building on this, the country can go further and extend this principle of one economic India to other spheres. Indeed, in his budget speech of July 24, 2014, the Honorable Finance Minister articulated the principle of extending the principle to agriculture: “the farmers and consumers’ interest will be further served by increasing competition and integrating markets across the country…”
11.60 The evidence of this chapter and a review of Indian history suggests that on the question of creating one economic India, technology, economics, and politics have been surging ahead. Perhaps, it is time for the Constitution to catch up to further facilitate this surging internal integration.
referenceS
1. Directorate General of Commercial Intelligence Services (DGCIS), “India’s Internal Trade: A Review of Interstate Movement of Major Commodities”, Report.
2. Center for Transportation Analysis, Freight Analysis Framework: http://faf.ornl.gov/fafweb/
3. British Columbia Statistics, http://www.bcstats.gov.bc.ca/StatisticsBySubject/ExportsImports/Data.aspx
4. Eurostat, “International trade in goods”, http://ec.europa.eu/eurostat/statistics-explained/index.php/International_trade_in_goods
5. Xing, Weibo, John Whalley and Shantong Li (2015), “Value, Structure and Spatial Distribution of Interprovincial Trade in China’, China & World Economy, 23 (4), pp. 84-103
34 It could be argued that the WTO can afford to be stricter on departures from common market principles because it allows countries to impose taxes at the border via tariffs. The within-India analogue is that states should be allowed to impose entry taxes akin to tariffs.

249One Economic India: For Goods and in the Eyes of the Constitution
6. Firdaus, Muhammad and Amalia Widyasanti (2010), “Indonesian Interprovincial Trade: What can be Revealed from a Gravity Modeling?”, Conference paper presented at Indonesian Regional Science Association International Conference, July 2010.
7. Vasconcelos, Jose (2001), “Matriz fo Fluxo de Comercio Interestadual de Bens e Serviços no Brazil – 1999”, Instituto de Pesquisa Econômica Aplicada, Discussion Paper.
8. Anderson J.E., Wincoop, E. Van, “Gravity with Gravitas: A Solution to the Border Puzzle.” the American Economic Review, 2003
9. Bernard, Andrew, Bradford Jensen, Stephen Redding, Peter Schott, (2007), “Firms in International Trade”, Journal of Economic Perspectives, 21 (3), pp. 105-130
10. Rose, Andrew (2003), “Do We Really Know that WTO Increases Trade?”,
American Economic Review, 94 (1) , pp.98-11411. Subramanian, Arvind and Shang-Jin
Wei (2007), “The WTO Promotes Trade, Strongly but Unevenly”, Journal of International Economics, 72 (1), pp. 151-175
12. Head, Keith and Thierry Mayer (2010), “Illusory Border Effects : Distance Mismeasurement Inflates Estimates of Home Bias in Trade” in Brakman, Steven and Peter van Bergeijk eds. The Gravity Model in International Trade: Advances and Applications, Cambridge University Press.
13. Baldwin, Richard and Daria Taglioni (2007), “Trade effects of the euro: A comparison of estimators”, Journal of Economic Integration, 22(4) pp.780–818
14. Disdier, Anne-Celia and Keith Head (2008), “The Puzzling Persistence of the Distance Effect on Bilateral Trade”, The Review of Economics and Statistics, 90 (1), pp.37-48

250 Economic Survey 2016-17
appendIx I
I. a State dyadS Appendix Table 1 shows the pattern of interfirm trade between state dyads. The intensity of colour shade used in the table indicates the intensity of the trading partnership between the two state pairs. The darker blue shades represent the fact that both states rank high in each other’s trading distribution. The darker red shade represents the opposite fact, that is, both states rank quite low in each other’s trading share.
The colour codes indicate the central role of Maharashtra in every other state’s trade flow: it is the most important exporting partner for every state and also serves as the predominant importer for goods from almost every other state. Assam resides on the other end of the colour spectrum: it ranks low in both exporting as well as importing relationships with all other states. More generally, states that are close to each other tend to trade more with each other and states that are richer trade with each other more than others (reflecting the results in the main text).
Appendix Table 2 uses the same colour codes to indicate the intensity of intrafirm trade flows between states. Maharashtra appears to be the dominant state in these types of interstate flows (both as an exporter and importer) as was also seen earlier in arms-length interstate trades. In contrast, firms tend to not have established subsidiaries either in the north-eastern states, Punjab or the smaller union territories. Two exceptions are pertinent in the case of union territories: Delhi which uses the F-form mechanism to trade with the NCR regions of Haryana and UP; and, Dadra and Nagar Haveli, which is not so much an important importing hub, but surprisingly a key exporting partner for Maharashtra, Gujarat, Rajasthan and Madhya Pradesh. The reasons for this trade pattern seems to be not immediately clear.

251One Economic India: For Goods and in the Eyes of the Constitution
Tabl
e 1:
Arm
s-le
ngth
trad
e flo
ws
betw
een
stat
es (C
-for
ms,
FY
2015
-16
in R
upee
s C
rore
s)35
Impo
rtin
g St
ate
Exporting State
Mah
aras
htra
Guj
arat
Kar
nata
kaA
ndhr
a Pr
ades
hU
ttara
-kh
and
Raja
stha
nM
adhy
a Pr
ades
hW
est
Beng
alTa
mil
Nad
uK
eral
aO
dish
aU
ttar
Prad
esh
Del
hiC
hhat
-tis
garh
Him
acha
l Pr
ades
hH
arya
naBi
har
Jhar
khan
dG
oaA
ssam
Mah
aras
htra
8567
940
253
3073
422
679
1021
523
634
1140
918
793
1233
654
3843
8065
8377
8371
3740
0636
2929
5770
3844
9
Guj
arat
8204
412
882
1967
911
717
3562
722
534
9664
1164
310
618
6487
6464
3871
4799
4378
8105
1536
1457
4945
279
Tam
il N
adu
4011
314
463
4007
526
217
3846
4984
7923
6520
1985
643
8521
3628
7931
4614
9014
1411
3619
9111
2633
1
Har
yana
2526
715
327
1153
486
6514
124
1596
570
4973
9047
6167
6428
9863
8094
6923
7482
2731
3718
8296
987
1
Kar
nata
ka32
519
9828
2077
734
3034
6582
2956
8619
300
1358
933
3222
1821
1720
4211
5817
8296
715
3534
0322
3
And
hra
Prad
esh
2507
163
4518
941
2092
9769
4514
4664
1061
452
9169
0117
2811
3828
9717
9469
211
8772
612
7616
1
Utta
r Pra
desh
1084
985
2140
3732
2526
900
5569
5983
4133
1859
1514
1450
5848
1385
3488
4873
2141
968
271
162
Raja
stha
n11
307
3374
335
0136
4477
1448
6850
5822
3117
7815
3131
4933
6810
1421
1327
7620
2011
0230
823
1
Del
hi82
0398
9845
1926
4216
912
7089
2684
2885
1628
2195
1377
8791
1511
6642
6729
1265
416
216
195
Wes
t Ben
gal
9716
6667
2995
4550
1783
2181
4066
2194
1219
8442
1516
1399
4929
807
911
7006
6632
129
951
Mad
hya
Prad
esh
1118
168
4322
6732
5226
5072
2785
4022
0169
712
8830
0620
8631
0110
0872
610
4772
410
5755
Utta
rakh
and
8691
3498
4007
2890
2910
3146
3083
1497
972
1265
3191
5646
1185
2655
1786
1958
1214
188
145
Odi
sha
7294
2385
2426
4301
1337
940
2090
9359
575
357
933
347
6832
174
311
1574
2172
3418
7
Chh
attis
garh
1106
242
6524
2155
5650
528
6659
2316
3568
741
226
5974
364
633
034
734
285
212
015
0
Jhar
khan
d20
9210
2913
4713
8817
5013
1611
7410
930
472
297
1796
2733
518
1657
421
1183
4670
3548
Him
ac
ha
l Pr
ades
h32
9515
7113
6810
6024
1014
9116
3091
948
130
930
212
2823
8824
315
6055
513
754
23
Ker
ala
2830
1041
3820
1383
261
183
326
421
3559
221
208
338
7316
089
7282
905
Goa
2756
716
1817
552
177
285
386
405
265
678
121
108
266
6910
690
8559
14
Ass
am60
269
520
321
275
157
541
1777
3322
169
266
188
236
2115
860
896
0
Biha
r12
144
4238
110
8513
641
767
385
267
5996
3215
464
012
35
The
tota
l val
ue o
f ex
port
s an
d im
port
s of
sta
tes
repo
rted
in th
ese
tabl
es a
re re
stric
ted
to th
e se
t of
stat
es c
onsid
ered
with
in th
e ba
lanc
ed d
yad
tabl
e. T
he a
ctua
l val
ue o
f tra
de is
hig
her b
ecau
se o
f flo
ws f
rom
oth
er st
ates
and
uni
on te
rrito
ries t
hat h
ave
been
exc
lude
d fr
om th
is ta
ble
for p
rese
ntat
iona
l con
veni
ence
.

252 Economic Survey 2016-17
36
* in
dica
tes s
tate
s with
no
corr
espo
ndin
g im
port
info
rmat
ion
Tabl
e 2:
Int
rafir
m T
rade
flow
s be
twee
n st
ates
(F-f
orm
s, F
Y20
15-1
6 in
Rup
ees
Cro
res)
36
Impo
rtin
g St
ate
M
aha-
rash
traM
adhy
a Pr
ades
hA
ndhr
a Pr
ades
hK
arna
-ta
kaW
est
Beng
alRa
jas-
than
Guj
arat
Ker
ala
Del
hiTa
mil
Nad
uC
hhat
-tis
garh
Dad
ra
and
Nag
ar
Hav
eli
Jhar
kh
and
Odi
sha
Utta
r Pr
ades
hG
oaPu
du
cher
ry
Dam
an
and
Diu
Cha
ndi-
garh
Nag
alan
dM
anip
urM
izor
amPu
njab
Exporting State
Guj
arat
1010
3899
736
1034
699
5456
7184
06
2937
4461
3578
5040
1161
529
862
936
7011
3530
520
0872
00
00
Mah
aras
htra
25
693
2317
323
814
1500
974
1536
044
7762
7144
8429
7930
5449
1450
2477
1177
4390
529
1854
145
620
00
Tam
il N
adu
2363
846
7227
506
2517
378
8940
5058
4826
102
2772
84
814
232
888
999
644
481
6693
6725
00
12
Har
yana
*14
987
6088
1483
386
7752
4714
138
1164
1828
2088
922
9352
0414
815
9688
053
5383
6276
176
103
10
0
And
hra
Prad
esh
2366
526
69
2127
360
9918
9148
1673
1259
970
7257
6015
694
658
6551
141
513
0118
140
00
0
Utta
r Pr
ades
h13
211
6440
4765
6764
6896
1227
212
7223
4413
809
1780
1684
328
1202
1265
10
6660
5472
241
01
Kar
nata
ka27
107
2365
1399
7
2842
2250
2763
9133
1267
7725
516
4518
745
625
614
2956
361
480
00
1
Wes
t Ben
gal
9604
1987
6772
3107
14
6412
1013
6415
7614
9520
8658
281
0861
8879
712
4845
458
3784
02
0
Uttr
anch
al*
1610
945
0938
6729
9250
1538
3963
312
8536
4313
1911
7614
692
726
1026
6292
2799
10
00
Del
hi11
260
4085
3051
4381
3718
1001
915
2410
87
1746
851
5363
355
131
8917
148
117
112
22
0
Punj
ab12
724
2214
3704
7748
3450
4342
390
1162
2288
1193
868
360
463
810
3217
211
1960
563
70
0
Mad
hya
Prad
esh
1466
4
2544
2688
2289
2701
4144
1394
753
870
2346
847
459
423
1374
177
2031
130
40
0
Jhar
khan
d10
176
1554
1720
1285
1180
721
4816
7414
052
914
1389
72
13
0251
92
30
00
00
0
Odi
sha
4538
653
2949
1309
1014
299
417
1299
712
460
626
8410
2433
40
446
838
113
40
00
0
Ass
am*
1221
276
1102
364
2330
40
032
684
8742
154
644
248
462
40
113
527
527
30
Ker
ala
2013
482
1322
955
9338
919
646
8
149
3405
110
2790
113
848
172
56
10
00
0
Dad
ra a
nd
Nag
ar H
avel
i53
3442
0310
5273
443
028
9642
9523
622
512
1313
3
2574
155
890
245
100
00
0
Chh
attis
garh
4402
769
1105
1529
2867
963
740
696
191
650
1
2386
1144
278
691
01
00
00
Raja
stha
n37
4724
7096
318
8713
75
501
384
3376
543
451
1022
215
286
116
23
946
90
00
Goa
6818
845
1386
2992
563
597
790
930
223
579
158
2365
168
58
337
52
02
0

253One Economic India: For Goods and in the Eyes of the Constitution
M
aha-
rash
traM
adhy
a Pr
ades
hA
ndhr
a Pr
ades
hK
arna
-ta
kaW
est
Beng
alRa
jas-
than
Guj
arat
Ker
ala
Del
hiTa
mil
Nad
uC
hhat
-tis
garh
Dad
ra
and
Nag
ar
Hav
eli
Jhar
kh
and
Odi
sha
Utta
r Pr
ades
hG
oaPu
du
cher
ry
Dam
an
and
Diu
Cha
ndi-
garh
Nag
alan
dM
anip
urM
izor
amPu
njab
Exporting State
Pudu
cher
ry16
4323
613
1720
2657
123
635
416
0012
626
7252
2853
9410
326
16
32
00
00
Sikk
im*
1763
337
687
533
496
915
21
01
100
140
80
00
00
Biha
r*31
842
582
161
2999
1918
758
3461
110
2332
740
52
30
00
00
0
Dam
an a
nd
Diu
2556
127
211
260
343
8913
3229
4464
3730
719
2811
1817
0
00
00
Jam
mu
and
Kas
hmir*
1292
190
601
255
303
182
2852
307
3493
217
5011
44
00
30
00
0
Cha
ndig
arh
318
1512
648
788
1115
168
20
44
22
10
0
00
4
Meg
halay
a*0
00
174
00
00
00
01
00
00
00
2292
390
Trip
ura*
31
00
111
314
117
00
035
011
00
00
00
00
Nag
alan
d1
053
264
00
01
00
00
20
00
00
0
00
Laks
hdw
eep*
00
00
00
00
00
00
00
80
00
00
00
0
Aru
nach
al
Prad
esh*
00
00
60
00
00
00
00
00
00
00
00
0
Miz
oram
01
00
00
00
00
00
03
00
00
00
0
0
And
aman
&
Nic
obar
Is
land
s*0
00
00
00
00
00
00
00
00
00
00
00
Man
ipur
00
00
00
00
00
00
00
00
00
00
0
0
254 Economic Survey 2016-17
I.b trade openneSS and trade coMpetItIVeneSS
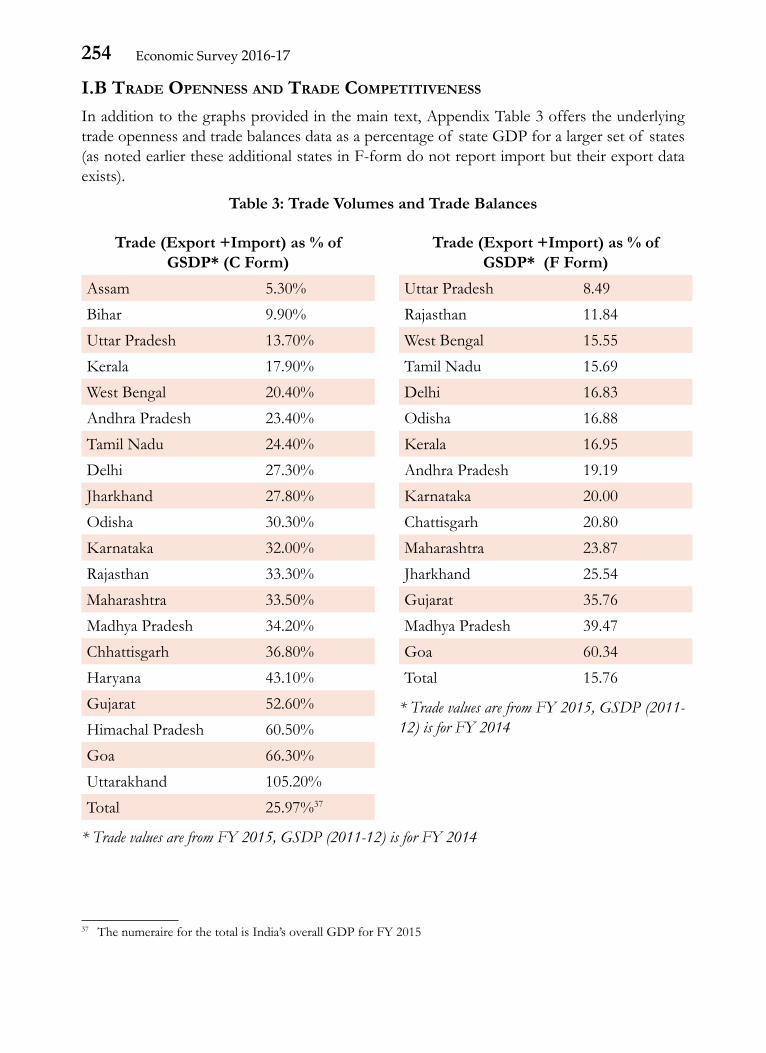
In addition to the graphs provided in the main text, Appendix Table 3 offers the underlying trade openness and trade balances data as a percentage of state GDP for a larger set of states (as noted earlier these additional states in F-form do not report import but their export data exists).
Table 3: Trade Volumes and Trade Balances
Trade (Export +Import) as % of GSDP* (C Form)
Assam 5.30%Bihar 9.90%Uttar Pradesh 13.70%Kerala 17.90%West Bengal 20.40%Andhra Pradesh 23.40%Tamil Nadu 24.40%Delhi 27.30%Jharkhand 27.80%Odisha 30.30%Karnataka 32.00%Rajasthan 33.30%Maharashtra 33.50%Madhya Pradesh 34.20%Chhattisgarh 36.80%Haryana 43.10%Gujarat 52.60%Himachal Pradesh 60.50%Goa 66.30%Uttarakhand 105.20%Total 25.97%37
* Trade values are from FY 2015, GSDP (2011-12) is for FY 2014
Trade (Export +Import) as % of GSDP* (F Form)
Uttar Pradesh 8.49Rajasthan 11.84West Bengal 15.55Tamil Nadu 15.69Delhi 16.83Odisha 16.88Kerala 16.95Andhra Pradesh 19.19Karnataka 20.00Chattisgarh 20.80Maharashtra 23.87Jharkhand 25.54Gujarat 35.76Madhya Pradesh 39.47Goa 60.34Total 15.76
* Trade values are from FY 2015, GSDP (2011-12) is for FY 2014
37 The numeraire for the total is India’s overall GDP for FY 2015

255One Economic India: For Goods and in the Eyes of the Constitution
Trade Balance as % of GSDP*(C Form)
Uttarakhand -43.50%Goa -27.00%Himachal Pradesh -20.20%Kerala -12.10%Madhya Pradesh -9.90%Bihar -8.80%Rajasthan -3.40%West Bengal -3.30%Andhra Pradesh -3.30%Karnataka -2.50%Odisha -2.10%Chhattisgarh -1.60%Maharashtra 0.60%Assam 0.80%Uttar Pradesh 4.20%Jharkhand 4.30%Gujarat 5.20%Tamil Nadu 9.30%Delhi 7.40%Haryana 26.10%
* Trade balances are for FY 2015, GSDP (2011-12 series) is for FY 2014, West Bengal (2004-5 series) for FY 2014. Negative values indicate net importing states
Trade Balance as % of GSDP *(F Form)
Madhya Pradesh -24.27Kerala -6.81Rajasthan -6.25Chattisgarh -5.74Maharashtra -4.69Karnataka -4.29West Bengal -3.81Andhra Pradesh -2.33Delhi 1.88Odisha 2.86Uttar Pradesh 5.84Jharkhand 6.86Tamil Nadu 8.39Goa 10.67Gujarat 21.59
* Trade balances are for FY 2015, GSDP (2011-12 series) is for FY 2014, West Bengal (2004-5 series) for FY 2014. Negative values indicate net importing states

256 Economic Survey 2016-17
I.c heteroGeneIty In coMModItIeS acroSS c and f-forMS
As noted in the main text, the commodity composition underlying the two kinds of interstate trade transactions is quite different. Appendix Table 4 below shows value of trade for products that are common to the two forms (shaded in green) and the products that are different across the two firms for Andhra Pradesh and Telangana combined.
Table 4: Top-15 commodities for each form
Top 15 C-Form Commodities in Andhra Pradesh (United)
Commodity Value of Imports(Rs. Cr.)
All Motor Vehicles Except Tractors 13983Iron And Steel 10104Automobile Parts 6485Dyes And Chemicals 5575Electrical Goods Except Engines/Motors
4873
Machinery 3224Coal 3198Readymade Garments And Hosiery Goods
3066
Packing Materials 2659Cotton 2583Plastic Raw Materials 1606All Kinds Of Vegetable Oils 1545Paper 1465Electronics 1246Bitumen 1155
Top 15 F-Form Commodities in Andhra Pradesh (United)
Commodity Value of Imports(Rs. Cr.)
Bullion, Jewellery And Precious Stones 5268Tractors And Parts And Other Agricultural Implements
4064
All Motor Vehicles Except Tractors 1693Consumer Electronics 1392Iron And Steel 1142Pesticides 636Diesel 544Fertilizers 432Petrol 387Lubricants And Other Petroleum Products
380
Electrical Goods Except Engines/Motors
308
All Kinds Of Metals (Non-Ferrous) 292Electronics 259Tobacco And Tobacco Products 249Readymade Garments And Hosiery Goods
183
I.d robuStneSS to GraVIty SpecIfIcatIon
The robustness of the gravity estimates highlighted in the main text is explored in greater detail in this appendix. The full set of specifications are listed in Table 5 – the variables used in this table are the same as the ones described in the main text. In model (1) and (2), the distances are measured based on centroids of the states and from the administrative capitals of the states respectively. Models (3), (4), (6), (8), (11) and (12) correspond to Columns (1)-(6) in Table 2 in the main text. In Models (7) and (5) respectively, the log of intrafirm trades and log of arms-length trades is regressed on states’ GDP (keeping the sample of states between the two flows the same) and other standard gravity variables. In Models (9) and (10), the whole sample (including agriculture commodities) of US states and commodities is used for gravity estimation.

257One Economic India: For Goods and in the Eyes of the Constitution
A. State GDP coefficients
As noted in the main text, the elasticity of trade with respect to income is positively correlated with trade flows. The result is consistent with the observed aggregate trade flows between states in Figure 3 in the main text, i.e., high income states tend to trade more than others. The income coefficients are robust to different distance specifications, to different samples, across types of flows and between India and the US. A 10 percentage point increase in GDP of a state is associated with 7.4% increase in intra-firm trade flows (column 7). This elasticity is smaller than corresponding elasticity for inter-firm trade (column 5), reflecting the patterns seen earlier in the main text in Figure 5.
B. Proximity coefficient
The adjoining state dummy captures the impact of sharing a border on the strength of the trading relationship between two states. The estimated relationship changes with the way distances between states are measured (not surprising in view of the findings in Head and Mayer (2010)). As the distance measure gets closer to measuring the true distance traveled by goods (between economic capitals instead of geographic centroids of the states), the relationship between sharing a border and size of trade flows becomes more significant as we expect. When distance is measured as the distance between economic capitals of the state, sharing a border is associated with 41 %38 higher trade flows (column 3). When controlling for state fixed effects, the relationship becomes much more economically and statistically significant at the 1% level. Adjoining states trade 90% more. Since state fixed effects allows one to capture unobserved state specific characteristics of trade – it is used as the preferred specification in the main text and in the discussion going forward.
38 =exp(0.349)-1

258 Economic Survey 2016-17
Tabl
e 5.
Rob
ustn
ess
chec
k fo
r the
gra
vity
est
imat
es
Dep
ende
nt V
ariab
le:
Log(V
alue o
f Im
ports
)
Indi
aU
nite
d St
ates
Inter
-Firm
(Ful
l Sam
ple)
Inter
-Firm
(F F
orm
Samp
le)In
tra-F
irmIn
cludin
g Agri
cultu
reE
xclu
ding A
gricu
lture
(1)
(2)
(3)
(4)
(5)
(6)
(7)
(8)
(9)
(10)
(11)
(12)
Log(
Dist
ance
): C
entro
id-1
.480
***
(0.1
86)
Log(
Dist
ance
): A
dmin
istra
tive
Cap
ital
-1.2
53**
*
(0.1
60)
Log(
Dist
ance
): E
cono
mic
C
apita
l-0
.928
***
-0.5
65**
*-0
.692
***
-0.5
39**
*-0
.730
5***
-0.8
180*
**-0
.984
***
-0.9
74**
*-0
.965
***
-0.9
38**
*
(0.1
69)
(0.0
952)
(0.2
21)
(0.1
16)
(0
.261
3)
(0.1
674)
(0
.024
) (0
.069
) (0
.024
) (0
.068
)
Adj
oini
ng S
tate
Dum
my
-0.0
811
0.17
20.
349*
0.63
8***
0.70
6***
0.70
4***
0.74
42**
*0.
4949
**
0.99
2***
0.90
2***
0.99
4***
0.93
7***
(0.2
05)
(0.1
84)
(0.1
93)
(0.1
17)
(0.1
88)
(0.1
23)
(0.2
429)
(0
.199
9)
(0.0
71)
(0.1
03)
(0.0
72)
(0.0
97)
Hin
di D
umm
y-0
.347
*-0
.305
*-0
.391
**-0
.022
5-0
.562
***
-0.0
37-0
.468
3*
0.40
61*
(0.1
79)
(0.1
81)
(0.1
87)
(0.1
33)
(0.1
5)(0
.16)
(0.2
508)
(0
.233
0)
Log(
Impo
rter
GSD
P)0.
826*
**0.
856*
**0.
816*
**0.
953*
**0.
7407
***
1.06
2***
1.
101*
**
(0.0
914)
(0.0
926)
(0.0
934)
(0.0
513)
(0.0
778)
(0
.017
)
(0.0
17)
Log(
Exp
orte
r GSD
P)0.
968*
**0.
998*
**0.
958*
**0.
790*
**0.
7743
***
0.95
4***
0.
928*
**
(0.0
548)
(0.0
577)
(0.0
568)
(0.0
717)
(0.0
989)
(0
.017
)
(0.0
17)
Impo
rter
Sta
te F
EN
oN
oN
oYe
sN
oYe
sN
oYe
sN
oYe
sN
oYe
s
Exp
orte
r Sta
te F
EN
oN
oN
oYe
sN
oYe
sN
oYe
sN
oYe
sN
oYe
s
R-sq
uare
d0.
548
0.54
30.
522
0.90
30.
720.
910.
570.
830.
830.
90.
830.
9
Obs
erva
tions
380
380
380
380
210
210
210
210
2450
2450
2450
2450
Robu
st sta
ndar
d err
ors i
n pa
renth
eses
***
p<0.
01, *
* p<
0.05
, * p
<0.
1

259One Economic India: For Goods and in the Eyes of the Constitution
C. Language coefficientThe language dummy attempts to capture whether Hindi speaking states tend to trade with each other more than others. The language dummy is insignificant for inter-firm trades in both the full and the restricted samples for India when we use our preferred specification based on fixed effects. This coefficient is however significant at 90% confidence for intrafirm trades and tends to be significant when we use state GDP controls.
D. Distance coefficientThe most remarkable finding is that India’s elasticity of trade flows with respect to distance is much lower than we might have expected. In the preferred specification (column 4), a 10 percent increase in distances between economic capitals results in a fall in arms-length trade of 5.65 percentage points. For intra-firm flows (column 7), a 10 percentage point increase in distance between two states is associated with a decrease in intra-firm trade between these states of 7.3 percentage points. Controlling for all time invariant characteristics of the source and destination states, this elasticity falls to about 8.1 percentage points. The coefficient of trade with respect to distance is higher for intra-firm trade than for inter-firm trade within India even when the gravity model is estimated on the same sample of state-pairs (column 6).
One explanation for the difference between inter and intra firm trade costs of distance might be simply that for the same distance, intra-firm trade requires a firm to have operations at the source and destination whereas inter-firm trade only requires a willing buyer and seller at each point. The cost to setting up subsidiaries might increase faster over distance compared to the cost of finding a willing buyer or seller. Another is that the differential tax treatment of sales between firms within state and across states could be distorting incentives in favour of greater trade. Such a differential tax treatment does not exist between intra-firm transfers within and across state lines.
Despite the differences in the distance coefficient between the two types of flows, it is pertinent to compare these estimates to trade within other countries. Fortunately, we have similar data for trade within the United States. The distance between the states in the US is measured to be the distance between the most populated cities of respective states in the US. The regressions are run separately on two samples: with and without agricultural commodities (models (11) and (12)). The latter specification makes the basket of commodities in the two countries similar to each other. Reflecting similar trends observed in India, trade between states are positively correlated with state GDPs and adjoining states.
The distance coefficient on the U.S. sample is remarkably stable between the specification with state GDP controls and with state fixed effects. This suggests that the state GDP measure captures much of the time—invariant differences between states. This stability is also reflected in the relatively high R-squared in (9) and (11).
The surprising result here is that a 10 percent increase in distances between states in the US is associated with a trade reduction of 9.8% to 9.3% on average and this result is robust to the selection of the underlying sample. Contrast this with results for India, where a 10% increase in distances between states is associated with a reduction of 5.6% and 8.1% trade between interfirm and intrafirm trade flows. Considering the fact the US has much better transport infrastructure this result reflects the surprising observation noted earlier, that is, India’s internal trade is not as bad as we expected.

260 Economic Survey 2016-17
Before proceeding, it is instructive to review these estimates in light of Baldwin (2007) study of biases in gravity analysis. Using the state fixed effects in the preferred specification reduces the time-invariant biases from the estimates (“multi-lateral trade resistance” as per Anderson and Van Wincoop (2001)). However, since it is not possible to add state pairwise fixed effects, idiosyncratic bilateral trade effects continue to bias the results (for example, states with similar demographic composition will perhaps be better poised to trade with each other than others). The data also does not allow controlling for the effect of time-varying changes in relative prices between trading nations. This is certainly going to bias the distance estimate. In so much as relative prices of tradeables are negatively correlated with trade values, the estimated coefficients are biased downwards.
E. Other benchmarks for the distance coefficientComparing the distance coefficient in the above regressions to others studies of intra-national trade costs is difficult due to the various theoretical interpretations of the gravity coefficient. The literature typically interprets the regression distance coefficient (distance being a proxy for overall costs of trade) as the product of two elasticities: (a) the elasticity of trade costs with distance and (b) elasticity of trade with distance (Disdier and Head (2008)). As a result, the interpretation of distance coefficient varies across studies with the spatial level of aggregation used or the degrees of substitutability between goods, the spread of productivity dispersion, or changes in trade costs over distances. Comparing the estimates in this chapter to other distance coefficients is therefore hard due to these differences and also due to the fact that there is no counterfactual group in this data (measuring interstate trade relative to international or intrastate flows) as noted earlier.
In addition to benchmarking the Indian estimates against US data, another closest comparable measure of the distance coefficient can be produced by plugging in the characteristics39 of this study design into the meta-analysis of the distance coefficient in gravity models conducted by Disdier and Head (2008). This exercise reveals that the average distance coefficient from the meta-regression is -1.64, that is, a 10 percentage decrease in distance is associated with a decrease of 16.4 percentage decrease in trade values. One must be careful in comparing this to India’s distance estimate of -.565 because the meta-regression analysis does not have a separate control for inter-country flows (it only controls for inter-continental flows). This implies that the effect of national boundaries is incorporated in the -1.64 estimate but not in India’s interstate distance coefficient.
With these limitations of this study in mind, one may be able to hypothesize that India’s interstate flows do not face as many frictions has been previously assumed to be the case. Whether this is because of differential tax treatments across regions and products or due to porous state borders conducive to trading networks cannot be discerned at this point and is hoped that future studies will be able to resolve these apparent contradictions.
39 These characteristics (and calibration parameter for our study) are whether the study was in the years after 1990 (=1), Single continent (=1), Sample of developed economies only (=0), No developed economies (=1), Disaggregated Data (=0), Total Bilateral Trade (=0), Road/Sea Distance (=0), Adjacency Control (=1), Common Language Control (=1), Trade Agreements Control (=0), Remoteness control (=0), Country fixed effects (=1), Incorporates zero flows (=0), No Zero Flows (=1), Poisson pseudo-ML (=0), Corrects for GDP endogeneity (=0), High quality journal (=1).

261One Economic India: For Goods and in the Eyes of the Constitution
I.E: An attempt to resolve the paradox: Tax Related Distortions to TradeA. Central Sales Tax and Value Added TaxesIndia’s current system of Central Sales Tax (CST) on interstate sales and Value Added Tax (VAT) on intra-state sales distorts interstate trade compared to a nation-wide Goods and Service Tax (GST). The question is whether the current system resulted in moreinternal trade or less. The answer is that it depends on whether the potential importer would receive input tax credits on her purchases if she were to instead procure them within the state.
Case 1: Trade is disincentivised The availability of input tax credits (ITC) on goods purchased within state but not from out of state discourages interstate trade. The loss of ITC on out-of-state purchases implicitly acts as a tariff. This is best illustrated with an example.
Consider the case of three firms – A, B and C. A and B are in the same state, while C is in a different state. A must choose whether to source her inputs from B or from C, who are both selling their goods for a unit price of Rs. 100. Column (1) in Table 6 below shows the prices, profits and taxes at each stage of the supply chain from B to A to the final consumer. Assuming a VAT rate of 10 % for simplicity, B remits VAT of Rs. 10 and A receives input tax credit worth Rs. 10 on the purchase of inputs. Suppose A sells to the final consumer for Rs. 110 (implying a value added of Rs. 10), she must remit a VAT of Rs. 11 and the consumer pays a final tax inclusive price of Rs. 121.
Now suppose A chooses to source her inputs from firm C.Compare this supply chain to the B-A-Final Consumer chain in two ways:
• holding the price to the final consumer fixed (column 2) and
• holding A’s profits fixed (column 3).
Onesees that even if the price to the final consumer is the same, A will prefer to source from B since her profits will be higher in this case. In a competitive market, A cannot charge the final consumer a price greater than Rs. 121 since another firm can capture the entire market by sourcing her inputs from B and charging the lower price of Rs. 121.
In either case, C remits tax of Rs. 2 on the sale to A but A receives no input tax credits. A remits VAT of 10 % on the final sale to the consumer, which is Rs. 10 if we hold prices constant but Rs. 11.20 if we allow price received by A to adjust. If prices are fixed, the resulting profit to A is Rs. 8 compared to her profit of Rs. 10 when she sources from B. If prices are not fixed then the final price to the consumer is higher at Rs. 123.20 while the profit to A remains the same at Rs. 10.
Consumers would prefer to purchase from a seller charging only Rs. 121, and therefore seller A would prefer to source from B and retain higher profits while charging the consumer a lower price. This example illustrates why CST discourages interstate sales when firms can receive input tax credits for in-state purchases.
Case 2: Pro-trade bias when the firm does not receive input tax credits as a final consumerNow consider the case where firm A itself is the final consumer. In this case the transaction

262 Economic Survey 2016-17
ends at row (3) in Table 1 below and it is clear that it is cheaper for firm A to source from firm C. In the case of many business inputs, the firm itself is treated as a final consumer under the state VAT. That is, they do not receive input tax credits on these purchases. Some big ticket items that fall into this category are motor vehicles, petrol and lubricants, air conditioners etc. These items are amongst the highest traded items between states (Table 6).
Case 3: Pro-trade bias when the firm does not receive input tax credits as a seller of exempt goods.A third scenario arises when the firm is a seller of VAT exempt goods. Sellers of VAT exempt rather than zero-rated goods cannot claim input tax credits on any of their purchases. In this case the tax inclusive price on the final sale to the consumer will be the same as the price received by seller A. However, since firm A does not receive input tax credits, her profit if she sources her inputs from within the state will be zero. This scenario is illustrated in Table 7 below. If she sources inputs from within the state and sells her output at the same price, then she makes a profit of Rs. 8 per unit (Column 1). To make the same profit while sourcing inputs from out of state as from within state, she can charge the final consumer only Rs. 102 compared the much higher price of Rs. 110 when sourcing from within state (Column 3). Cotton yarn for instance is a tax exempt good in Andhra Pradesh. The input to cotton yarn manufacturers – cotton – is one of the top 15 commodities by value imported into Andhra Pradesh from other states (Appendix Table 4).
Table 6: Firm receives ITC on inputs.
S. No.
Inputs from B (in state)
(1)
Inputs from C (out of state)
(2)
Inputs from C (out of state)
holding profits equal(3)
(1) Price received by Seller B or C 100 100 100
(2) Tax on Intermediate Stage (VAT or CST)
10 2 2
(3) Tax inclusive price paid by A (1 + 2)
110 102 102.00
(4) Input Tax Credit received by A 10 0 0.00
(5) Price received by A on output 110 110 112.00
(6) Tax on Final Sale from A to consumer 11 11 11.20
(7) Tax inclusive price paid by Consumer (5+6)
121 121 123.20
(8) Profit per unit (7-6+4-3) 10 8 10

263One Economic India: For Goods and in the Eyes of the Constitution
Table 7. Final good is tax exempt so seller does not receive ITC on inputs
S. No. Inputs from B
(in state)
Inputs from C
(out of state)
Inputs from C (out of state)
holding profits equal
(1) Price received by Seller B or C 100 100 100
(2) Tax on Intermediate Stage (VAT or CST) 10 2 2
(3) Tax inclusive price paid by A (1 + 2) 110 102 102.00
(4) Input Tax Credit received by A 0 0 0.00
(5) Price received by A on output 110 110 102.00
(6) Tax on Final Sale from A to consumer 0 0 0.00
(7) Tax inclusive price paid by Consumer (5+6) 110 110 102.00
(8) Profit per unit (7-6+4-3) 0 8 0

![[PPT]PowerPoint Presentation - · Web view... (B – non-blue eyes, b – blue eyes) BB = non-blue eyes Bb = non-blue eyes bb = blue eyes Incomplete Dominance – Neither allele is](https://static.fdocuments.us/doc/165x107/5aae9c247f8b9a190d8c559f/pptpowerpoint-presentation-view-b-non-blue-eyes-b-blue-eyes-bb.jpg)