One Bank, One UniCredit Transform Operating Model · One Bank, One UniCredit Transform Operating...
23
R. de Marchis / F. Giordano One Bank, One UniCredit Transform Operating Model London, 13 th December 2016
Transcript of One Bank, One UniCredit Transform Operating Model · One Bank, One UniCredit Transform Operating...

R. de Marchis / F. Giordano
One Bank, One UniCreditTransform Operating Model
London, 13th December 2016
Disclaimer
This communication and the information contained herein does not contain or constitute an offer of securities for sale, or solicitation of an offer to purchase securities, in the United States, Australia, Canada or Japan or any other jurisdiction where such an offer or solicitation would require the approval of local authorities or otherwise be unlawful (the “Other Countries”). Neither this document nor any part of it nor the fact of its distribution may form the basis of, or be relied on in connection with, any contract or investment decision in relation thereto.The securities referred to herein have not been registered and will not be registered in the United States under the U.S. Securities Act of 1933, as amended (the “Securities Act”), or pursuant to the corresponding regulations in force in the Other Countries. The securities may not be offered or sold in the United States unless such securities are registered under the Securities Act, or an exemption from the registration requirements of the Securities Act is available. The Company (as defined below) does not intend to register any portion of any offering in the United States.This communication is directed only at (i) persons who are outside the United Kingdom or (ii) persons who have professional experience in matters relating to investments falling within Article 19(2) of the Financial Services and Markets Act 2000 (Financial Promotion) Order 2005, as amended from time to time (the “Order”) or (iii) high net worth entities, and other persons to whom it may lawfully be communicated, falling within Article 49(2) of the Order or (iv) certified high net worth individuals and certified and self-certified sophisticated investors as described in Articles 48, 50, and 50A respectively of the Order or (v) persons to whom this communication may otherwise be lawfully communicated (all such persons together being referred to as “relevant persons”). Any investment activity to which this communication relates will only be available to and will only be engaged with, relevant persons. Any person who is not a relevant person should not act or rely on this communication or any of its contents. This publication constitutes neither an offer to sell nor a solicitation to buy or subscribe for securities. This communication has been prepared on the basis that any offer of securities in any Member State of the European Economic Area (“EEA”) which has implemented the Prospectus Directive (each, a “Relevant Member State”), will be mad on the basis of a prospectus approved by the competent authority and published and notified to the relevant competent authority in accordance with the Prospectus Directive and/or pursuant to an exemption under the Prospectus Directive from the requirement to publish a prospectus for offers of securities.
The contents of this document are for information purposes only and is not to be construed as providing investment advice. The statements contained herein have not been independently verified. No representation or warranty, either express or implied, is made as to, and no reliance should be placed on, the fairness, accuracy, completeness, correctness or reliability of the information contained herein. Neither UniCredit S.p.A. (the “Company” and together with its consolidated subsidiaries, the “Group”) nor any of its representatives shall accept any liability whatsoever (whether in negligence or otherwise) arising in any way in relation to such information or in relation to any loss arising from its use or otherwise arising in connection with this presentation. By accessing these materials, you agree to be bound by the foregoing limitations.This press release contains certain forward-looking statement, projections, objectives, estimates and forecasts reflecting management’s current views with respect to certain future events. Forward-looking statements, projections, objectives, estimates and forecasts are generally identifiable by the use of the words “may,” “will,” “should,” “plan,” “expect,” “anticipate,” “estimate,” “believe,” “intend,” “project,” “goal” or “target” or the negative of these words or other variations on these words or comparable terminology. These forward-looking statements include, but are not limited to, all statements other than statements of historical facts, including, without limitation, those regarding the Company’s future financial position and results of operations, strategy, plans, objectives, goals and targets and future developments in the markets where the Company or any Group company participates or is seeking to participate. Due to such uncertainties and risks, readers are cautioned not to place undue reliance on such forward-looking statements as a prediction of actual results. The Group’s ability to achieve its projected objectives or results is dependent on many factors which are outside management’s control. Actual results may differ materially from (and be more negative than) those projected or implied in the forward-looking statements. Such forward-looking information involves risks and uncertainties that could significantly affect expected results and is based on certain key assumptions. All forward-looking statements included herein are based on information available to the Group as of the date hereof. No Group company undertakes any obligation to update publicly or revise any forward-looking statement, whether as a result of new information, future events or otherwise, except as may be required by applicable law. All subsequent written and oral forward-looking statements attributable to any Group company or persons acting on its behalf are expressly qualified in their entirety by these cautionary statements.The Presentation may not be retained, copied, reproduced, used, distributed, published or disclosed, in whole or in part, at any time without the prior written consent of the Company.
2
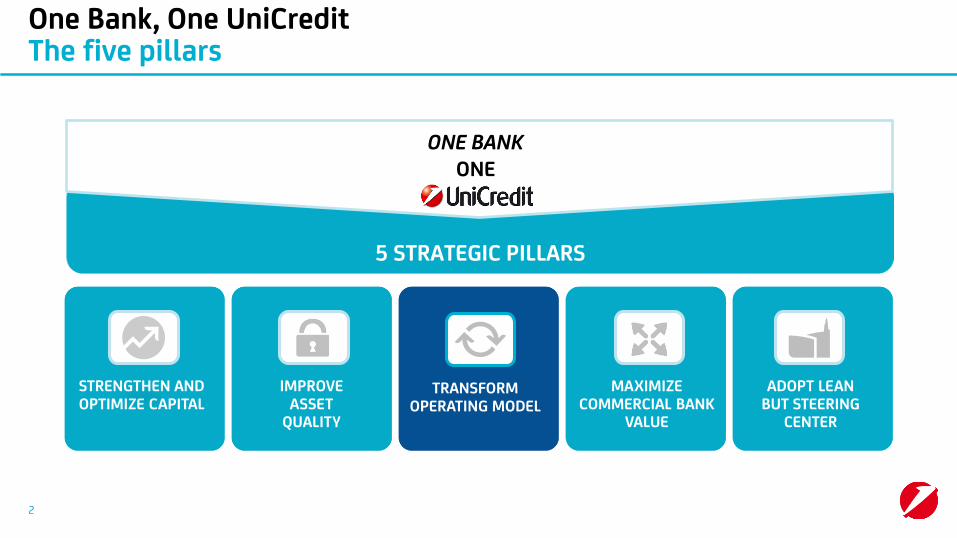
One Bank, One UniCreditThe five pillars
5 STRATEGIC PILLARS
ONE BANKONE
TRANSFORM OPERATING MODEL
ADOPT LEAN BUT STEERING
CENTER
STRENGTHEN AND OPTIMIZE CAPITAL
MAXIMIZECOMMERCIAL BANK
VALUE
IMPROVE ASSET
QUALITY
3
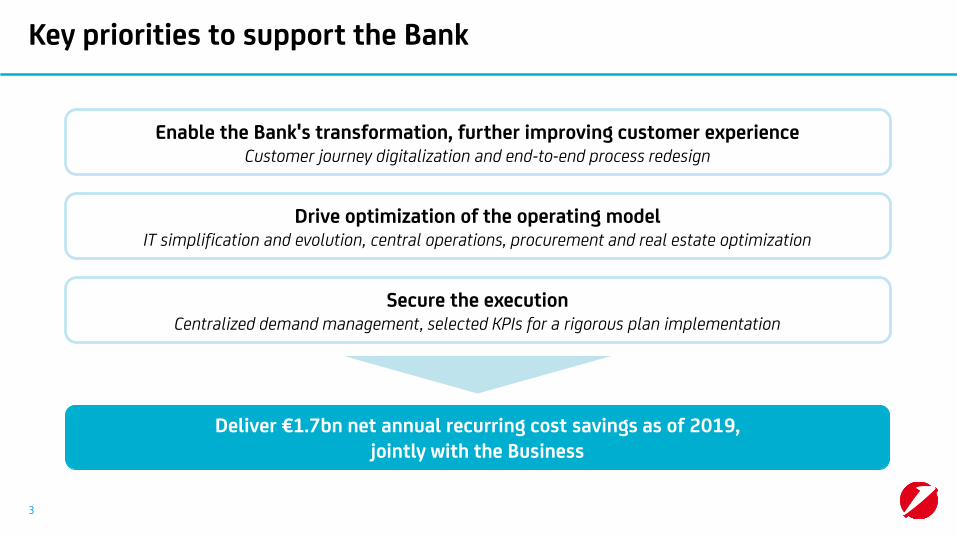
Key priorities to support the Bank
Enable the Bank's transformation, further improving customer experienceCustomer journey digitalization and end-to-end process redesign
Drive optimization of the operating modelIT simplification and evolution, central operations, procurement and real estate optimization
Secure the executionCentralized demand management, selected KPIs for a rigorous plan implementation
Deliver €1.7bn net annual recurring cost savings as of 2019, jointly with the Business
4
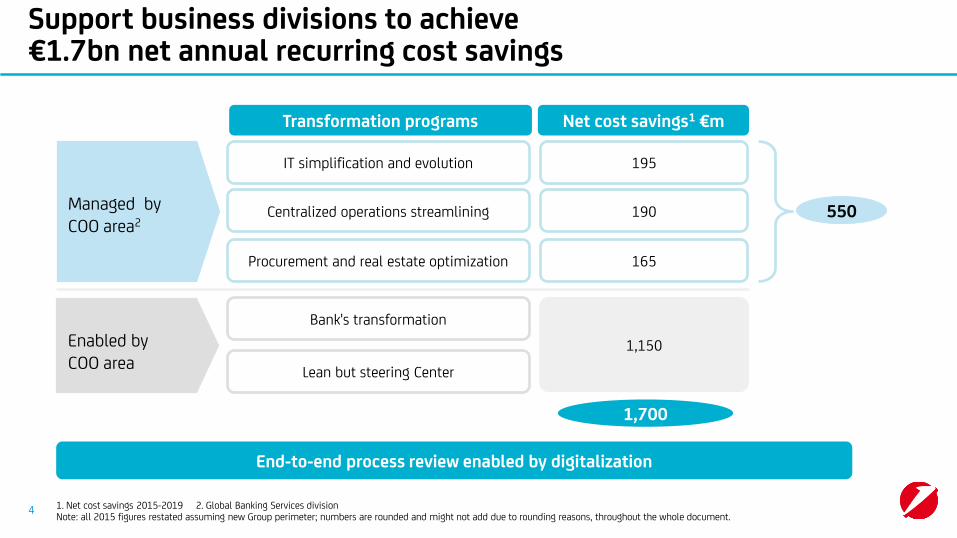
Support business divisions to achieve€1.7bn net annual recurring cost savings
1. Net cost savings 2015-2019 2. Global Banking Services divisionNote: all 2015 figures restated assuming new Group perimeter; numbers are rounded and might not add due to rounding reasons, throughout the whole document.
End-to-end process review enabled by digitalization
Transformation programs
Bank's transformation
Centralized operations streamlining
IT simplification and evolution
Managed by COO area2
Net cost savings1 €m
190
195
1,700
Enabled byCOO area
550
Procurement and real estate optimization 165
Lean but steering Center
1,150

-1.1
2015
12.2
7.5
4.8
(-13.7%)
2019
10.6
6.4
4.2
Non HR savings
-0.6
HR savings
5
Bank transformation leading to a major and sustainable cost reduction
Group costs
Non HR
HR
Costs, €bn
1. Italy, Germany, AustriaNote: all 2015 figures restated assuming new Group perimeter
-€1.7bn
Geographical mix
Cost structure, %
Non HR mix
Non HR cost structure, %
CEE
16%12%
Western Europe1
84%88%
20192015
26%
35%
25%
38% 37%
Real Estate ITOther
20192015
• 34% of total cost savings achieved by 2017, and 77% by 2018• Additional €900m annual cost reduction vs. previous plan
40%
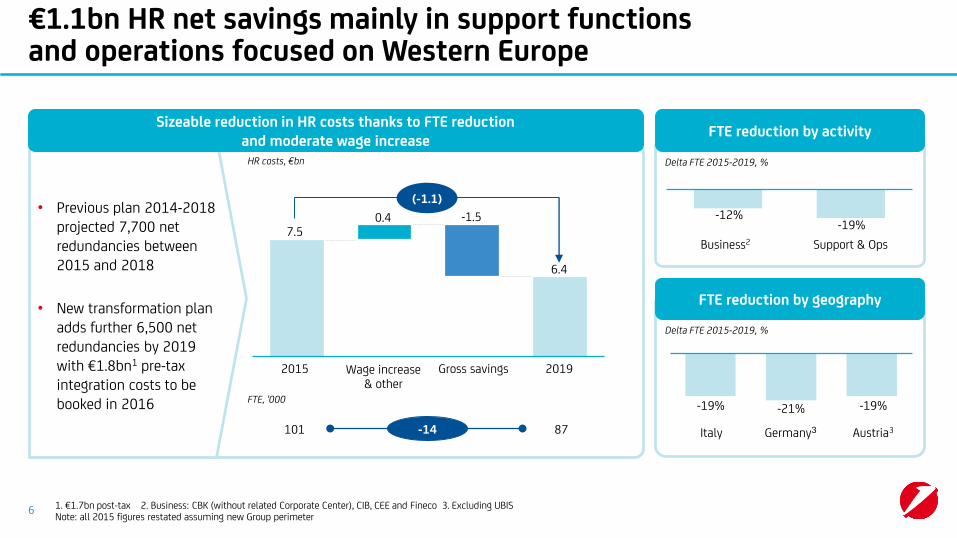
Sizeable reduction in HR costs thanks to FTE reduction and moderate wage increase
6
€1.1bn HR net savings mainly in support functions and operations focused on Western Europe
HR costs, €bn
(-1.1)
2019
6.4
Gross savings
-1.5
2015
7.50.4
Wage increase& other
-12%-19%
Support & OpsBusiness2
FTE reduction by geography
101
FTE, '000
87
FTE reduction by activity
Delta FTE 2015-2019, %
Delta FTE 2015-2019, %
-19% -21% -19%
Austria3Germany3Italy-14
1. €1.7bn post-tax 2. Business: CBK (without related Corporate Center), CIB, CEE and Fineco 3. Excluding UBISNote: all 2015 figures restated assuming new Group perimeter
• Previous plan 2014-2018 projected 7,700 net redundancies between 2015 and 2018
• New transformation plan adds further 6,500 net redundancies by 2019 with €1.8bn1 pre-tax integration costs to be booked in 2016
7
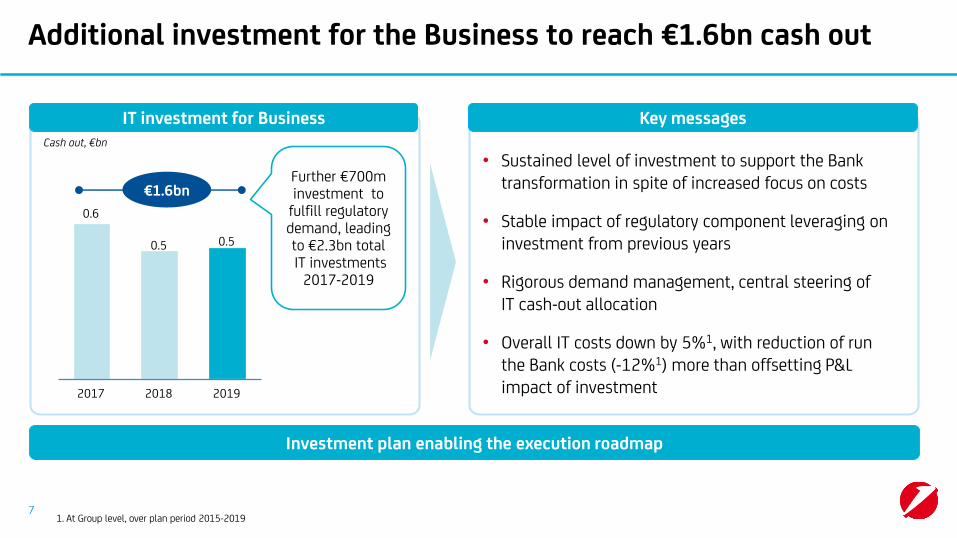
Additional investment for the Business to reach €1.6bn cash out
0.6
2019
0.5
2018
0.5
2017
Cash out, €bn
IT investment for Business Key messages
Investment plan enabling the execution roadmap
1. At Group level, over plan period 2015-2019
• Sustained level of investment to support the Bank transformation in spite of increased focus on costs
• Stable impact of regulatory component leveraging on investment from previous years
• Rigorous demand management, central steering ofIT cash-out allocation
• Overall IT costs down by 5%1, with reduction of runthe Bank costs (-12%1) more than offsetting P&Limpact of investment
€1.6bnFurther €700m investment to
fulfill regulatory demand, leading to €2.3bn totalIT investments
2017-2019

8
Further transformation of the simple Commercial Banking model through 4 main programs
NOT EXHAUSTIVE
Delivery/phases1. New Retail Internet & Mobile Banking in Western Europe (GIMB) and CEE "Mobile First" strategy
Bank's transformation
End-to-end process review enabled by digitalization
Procurement and real estate optimization
IT simplification and evolution
Centralized operations streamlining
2018 20192017
Decommissioning of applications
New digital core banking
Global payment platform
Continued data-driven customer service: advanced CRM and analytics
Blockchain technology exploitation (e.g. FX trade confirmation already live)
Further hub centralization
Continued nearshoring
Procurement optimization
Real estate optimization
Redesign end-to-end core processes
Digital authentication and document dematerialization
Digital sales and service extension
Digital channel customer engagement1
Trade finance front end
Corporate Banking e-portal

9
Leverage on the existing "One IT Factory" to accelerate the plan
• One IT factory serving Western Europe1 and part of CEE2, totaling 70% of IT costs in 2015
• 2 main data centers consolidated in 4 sites
• A strategic partnership with IBM to manage theIT infrastructure
• Multi-country IT competence centers with increasedpresence in CEE countries
• 3 main Commercial Banking IT platforms, covering almost the total of all Commercial Banking activities
• 1 Global platform for Markets product line
• Integrated Data Repository covering – with single deal statistics – liquidity management, risk adjusted profitability and credit risk calculation engines
A centralized IT factory… …with Global platforms
Centralization accelerating efficiency and evolution of the IT platform,allowing common investment and best practice sharing
IT simplification and evolution
1. Italy, Germany and Austria 2. Czech Republic, Slovakia and Hungary
10
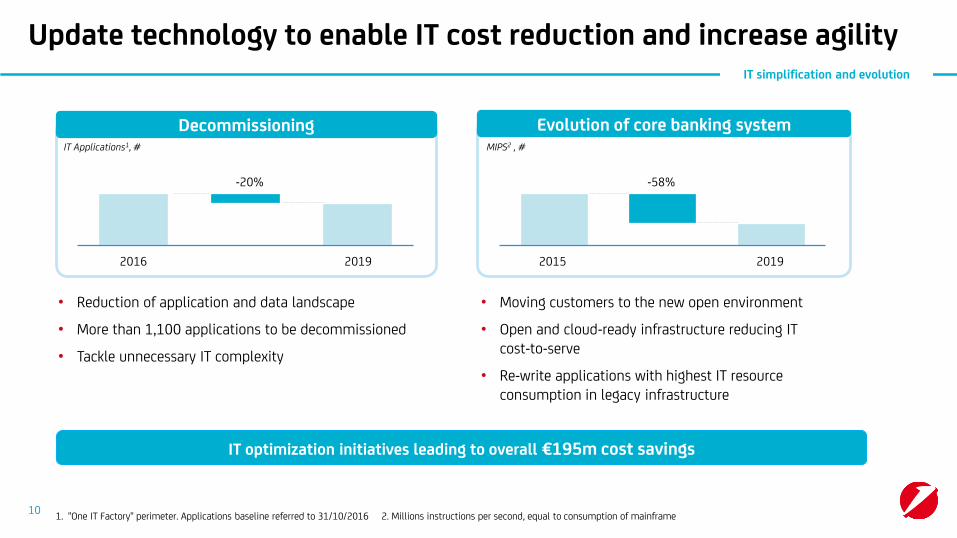
Update technology to enable IT cost reduction and increase agility
1. "One IT Factory" perimeter. Applications baseline referred to 31/10/2016 2. Millions instructions per second, equal to consumption of mainframe
• Reduction of application and data landscape
• More than 1,100 applications to be decommissioned
• Tackle unnecessary IT complexity
• Moving customers to the new open environment
• Open and cloud-ready infrastructure reducing ITcost-to-serve
• Re-write applications with highest IT resource consumption in legacy infrastructure
IT Applications1, #
-25%
Decommissioning Evolution of core banking system
2015 2019
-58%
MIPS2 , #
IT optimization initiatives leading to overall €195m cost savings
IT simplification and evolution
20192016
-20%
11
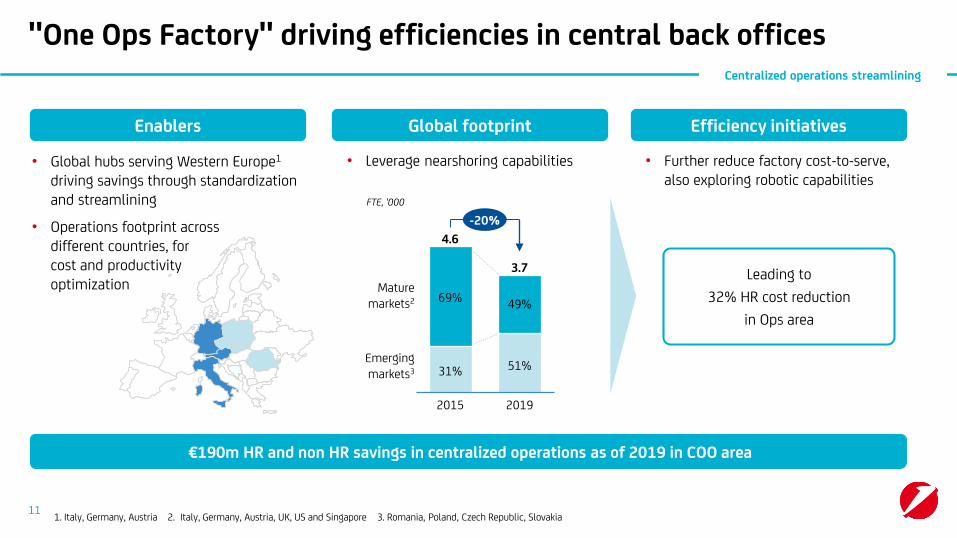
"One Ops Factory" driving efficiencies in central back offices
Enablers
• Leverage nearshoring capabilities
FTE, '000
• Further reduce factory cost-to-serve, also exploring robotic capabilities
• Global hubs serving Western Europe1
driving savings through standardization and streamlining
• Operations footprint acrossdifferent countries, forcost and productivityoptimization
Global footprint Efficiency initiatives
Centralized operations streamlining
Leading to
32% HR cost reduction
in Ops area
€190m HR and non HR savings in centralized operations as of 2019 in COO area
-20%
2019
3.7
51%
49%
2015
4.6
31%
Mature markets2
Emerging markets3
69%
1. Italy, Germany, Austria 2. Italy, Germany, Austria, UK, US and Singapore 3. Romania, Poland, Czech Republic, Slovakia
12
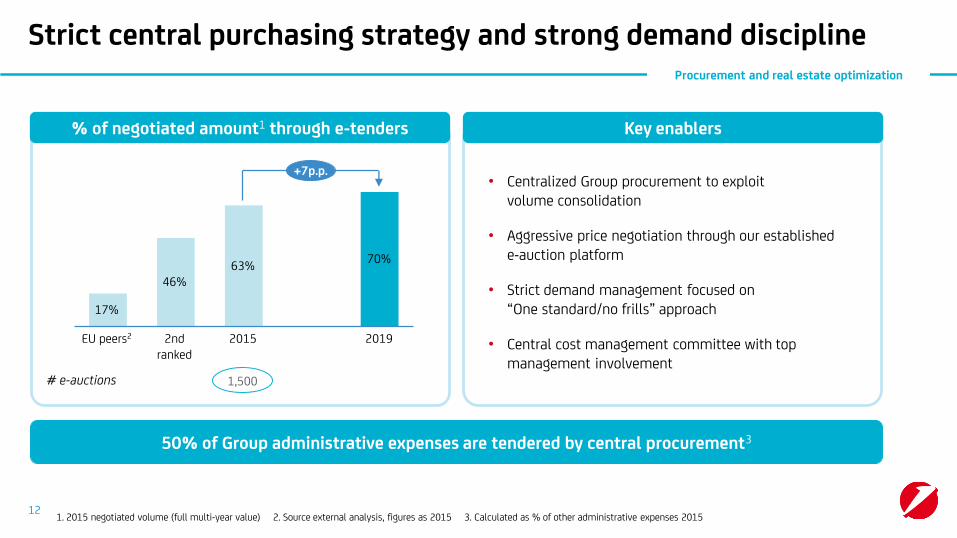
Strict central purchasing strategy and strong demand discipline
+7p.p.
2019
70%
2015
63%
2nd ranked
46%
EU peers2
17%
# e-auctions 1,500
1. 2015 negotiated volume (full multi-year value) 2. Source external analysis, figures as 2015 3. Calculated as % of other administrative expenses 2015
% of negotiated amount1 through e-tenders Key enablers
Procurement and real estate optimization
50% of Group administrative expenses are tendered by central procurement3
• Centralized Group procurement to exploitvolume consolidation
• Aggressive price negotiation through our establishede-auction platform
• Strict demand management focused on“One standard/no frills” approach
• Central cost management committee with topmanagement involvement
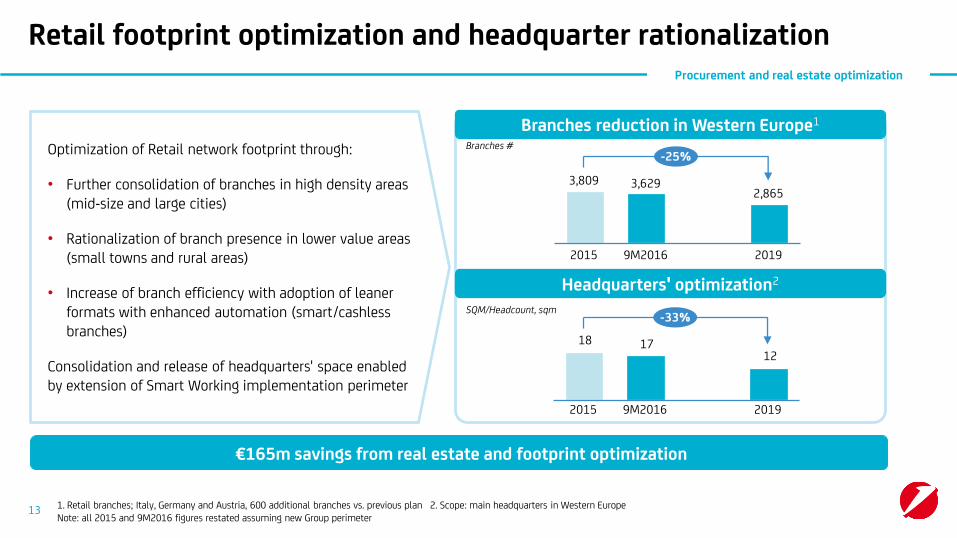
1. Retail branches; Italy, Germany and Austria, 600 additional branches vs. previous plan 2. Scope: main headquarters in Western EuropeNote: all 2015 and 9M2016 figures restated assuming new Group perimeter
13
Retail footprint optimization and headquarter rationalization
Branches reduction in Western Europe1
Optimization of Retail network footprint through:
• Further consolidation of branches in high density areas (mid-size and large cities)
• Rationalization of branch presence in lower value areas (small towns and rural areas)
• Increase of branch efficiency with adoption of leaner formats with enhanced automation (smart/cashless branches)
Consolidation and release of headquarters' space enabled by extension of Smart Working implementation perimeter
Headquarters' optimization2
9M20162015
3,809
-25%
2019
2,8653,629
18 17 12
9M20162015 2019
-33%
Branches #
SQM/Headcount, sqm
€165m savings from real estate and footprint optimization
Procurement and real estate optimization

14
Recognized track record in end-to-end optimization to bescaled up through a new “end-to-end delivery unit"
Bank's transformation
1. Overdraft and personal loan already live
Track record of successful pilots…
Italian tax payment flows
• Time to process reduced by 30%• FTE efficiency by 26%
Money transfer
• Time to process reduced by 20%• FTE efficiency by 19%
Households unsecured lending1
• >80% of automated credit decisions• From 6 to 1 simple platform
New approach based on multi-disciplinary teams ( joint IT-Business) tested in previous cost optimization programs
3 successful pilots completed
…scaled up to drive the transformation
Setup of "end-to-end delivery unit" ( joint IT-Business leadership) to streamline product and service delivery, enabling substantial impact and savings, in particular in Italy
• Multi-disciplinary teams working in parallel, with objective ofend-to-end redesign and digitization of one product
• 15-20 FTE per team from all relevant functions (IT, Business, support), with 150+ resources involved
• Co-location in one “design studio” and continuous interaction
• Simplified and more efficient budgeting to drive change
• Agile development with quicker, progressive releases of"modules of change"
• Strong sync with network and IT Factory

• Extend digital authentication to provide best customer experience
• Eliminate paper at the source
• Leverage advanced scanning technologies (OCR3) to allow innovative workflow and robotization
15
Digital enablers for process automation and effectiveness
Digital authentication
Document dematerialization
Bank's transformation
Preconditions to allow process innovation
Planned deployment
Already available
One Time Password Biometrics
Signpad Mobile1
Optical Character Recognition CDD4
Italy
Back Office
1. Germany and Austria pure authentication; not yet live transaction authorization. 2. Consolidated information for CEE to reflect different maturity levels 3. Optical character recognition 4. Central document dematerialization
Germany
Austria
Italy
Germany
Austria
CEE2
CEE2
Branch
Concrete ongoing projects
SMS PINMobile Token

16
Recognized blueprint of digital innovation across channels
Mobile and payments
• Banking App with Personal Finance Manager and account opening
• Payments App with Wallet card control, peer-to-peer and contactless payments
• Forex trade confirmation based on blockchain
• 1-click Mobile personal loan, leveraging on pre-scoring
• Mortgage Refinancing and Cash Loan online offer
• Cards installments in real time and on the move
Instant lending and
installments
Big Data and robo-advisory
• Marketing intelligence cockpit for Merchants and financial assistant for SME
• Advice engine based on robo-advisory and clients' insights
• Business intelligence engine for a single point of view on multinational Corporate clients
4.3 stars rating onApp stores1
400+ matched trades per week
46 seconds required time for Mobilepersonal loan
47% cardsinstallments digital
17,000 SME customers subscription
1,800 relationship managers and 125,000Corporate clients2
Bank's transformation
1. UniCredit Italy Mobile Banking App 2016: historical evaluation Google Play; 4 stars on Apple iTunes. App Germany launched in April 4.5 stars rating on App stores 2. Includes figures from rolled out programs in CEE (in Bulgaria, Czech Republic, Slovakia, Romania, Croatia, Hungary) and in countries where it will be extended in February 2017 (Italy, Slovenia, BiH and Serbia)
NOT EXHAUSTIVE
Credit
Fineco

17
Boosting digital offer ensuring Bank's readinessfor clients' changing behaviors
Future developments
Online: total active users1, m
13.8
2015 2019
8.5
36% 53%Clients penetration
Mobile: total active users1, m
2019
10.7
2015
3.6
15% 41%Clients penetration
Retail key targets
Bank's transformation
• New internet/mobile platforms fully integrated with CRM allowing real-time customer engagement and interaction
• Remote Advisory for individuals and companies also exploitingrobo-advisory engines
• Fast credit on digital channels with advanced pre-scoring techniques
Retail
Corporate
• New e-banking front-end as a single sign-on for integrated functionalities (trade finance, supply chain finance and globalcash management)
• New digital solutions to reduce “response time” and to simplify the interaction with customers (e.g. instant payments, cross-border payments – same day use of funds)
1. including 100% of Turkey and Fineco client baseNote: all 2015 figures restated assuming new Group perimeter
18
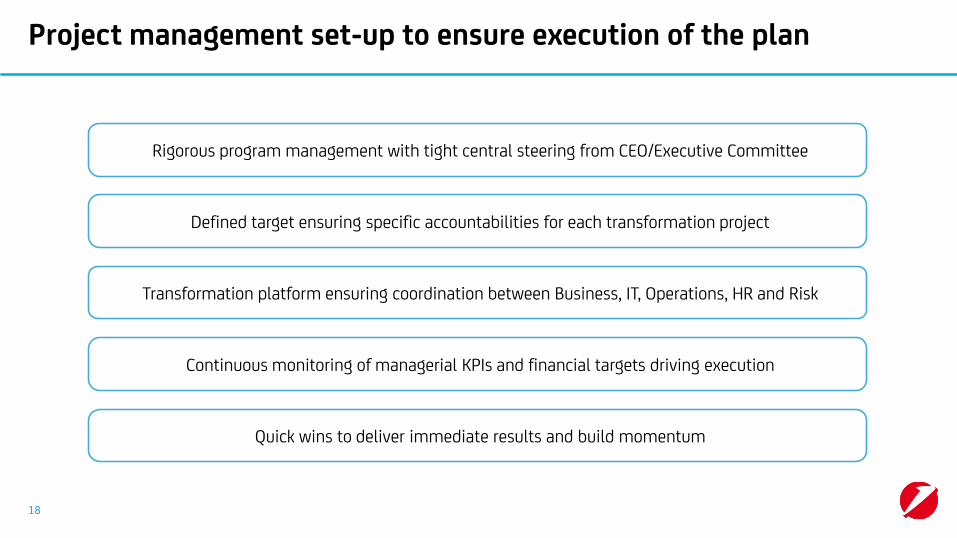
Project management set-up to ensure execution of the plan
Defined target ensuring specific accountabilities for each transformation project
Rigorous program management with tight central steering from CEO/Executive Committee
Transformation platform ensuring coordination between Business, IT, Operations, HR and Risk
Continuous monitoring of managerial KPIs and financial targets driving execution
Quick wins to deliver immediate results and build momentum
19
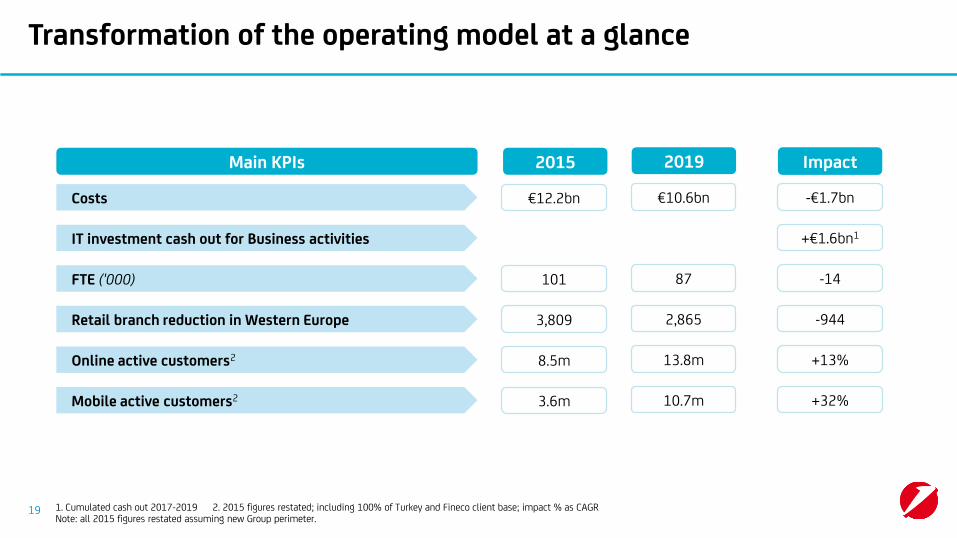
Transformation of the operating model at a glance
1. Cumulated cash out 2017-2019 2. 2015 figures restated; including 100% of Turkey and Fineco client base; impact % as CAGRNote: all 2015 figures restated assuming new Group perimeter.
2015 2019 Impact
€12.2bn €10.6bn -€1.7bnCosts
101 87 -14FTE ('000)
3,809 2,865 -944Retail branch reduction in Western Europe
8.5m 13.8mOnline active customers2
3.6m 10.7m +32%Mobile active customers2
+€1.6bn1IT investment cash out for Business activities
+13%
Main KPIs
20
Closing remarks
Drive optimization of the operating model, enabled by a joint effort with Business toward a sustainable lower cost structure
Leverage on digitalization and process redesign to transform the Bank and improve customer experience
Secure the execution with clear program management and accountability culture ensured by tight central steering, KPIs and common platforms

Annex

FTE ('000)
22
2015-2019 FTE evolution details
101.3
-14.4
2015
0.2
Exitsrestructuring
2019 87.1
Net turnover and Other3
-5.6 -3.9 -9.4
-1.1 -1.4 -2.5
-1.1 -1.0 -2.1
-8.0 -6.4 -14.4
Italy1
Germany
Austria
Total restructuring
Totalnet impact
-14.2-6.5-7.7
-0.3 -0.1 -0.4Rest of Group2
-14%
-19%
-21%
-19%
1. Including UBIS Italy 2. Includes UBIS Germany, UBIS Austria and Other 3. Other contains deconsolidations , evolution of FTE not linked to HR costs and Other technical movements (e.g. LTA, maternities)
Old plan New plan TotalTotal net
reductions % vs. 2015
-14.2