Once Upon A Time...Tax Evasion Mirco Tonin University of Southampton Warsaw, November 30th, 2007.
26
Once Upon A Time...Tax Evasion Mirco Tonin University of Southampton Warsaw, November 30th, 2007
-
date post
20-Dec-2015 -
Category
Documents
-
view
217 -
download
1
Transcript of Once Upon A Time...Tax Evasion Mirco Tonin University of Southampton Warsaw, November 30th, 2007.

Once Upon A Time...Tax Evasion
Mirco ToninUniversity of Southampton
Warsaw, November 30th, 2007
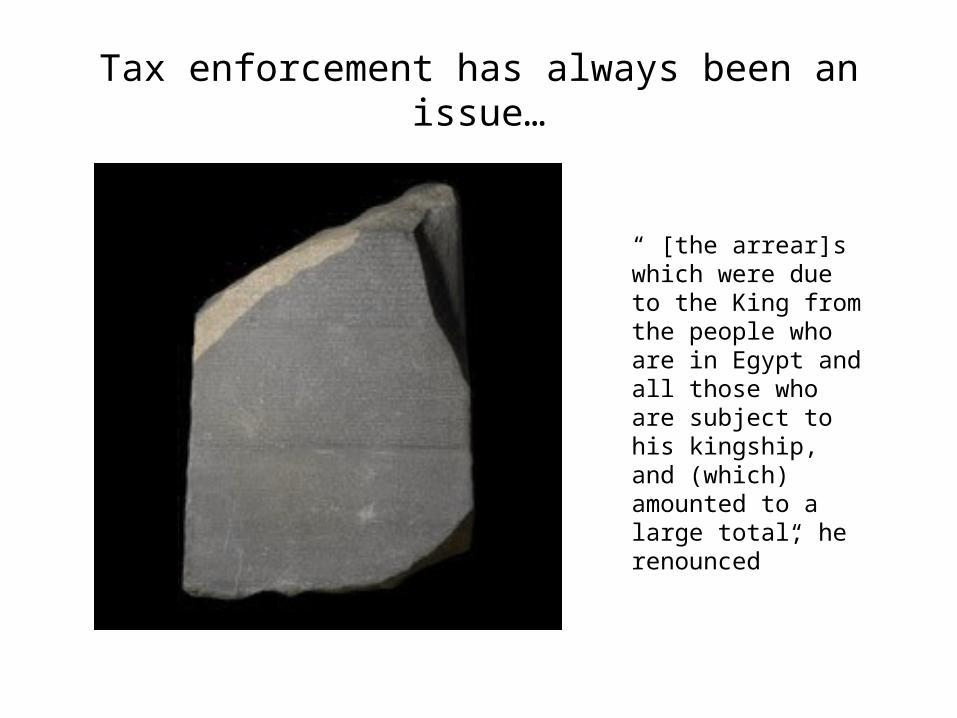
Tax enforcement has always been an issue…
“ [the arrear]s which were due to the King from the people who are in Egypt and all those who are subject to his kingship, and (which) amounted to a large total, he renounced ”
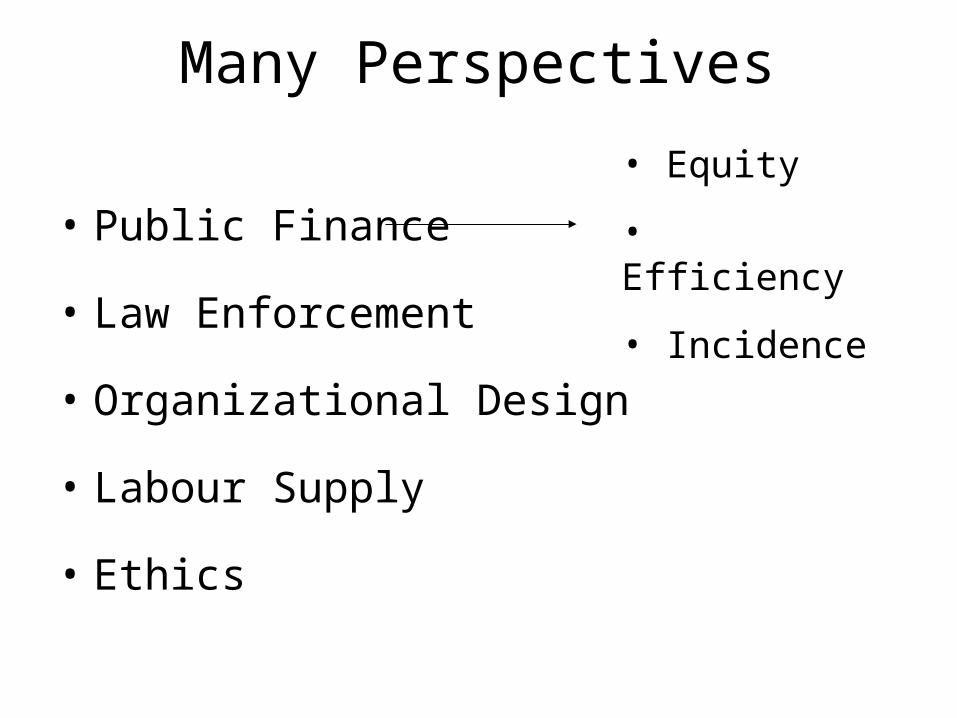
Many Perspectives
• Public Finance
• Law Enforcement
• Organizational Design
• Labour Supply
• Ethics
• Equity
• Efficiency
• Incidence
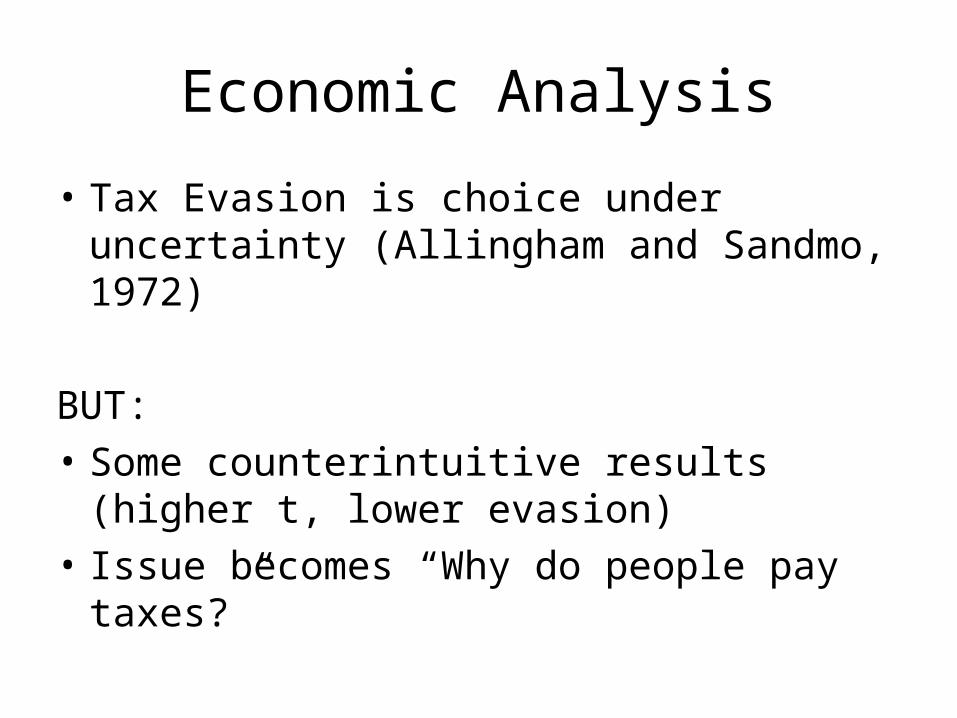
Economic Analysis
• Tax Evasion is choice under uncertainty (Allingham and Sandmo, 1972)
BUT:
• Some counterintuitive results (higher t, lower evasion)
• Issue becomes “Why do people pay taxes?”
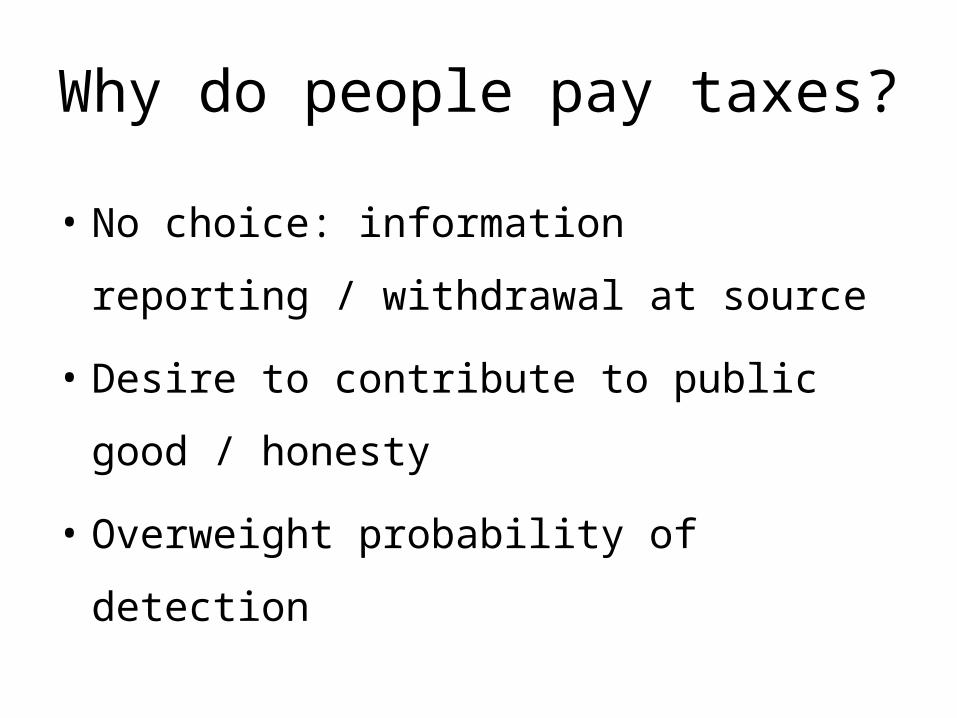
Why do people pay taxes?
• No choice: information reporting /
withdrawal at source
• Desire to contribute to public good /
honesty
• Overweight probability of detection
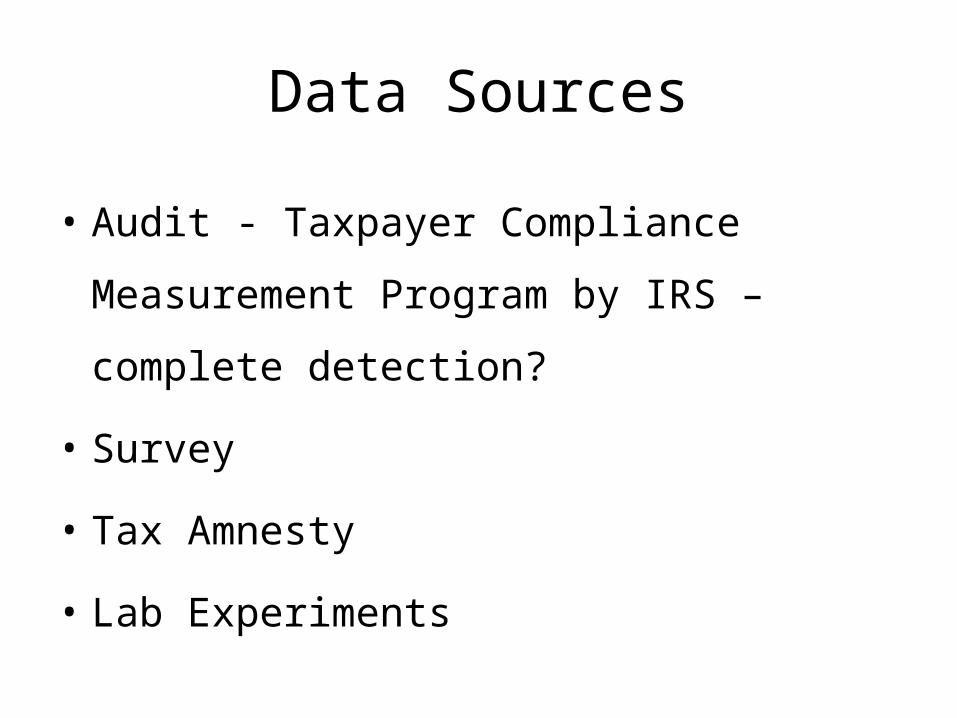
Data Sources
• Audit - Taxpayer Compliance Measurement
Program by IRS – complete detection?
• Survey
• Tax Amnesty
• Lab Experiments
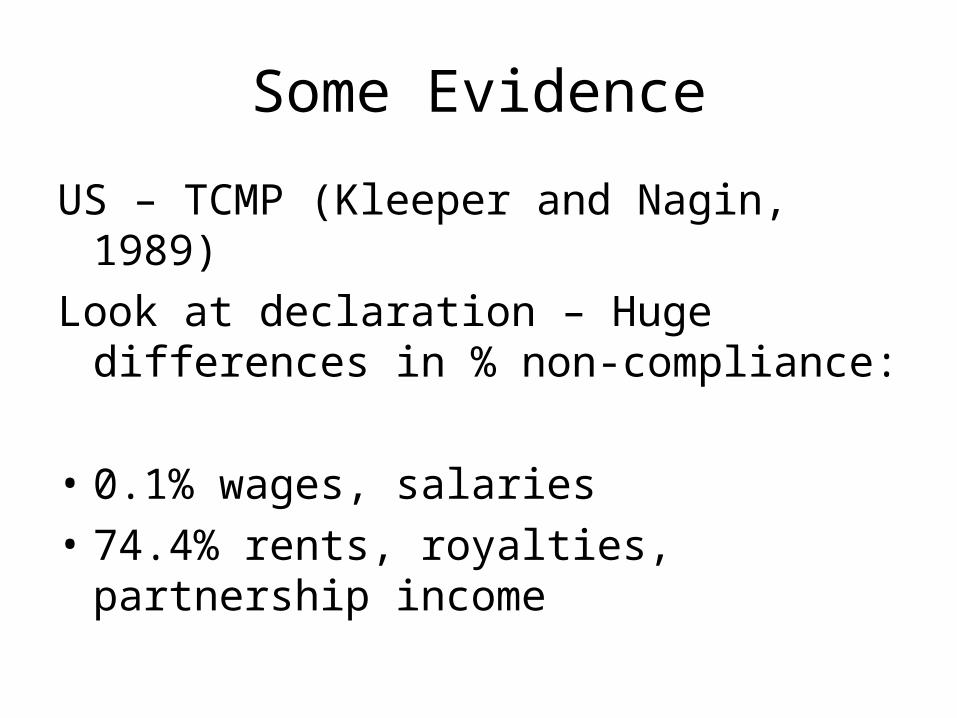
Some Evidence
US – TCMP (Kleeper and Nagin, 1989)
Look at declaration – Huge differences in % non-compliance:
• 0.1% wages, salaries
• 74.4% rents, royalties, partnership income
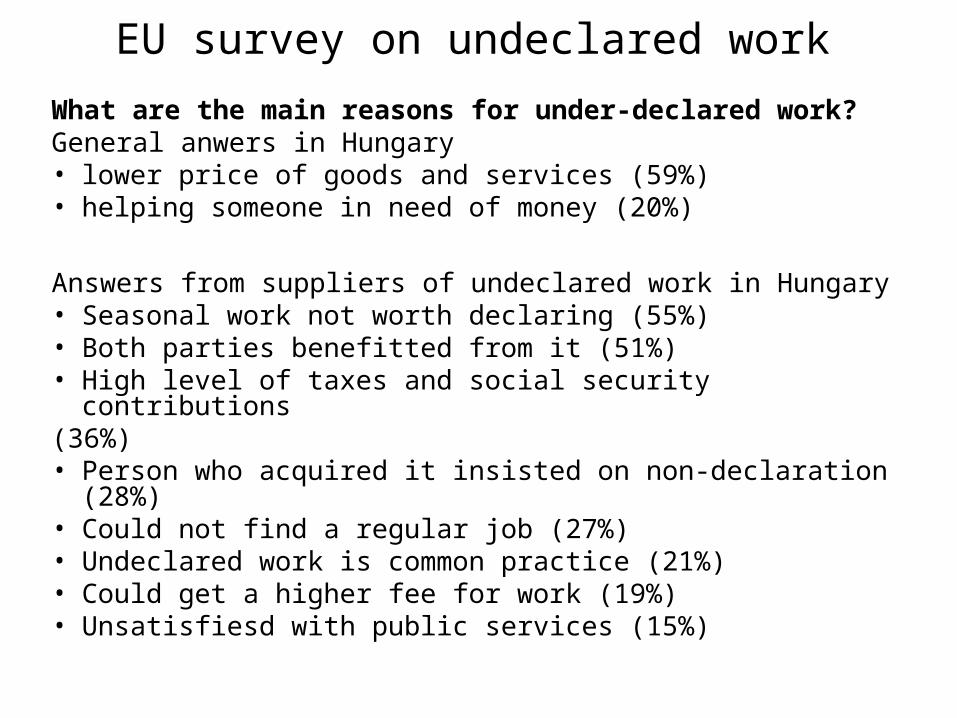
EU survey on undeclared work
What are the main reasons for under-declared work?General anwers in Hungary• lower price of goods and services (59%)• helping someone in need of money (20%)
Answers from suppliers of undeclared work in Hungary• Seasonal work not worth declaring (55%)• Both parties benefitted from it (51%)• High level of taxes and social security contributions (36%) • Person who acquired it insisted on non-declaration (28%)• Could not find a regular job (27%)• Undeclared work is common practice (21%)• Could get a higher fee for work (19%)• Unsatisfiesd with public services (15%)
Lemieux, Fortin, Fréchette, “The effect of taxes on labor supply in the underground
economy”, AER 84(1)
• Use survey data for Quebec city, Canada, to study determinants of labour supply decisions in underground economy
• Information on hours of work and wages/earnings in both sectors
• Underground labor-market activity concentrated among people at the low end of income distribution
• Hours worked in underground sector depend negatively on wage rate in either regular or underground sector, with a large negative elasticity with respect to wage rate in regular sector
• Tax and transfer system does not seems to significantly distort allocation of hours of work from regular to underground sector.
Other Methods (1)Comparison of income and participation data from
different sources
• Fiorio and D’Amuri, 2005: survey-based data set and tax forms.
• Main assumption: in survey something "close" to true income is declared.
• Focus on employment and self-employment. • Analysis by deciles: employment income evaded
mainly in bottom deciles, with high rates of evasion low in the distribution and close to zero a median. Self-employment income also evaded mainly at lower levels of income, but evasion is present across the whole distribution
Other Methods (2)
Comparison of income and consumption
data from same source:
• Pissarides and Weber, 1989
• Gorodnichenko and Sabirianova, 2006
• Feldman and Slemrod, 2007
What can we do?
• Optimal Auditing
• Design of Incentives for Tax
Administration
• Presumptive Taxation
Presumptive Taxation
• Rebuttable vs Irrebuttable
• Minimum Tax vs Exclusive
• Mechanical vs Discretionary
The Bulgarian Case
Problem:
• massive underreporting of labour compensation
Two changes in labour regulation in 2003:
•compulsory registration of all concluded, amended, or terminated contracts
•introduction of minimum social security thresholds

Minimum Social Security Thresholds
Varying according to:
• occupational group (9 categories, e.g. administrative staff / service workers and sale workers)
• sector (48 in 2003, 73 at present, e.g. processing and preserving of fruit and vegetables / manufacture of dairy products)
Potentially, 657 different MSIT

MINIMUM: 180 leva per month (statutory minimum wage)
MAXIMUM: 851 leva per month (management in manufacture of coke, refined petroleum products and nuclear fuel)
• Negotiated each year with social partners (in 2005 for 48 out of 68 sectors)
Minimum Social Security Thresholds (2)
• If no agreement, fixed administratively
• MSITs negotiated with social partners usually become sectoral minimum wages through extension of collective agreements
• No systematic evaluation, but apparently successful in reducing underreporting
Conflict of Interest
Recent Proposal by Industrial Association:
• Workers liable to a fine in case of underreporting
• Exemption from the fine and additional protection against unfair dismissal if worker denounces illegal payments to authorities

The Italian Case
Problem:
• massive underreporting by small and medium enterprises, self-employed, and professionals
Introduction in 1998 of “Business Sector Analysis”
• methodology to estimate revenues and compensations
• hybrid between auditing selection mechanism and presumptive taxation
Elaboration of sector-specific BSA:
• 45 in 1998, 200 now, e.g. “Retail sale of flowers, plants and seeds via permanent or mobile stalls”/ “Tour guide activities”/ “Dentistry”
• participation of trade associations
• publication of results
• regular updating
Main Features
Procedure 1. Estimation of revenues (based on sector/ organizational structure/ reference market/ business model/ geographical location/ structural and accounting variables)
2. Declaration : • Accounting Revenues > Estimate?• Taxpayer voluntarily “adjust” to estimate?
If yes, taxpayer is “consistent”, if no “inconsistent”
3. Auditing : “inconsistent” taxpayer• higher probability of an auditing• reversal of burden of proof
Estimation of Revenues - Macro
A. Data Collection - survey of the population of interest to collect structural and accounting data (e.g. for retail sale of flowers approx. 100 questions)
B. Identification of Sectoral and Geographical Clusters (e.g. for retail sale of flowers, 8 clusters - “flower retailers with kiosk operating nearby cemeteries”)
C. Estimation of Revenue Function – regression analysis on selected sample: relationship between revenues and structural and accounting variables
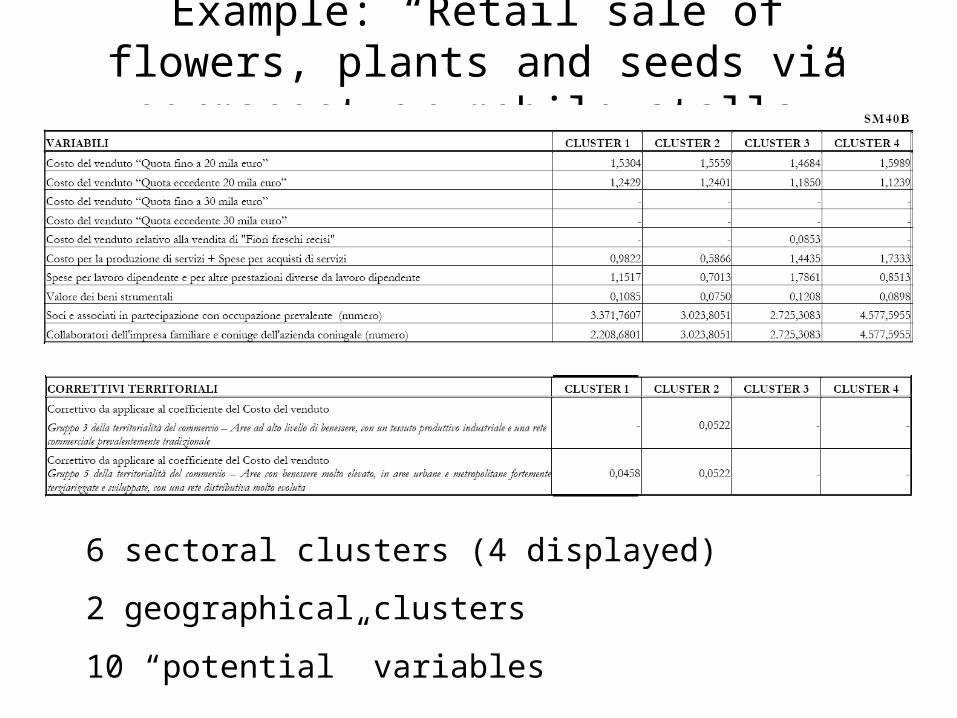
Example: “Retail sale of flowers, plants and seeds via permanent or mobile stalls”
6 sectoral clusters (4 displayed)
2 geographical clusters
10 “potential” variables
Declaration
• Applied to self-employed, professionals, SME with revenues below EUR 5m + other causes of exclusion (approx. 4m firms)
• Taxpayer fill in data and knows the amount of estimated revenues
• If accounting revenues are lower, can decide to adjust declaration to match estimate (a 3% penalty applies for deviations above 10%)
• If taxpayer decide NOT to do so, classified as “inconsistent”

Auditing“Inconsistent” taxpayers subject to:
• higher probability of auditing• reversal of burden of proof – taxpayer has to
document the reasons why revenues are below estimate
Examples of acceptable reasons:• illness or maternity• reduced business due to road
reconstruction• Economic marginality of business activity
Assessment
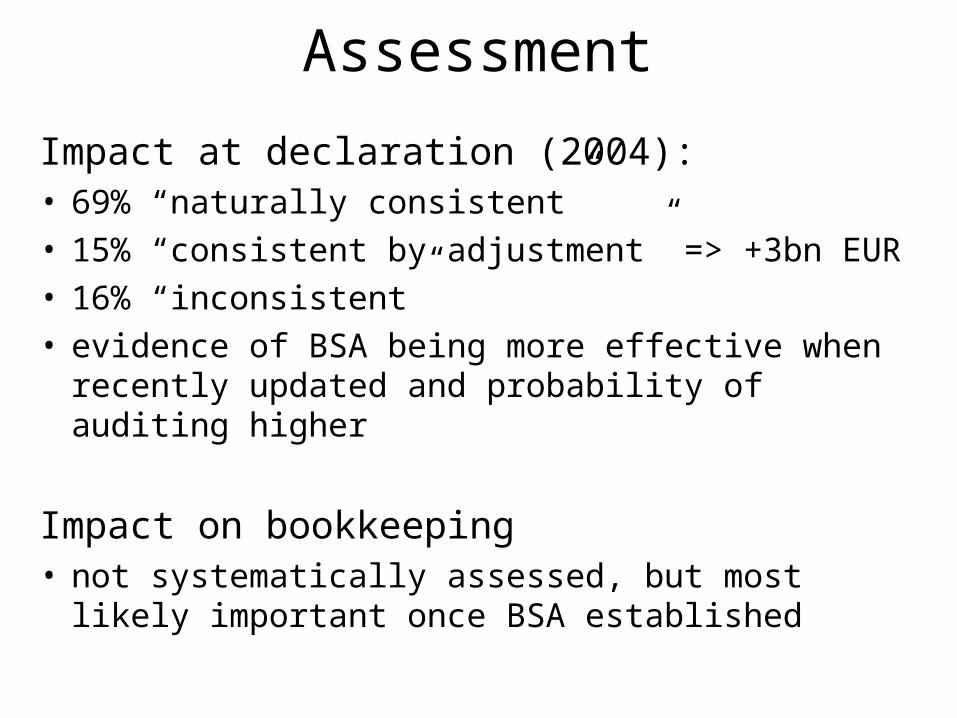
Impact at declaration (2004):• 69% “naturally consistent”• 15% “consistent by adjustment” => +3bn EUR• 16% “inconsistent”• evidence of BSA being more effective when
recently updated and probability of auditing higher
Impact on bookkeeping• not systematically assessed, but most likely
important once BSA established