
PART 3 LIMITED GOVERNMENT. Declaration of Independence Political Spectrum General Welfare.
Upload
truongtuyenCategory
view
224download
1
ON THE WELFARE EFFECTS AND POLITICAL ECONOMYOF COMPETITION-ENHANCING POLICIES*
Philippe Aghion and Mark Schankerman
We analyse the welfare effects of policies that intensify product market competition, and thechannels through which they operate. Using a circular model of horizontal product differen-tiation with asymmetric costs, we study the effects of increased price competition on marketselection among incumbent firms, cost reduction effort, and entry of new firms. The modelalso generates an endogenous demand for competition-enhancing or retarding policies arisingfrom cost heterogeneity, and we demonstrate the possibility of a ‘low-competition’ politicaleconomy trap. Simulations of the model illustrate that the selection effects we analyse, whichtraditional cost-benefit analysis is unlikely to capture, can be large.
Major institutional reforms, such as the establishment of the single market inEurope, the creation of NAFTA, and the introduction of the single Europeancurrency, have often been advocated by policy makers as increasing efficiency andwelfare by intensifying product market competition. Recent studies provideempirical support for competition-enhancing institutions or reforms. For example,in a recent study using industry-level panel data for nineteen OECD countries,Nicoletti and Scarpetta (2003) show that increased product and labour marketcompetition has positive and large effects on multi-factor productivity. Nickell(1996), Blundell et al. (1999) and Aghion et al. (2002) provide firm-level evidence ofthe positive link between product market competition and productivity perform-ance.
A quite separate empirical literature has established a clear link between pro-ductivity growth and certain types of physical infrastructure – notably transport andtelecommunications, both of which reduce transaction costs (Fernald, 1999; Ro-eller and Waverman 2001). In a recent study of firms in Russia, Brown and Earle(2001) show that the level of productive efficiency is positively related to thequality of transport and telephone infrastructure and to measures of productmarket competition.1
These empirical studies document the importance of competition-enhancingpolicies, institutions and infrastructure, but what is missing is a theoretical modelof the underlying mechanisms at work and their implications for welfare (or ‘cost-benefit’) analysis. This paper tries to provide such a framework. In so doing, we
* Appendixes 2 and 3 are available on the Journal’s website www.res.org.uk. We thank John Vickersfor helpful discussions at an early stage of the research. We are grateful to two anonymous referees andthe Editor, David de Meza, for very constructive comments on earlier drafts of this paper, and to MarcoSchonborn and Josep Pigoan for research assistance.
1 There is also a large literature emphasising the importance of appropriate institutional infrastruc-ture and policies for market development and economic growth. Leading examples include legalreforms to improve contract enforcement (McMillan, 1997; McMillan and Woodruff, 1999) and cor-porate governance (Pistor et al., 2000), policies to reduce regulatory barriers to the entry of new firms(Djankov et al., 2002), and other aspects of good government (Weingast, 1995; Knack and Keefer, 1995;Acemoglu et al., 2001). A key aspect of all these reforms is precisely that they underpin effectivecompetition in product, financial and labour markets.
The Economic Journal, 114 (October), 800–824. � Royal Economic Society 2004. Published by BlackwellPublishing, 9600 Garsington Road, Oxford OX4 2DQ, UK and 350 Main Street, Malden, MA 02148, USA.
[ 800 ]

also show how an endogenous demand for such policies and institutions can arise.In contrast, the existing literature typically treats them as exogenous.Common features of competition-enhancing policies and institutions, and of
certain types of physical infrastructure, are, first, to facilitate the weeding out ofless efficient firms, second to cost reduction investments by incumbent firms, andthird to encourage the entry of new, more efficient firms.2 This paper develops asimple theoretical framework for analysing and quantifying the welfare effectsfrom intensifying product market competition that work through those threechannels: market selection, cost reduction and entry. We use a simple extension ofthe circular model of competition (Salop 1979) in which there are asymmetricproduction costs for both incumbent firms and potential entrants. In this model,product market competition is measured by the unit transport cost, and weexamine the welfare gains from reducing this cost. Of course, ‘transport cost’ issimply a metaphor for policies, institutions and infrastructure that intensifyproduct market competition.Apart from the direct savings of reduced transport cost, the model captures
three types of indirect welfare gains:
(i) market selection among incumbents: increasing competition generates a largerequilibrium market share for low-cost firms, and this reduces averageproduction costs;
(ii) cost reduction (or restructuring): greater competition changes the incentivesfor firms to reduce their production cost but this effect works differently forhigh and low-cost firms; and
(iii) entry: intensifying post-entry competition reduces the incentives for newhigh-cost firms to enter the market but, in sharp contrast to the symmetriccost case (Dasgupta and Stiglitz, 1980), it can actually encourage entry bylow-cost potential entrants.
The last two effects are ‘dynamic’ by-products of the market selection effect in atwo-stage framework, where price competition is preceded by firms’ decisions toreduce costs and/or enter the market. We show that the strength of these indirecteffects depends on the parameters of the economy, such as the initial degree ofcost asymmetry, the number of firms, the initial level of product market compe-tition and other factors.We show that policies and infrastructure that intensify product market com-
petition create both gainers and losers: namely, low-cost incumbent firms benefitfrom increased product market competition if there is sufficient cost asymmetry,but high-cost firms unambiguously lose. Thus the model generates an endog-enous demand for competition-enhancing (or retarding) policies. Using a simplepolitical economy model adapted from Acemoglu et al. (2002), in which specialinterest groups can ‘capture’ politicians, we show that under certain conditions
[ O C TO B E R 2004] 801COM P E T I T I O N - E NH AN C I N G . . .
2 The key characteristic of competition-enhancing policies and/or specific types of infrastructurethat we model is that they facilitate the translation of existing cost differences into differences inequilibrium market shares and reductions in price-cost margins (the Lerner index). Only a few types ofinfrastructure affect the intensity of competition in this sense – most notably, transport and commu-nications.
� Royal Economic Society 2004

an economy that can fall into a low-competition trap in which politicians aresuccessfully bribed by high-cost firms to maintain low competition. Such traps aremore likely to occur in economies where the initial degree of competition is low,initial cost asymmetries are small, and politicians are less driven by social welfareconcerns (i.e., political institiutions do not effectively discipline their behaviour).These are the conditions under which the ability of high cost firms to bribepoliticians to prevent increases in competition (or to reduce it) are greatest.
Finally, we present simulations of the model to illustrate that the indirect welfareeffects of enhancing competition – i.e., the induced selection effect, cost reductionand entry – can be large. This point is important because traditional cost-benefitanalysis is unlikely to capture these indirect effects in practice.
For our purposes the circular model has two important advantages: a simple,supply-side interpretation of intensified competition, and transparent algebra.However, the basic ideas are robust to alternative specifications, includingthe Dixit-Stiglitz and Cournot models with asymmetric costs, as we show inAppendices 2 and 3.3,4
In addition to the literature on competition-enhancing policies and institutions,our paper is related to a growing number of empirical papers that documentpervasive micro-level heterogeneity in productivity growth, entry and exit, both inindustrialised and developing economies, (Baily et al., 1992; Dunne et al., 1988;Roberts and Tybout, 1996; Disney et al., 2003). These studies show empirically howto decompose aggregate productivity growth into three main components: marketselection (reallocation of market shares between firms of different productivitylevels), cost reduction (within-plant improvement) and net entry. The relativeimportance of these different channels varies substantially across the countries thathave been studied. Our model offers a potential explanation for such variation,since we show that the importance of the different channels depends on thecharacteristics (‘initial conditions’) of the economy. At the same time, thisemphasises that the effectiveness of different policies to promote productivitygrowth will also depend on these initial conditions, as the simulations in Section 5illustrate.
Our paper also contributes to the existing theoretical literature on competitionand incentives (Hart, 1983; Scharfstein, 1988; Schmidt, 1997) and on competitionand growth (Aghion et al., 1997) by introducing market selection and analysing itswelfare implications. In this we build on the earlier work by Vickers (1995), whofirst identified that new entry can generate a positive externality on existing firmswhen there is cost asymmetry.
The paper is organised as follows. Section 1 presents the basic model withasymmetric, exogenous cost levels and no entry. Section 2 examines how the
3 In independent work, Blanchard and Giavazzi (2001) also adopt a Dixit-Stiglitz specification andmodel market deregulation as an increase in the elasticity of subsitution in the utility function. How-ever, they focus on macroeconomic implications of product and labour market deregulation.
4 As we show in Appendix 2, the Dixit-Stiglitz specification: (i) allows for an expansion effect ofintensified competition (more aggregate consumption due to lower prices), and (ii) introduces allo-cative inefficiency from imperfect competition. These aspects are absent from the circular modelbecause aggregate demand is fixed, but we show that they do not affect the qualitative conclusions fromthe simpler circular model presented in the text.
802 [ O C TO B E RTH E E CONOM I C J O U RN A L
� Royal Economic Society 2004

model can generate an endogenous demand for competition-enhancing policiesand the possiblity of a low-competition trap arising simply from cost hetero-geneity. Section 3 studies how increasing competition affects the incentives forhigh- and low-cost firms to reduce costs, and thus the degree of cost asymmetryitself. Section 4 analyses entry. Section 5 uses simulations to compare the wel-fare effects of enhancing product market competition and policies to subsidisecost reduction and entry, and shows that the selection and other indirect effectsof increasing competition can be large. Brief concluding remarks follow.
1. Basic Model
We use a horizontal product differentiation model (Salop, 1979), where nfirms are evenly located on a unit circle (location decisions are taken as exo-genous). The demand side of the economy is standard: consumers are uni-formly distributed on the circle, pay price pj to purchase one unit of good fromfirm j, and incur a transport cost of t per unit of distance. Competition-enhancing policies are modelled here as a reduction in the unit transport cost,since this has the effect of reducing the equilibrium price-cost margin. Weassume that consumers’ willingness to pay for the differentiated product issufficiently high that total demand remains equal to one for the range of pricesconsidered.Unlike the standard model, we introduce cost asymmetry: a fraction q of firms
have high unit costs (cH) and 1 ) q have low unit costs (cL), and Dc ¼ cH ) cL > 0denotes the degree of cost asymmetry. Firms do not know the cost characteristicsof neighbouring firms, and thus base their pricing decisions on the ‘average’ priceof their neighbours, which reflects the mix between high and low-cost firms in theeconomy.5 The parameters q,cH and cL are common knowledge. In this Sectionwe study price competition among the n firms. As price decisions are made
5 This assumption can be rationalised in the following way. Consider the case of markets in which, ateach period, there is a positive turnover of firms and/or a technological shock to which firms only adaptwith probability (1 ) q). If firms do not immediately observe whether their competitors have adaptedsuccessfully to the shock, every period a given firm faces uncertainty about the unit costs of its imme-diate competitors.This assumption is made for the sake of tractability but it does not affect our analysis in any major way.
In particular,we have looked at an alternative specification where firms are paired on a series ofHotelling lines and each firm knows its Hotelling neighbour’s cost levels ex post but firms do not knowex ante how they will be paired. For n large, by the law of large numbers a fraction q2 of pairs will involvehigh cost firms only, a fraction (1 ) q)2 of pairs will involve low cost firms only, and the remainingfraction 2q(1 ) q) will consist of non-assortative pairs involving one low cost and one high cost firm. Foreach type of pairing, one can compute the equilibrium profit of each firm involved in the pair. Whileonly the traditional consumer-surplus and business stealing effects will be at work in the pairs (H, H) or(L, L), the selection effect pointed out in this paper will be at work in the pairs (L, H) and themagnitude of this effect will obviously increase with the cost differential Dc.To evaluate the welfare effects of a reduction in t, we can simply aggregate over all pairs, which is
equivalent to doing the welfare analysis ex ante, when firms are under the veil of ignorance regarding theirown cost and/or the types of firms with which they will be paired. Introducing ex ante uncertainty in thisway, instead of ex post uncertainty at the pricing stage, does not alter the main conclusions of welfareanalysis – in particular, we obtain qualitatively similar welfare effects of a reduction in t and comparativestatics with respect to Dc. But it is harder to analyse entry in a Hotelling model.
2004] 803COM P E T I T I O N - E NH AN C I N G P O L I C I E S
� Royal Economic Society 2004
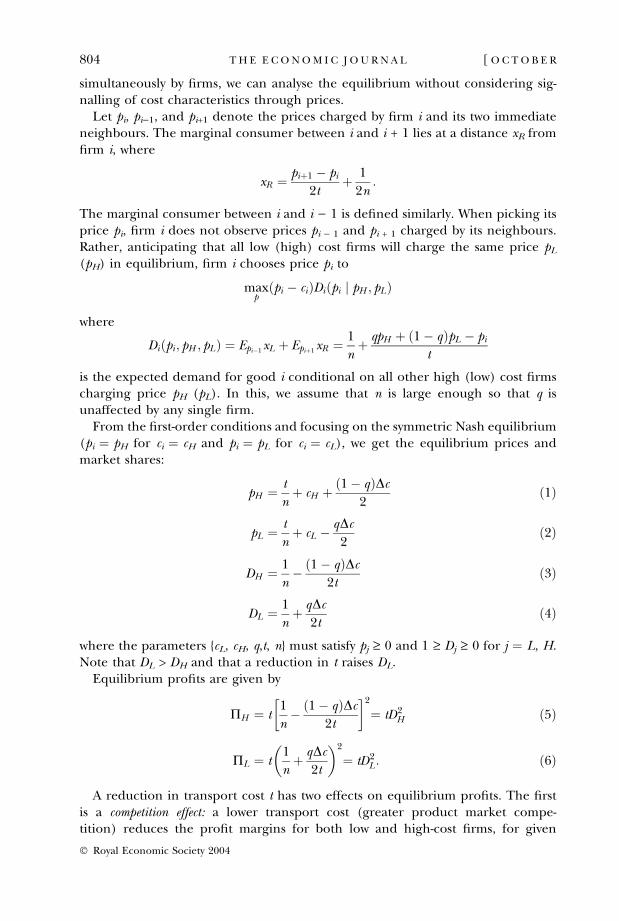
simultaneously by firms, we can analyse the equilibrium without considering sig-nalling of cost characteristics through prices.
Let pi, pi)1, and pi+1 denote the prices charged by firm i and its two immediateneighbours. The marginal consumer between i and i + 1 lies at a distance xR fromfirm i, where
xR ¼ piþ1 � pi2t
þ 1
2n:
The marginal consumer between i and i ) 1 is defined similarly. When picking itsprice pi, firm i does not observe prices pi ) 1 and pi + 1 charged by its neighbours.Rather, anticipating that all low (high) cost firms will charge the same price pL(pH) in equilibrium, firm i chooses price pi to
maxp
ðpi � ciÞDiðpi j pH ; pLÞ
where
Diðpi ; pH ; pLÞ ¼ Epi�1xL þ Epiþ1xR ¼ 1
nþ qpH þ ð1� qÞpL � pi
t
is the expected demand for good i conditional on all other high (low) cost firmscharging price pH (pL). In this, we assume that n is large enough so that q isunaffected by any single firm.
From the first-order conditions and focusing on the symmetric Nash equilibrium(pi ¼ pH for ci ¼ cH and pi ¼ pL for ci ¼ cL), we get the equilibrium prices andmarket shares:
pH ¼ t
nþ cH þ ð1� qÞDc
2ð1Þ
pL ¼ t
nþ cL � qDc
2ð2Þ
DH ¼ 1
n� ð1� qÞDc
2tð3Þ
DL ¼ 1
nþ qDc
2tð4Þ
where the parameters {cL, cH, q,t, n} must satisfy pj ‡ 0 and 1 ‡ Dj ‡ 0 for j ¼ L, H.Note that DL > DH and that a reduction in t raises DL.
Equilibrium profits are given by
PH ¼ t1
n� ð1� qÞDc
2t
� �2¼ tD2
H ð5Þ
PL ¼ t1
nþ qDc
2t
� �2
¼ tD2L : ð6Þ
A reduction in transport cost t has two effects on equilibrium profits. The firstis a competition effect: a lower transport cost (greater product market compe-tition) reduces the profit margins for both low and high-cost firms, for given
804 [ O C TO B E RTH E E CONOM I C J O U RN A L
� Royal Economic Society 2004

(equilibrium) market shares. The second is a selection effect: intensified productmarket competition increases the market share of low cost firms and reduces it forhigh-cost firms. Thus an intensification of product market competition unam-biguously reduces profits for high-cost firms, but the overall effect on low-costfirms depends on the relative strength of the competition and selection effects.For future reference, we note the effect of competition on total profits
in equilibrium. Total profits are given by P ” n[qPH + (1 ) q)PL] ¼t/n + nq(1 ) q)(Dc)2/4t. Thus
@P@t
¼ 1
n� nqð1� qÞðDcÞ2
4t2
@2P@t2
¼ nqð1� qÞðDcÞ2
2t3> 0:
Thus ¶P/¶t is negative for small t and positive for large t.We next study the welfare effects of reducing transport cost. Since total demand
is fixed in this model, maximising total surplus is equivalent to minimising the sumof production costs incurred by firms and transport costs incurred by consumers.When n is large, we can write this sum (see Appendix 1) as:
K ¼ n ð1� qÞDLcL þ qDH cH½ �|fflfflfflfflfflfflfflfflfflfflfflfflfflfflfflfflfflfflfflfflffl{zfflfflfflfflfflfflfflfflfflfflfflfflfflfflfflfflfflfflfflfflffl}total production cost
þ t
4nþ nqð1� qÞt
2
Dc2t
� �2" #|fflfflfflfflfflfflfflfflfflfflfflfflfflfflfflfflfflfflfflfflfflfflffl{zfflfflfflfflfflfflfflfflfflfflfflfflfflfflfflfflfflfflfflfflfflfflffl}
total transport cost
: ð7Þ
Reducing transport cost t has three basic effects on welfare:
(i) A direct cost reduction effect: a lower t reduces the expected transport costs,t/4n, incurred by consumers located between identical firms. This directeffect is smaller in markets with many firms, since the average distancetravelled is smaller.
(ii) A selection effect: a lower t increases the market share differential DL ) DH
between low and high-cost firms, which in turn reduces aggregate pro-duction costs in equilibrium.
(iii) A reallocation effect: a lower t increases the market share differentialDL ) DH, which in turn raises the average distance travelled by a consumerlocated between high- and low-cost firms, nq(1 ) q)/2(Dc/2t)2.6
Proposition 1 describes how these various effects add up in this circular modelwith linear transportation costs:
Proposition 1 Intensifying competition (reducing transport cost) raises aggregatewelfare, and the welfare gain is increasing in the degree of cost asymmetry.
6 The selection and reallocation effects work in opposite directions on welfare. With linear transportcosts, the selection effect dominates.
2004] 805COM P E T I T I O N - E NH AN C I N G P O L I C I E S
� Royal Economic Society 2004

Proof. From (7)
dK
dt¼ 1
4n|{z}direct cost reduction effect
þ 2nqð1� qÞ Dc2t
� �2
|fflfflfflfflfflfflfflfflfflfflfflfflfflffl{zfflfflfflfflfflfflfflfflfflfflfflfflfflffl}selection effect
� nqð1� qÞ2
Dc2t
� �2
> 0|fflfflfflfflfflfflfflfflfflfflfflfflfflfflfflfflffl{zfflfflfflfflfflfflfflfflfflfflfflfflfflfflfflfflffl}reallocation effect
which established the first claim. The second claim follows from the fact thatthe sum of the selection and reallocation effects is positive and increasing inDc. u
A reduction in t increases the asymmetry of market shares through the selectioneffect. This implies that an intensification of competition increases equilibriumconcentration in the economy when there is cost asymmetry. At the same time, areduction in t lowers the profit margin both for low and high-cost firms. However,since low-cost firms have a higher profit margin than high-cost firms and sincetheir market share increases with competition, the aggregate profit margin in theeconomy can rise when competition intensifies, if there is enough cost asymmetry.This is summarised in the following proposition.
Proposition 2 Let H0 ¼ nð1� qÞD2L þ nqD2
H denote the Herfindahl index of con-centration in the circle model. When there is cost asymmetry, an increase in competition (i)raises the equilibrium level of H0, (ii) reduces the profit margin of both low and high costfirms, but (iii) increases aggregate profit if H0 > 2/n.
Proof. See Appendix 1.
Proposition 1 and 2 together imply that concentration and welfare are positivelycorrelated when there is sufficient cost asymmetry (implying high H0) in theeconomy. This important idea dates back to early critiques of antitrust policy thatstressed the importance of cost asymmetries in perfect competition (Demsetz,1972). The same idea has reappeared in more recent analysis of the welfare effectsof horizontal mergers (Farrell and Shapiro, 1990).
2. Political Economy Traps
In this Section we show that the model generates an endogenous demand forcompetition enhancing or retarding policies and the possibility of a low-levelcompetition trap. We use a simple political economy model in which specialinterest groups can ‘capture’ politicians. The model, developed by Acemoglu et al.(2002), is a simplified version of the lobbying model of Grossman and Helpman(2001).
Suppose that the politician determines the extent to which the institutionalenvironment is competition-enhancing – e.g. the nature of competition or regu-latory policy. In the circular model this is summarised by the unit transport costparameter, t. Assume t 2 (tmin,tmax). The politician’s pay-off is proportional tosocial welfare W(t) if he behaves honestly by not taking bribes, say hW(t) where
806 [ O C TO B E RTH E E CONOM I C J O U RN A L
� Royal Economic Society 2004
h > 0. Otherwise, the pay-off is the bribe paid to adopt some other value of t. Theparameter h is an index of the degree to which social welfare concerns drive thepolitician’s decision. This will depend on the effectiveness of the underlyingchecks and balances in the political system.In the circular model, maximising W(t) is equivalent to minimising production
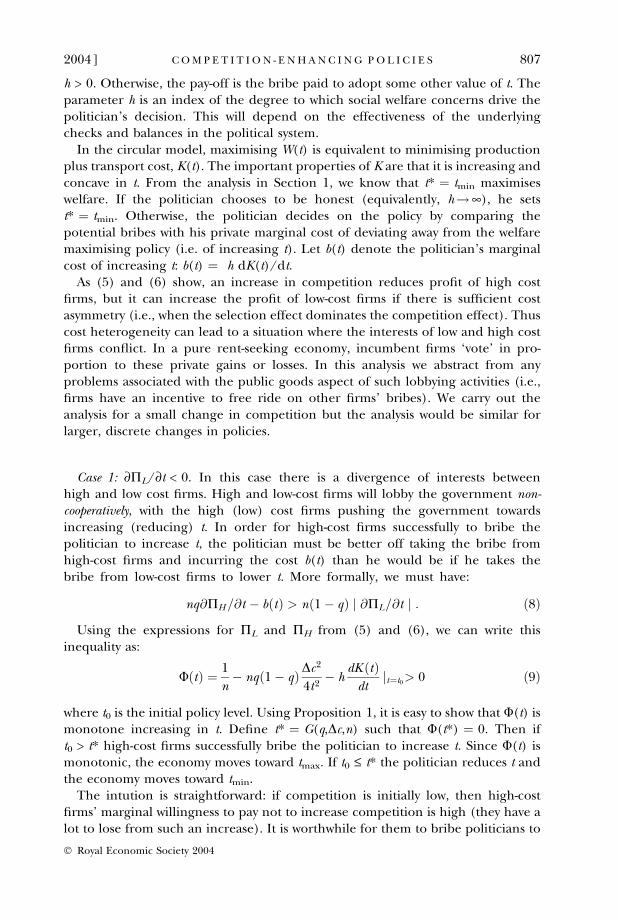
plus transport cost, K(t). The important properties of K are that it is increasing andconcave in t. From the analysis in Section 1, we know that t* ¼ tmin maximiseswelfare. If the politician chooses to be honest (equivalently, h!¥), he setst* ¼ tmin. Otherwise, the politician decides on the policy by comparing thepotential bribes with his private marginal cost of deviating away from the welfaremaximising policy (i.e. of increasing t). Let b(t) denote the politician’s marginalcost of increasing t: b(t) ¼ h dK(t)/dt.As (5) and (6) show, an increase in competition reduces profit of high cost
firms, but it can increase the profit of low-cost firms if there is sufficient costasymmetry (i.e., when the selection effect dominates the competition effect). Thuscost heterogeneity can lead to a situation where the interests of low and high costfirms conflict. In a pure rent-seeking economy, incumbent firms ‘vote’ in pro-portion to these private gains or losses. In this analysis we abstract from anyproblems associated with the public goods aspect of such lobbying activities (i.e.,firms have an incentive to free ride on other firms’ bribes). We carry out theanalysis for a small change in competition but the analysis would be similar forlarger, discrete changes in policies.
Case 1: ¶PL/¶t < 0. In this case there is a divergence of interests betweenhigh and low cost firms. High and low-cost firms will lobby the government non-cooperatively, with the high (low) cost firms pushing the government towardsincreasing (reducing) t. In order for high-cost firms successfully to bribe thepolitician to increase t, the politician must be better off taking the bribe fromhigh-cost firms and incurring the cost b(t) than he would be if he takes thebribe from low-cost firms to lower t. More formally, we must have:
nq@PH=@t � bðtÞ > nð1� qÞ j @PL=@t j : ð8Þ
Using the expressions for PL and PH from (5) and (6), we can write thisinequality as:
UðtÞ ¼ 1
n� nqð1� qÞDc
2
4t2� h
dK ðtÞdt
jt¼t0> 0 ð9Þ
where t0 is the initial policy level. Using Proposition 1, it is easy to show that U(t) ismonotone increasing in t. Define t* ¼ G(q,Dc,n) such that U(t*) ¼ 0. Then ift0 > t* high-cost firms successfully bribe the politician to increase t. Since U(t) ismonotonic, the economy moves toward tmax. If t0 £ t* the politician reduces t andthe economy moves toward tmin.The intution is straightforward: if competition is initially low, then high-cost
firms’ marginal willingness to pay not to increase competition is high (they have alot to lose from such an increase). It is worthwhile for them to bribe politicians to
2004] 807COM P E T I T I O N - E NH AN C I N G P O L I C I E S
� Royal Economic Society 2004

prevent a rise in competition. However, when competition is initially high, equi-librium profits are already low and firms will have a lower marginal willingness topay for preventing further increases in competition. In the former case, theeconomy will end up in a low-competition trap.
Two comparative statics of U(Æ) are of particular interest. First, U(Æ) decreaseswhen h increases. This means that the critical t* increases, making it more likelythat the initial policy level t0 will be less than t*. Hence a higher h makes it lesslikely that the economy ends up in a low-competition trap. When politicians aremore constrained to act to increase social welfare, traps are less likely. Second,U(Æ) decreases when Dc rises (noting that dK(t)/dt increases with Dc). Hencegreater asymmetry makes it less likely that the economy ends up in a low-competition trap.
To summarise, the economies that are most vulnerable to a low competition trapare those where the initial level of competition is low, the initial degree of costasymmetry is low, and politicians are less driven by social welfare concerns (i.e.,political institiutions do not effectively discipline their behaviour).
Case 2: ¶PL/¶t > 0. In this case there is no divergence of interests. Both highand low-cost firms will lobby the government cooperatively for it to increase t, andthey will succeed whenever their combined bribes are greater than the politician’sdisutility from moving in the opposite direction from the welfare maximisingpolicy. More formally, if:
nq@PH=@t þ nð1� qÞ@PL=@t > bðtÞ: ð10Þ
But then we immediately see that this condition, which itself boils down to
@P@t
> bðtÞ;
where P ¼ nqPH + n(1 ) q)PL denotes total profits in equilibrium, is identical to(9). Thus the conclusions are the same as in the previous case.
We summarise these results in the following proposition:
Proposition 3 If the initial level of competition is below the threshold level t* defined byU(t*) ¼ 0, and if ¶PL/¶t < 0 (the selection effect dominates the competition effect), thenhigh cost firms can successfully bribe the politician to raise t, and the economy converges totmax. If t0 < t*, the economy converges to t ¼ tmin and there are no bribes paid. If ¶PL/¶t > 0, the same results hold except that both high and low-cost firms bribe the politician. Alow-competition trap, in which the economy moves toward tmax, is most likely to occur whenthe initial level of competition t0 is low, cost asymmetry Dc is small, and the politicians attachless weight to social welfare (low h).
Thus, in the absence of a mechanism for side-payments, the economy mayconverge to a low competition trap. In earlier models of (physical) infrastructure, a‘low infrastructure’ trap can arise from non-convexities in the production tech-nology (Murphy et al., 1989). In our model, the ‘low competition’ trap arises from
808 [ O C TO B E RTH E E CONOM I C J O U RN A L
� Royal Economic Society 2004

the heterogeneity of firms. Of course, this political economy model is highlysimplified. A more complete framework should also incorporate the design ofinstitutions that determine how ‘voting’ takes place – e.g., whether there aremechanisms for workers, consumers and potential entrants to ‘vote.’
3. Competition and Cost Reduction
3.1. Nash Effort Levels
In this Section we allow incumbent firms to make investments to reduce theirproduction costs.7 Suppose that firm i can reduce its unit cost from c0i toci ¼ c0i � e by incurring a quadratic effort cost be2. Thereafter, firms compete onthe circle as in the basic model. We solve for a symmetric perfect equilibriumwhere all firms with initial cost parameter c0i 2 fc0H ; c0Lg first choose the same costreducing effort ei 2 {eH,eL} and then set the same price pi 2 {pH,pL}.Proceeding by backward induction, we first solve for equilibrium prices, given eH
and eL. Given these prices, a type-i firm chooses effort ei to solve:
maxe
ðmaxpi
½pi � ciðeÞ�f½qpH þ ð1� qÞpL �=t þ 1=ng � be2Þ: ð11Þ
The Nash equilibrium effort levels for high- and low-cost firms are (see Appen-dix 1):
eH ¼ 1
2bn� ð1� qÞDc0
4bt � 1ð12Þ
eL ¼ 1
2bnþ qDc0
4bt � 1: ð13Þ
where 4bt > 1 by second order conditions. From these expressions we get:
Proposition 4 Low-cost firms have stronger incentives to reduce costs: eL > eH.Moreover, an increase in competition (reducing t) promotes cost reduction by low-cost firmsand discourages it for high-cost firms, thereby magnifying the initial cost asymmetry:¶eL/¶t < 0, ¶eH/¶t > 0.
Incentives to reduce costs differ for low and high cost firms. Since the payoff tocost-reducing effort is proportional to market share, the initial cost difference ismagnified by such ‘restructuring’ activity. Knowing that they will capture a lowershare of the market, high-cost firms have less incentive to invest in cost reduction.The incentives of low-cost firms to reduce costs are increasing in: (a) the pro-portion of high-cost firms q (the higher q, the bigger the additional increase in lowcost firms’ market share from reducing costs), and (b) the initial degree of costasymmetry Dc0 (the higher Dc0, the more will high-cost firms be deterred frominvesting in cost reduction and thus the higher the marginal return to such effort
7 Such ‘restructuring’ covers any expenditure of money or effort to increase productivity, includinginnovation and organisational or management change.
2004] 809COM P E T I T I O N - E NH AN C I N G P O L I C I E S
� Royal Economic Society 2004

by low-cost firms). The incentives are inversely related to the number of firms,since more firms implies greater competition and thus a lower rent from furtherreducing costs.8
It is well known that firms have a strategic incentive to overinvest in costreduction for rent transfer reasons (they may also underinvest because they cannotappropriate the full social surplus). This incentive is stronger when the market ismore competitive, so that if the initial level of cost reduction is socially excessive,making the economy more competitive can exacerbate this and reduce socialwelfare as a result (for more discussion, see the simulations in Section 6). InAppendix 1 we show that ¶ei/¶t < 0, if p* is held constant and p*> c0i . However, adecline in t also reduces p* in equilibrium, which in turn reduces the marginalgain from cost reduction. It turns out that when costs are linearly decreasing ineffort, as we have assumed in this Section, the two effects exactly offset each otherin the symmetric case, so that the equilibrium effort is independent of t. However,this is no longer true if costs are initially asymmetric, as Proposition 4 shows.
Remark 1. In this model, cost-reducing activity reinforces the selection effectbecause it magnifies cost asymmetry. In this sense, competition-enhancing policiesand cost-reducing activity are complements. Formally, denoting average productioncost by KP ¼ qDHcH + (1 ) q)DLcL, we have:
dKP
dt¼ qð1� qÞ Dc
t
� �2
|fflfflfflfflfflfflfflfflfflfflfflffl{zfflfflfflfflfflfflfflfflfflfflfflffl}selection effect
� qð1� qÞDc0ðDL � DH Þd
dt
1
2bt � 1
� �|fflfflfflfflfflfflfflfflfflfflfflfflfflfflfflfflfflfflfflfflfflfflfflfflfflfflfflfflfflfflfflfflffl{zfflfflfflfflfflfflfflfflfflfflfflfflfflfflfflfflfflfflfflfflfflfflfflfflfflfflfflfflfflfflfflfflffl}
cost-reduction effect
> qð1� qÞ Dc0
t
� �2
:
ð14Þ
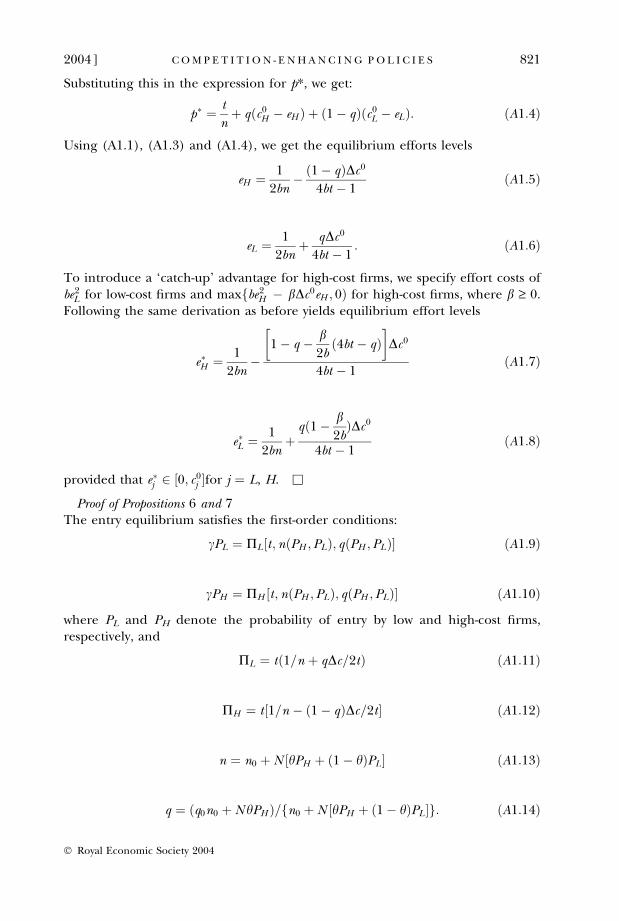
Remark 2. Cost Reduction With Catch-Up Advantage. In practice it may be easier forhigh-cost firms to reduce costs, since they are likely to have more ‘slack’. If there issuch a ‘catch-up’ advantage for high-cost firms, we now show that the perfectequilibrium can involve high-cost firms doing more cost reduction than low-costfirms, reversing the market share effect described in Proposition 3.
To illustrate this point, let effort costs for a high-cost firm vary inversely with theinitial degree of cost asymmetry: CðeH Þ ¼ maxfbe2H � bDc0eH ; 0g, b > 0,withmarginal cost equal to max{2beH ) bDc0, 0}. It is straightforward to derive the fol-lowing equilibrium effort levels:
8 It may be surprising that intensified competition discourages cost-reducing effort by high cost firms,since the cost of not doing so is higher for such firms (a given cost difference implies a larger differencein market shares). However, the quadratic cost functions are sufficiently convex that a lower t willdiscourage a high cost firm from competing more effectively with low-cost firms by making such effort.Greater cost-reducing effort by high-cost firms could easily be generated in variants of this model byreducing the convexity of effort costs or introducing some other costs associated with low market shares,such as bankruptcy costs or a non-monetary private benefit (say, managerial reputation) that increaseswith a firm’s market share.
810 [ O C TO B E RTH E E CONOM I C J O U RN A L
� Royal Economic Society 2004

e�H ¼ 1
2bn�f1� q � b
2bð4bt � qÞgDc0
4bt � 1ð15Þ
e�L ¼ 1
2bnþqð1� b
2bÞDc0
4bt � 1ð16Þ
provided that e�j 2 ½0; c0j �for j ¼ L,H. Since 4bt > 1 ‡ q, it follows that eH* > eH andeL* < eL. That is, high (low) cost firms do more (less) cost reduction than in thecase where there is no catch-up advantage. Also, the relative effort levels of highand low cost firms depend on the size of the catch-up parameter, b. SinceeH* ) eL* ¼ (2bt)1)Dc0/4bt ) 1, if b > 1/2t the high-cost firm does more costreduction, reducing the initial cost asymmetry. It is easy to verify that an increase incompetition raises eH* ) eL*, provided effort costs are not too convex.
3.2. Second-Best Benchmark
We now turn to a welfare analysis of cost reduction. We introduce a second-bestbenchmark generated under the assumption that the government controls the levelof cost reducing activity, but not prices. We think this is an appropriate benchmarkin practice, because it is much easier for the government to affect the cost ofrestructuring by firms (e.g., by setting severance rules and other labour marketregulations) than to control product market prices. In addition, it facilitatescomparison between Nash and second-best effort levels, holding pricing behaviourconstant. The question is, should the social planner set effort levels for low andhigh-cost firms so as to reduce or increase cost asymmetry?The government minimises the sum of production, transport and restructuring
costs, subject to Nash prices being set by firms in the second stage:
mineH ;eL
S ¼ n ð1� qÞcLDL þ qcHDH½ � þ t
4nþ nqð1� qÞt
2
Dc2t
� �2
þ nb qe2H þ ð1� qÞe2L� �
where ci ¼ c0i � ei . Substituting for the equilibrium markets demands (DL,DH),and taking first-order conditions,9 we get the second-best effort levels:
e��L ¼ 1
2bnþ 3qDc0
8bt � 3ð17Þ
e��H ¼ 1
2bn� 3ð1� qÞDc0
8bt � 3: ð18Þ
Comparing these solutions with the Nash outcomes derived earlier, we see thateL** > eL and eH** < eH. Also note that eL* (eH*) is declining (rising) in t.
9 Second-order conditions require 8bt > 3max(q, 1 ) q) for all q 2 [0,1], that is: 8bt > 3.
2004] 811COM P E T I T I O N - E NH AN C I N G P O L I C I E S
� Royal Economic Society 2004

The following proposition summarises these results.
Proposition 5 With linear transport costs, the second-best solution is characterised by:
(i) low-cost firms engaging in more cost-reducing effort than high-cost firms,eL** > eH**,
(ii) low (high) cost firms investing more (less) in cost reduction than in the Nashequilibrium, eL** > eL and eH** < eH, and
(iii) an increase in competition (lower t) raising cost-reducing effort by low-cost firms anddecreasing it for high cost firms: ¶eH**/¶t > 0, ¶eL**/¶t < 0.
The result that low-cost firms should engage in more cost reduction than highcost firms, may appear somewhat surprising. There are two countervailing effectsat work. The first is a market share effect, which makes the social (as well asprivate) payoff to cost reduction by low-cost (high market share) firms largerthan for high-cost firms. This induces a social planner to increase the level ofcost reduction by low-cost firms, raising the asymmetry in market shares. How-ever, the second effect is that social welfare (but not firms’ profits) decreaseswith aggregate transport costs, and these are lowered by reducing cost asym-metry. This effect induces a social planner to favour cost reduction by high-costfirms but the strength of this effect will be mitigated by the convexity of effortcosts.
In the model with linear transport and quadratic effort costs, the marketshare effect dominates, so eH** < eH and eL** > eL. However, if transport costswere sufficiently convex, it can be efficient in this model to reduce cost asym-metry in order to save on the aggregate transportation (or ‘reallocation’) costsborne by consumers. Using a Dixit-Stiglitz specification in Appendix 2,we illustrate a case in which the social planner chooses to reduce cost asym-metry. This arises from the fact that reducing cost asymmetry in a Dixit-Stiglitzcontext results in market expansion and therefore in increased aggregate con-sumption.
The key conclusion from this analysis is that one cannot say, on a priorigrounds, whether the market generates too much or too little investment in costreduction by high and low-cost firms, or whether efficient cost-reduction shouldreduce or raise cost asymmetry.10 This negative conclusion implies that oneneeds to be careful before undertaking any policy to affect the degree of costasymmetry (e.g., targetting production cost or restructuring subsidies towardparticular types of firms). It is also worth reiterating that, if the market doesgenerate socially excessive cost reduction because of strong rent transfer effects,an increase in competition can in principle exacerbate this problem. The samepoint applies to the effects of competition on entry, which we discuss in the nextSection.
10 The same conclusion would also hold if we used the first-best benchmark in which the governmentcan directly set prices. The reason is that the social planner faces a similar trade-off between the marketshare effect and the social cost of increasing equilibrium transport costs.
812 [ O C TO B E RTH E E CONOM I C J O U RN A L
� Royal Economic Society 2004

4. Competition and Entry
Does an increase in product market competition encourage or deter the entry ofnew firms? The classical circular model without cost asymmetry provides anunambiguous answer to this question: lower transport costs intensify ex post com-petition, thereby reducing post-entry rents and thus discouraging entry (Dasguptaand Stiglitz, 1980). The same result holds in Schumpeterian models of innovationwith symmetric costs, where greater product market competition discourages R&Dby reducing the rewards to successful innovation (Aghion and Howitt, 1992). Inthis Section we show that the effects of competition on entry are less clear-cut, andpossibly reversed, when cost asymmetry and selection considerations are taken intoaccount.We model entry as an the outcome of an ‘innovation process’: by investing effort
cost EðPiÞ ¼ cP 2i ,a potential entrant succeeds in entering the market with prob-
ability Pi. This can be interpreted as the probability of an R&D success that allowsthe firm to enter the market.11 For simplicity, we assume that the number ofpotential entrants is sufficiently large that strategic considerations can be ignoredwhen analysing entry decisions. Before entry takes place, there are n incumbentfirms in the product market, a fraction q of which are high cost. There are Npotential entrants, a fraction h of which are high cost. The parameters h and q maydiffer. We assume that the entrant cannot target in advance who her futureneighbours will be, and after entry all firms can adjust their locations on the circleso as to preserve maximum differentiation before competing in prices.12
Before analysing equilibrium entry, we need to explain why any high-cost firmswould enter in this model. With sufficiently low product market competition, high-cost entrants can cover their entry costs, so they would be willing to enter if theycould secure the necessary financing. But in order for banks to be willing tofinance high-cost entrants, we need the assumption that banks have an exogenousopportunity cost of capital, in particular one that is not determined by existing low-cost potential entrants. One way to get this is to assume a finite number of low-costpotential entrants an any point in time.Each potential entrant chooses its entry effort Pi so as to:
max PiPi � cP 2i
where Pi denotes the post-entry profit flow of an entrant with unit cost ci, i 2 {H,L}.This profit flow depends both on the number and type of firms that enter. Thepost-entry proportion of high-cost firms is:
11 Of course, the parameter c is likely to differ across industries and countries, reflecting the cost ofentry-related investments.
12 Two points should be noted. First, we do not analyse strategic entry deterrence in this model withasymmetic costs. But deterence becomes less likely when unit transport cost falls, since commitmentbecomes more of an issue (lower t increases the penalty of not relocating).
Second, we have also analysed a model in which the potential entrant chooses his entry location. Inthat case the entrant choose a location between two high-cost incumbents in order to soften pricecompetition. In that model we obtain the same qualitative results – i.e., the selection effect operatesboth on the composition of entrants and in the post-entry price competition.
2004] 813COM P E T I T I O N - E NH AN C I N G P O L I C I E S
� Royal Economic Society 2004

q 0 ¼ nq þ hNPH
n þ kð19Þ
where k ¼ [hPH + (1 ) h)PL]N is the expected number of entrants. Post-entryprofits for a low-cost entrant are equal to:
PL ¼ t1
n0 þ q 0Dc2t
� �2
ð20Þ
and for a high-cost entrant:
PH ¼ t1
n0 � ð1� q 0ÞDc2t
� �2ð21Þ
where n¢ ¼ n + k is the post-entry number of firms in the market. The profit-maximising entry probability for a firm of type i ¼ (L, H) is:
Pi ¼ Pi=c: ð22Þ
We define an entry equilibrium as a pair of probabilities {PH, PL} that satisfies (15)– (18). This system of equations determines PL and PH as functions of the primi-tives {n, q, Dc, t, h, N}.
Proposition 6 summarises the comparative statics of entry:
Proposition 6 In the entry equilibrium, a sufficient condition for dPL/¶t < 0 anddPH/¶t > 0 is ¶PL/¶t £ 0. This condition is equivalent to: (i ) H0 > 1/nq where H0 is theHerfindahl index (equivalently, nc/2t > 1/nq).
Proof. See Appendix 1.
Recall from Section 1 that PL ¼ tD2L . The condition ¶PL/¶t £ 0 holds when the
selection effect of a decline in t dominates the competition effect. Proposition 6shows that a reduction in transport costs encourages entry by low-cost firms, providedthere is sufficient cost asymmetry (equivalently, when concentration is sufficientlyhigh). This finding goes counter to the traditional ‘Schumpeterian effect’ ofproduct market competition that operates when costs are symmetric. However, forhigh cost firms, the selection and competition effects reinforce each other indiscouraging entry.13
On the other hand, we can show that the competition effect dominates whenthe cost asymmetry is sufficiently small or unit transport cost is sufficiently high.That is:
13 One referee pointed out that an alternative specification is to assume that there is an infinity ofpossible entrants. If banks view the return to financing a low-cost entrant as the relevant opportunitycost, then only low-cost firms would enter. This is similar to our specification where h fi 0 and n fi ¥:the result is that the ex ante selection effect of a reduction in t on the composition of entry disappearsbut the ex post selection effect of entry on incumbent firms is strengthened (since any entry lowersaverage cost in that case).
814 [ O C TO B E RTH E E CONOM I C J O U RN A L
� Royal Economic Society 2004

Proposition 7 As Dc/t fi 0, ¶PL/¶t > 0.
Proof. See Appendix 1.
Thus, when Dc/t is small, a decline in t reduces monopoly rents for all firms onthe circle, and thus discourages entry by both high and low-cost firms. This is thetraditional result that ex post competition drives out ex ante entry.
5. Simulating Welfare Effects
In this Section we simulate the model to do two things. First, we illustrate howsubsidising ‘transport cost’ raises welfare and compare these welfare gains to thoseobtained by alternative policies of subsidising cost reduction effort by firms andentry of new firms. Second, we identify the relative magnitude of the indirectwelfare effects from increasing competition – induced market selection, costreduction, and entry – since ‘traditional’ cost-benefit analysis is not likely to cap-ture them in practice. The simulations involve computing the welfare effects of(1%) changes in the parameters (t, b, c), respectively. We can also compute theassociated cost of each subsidy.14 This allows us to compute the marginal socialrate of return to each subsidy. In doing this, we treat the transport cost subsidyliterally as a subsidy for dt. More generally, of course, the cost of increasingcompetition would depend on the specific policies adopted to lower t.The model consists of (1)–(4), (7), (9), (10) and (16)–(19).15 The welfare
effects of each policy change depend on the parameters of the model,{Dc, t, q, h, b, c, n, N}. We calibrate the parameters so that the equilibrium out-comes – the Herfindahl index of concentration, the average profit margin, entryrates, and the degree of cost reduction (labour productivity growth) – are con-sistent with the available microeconomic evidence. We briefly summarise theavailable evidence below:
Herfindahl index: The typical value of the H-index, averaged across industries, isabout 10%. Examples of estimates for industrialising countries include 9.2% forColumbia and 7.9% for Mexico (Roberts and Tybout, 1996), and 5.3% for Russia(24.3% at the regional level; Brown and Earle, 2001). Average values at the 3-digitindustry level are similar for the US (US Census of Manufacturers, 2001).
Price-Cost margin: The price-variable cost margin, averaged across industries, forColumbia, Chile, Mexico and Morocco ranges from about 20 to 35% (Roberts andTybout, 1996). Estimates for OECD countries are broadly similar (Martins et al.,1996).
14 These costs are n qe2H þ ð1� qÞe2L� �
db for the subsidy to cost reduction, N hP 2H þ ð1� hÞP 2
L
� �dc for
the entry subsidy, and fð 14n
þ nqð1 � qÞ2
ðDc2tÞ2gdt for the subsidy to transport cost (increasing product
market competition). The endogenous variables n, q, PH, PL and Dc refer to the equilibrium (post-subsidy) values in the model.
15 The simulations incorporate the relevant boundary conditions on equilibrium prices, marketshares and cost-reducing effort levels.
2004] 815COM P E T I T I O N - E NH AN C I N G P O L I C I E S
� Royal Economic Society 2004

Entry rates: Average annual entry rates in manufacturing (at plant level) aretypically about 10%. Examples include 7.5% for the US (Dunne et al., 1988), 7%for the UK (Geroski, 1991) and about 6% in Canada (Baldwin and Gorecki, 1991).Available estimates for developing countries include 12% in Columbia, 6% inChile, and 13% in Morocco (Roberts and Tybout, 1996).
Cost reduction: The mean growth rate of labour productivity during the period1996-2000 in seven of the more advanced transition economies varied from 5.7 to10.6%, with an unweighted average of 7.7% (computed from Table A.3.8, EBRD,2001). The mean productivity growth during 1992–7 in seven OECD countriesvaried from 3.0 in the US to 5.2 in Finland, with a simple average of 4.0%(Nicoletti and Scarpetta, 2003).
We use the following baseline parameter values: Dc ¼ 0.25, q ¼ 0.75, h ¼ 0.5,b ¼ 0.5, c ¼ 0.35, n ¼ 10 and N ¼ 10 (we normalise cL ¼ 1). The proportion ofhigh cost potential entrants (h) is set lower than for incumbents (q), as isespecially likely in industrialising countries. We examine three competitionregimes: high competition (t ¼ 2), moderate competition (t ¼ 5) and lowcompetition (t ¼ 10). For the high competition scenario, these parametersgenerate an H index of 11%, an average price-cost margin of 22%, an aggregateentry rate of 7.9% and average cost reduction of 10%. For the moderate-com-petition case, the parameters imply an H index of 10%, a price-cost margin of50%, entry rate of 13.0% and average cost reduction of 10% (while the averageis the same, the mix between high and low-cost firms is different from the highcompetition case). These implications broadly conform to the observed evidencecited above.
Panel (a) in Table 1 presents the marginal social rates of return from each typeof subsidy, evaluated at different initial values of t and Dc. In each simulation, allselection, cost reduction and entry effects are taken into account. Turning firstto the transport subsidy (column 1), there are large social welfare gains fromreducing t. As an example, for Dc ¼ 0.10 and t ¼ 2, the marginal social return is144% – i.e., spending an extra $1 on transport cost subsidies increases the sum ofconsumer surplus and profit by $2.44.16 As expected, we find that the welfare gainsare much larger when the initial t is low and Dc is high, since that is when selectioneffects are stronger.
Second, we find large, positive returns to subdising cost reduction effort (col-umn 2). As we showed in Proposition 5, both the level and mix of cost reductionby high and low-cost firms differ from the (second best) welfare maximising levels.In addition to the wrong mix, it is theoretically possible for the laissez-fairerestructuring effort by either type of firm, or in aggregate, to be ‘too high’ due to‘rent transfer’ effects (rather than too low due to incomplete appropriation of thesocial surplus). The positive rates of return indicate that this does not occur, atleast for the range of parameter values examined.
16 This is even more striking since, for the range of parameter values examined, the reduction in tactually lowers aggregate profit (this is so because H < 1/2n; see Proposition 2).
816 [ O C TO B E RTH E E CONOM I C J O U RN A L
� Royal Economic Society 2004

In sharp contrast, the rates of return to the entry subsidy are negative. There aretwo countervailing forces at work. The greater entry improves the ex post mix offirms via the selection effect (since low cost firms are more likely to enter than highcost ones). This effect is stronger when Dc is larger. However, as with cost reduc-tion effort, the level of entry can be higher than the socially efficient level if therent transfer effect is strong. For the parameter values examined, the rent transfereffect is strong enough to make the pre-entry level of entry socially excessive andthe subsidy only exacerbates it.17 This negative return is smaller when Dc is highersince that is when the selection effect of entry is stronger. We found that the entrysubsidy can generate welfare gains for parameter values outside the range reported
Table 1
Simulated Welfare Effects
(a) Marginal Social Rates of Return to Subsidy Policies (in %)
Transport subsidy (dt < 0) Cost reduction subsidy (db < 0) Entry subsidy (dc < 0)
ParametersDc ¼ 0.10t ¼ 2 144 87 )65t ¼ 5 165 78 )50t ¼ 10 191 66 )35
Dc ¼ 0.25t ¼ 2 173 83 )35t ¼ 5 168 74 )40t ¼ 10 191 64 )31
Dc ¼ 0.50t ¼ 2 218 80 )8t ¼ 5 177 68 )21t ¼ 10 192 60 )22
(b) Sources of Welfare Gains from Increasing Competition (in %)
Direct effect as % ofwelfare gain (no selection, cost
reduction or entry)Direct + selection effects as % of
welfare gain (no cost reduction or entry)
ParametersDc ¼ 0.10t ¼ 2 66 81t ¼ 5 60 62t ¼ 10 52 53
Dc ¼ 0.25t ¼ 2 43 107t ¼ 5 57 65t ¼ 10 52 54
Dc ¼ 0.50t ¼ 2 18 140t ¼ 5 48 77t ¼ 10 50 57
17 Recall that total demand is fixed in the circular model, so that there is no welfare gain from marketexpansion.
2004] 817COM P E T I T I O N - E NH AN C I N G P O L I C I E S
� Royal Economic Society 2004

in the Table (e.g., when the initial cost differential is very large, Dc ¼ 1). Thesesimulations illustrate that in practice, as well as in theory, the cost-reduction andentry subsidies can either raise or lower welfare, since the level and mix of costreduction and entry in the model can be either higher or lower than the sociallyefficient level.
In addition to the three subsidies analysed above, one might consider a directsubsidy to production cost. If the same per unit subsidy is applied to low andhigh cost firms, the degree of cost asymmetry is unchanged. Since the levels ofdemand, restructuring and entry all depend on the degree of cost asymmetry –see (4), (5), (12), (13), (20) and (21) – the production cost subsidy induces noselection or other indirect effects. In the absence of such externalities, themarginal, net social return to this subsidy is always zero. Of course, this wouldnot be the case if a different production cost subsidy were imposed on low andhigh cost firm but, as we emphasised in Section 3.2, the theory offers nogeneral guidance as whether or not a differential subsidy is actually sociallyefficient.
In Panel (b) we illustrate how well ‘traditional’ cost-benefit analysis (CBA)might be expected to capture the welfare effects of a policy to increase com-petition (dt < 0). The first column includes only the direct welfare effect of areduction in t, without accounting for the selection, induced cost reduction, orentry effects. This would be the case if current market shares and cost levelswere used to conduct the cost-benefit analysis. The first finding is that CBAsubstantially understates the welfare gains from competition-enhancing policies,even when the initial level of t is high (i.e, selection effects are weaker). Forexample, with a 25% cost differential and moderate competition (t ¼ 5), thedirect welfare effect of a reduction in t accounts for only 57% of the totaleffect.
The second column in Panel (b) includes the selection effect of a reduction in t,but excludes the induced changes in cost reduction and entry. As expected, theselection effect (given by the difference between columns 2 and 1) is larger whenthe initial Dc is higher or t is lower. The important finding is that ignoring theeffects of competition on cost reduction effort and entry can also lead to a largeerror, especially when the initial level of competition is moderate or low. Forexample, when Dc ¼ 0.25 and t ¼ 5, the direct and selection effects only accountfor about 65% of the total welfare gain of reducing t ) the rest being due to theinduced changes in cost reduction and entry. The entries in column 2 that arelarger than 100% reflect the fact that, because the initial level of entry (or costreduction) can be socially excessive, the induced changes from a reduction in t canactually lower welfare.
6. Concluding Remarks
This paper develops a simple framework for analysing the welfare effects of policiesand infrastructure that intensify product market competition. We showed thatsuch policies increase productivity by:
818 [ O C TO B E RTH E E CONOM I C J O U RN A L
� Royal Economic Society 2004

(i) reducing the market share of less efficient firms (the market selection effect);(ii) increasing the incentive of firms – particularly low-cost firms – to reduce
costs (the restructuring effect);(iii) stimulating entry by new low-cost firms (the entry effect).
The magnitude of these effects depends on the characteristics (‘initial condi-tions’) of the economy. We use simulations to illustrate that these effects can belarge, and that they are not likely to be captured by ‘traditional’ cost-benefitanalysis.There are several directions in which to extend the research in this paper.
The first is to extend the welfare analysis to the context of a full-fledgedendogenous growth model where new entry corresponds to productivity-increasing innovations. This would allow us to study the effects of growth on theprivate and social incentives for competition-increasing policies and provide aframework to study the interplay between vested interests and growth in apolitical economy context. The second, related extension is to develop a richerpolitical economy framework which incorporates workers who vote, a labourmarket that potentially delinks their vested interests from those of individualfirms, and a mechanism for potential entrants to influence policy choices. Onthe empirical side, there is a need for more micro-level work research to test theimplications of competition-enhancing policies and infrastructure predicted bythe model.
Appendix 1
Expected Transport Costs: To derive expected total transport cost in equilibrium, weconsider two neighbouring firms at random and calculate the transport costincurred by consumers on the market segment between them. With probabilityPhh ¼ q(nq ) 1)/(n ) 1), both firms have high costs and share the market segmentequally. Consumers incur total transport costs on the segment equal to
KaT ¼ t
Z 12n
0xdx þ
Z 1n
12n
1
n� x
� �dx
" #¼ t
4n2: ð23Þ
With probability Pll ¼ (1 ) q)[n(1 ) q) ) 1]/(n ) 1) both firms have low costsand share the market segment equally, with transport costs equal to: Kb
T ¼ t=4n2t:With probability Phl ¼ 2q(1 ) q)n/(n ) 1), one firm is high cost and the other islow cost, with consumers transport costs equal to
K cT ¼ t
Z x
0xdx þ
Z 1n
x
1
n� x
� �dx
" #;
where x satisfies the indifference condition: pH + tx ¼ pL + t(1 ) x). Using theequilibrium values of pH and pL, we get x ¼ 1/2n ) Dc/4t. Thus
KcT ¼ t
4n2þ t
Dc4t
� �2
:
2004] 819COM P E T I T I O N - E NH AN C I N G P O L I C I E S
� Royal Economic Society 2004

Using these expressions, we can write total expected transport costsKT ¼ nðPhhK
aT þ PllK
bT þ PhlK
cT Þ as:
KT ¼ t
4nþ n2qð1� qÞt
2ðn � 1ÞDc2t
� �2
:
For large n, this simplifies to the second set of terms in (7). u
Proof of Proposition 2The Herfindahl index is H0 ¼ n qD2
H þ ð1 � qÞD2L
� �where Dj denotes the market
share of firm j. From the equilibrium market shares DH ¼ 1/n ) (1 ) q)Dc/2t andDL ¼ 1/n + qDc/2t, we get
H0 ¼n2qð1� qÞ Dc
2t
� �2
þ1
n: ð24Þ
Thus ¶H0/¶t < 0, which proves part (i) of the proposition. Let mj ¼ (pj ) cj)/cjdenote the profit margin for firm of type j. Using the expressions for theequilibrium prices pH and pL, (1) and (2) in the text, we get ¶mj/¶t > 0, whichproves part (ii). Now use the fact that Pj ¼ tD2
j to write the aggregate profitmargin as
M ¼ n qPH þ ð1� qÞPl½ � ¼ tH0:
From the expression for H0, ¶M/¶t ¼ 1/n ) nq(1 ) q)(Dc/2t)2. Thus ¶M/¶t < 0 ifand only if: (Dc/2t)2 > 1/n2q(1 ) q). This condition is equivalent to H0 > 2/n,which proves part (iii). u
Proof of Proposition 4We derive the perfect equilibrium where each firm with initial cost parameterc0i 2 fc0H ; c0Lg sets effort level ei 2 {eH,eL} in the first stage, and Nash equilibriumprices pi 2 {pH,pL} are determined in the second stage. For given pis, the Nashefforts are determined by
ei ¼ argmaxe
fmaxpi
½pi � ciðeÞ�½ðp� � piÞ=t þ 1=n� � be2g
where i 2 {H, L}, ciðeÞ ¼ c0i � e; and p* ¼ qpH +(1) q)pL. Equilibrium prices aregiven by
pi ¼1
2
t
nþ p� þ c0i � ei
� ðA1:1Þ
so first stage profits are
Pi ¼ p� þ t
n� c0i þ ei
� 2
=4t � be2i : ðA1:2Þ
Optimal effort for firm i is
ei ¼ p� þ t
n� c0i
� =ð4bt � 1Þ: ðA1:3Þ
820 [ O C TO B E RTH E E CONOM I C J O U RN A L
� Royal Economic Society 2004
Substituting this in the expression for p*, we get:
p� ¼ t
nþ qðc0H � eH Þ þ ð1� qÞðc0L � eLÞ: ðA1:4Þ
Using (A1.1), (A1.3) and (A1.4), we get the equilibrium efforts levels
eH ¼ 1
2bn� ð1� qÞDc0
4bt � 1ðA1:5Þ
eL ¼ 1
2bnþ qDc0
4bt � 1: ðA1:6Þ
To introduce a ‘catch-up’ advantage for high-cost firms, we specify effort costs ofbe2L for low-cost firms and maxfbe2H � bDc0eH ; 0Þ for high-cost firms, where b ‡ 0.Following the same derivation as before yields equilibrium effort levels
e�H ¼ 1
2bn�
1� q � b2b
ð4bt � qÞ� �
Dc0
4bt � 1ðA1:7Þ
e�L ¼ 1
2bnþqð1� b
2bÞDc0
4bt � 1ðA1:8Þ
provided that e�j 2 ½0; c0j �for j ¼ L, H. u
Proof of Propositions 6 and 7The entry equilibrium satisfies the first-order conditions:
cPL ¼ PL t;nðPH ;PLÞ; qðPH ;PLÞ½ � ðA1:9Þ
cPH ¼ PH t;nðPH ;PLÞ; qðPH ;PLÞ½ � ðA1:10Þ
where PL and PH denote the probability of entry by low and high-cost firms,respectively, and
PL ¼ tð1=n þ qDc=2tÞ ðA1:11Þ
PH ¼ t½1=n � ð1� qÞDc=2t� ðA1:12Þ
n ¼ n0 þ N hPH þ ð1� hÞPL½ � ðA1:13Þ
q ¼ ðq0n0 þ N hPH Þ= n0 þ N hPH þ ð1� hÞPL½ �f g: ðA1:14Þ
2004] 821COM P E T I T I O N - E NH AN C I N G P O L I C I E S
� Royal Economic Society 2004

Totally differentiating (A1.9) and (A1.10), we get:
A11 A12
A21 A22
� �dPL
dPH
� �¼ PL;t dt
PH ;t dt
� �where
A11 ¼ 2c�PL;n nL �PL;qqL
A22 ¼ 2c�PH ;n nH �PH ;qqH
A21 ¼ �ðPH ;n nL þPH ;qqLÞA21 ¼ �ðPL;n nH þPL;qqH Þ:
In these terms, the subscripts n and q refer to the derivatives of P with respect tothose variables, and the subscripts L and H in q and n refer to the derivatives of qand n with respect to PL and PH. Using (A1.11)–(A1.14) to evaluate these deriva-tives, we get:
A11 ¼ cþ tN ð1� hÞD2L=n > 0
A22 ¼ cþ tN hDLDH=n > 0
A21 ¼ tN ð1� hÞDLDH=n > 0
A12 ¼ tN hDLDH=n > 0:
It is easy to verify that det A > 0. We obtain:
dPL
dt¼ A22PL;t � A12PH ;t
det AðA1:15Þ
dPH
dt¼ A11PH ;t � A21PL;t
det AðA1:16Þ
We know that PH,t > 0. Therefore, if PL,t < 0, we have dPL/dt < 0 and dPH/dt > 0.This establishes the first part of Proposition 6. From (A1.11), PL,t < 0 if and only ifDc/2t > 1/qn. Using the expression for the Herfindahl index, H0 ¼1/n + nq(1 ) q)(Dc/2t)2, this condition is equivalent to H0 > 1/qn. This proves thesecond part of the proposition.
To prove Proposition 7, observe that Dc/t fi 0 implies that PL,t ¼ PH,t ¼1/n21, A22 ¼ 2c + 2tNh/n2 and A12 ¼ 2tNh/n2. It follows directly thatdPL/dt > 0. u
Harvard University and CEPRLondon School of Economics and CEPR
Date of receipt of first submission: April 2002Date of receipt of final typescript: November 2003
Technical Appendix is available for this paper: www.res.org.uk/economic/ta/tahome.asp
822 [ O C TO B E RTH E E CONOM I C J O U RN A L
� Royal Economic Society 2004

ReferencesAcemoglu, D., Aghion, P. and Zilibotti, F. (2002). ‘Distance to frontier, selection, and economic
growth’, NBER Working Paper 9066.Acemoglu, D., Johnson, S. and Robinson, J. (2001). ‘The colonial origins of comparative development:
an empirical investigation’, American Economic Review, vol. 91, pp. 1369–401.Aghion, P., Bloom, D., Blundell, R., Griffith, R. and Howitt, P. (2002). ‘Competition and innovation: an
inverted U relationship’. NBER Working Paper 9269.Aghion, P. and Howitt, P. (1992). ‘A model of growth through creative destruction’, Econometrica,
vol. 60(2), pp. 323–51.Aghion, P., Harris, C. and Vickers, J. (1997). ‘Competition and growth with step-by-step innovations: an
example’, European Economic Review, Papers and Proceedings, vol. 41, pp. 771–82.Baily, M., Hulten, C. and Campbell, D. (1992). ‘Productivity dynamics in manufacturing plants’,
Brookings Papers on Economic Activity: Microeconomics, pp. 187–267.Baldwin, J. and Gorecki, P. (1991). ‘Firm entry and exit in the Canadian manufacturing sector’,
Canadian Journal of Economics, vol. 24, pp. 300–23.Blanchard, O. and Giavazzi, F. (2001). ‘Macroeconomic effects of regulation and deregulation in goods
and labor markets’, NBER Working Paper 8120.Blundell, R., Griffith, R. and van Reenan, J. (1999). ‘Market share, market value and innovation in a
panel of British manufacturing firms’, Review of Economic Studies, vol. 66(3), pp. 529–54.Brown, J.D. and Earle, J. (2001). ‘Competition-enhancing policies and infrastructure:evidence from
Russia’, Stockholm Institute on Transition Economics, Staff Paper No. 01/04 (August). StockholmSchool of Economics.
Census of Manufacturers (2001). Concentration Ratios in Manufacturing: 1997 Economic Census of Manu-facturers, Washington DC: U.S. Department of Commerce.
Dasgupta, P. and Stiglitz, J. (1980). ‘Industrial structure and the nature of innovative activity’,Economic Journal, vol. 90(358), pp. 266–93.
Demsetz, H. (1972). ‘Industry structure, market rivalry, and public policy’, Journal of Law and Economics,vol. 16(1), pp. 1–10.
Disney, R., Haskell, J. and Heden, Y. (2003). ‘Restructuring and productivity growth in UK manufac-turing’, Economic Journal, vol. 113(489), pp. 666–94.
Dixit, A. and Stiglitz, J. (1977). ‘Monopolistic competition and optimum product diversity’, AmericanEconomic Review, vol. 67(3), pp. 297–308.
Djankov, S., La Porta, R., Lopez-de-Silanes, F. and Shleifer, A. (2002). ‘The regulation of entry’, QuarterlyJournal of Economics, vol. 117(1), pp. 1–37.
Dunne, T., Roberts, M. and Samuelson, L. (1988). ‘Patterns of firm entry and exit in US. manufacturingindustries, Rand Journal of Economics, vol. 19(4), pp. 495–515.
European Bank for Reconstruction and Development (2001). Transition Report 2001, London: EBRD.Farrell, J. and Shapiro, C. (1990). ‘Horizontal mergers: an equilibrium analysis’, American Economic
Review, vol. 80(1), pp. 107–26.Fernald, J. (1999). ‘Roads to prosperity? Assessing the link between public capital and productivity’,
American Economic Review, vol. 89 (3), pp. 619–37.Geroski, P. (1991). Market Dynamics and Entry, Oxford: Basil Blackwell.Grossman, G. and Helpman, E. (2001). Special Interest Politics, Cambridge MA: MIT Press.Hart, O. (1983). ‘The market mechanism as an incentive scheme’, RAND Journal of Economics, vol. 14,
(Autumn), pp. 366–82.Knack, S. and Keefer, P. (1995). ‘Institutions and economic performance: cross-country tests using
alternative institutional measures’, Economics and Politics, vol. 7, pp. 207–27.Martins, J., Scarpetta, S. and Pilat, D. (1996). ‘Mark-up ratios in manufacturing industries – estimates for
14 OECD countries’, OECD Economics Department, Working Paper 162.McMillan, J. (1997). ‘Markets in transition’, in (D. Kreps and K. Wallis), Advances in Economics and
Econometrics, vol. 2, pp. 210–39, Cambridge: Cambridge University Press.McMillan, J. and Woodruff, C. (1999). ‘Interfirm relationships and informal credit in Vietnam’, Quar-
terly Journal of Economics, vol. 114, pp. 1285–320.Murphy, K., Shleifer, A. and Vishny, R. (1989). ‘Industrialisation and the big push’, Journal of Political
Economy, vol. 97(5), pp. 1003–26.Nickell, S. (1996). ‘Competition and corporate performance’, Journal of Political Economy, vol. 104,
pp. 724–46.Nicoletti, G. and Scarpetta, S. (2003). ‘Regulation and growth: OECD evidence’. Economic Policy,
vol. 18(1), pp. 9–72.Pistor, K., Raiser, M. and Gelfer, S. (2000). ‘Law and finance in transition economies’, Economics of
Transition, vol. 8, pp. 325–68.
2004] 823COM P E T I T I O N - E NH AN C I N G P O L I C I E S
� Royal Economic Society 2004

Roberts, M. and Tybout, J. eds. (1996). Industrial Evolution in Developing Countries, New York: OxfordUniversity Press.
Roeller, L. H. and Waverman, L. (2001). ‘Telecommunications infrastructure and economic develop-ment: a simultaneous approach’, American Economic Review, vol. 91(4), pp. 909–23.
Salop, S. (1979). ‘Monopolistic competition with outside goods’, Bell Journal of Economics and Manage-ment Science, vol. 10, pp. 141–56.
Scharfstein, D. (1988). ‘Product market competition and managerial slack’, RAND Journal of Economics,vol. 29(1), (Spring), pp. 147–55.
Schmidt, K. (1997). ‘Managerial incentives and product market competition’, Review of Economic Studies,vol. 64, pp. 191–213.
Vickers, J. (1995). ‘Concepts of competition’, Oxford Economic Papers, vol. 47(1), pp. 1–23.Weingast, B. (1995). ‘The economic role of political institutions: market-preserving federalism and
economic development’. Journal of Law, Economics and Organization, vol. 11, pp. 1–31.
824 [ O C TO B E R 2004]T H E E CONOM I C J O U RN A L
� Royal Economic Society 2004