On the use of the Radon Transform in studying nearshore wave dynamics
7
Short communication On the use of the Radon Transform in studying nearshore wave dynamics Rafael Almar a, ⁎, Herve Michallet b , Rodrigo Cienfuegos c, d , Philippe Bonneton e , Marion Tissier f , Gerben Ruessink f a UMR LEGOS (CNRS/CNES/IRD/Université de Toulouse), Toulouse, France b CNRS/UJF/G-INP, UMR LEGI, BP53, 38041, Grenoble, France c Departamento de Ingeniería Hidráulica y Ambiental, Escuela de Ingeniería, Pontificia Universidad Católica de Chile, Santiago, Chile d Centro Nacional de Investigación para la Gestión Integrada de Desastres Naturales (CIGIDEN-Conicyt/Fondap/15110017), Santiago, Chile e UMR EPOC (Université de Bordeaux/CNRS), Bordeaux, France f Department of Physical Geography, Faculty of Geosciences, Utrecht University, P.O. Box 80.115, 3508 TC Utrecht, The Netherlands abstract article info Article history: Received 10 January 2014 Received in revised form 18 June 2014 Accepted 23 June 2014 Available online xxxx Keywords: Surf zone Wave transformation Wave propagation Individual wave celerity Wave reflection Incoming and outgoing waves separation In the nearshore, describing the complex individual wave dynamics remains a key challenge. In this paper we test the ability of the Radon Transform to produce estimates of individual wave celerities and to separate incoming and outgoing waves conserving the temporal characteristics. The Radon Transform is a projection of a two- dimensional field into polar space. Oblique features such as propagating crests in a spatio-temporal space are identified with density peaks in the polar space. In this paper, the Radon Transform is applied to synthetic test cases including a wide range of beach slopes and wave conditions. The Radon Transform shows good skills at es- timating individual celerity and separating incoming and outgoing components with a relative RMS error lower than 10%, even a standing wave node. The accuracy is fairly insensitive to wave characteristics whereas the main limitations rise from the sampling scheme and are the number and density of wave gauges. The distance between gauges should be less than one third of the shortest wavelength, while the set of gauges should cover more than one third of the longest wavelength. © 2014 Elsevier B.V. All rights reserved. 1. Introduction The complexity of an incident short-wave (typically, 0.05–0.5 Hz) field increases while approaching the shore. For example, short waves induce long waves (~0.005–0.05 Hz) that reflect from the beach face, producing cross-shore patterns that may influence the height and celer- ity of individual short waves (Abdelrahman and Thornton, 1987; Roelvink and Stive, 1989). Limitations of techniques that aim to separate incoming and outgoing wave signals presently prevent an accurate de- scription and understanding of wave-by-wave dynamics and interac- tions between short and long-wave fields. However, in the nearshore shallow water domain, the celerity of short waves is a key kinematic variable to describe energy fluxes and to derive bathymetric variations through the inversion of the dispersion relation (Catalán and Haller, 2008). While an average celerity can be estimated through cross- correlation techniques (Almar et al., 2008; Tissier et al., 2011), it be- comes very inaccurate when applied to individual waves which often exhibit a substantial wave-to-wave celerity variability (i.e. dispersion from the mean value), in particular close to the breakpoint and in very shallow water (Catalán and Haller, 2008; Stive, 1984; Svendsen et al., 2003; Tissier et al., 2013). Signal separation often relies on spectral ap- proaches based on Fourier transformed wave time-series on a subarray of adjacent wave gauges (e.g. Battjes et al., 2004; Goda and Suzuki, 1976; Sheremet et al., 2002; van Dongeren et al., 2007). As pointed out by Baldock (2006), no rigorous separation procedure exists for ir- regular waves breaking over a sloping bed. Moving towards methods that estimate the amplitudes and phases of incident and reflected waves is required to perform wave-by-waves analysis and to obtain more insight into the complex wave interactions in the nearshore. In this work, we aim to assess the ability of the Radon transform (RT, Deans, 1983; Radon, 1917) in describing nearshore wave dynamics from dense spatio-temporal data of sea surface elevation. The RT is commonly used in image processing and computer vision as edge detector, de- noising, and line extraction (Murphy, 1986). In geosciences, applications exist in the field of seismology (de Hoop et al., 2008), ship waves (Copeland et al., 1995; Rey et al., 1990), regional ocean Rossby waves propagation (Cipollini et al., 1998). Its application to nearshore wave pro- cesses includes the tracking of the crests of individual waves (Yoo et al., 2011) and the detection of the swash front motion (Zhang et al., 2009). In this paper we revisit the RT method in the context of coastal engi- neering applications focusing on nearshore wave dynamics. In Section 2 the theoretical aspects of the method are described briefly and the RT- based methods for retrieving incoming and outgoing waves and Coastal Engineering 92 (2014) 24–30 ⁎ Corresponding author. E-mail address: [email protected] (R. Almar). http://dx.doi.org/10.1016/j.coastaleng.2014.06.008 0378-3839/© 2014 Elsevier B.V. All rights reserved. Contents lists available at ScienceDirect Coastal Engineering journal homepage: www.elsevier.com/locate/coastaleng
Transcript of On the use of the Radon Transform in studying nearshore wave dynamics

Coastal Engineering 92 (2014) 24–30
Contents lists available at ScienceDirect
Coastal Engineering
j ourna l homepage: www.e lsev ie r .com/ locate /coasta leng
Short communication
On the use of the Radon Transform in studying nearshore wave dynamics
Rafael Almar a,⁎, Herve Michallet b, Rodrigo Cienfuegos c,d, Philippe Bonneton e,Marion Tissier f, Gerben Ruessink f
a UMR LEGOS (CNRS/CNES/IRD/Université de Toulouse), Toulouse, Franceb CNRS/UJF/G-INP, UMR LEGI, BP53, 38041, Grenoble, Francec Departamento de Ingeniería Hidráulica y Ambiental, Escuela de Ingeniería, Pontificia Universidad Católica de Chile, Santiago, Chiled Centro Nacional de Investigación para la Gestión Integrada de Desastres Naturales (CIGIDEN-Conicyt/Fondap/15110017), Santiago, Chilee UMR EPOC (Université de Bordeaux/CNRS), Bordeaux, Francef Department of Physical Geography, Faculty of Geosciences, Utrecht University, P.O. Box 80.115, 3508 TC Utrecht, The Netherlands
⁎ Corresponding author.E-mail address: [email protected] (R. Almar).
http://dx.doi.org/10.1016/j.coastaleng.2014.06.0080378-3839/© 2014 Elsevier B.V. All rights reserved.
a b s t r a c t
a r t i c l e i n f oArticle history:Received 10 January 2014Received in revised form 18 June 2014Accepted 23 June 2014Available online xxxx
Keywords:Surf zoneWave transformationWave propagationIndividual wave celerityWave reflectionIncoming and outgoing waves separation
In the nearshore, describing the complex individualwave dynamics remains a key challenge. In this paperwe testthe ability of the Radon Transform to produce estimates of individual wave celerities and to separate incomingand outgoing waves conserving the temporal characteristics. The Radon Transform is a projection of a two-dimensional field into polar space. Oblique features such as propagating crests in a spatio-temporal space areidentified with density peaks in the polar space. In this paper, the Radon Transform is applied to synthetic testcases including a wide range of beach slopes and wave conditions. The Radon Transform shows good skills at es-timating individual celerity and separating incoming and outgoing components with a relative RMS error lowerthan 10%, even a standingwave node. The accuracy is fairly insensitive to wave characteristics whereas the mainlimitations rise from the sampling scheme and are the number and density ofwave gauges. The distance betweengauges should be less than one third of the shortest wavelength, while the set of gauges should cover more thanone third of the longest wavelength.
© 2014 Elsevier B.V. All rights reserved.
1. Introduction
The complexity of an incident short-wave (typically, 0.05–0.5 Hz)field increases while approaching the shore. For example, short wavesinduce long waves (~0.005–0.05 Hz) that reflect from the beach face,producing cross-shore patterns thatmay influence the height and celer-ity of individual short waves (Abdelrahman and Thornton, 1987;Roelvink and Stive, 1989). Limitations of techniques that aim to separateincoming and outgoing wave signals presently prevent an accurate de-scription and understanding of wave-by-wave dynamics and interac-tions between short and long-wave fields. However, in the nearshoreshallow water domain, the celerity of short waves is a key kinematicvariable to describe energy fluxes and to derive bathymetric variationsthrough the inversion of the dispersion relation (Catalán and Haller,2008). While an average celerity can be estimated through cross-correlation techniques (Almar et al., 2008; Tissier et al., 2011), it be-comes very inaccurate when applied to individual waves which oftenexhibit a substantial wave-to-wave celerity variability (i.e. dispersionfrom the mean value), in particular close to the breakpoint and in veryshallow water (Catalán and Haller, 2008; Stive, 1984; Svendsen et al.,
2003; Tissier et al., 2013). Signal separation often relies on spectral ap-proaches based on Fourier transformed wave time-series on a subarrayof adjacent wave gauges (e.g. Battjes et al., 2004; Goda and Suzuki,1976; Sheremet et al., 2002; van Dongeren et al., 2007). As pointedout by Baldock (2006), no rigorous separation procedure exists for ir-regular waves breaking over a sloping bed. Moving towards methodsthat estimate the amplitudes and phases of incident and reflectedwaves is required to perform wave-by-waves analysis and to obtainmore insight into the complex wave interactions in the nearshore.
In this work, we aim to assess the ability of the Radon transform (RT,Deans, 1983; Radon, 1917) in describing nearshore wave dynamics fromdense spatio-temporal data of sea surface elevation. The RT is commonlyused in image processing and computer vision as edge detector, de-noising, and line extraction (Murphy, 1986). In geosciences, applicationsexist in the field of seismology (de Hoop et al., 2008), ship waves(Copeland et al., 1995; Rey et al., 1990), regional ocean Rossby wavespropagation (Cipollini et al., 1998). Its application tonearshorewavepro-cesses includes the tracking of the crests of individual waves (Yoo et al.,2011) and the detection of the swash front motion (Zhang et al., 2009).
In this paperwe revisit the RTmethod in the context of coastal engi-neering applications focusing on nearshorewave dynamics. In Section 2the theoretical aspects of the method are described briefly and the RT-based methods for retrieving incoming and outgoing waves and

25R. Almar et al. / Coastal Engineering 92 (2014) 24–30
estimating individual wave celerity are presented. The influence of thesampling scheme is discussed. Realistic synthetic test cases are used toassess the method's accuracy, advantages and drawbacks in Section 3.Finally, we provide concluding remarks and guidelines for the applica-tion of the RT to coastal studies.
2. The Radon transform
2.1. Principle
The RT (Deans, 1983; Duda andHart, 1972; Radon, 1917) R(ρ,θ) overa bidimensional field η(x,y) can be defined as:
R ρ; θð Þ ¼D η x; yð Þδ x cos θþ y sin θ−ρð Þdxdy ð1Þ
where δ is the Dirac delta function, θ and ρ are the angle and distancefrom origin of the integration line defined as ρ = x cos θ + y sin θ.The origin is the center of the two-dimension field. Fig. 1 shows the ap-
plication of the RT to a line defined as y ¼ − cos θosin θo
xþ ρosin θo
. In the Radon
space, the signature of this line is an energy peak at (ρo, θo). The RT is de-fined for all possible values of θ from [0 to 180°] and ρ from 0 to the di-agonal length of thefield. For example the RT of a dxd-dimension field is
defined for ρ values between −ffiffi2
p2 d : þ
ffiffi2
p2 d
h i.
The original field η(x,y) can be back projected using the InverseRadon Transform for all possible ρ and θ values as follow:
η x; yð Þ ¼D R ρ; θð Þdθdρ ð2Þ
The back projection can also be conducted for specified ranges of ρand θ values.
2.2. Celerity of individual waves
In nearshore studies of cross-shore wave transformation based ondense one-dimensional array from shore-based remote sensing, wavegauges or numerical modeling, wave data are frequently representedin a spatio-temporal x–t format, x being the cross-shore direction de-fined positive onshore. Each propagating wave appears as an obliqueline in the x–t space and has an associated peak in Radon space. Dueto the integration process, the Radon transform is particularly suitedfor finding individual waves in a noisy or irregular wave field.
An illustration of the celerity estimation procedure through theRT is given in Fig. 2. Fig. 2a shows a realistic x-t surface elevationwave field generated using a Boussinesq numerical model (Serr1D,Cienfuegos et al., 2010). Temporal and spatial resolutions respec-tively equal to dt = 0.1 s and dx = 0.1 m, dimension is 500 x150 pts which represents a physical dimension of 50 s x 15 m. Irreg-ular incoming waves (JONSWAP enhancement factor γ = 3.3, peak
Fig. 1. Principle of the RT: a) a line defined by y ¼ − cos θosin θo
xþ ρosin θo
and b) its signature as apeak at (ρo,θo) in Radon space.
period Tp = 5 s and significant wave height Hs = 0.05 m) are propa-gated over a constant d = 0.5-m depth. Out of the domain shown inFig. 2a, the reflection at the shore over a 1/20 slope generates an out-going component dominated by long waves. Incoming obliqueshort-crested wave trajectories are clearly visible. Each of thesewaves has a signature in the Radon space shown in Fig. 2b, material-ized by a peak at (ρ, θ). The width of the peak in the Radon space ma-terializes the ability of the RT in determining the angle θ of thepropagating feature; the narrower is this peak in angle space, themore accurate is the estimation. θ can be further converted into awave celerity c (m/s) through the following transformation:
c ¼ tan θð Þdx=dt ð3Þ
where dx and dt are the spatial and temporal resolution, respective-ly. Celerity in Fig. 2b shows some dispersion, with an average crestsangle of θ=68.3° which gives c= 2.51 m/s using Eq. (3). In this def-inition, wave celerity is associated to the propagation of the crest,which is identified by a local maximum, and a positive peak in theRadon space. However, as shown in Fig. 2b, the RT can also be ap-plied to the propagation of the wave trough which is identified as anegative peak in the Radon space. Here, the average troughs celerityis slightly smaller (θ= 66.9°, c= 2.34 m/s) to what found for crests,indicating a non-linear wave transformation.
Features that span across the entire x-t field but show some largecurvature like waves propagating in a variable water depth may notproduce suitable peaks or trough in the polar space. To estimate wavecelerity, a localized Radon Transform must be applied on a distance onwhich crest angle can be assumed constant, typically a distance shorterthan a wavelength (Almar et al., 2008). This is done by reducing the x-tfield to a Wx-wide moving window where Wx is the number of points,or wave gauges, of the window.
2.3. Separation of incoming and outgoing waves
Contrary to the individualwave celerity estimation that needs a local-ized application of the RT, the separation of incoming and outgoingwaves can be conducted over the whole x-t wave field. If a wave fieldη(x,t) contains both incoming and outgoing waves, the incoming andoutgoing wave trains appear in the Radon space within the θ= [1°–89°]and θ=[91°–179°] intervals, respectively. The separation procedure is il-lustrated in Fig. 2. In Fig. 2b, the two groups of wave trains associated toincoming and outgoing waves can be clearly seen. These two groups areseparated and reconstructed using the Inverse Radon Transform, appliedseparately at angles from 1 to 89° for incoming waves ηIn(x,t) (Eq. (4),Fig. 2c) and from 91° to 179° for outgoing waves ηOut(x,t) (Eq. (5),Fig. 2d):
ηIn x; tð Þ ¼Z þ∞
−∞
Z 89
1R ρ; θð Þdθdρ ð4Þ
ηOut x; tð Þ ¼Z þ∞
−∞
Z 179
91R ρ; θð Þdθdρ ð5Þ
2.4. Sensitivity analysis on the sampling scheme
The sampling schememay be a limiting factor for the use of the RT inthe description of wave characteristics, particularly when consideringits application to field data. We address in this section the minimalnumber of wave gauges Wx and the distance between gauges dx re-quired by the RT for obtaining a reasonable accuracy on thewave celer-ity and amplitude. In Fig. 3, the relative RMS error on the RT estimationof the incoming wave celerity Errc and amplitude ErrA (resulting fromincoming/outgoing decomposition) are evaluated for various sampling
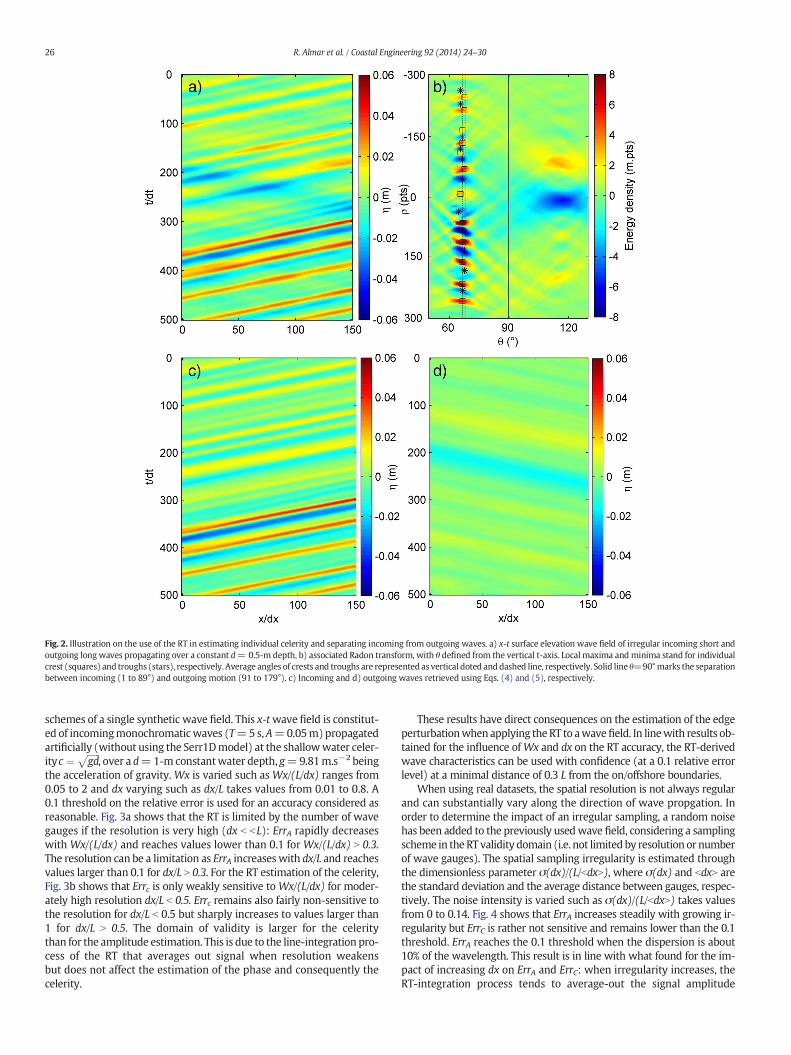
Fig. 2. Illustration on the use of the RT in estimating individual celerity and separating incoming from outgoing waves. a) x-t surface elevation wave field of irregular incoming short andoutgoing longwaves propagating over a constant d= 0.5-m depth, b) associated Radon transform, with θ defined from the vertical t-axis. Local maxima andminima stand for individualcrest (squares) and troughs (stars), respectively. Average angles of crests and troughs are represented as vertical doted and dashed line, respectively. Solid line θ=90°marks the separationbetween incoming (1 to 89°) and outgoing motion (91 to 179°). c) Incoming and d) outgoing waves retrieved using Eqs. (4) and (5), respectively.
26 R. Almar et al. / Coastal Engineering 92 (2014) 24–30
schemes of a single synthetic wave field. This x-twave field is constitut-ed of incomingmonochromaticwaves (T=5s,A=0.05m)propagatedartificially (without using the Serr1Dmodel) at the shallowwater celer-ityc ¼
ffiffiffiffiffiffigd
p, over a d=1-m constantwater depth, g=9.81m.s−2 being
the acceleration of gravity. Wx is varied such asWx/(L/dx) ranges from0.05 to 2 and dx varying such as dx/L takes values from 0.01 to 0.8. A0.1 threshold on the relative error is used for an accuracy considered asreasonable. Fig. 3a shows that the RT is limited by the number of wavegauges if the resolution is very high (dx b bL): ErrA rapidly decreaseswith Wx/(L/dx) and reaches values lower than 0.1 for Wx/(L/dx) N 0.3.The resolution can be a limitation as ErrA increases with dx/L and reachesvalues larger than 0.1 for dx/L N 0.3. For the RT estimation of the celerity,Fig. 3b shows that Errc is only weakly sensitive to Wx/(L/dx) for moder-ately high resolution dx/L b 0.5. Errc remains also fairly non-sensitive tothe resolution for dx/L b 0.5 but sharply increases to values larger than1 for dx/L N 0.5. The domain of validity is larger for the celeritythan for the amplitude estimation. This is due to the line-integration pro-cess of the RT that averages out signal when resolution weakensbut does not affect the estimation of the phase and consequently thecelerity.
These results have direct consequences on the estimation of the edgeperturbationwhenapplying theRT to awavefield. In linewith results ob-tained for the influence ofWx and dx on the RT accuracy, the RT-derivedwave characteristics can be used with confidence (at a 0.1 relative errorlevel) at a minimal distance of 0.3 L from the on/offshore boundaries.
When using real datasets, the spatial resolution is not always regularand can substantially vary along the direction of wave propgation. Inorder to determine the impact of an irregular sampling, a random noisehas been added to the previously usedwave field, considering a samplingscheme in theRT validity domain (i.e. not limited by resolution or numberof wave gauges). The spatial sampling irregularity is estimated throughthe dimensionless parameter σ(dx)/(L/bdxN), where σ(dx) and bdxN arethe standard deviation and the average distance between gauges, respec-tively. The noise intensity is varied such as σ(dx)/(L/bdxN) takes valuesfrom 0 to 0.14. Fig. 4 shows that ErrA increases steadily with growing ir-regularity but ErrC is rather not sensitive and remains lower than the 0.1threshold. ErrA reaches the 0.1 threshold when the dispersion is about10% of the wavelength. This result is in line with what found for the im-pact of increasing dx on ErrA and ErrC: when irregularity increases, theRT-integration process tends to average-out the signal amplitude

Fig. 3. Sensitivity of the RT accuracywith the number of wave gaugesWx/(L/dx) and dimensionless resolution dx/L on the estimation ofwave a) amplitude and b) celerity. Thewhite thickline stands for the method's accuracy acceptable threshold defined as a RMS relative error of 0.1.
Table 1
27R. Almar et al. / Coastal Engineering 92 (2014) 24–30
whereas the signal phase and consequently the celerity estimation is lessaffected.
3. Applications
3.1. Realistic synthetic test cases
The RT was applied to laboratory datasets in Almar et al. (2012,2013) and showed good skills but the validation of the method wasnot possible since this requires controlled synthetic data. Here, to vali-date and test the RT over a wide range of waves and beach conditions,various numerical test cases have been generated using a Boussinesqnumerical model (Serr1D, Cienfuegos et al., 2010; see Table 1) thathas been extensively validated for both short- and long-wave propaga-tion. Beach reflection is set to zero to control outgoing signals. This isdone in the model by increasing the friction to a very large value close
Fig. 4. Sensitivity of the RT accuracy with the dimensionless spatial sampling irregularityσ(dx)/(L/bdxN), where σ(dx) and bdxN are the standard deviation and the average dis-tance between gauges, respectively. Black and red circles are the RMS relative error onRT-estimated amplitude ErrA, and celerity Errc, respectively. The black dashed line standsfor themethod's accuracy acceptable threshold of 0.1. (For interpretation of the referencesto colour in this figure legend, the reader is referred to the web version of this article.)
to the shore. The sampling is dx = 0.25 m in space and dt = 0.1 s intime over 90 s (900 pts). Spatial dimension depends on beach slope.Test cases are separated into 3 series; monochromatic (A), bichromatic(B) and irregular JONSWAP (C) waves. Sub-series stand for sensitivityanalyses onwave and beach parameters. The aim of series Awas to per-form sensitivity analyses on various beaches (slope, water depth) andwave conditions (incoming and outgoing). Series B aimed at testingthe skill of the RT in presence of long waves. Series C aimed at testingthe RT for a realistic case, particularly in the occurrence of wave-to-wave interactions (e.g. celerity dispersion, merging). The outgoing sig-nalwas generated artificially by taking incoming timeseries at a locationclose to the shore (500 pts) and propagated offshore at shallow watercelerity. A sinusoidal signal was used for the A series. For B and C series,
Characteristics of the synthetic RT test cases. sl stands for beach slope, A for incomingwaveamplitudes, Hs for significant wave height and Tp for peak period (JONSWAP cases), d0 forouter point water depth, and γ for the JONSWAP enhancement factor. Subscripts inc andout stand for incoming and outgoing components.
Test cases Waves Beach
Sampling: dx = 0.25 m, dt = 0.1 s, 900 pts in time (90 s), spatial dimensiondepends on slope.
Serie A - MonochromaticA1 (varying d0) A = 0.02 m, T = 5 s
No beach reflectiond0 = 0.5, 1, 3 m
A2 (varying sl) A = 0.02 m, T = 5 sNo beach reflection
d0 = 1 m, sl = 1/40,1/80, 1/100
A3 Ainc = 0.02 m, Tinc = 5 s,Aout = 0.01 m, Tout = 10 sBeach reflection
d0 = 1 m, sl = 1/80
Serie B - BichromaticB1 A1 = 0.09 m, T1 = 5 s,
A2 = 0.04, T2 = 5.5 sNo beach reflection
d0 = 1 m, sl = 1/80
B2 A1 = 0.09 m, T1 = 5 s,A2 = 0.04, T2 = 5.5 sBeach reflection
d0 = 1 m, sl = 1/80
Serie C-IrregularC1 γ = 3.3, Tp = 5 s, Hs = 0.2 m
No beach reflectiond0 = 1 m, sl = 1/80
C2 γ = 3.3, Tp = 5 s, Hs = 0.2 mBeach reflection
d0 = 1 m, sl = 1/80
C3 γ = 3.3, Tp = 20 s, Hs = 0.02 mBeach reflection
d0 = 1 m, sl = 1/80

28 R. Almar et al. / Coastal Engineering 92 (2014) 24–30
the low-frequency component (low-pass filtered signal with a cut-offfrequency of 3/5 of peak frequency) of the incoming signal extractedat a location close to the beach was used. In Sections 3.2 and 3.3 theskill of the RT is tested using these test cases.
3.2. Individual wave celerity
Individual celerity is estimated using the procedure detailed inSection 2.2 over an arbitrary Wx = 50-pts wide moving window thatreaches validity criteria defined in Section 2.4. The validation is conduct-ed with celerities obtained from the tracking of individual crest eleva-tion maxima while waves propagate to the shore (see Fig. 5, upperpanels). In Fig. 5, the skill of the RT in estimating wave celerity is testedfor varyingwater depth (A1), beach slope (A2), bichromatic (B1) and ir-regular (C1) cases. For these 4 cases, the relative RMS difference be-tween RT-estimated celerity (cRT) and crest-tracking (ct) celerities, islower than 4 %. However, the RT tends to underestimate celerity forlarger celerity values. This behavior appears in the regression coefficientbetween individual celerities, which is lower than one (0.97, R2= 0.98,statistically significant at the 0.05 level). This slight underestimation is
Fig. 5.RT celerity estimation for A1, A2, B1, C1 test cases (see Table 1). a–d) spatio-temporal surfaverage celerity bcN and standarddeviation (as error bar) from crest tracking (in red) and RT (in1:1 line (black dashed line), andm–p) timeseries of individual celerity at x/dx=500. In e) and id = 1-m case is plotted in a). In f) and j) are represented the 3 cases of A2 with beach slopes oreferences to colour in this figure legend, the reader is referred to the web version of this artic
due to the choice of a fixed spatial window, which is a limitationwhen the wavelength increases, as found in Section 2.4. The B1 and C1cases show substantial celerity dispersion due to the presence of under-lying long waves. This dispersion, computed as the standard deviation,is illustrated in Fig. 5g and 5.h as error bars which indicate a good agree-ment between RT-estimated and crest-tracking methods. More detailscan be found in Fig. 5o and 5p which show timeseries of celerity at agiven location, close to the beach (x/dx = 500 pts). These results indi-cate that the RT well estimates the individual celerities and is thusable to catch the modulation of celerity due to long waves and wave-to-wave interactions.
3.3. Separation of incoming and outgoing waves
The separation procedure described in Section 2.3 is applied here tovarious test cases detailed in Table 1. The first 3 columns in Fig. 6 showthe application of the RT to monochromatic (A3), bichromatic (B2) andrandom (C2) caseswhere outgoing longwaves are superimposed on in-coming waves. In the fourth column, the RT is also tested for the quasi-standing wave case C3 which is extremely challenging for the
ace elevation, η(m), togetherwith examples of tracked crest trajectories (black lines), e–h)black), i–l) individual RT-derived celerity (cR) versus tracking-derived celerity (ct)with the) are represented the 3 cases of series A1withwater depth of 0.5, 1 and 3m,while only thef 1/40, 1/80 and 1/100 while only the 1/80 case is plotted in b). (For interpretation of thele.)

Fig. 6.RT separation of incoming and outgoingwaves for theA3, B2, C2 andC3 test cases. From top to bottom: a1–4) total, b1–4) incoming and c1–4) outgoingwaves, d1–4)wave heightHs
(incoming in blue and outgoing in red, total in black in d4)) along x, e1–4) asymmetry and f1–4) skewness of incomingwaves, and g1–4) timeseries of surface elevation (incoming in blueand outgoing in red) at x/dx=500 pts. Solid and dashed lines are RT-derived and original components, respectively. (For interpretation of the references to colour in this figure legend, thereader is referred to the web version of this article.)
29R. Almar et al. / Coastal Engineering 92 (2014) 24–30
separation methods because wave signature decays at nodes. For thefirst 3 cases (A3, B2, C2), the mean relative RMS error on wave heightis 4 % and 6 % for incoming and outgoing waves, respectively (Fig. 6d(1–3)). The absence of a clear difference on the method skills betweenthe three cases underlines the weak dependence of the RT perfor-mances to wave characteristics for such dense datasets. As seen inFig. 6d (1–3), large errors are observed at distances shorter than L/3from the on/offshore boundaries where the RT does not have enoughsignal to determine properly wave characteristics, as previously de-scribed in Section 2.4. For the C3 long wave case (fourth column inFig. 6), the average accuracy slightly worsen while compared to othercases, showing errors of 6 and 11 % for incoming and outgoing waveheight, respectively. The reasonable result of the RT for such quasi-standing C3 case is made possible by the line-integration procedure
that allows a good estimate of incoming and outgoing waves, even atstanding wave nodes (Fig. 6d4). Noteworthy, an analyze (not shown)indicates that the RT-separation performance is not sensitive to the dif-ference of period between incoming and outgoing waves.
One of the strengths of the RT is the conservation of temporal char-acteristics of the signal. The latter is investigated specifically through theestimation of incoming wave asymmetry and skewness (Fig. 6e (1–4)and 6.f (1–4)) which provide information on the vertical and horizontalasymmetry, respectively. Overall, the RT well catches the steady in-crease of skewness and variations of asymmetry along the profile,which is a clear indicator of the good skills of the RT to reproducewave shape changes. As a complement, timeseries of surface elevationfor outgoing and incoming waves are shown in Fig. 6g (1–4), taken inthe shoaling zone at x/dx=500pts. A good agreement is foundbetween

30 R. Almar et al. / Coastal Engineering 92 (2014) 24–30
the RT and original elevations. Both incoming and outgoing wavephases are well captured. This underlines that the RT conserves tempo-ral characteristics and can be used for wave-by-wave analyses.
4. Conclusions
The possibilities offered by the Radon Transform in describing near-shore wave dynamics from synthetic datasets have been investigated.The Radon Transform is based on a polar projection which is well suitedto spatio-temporal wave data format and conserves temporal character-istics of waves. The skills of the Radon Transform were tested over real-istic test cases generated using a Boussinesq model: monochromatic,bichromatic and irregular waves. The Radon Transform is capable ofquantifying individualwave celerity and separating incoming andoutgo-ing waves. Themean relative RMS error for these test cases is lower than10 % for both the separation of incoming and outgoingwaves and the es-timation of individual celerity. The line-integration procedure of theRadon Transform is one of the main advantages of the method becauseit reduces noise associated to individual wave celerity estimation and al-lows separating incoming from outgoing waves even at nodes of stand-ing waves but represents in return a drawback for non-continuous orrapidly varying wave signal.
This paper also provides guidelines for RT users, from a sensitivityanalysis conducted on the sampling scheme. Results show that the mini-mal number of wave gauges has to cover at least 1/3 of the wavelengthand the distance between sensors has to be smaller than 1/3 of thewave-length. Accuracy onwave amplitude estimationdecreaseswith increasingirregularitywhereas celerity estimation is less sensitive. Overall, wave ce-lerity and separation between incoming and outgoing waves can be ob-tained with an accuracy better than 10%, at least at 1/3 wavelengthfrom the edges, for a typical resolution of such as dt b bT and dx b L/3.From its characteristics, it is expected that the application of the RT willbring new insight in nearshore wave dynamics, in particular while mov-ing toward an individual wave approach.
Acknowledgments
This work has been supported by French INSU LEFE/EC2CO pro-grams, FONDECYT research grant No11060312 and by the EuropeanCommunity's Seventh Framework Program through the grant to thebudget of the Integrated Infrastructure Initiative Hydralab IV, Contractno. 261520. RC funded by Fondecyt research grant No.1120878 andConicyt/Fondap/15110017.
References
Abdelrahman, S.M., Thornton, E.B., 1987. Changes in the short wave amplitude and wave-number due to the presence of infragravity waves. Proceedings of the SpecialityConference on Coastal Hydraulics. American Society of Civil Engineers, New York,pp. 458–478.
Almar, R., Bonneton, P., Senechal, N., Roelvink, D., 2008. Wave celerity from videoimaging: a new method. Proc. Int. Conf. Coastal Eng. 1 (5), 661–673.
Almar, R., Cienfuegos, R., Gonzalez, E., Catalan, P.A., Michallet, H., Bonneton, P., Castelle, B.,Suarez, L., 2012. Barred beach morphological control on infragravity motion. ICCE,Santander, Spain.
Almar, R., Bonneton, P., Michallet, H., Cienfuegos, R., Ruessink, G., Tissier, M., 2013. On theuse of the radon transform in studying wave dynamics: application to GLOBEX labo-ratory data. Proc. Coastal Dynamics 2013.
Baldock, T.E., 2006. Long wave generation by the shoaling and breaking of transient wavegroups on a beach. Proc. R. Soc. London, Ser. A 462, 1853–1876.
Battjes, J.A., Bakkenes, H.J., Janssen, T.T., Van Dongeren, A.R., 2004. Shoaling ofsubharmonic gravity waves. J. Geophys. Res. (ISSN: 0148-0227) 109. http://dx.doi.org/10.1029/2003JC001863.
Catalán, P.A., Haller, M.C., 2008. Remote sensing of breaking wave phase speeds with ap-plication to non-linear depth inversions. Coast. Eng. 55 (1), 93–111.
Cienfuegos, R., Barthélemy, E., Bonneton, P., 2010. Awave-breakingmodel for Boussinesq-type equations including roller effects in the mass conservation equation. J. Waterw.Port Coast. Ocean Eng. 136, 10–26.
Cipollini, P., Cromwell, D., Quartly, G.D., 1998. Observations of Rossby waves propagationin the Northeast Atlantic with TOPEX/POSEIDON altimetry. Adv. Space Res. 22 (11),1553–1556.
Copeland, A.C., Ravichandran, G., Trivedi, M.M., 1995. Localized radon transform-baseddetection of ship wakes in sar images. IEEE Trans. Geosci. Remote Sci. 33, 35–45.
De Hoop, M., Smith, H., Uhlmann, G., Van der Hilst, R., 2008. Seismic imaging with thegeneralized Radon transform: A curvelet transform perspective. Inverse Prob. 25,025005.
Deans, S., 1983. The Radon transform and some of its applications, 1st edition. JohnWiley& Sons, New York (289 pp., ISBN 13: 9780471898047).
Duda, R.O., Hart, P.E., 1972. Use of the Hough Transformation to Detect Lines and Curvesin Pictures. Commun. ACM 15, 11–15.
Goda, Y., Suzuki, Y., 1976. Estimation of incident and reflected waves in randomwave ex-periments. Proceedings of 15th International Conference on Coastal Engineering.ASCE, Honolulu, HI, pp. 828–845.
Murphy, L.M., 1986. Linear feature detection and enhancement in noisy images via theRadon transform. Pattern Recogn. Lett. 4, 279–284.
Radon, J., 1917. Über die Bestimmung von Funktionen durch ihre Integralwerte längsgewisser Mannigfaltigkeiten, Berichte Sächsische Akademie der Wissenschaften,Leipzig. Math.-Phys. Kl. 69, 262–267.
Rey, M.T., Tunaley, J.K., Folinsbee, J.T., Jahans, P.A., Dixon, J.A., Vant, M.R., 1990. Applicationof Radon transform techniques to wake detection in Seasat-A SAR images. IEEE Trans.Geosci. Remote Sens. 28, 553–560.
Roelvink, J.A., Stive, M.J.F., 1989. Bar-generating cross-shore flowmechanisms on a beach.J. Geophys. Res. 94, 4785–4800.
Sheremet, A., Guza, R.T., Elgar, S., Herbers, T.H.C., 2002. Observations of nearshoreinfragravity waves: Seaward and shoreward propagating components. J. Geophys.Res. 107 (C8), 3095. http://dx.doi.org/10.1029/2001JC000970.
Stive, M.J.F., 1984. Energy dissipation in waves breaking on gentle slopes. Coast. Eng. 8,99–127.
Svendsen, I.A., Qin, W., Ebersole, B.A., 2003. Modeling waves and currents at the LSTF andother laboratory facilities. Coast. Eng. 50, 19–45.
Tissier, M., Bonneton, P., Almar, R., Castelle, B., Bonneton, N., Nahon, A., 2011. Field mea-surements and non-linear prediction of waves celerity in the surf zone. Eur. J. Mech.B. Fluids 30, 635–641.
Tissier, M., Almar, R., Bonneton, P., Michallet, H., de Bakker, A., Ruessink, B.G., 2013. Role ofShort and Long-Wave interaction on wave celerity in the Surf zone of a low-slopingbeach. Proceeding of Coastal Dynamics 2013, June 2013, Arcachon, France.
van Dongeren, A.R., Battjes, J.A., Janssen, T.T., van Noorloos, J., Steenbergen, K., Reniers, A.,2007. Shoaling and shoreline dissipation of low-frequency waves. J. Geophys. Res.112 (C02011). http://dx.doi.org/10.1029/2006 JC003701.
Yoo, J., Fritz, H., Haas, K., Work, P., Barnes, C., 2011. Depth inversion in the surf zone withinclusion of waves non-linearity using video-derived celerity. J. Waterw. Port Coast.Ocean Eng. 137 (2), 95–106.
Zhang, S., Zhang, C., Qi, Z., 2009. Waves swash velocity estimation using ridgelet trans-form. 9th Int. Conf. Electronic Meas. & Instr. ICEMI 09, pp. 1078–1081.