On the Use of Stable Isotopes in Trophic Ecology...examine two emerging areas of SIA in trophic...
33
On the Use of Stable Isotopes in Trophic Ecology William J. Boecklen, 1 Christopher T. Yarnes, 2 Bethany A. Cook, 1 and Avis C. James 1 1 Laboratory of Ecological Chemistry, Department of Biology, New Mexico State University, Las Cruces, New Mexico 88003; email: [email protected], [email protected], [email protected] 2 Stable Isotope Facility, Department of Plant Sciences, University of California, Davis, Davis, California 95616; email: [email protected] Annu. Rev. Ecol. Evol. Syst. 2011. 42:411–40 First published online as a Review in Advance on August 25, 2011 The Annual Review of Ecology, Evolution, and Systematics is online at ecolsys.annualreviews.org This article’s doi: 10.1146/annurev-ecolsys-102209-144726 Copyright c 2011 by Annual Reviews. All rights reserved 1543-592X/11/1201-0411$20.00 Keywords compound-specific isotope analysis, diet reconstruction, isotopic routing, isotopic turnover, lipid extraction, isotope mixing models Abstract Stable isotope analysis (SIA) has proven to be a useful tool in reconstruct- ing diets, characterizing trophic relationships, elucidating patterns of re- source allocation, and constructing food webs. Consequently, the number of studies using SIA in trophic ecology has increased exponentially over the past decade. Several subdisciplines have developed, including isotope mix- ing models, incorporation dynamics models, lipid-extraction and correction methods, isotopic routing models, and compound-specific isotopic analy- sis. As with all tools, there are limitations to SIA. Chief among these are multiple sources of variation in isotopic signatures, unequal taxonomic and ecosystem coverage, over-reliance on literature values for key parameters, lack of canonical models, untested or unrealistic assumptions, low predictive power, and a paucity of experimental studies. We anticipate progress in SIA resulting from standardization of methods and models, calibration of model parameters through experimentation, and continued development of several recent approaches such as isotopic routing models and compound-specific isotopic analysis. 411 Annu. Rev. Ecol. Evol. Syst. 2011.42:411-440. Downloaded from www.annualreviews.org by CSIC - Consejo Superior de Investigaciones Cientificas on 05/28/14. For personal use only.
Transcript of On the Use of Stable Isotopes in Trophic Ecology...examine two emerging areas of SIA in trophic...
ES42CH19-Boecklen ARI 27 September 2011 14:2
On the Use of Stable Isotopesin Trophic EcologyWilliam J. Boecklen,1 Christopher T. Yarnes,2
Bethany A. Cook,1 and Avis C. James1
1Laboratory of Ecological Chemistry, Department of Biology, New Mexico State University,Las Cruces, New Mexico 88003; email: [email protected], [email protected], [email protected] Isotope Facility, Department of Plant Sciences, University of California, Davis, Davis,California 95616; email: [email protected]
Annu. Rev. Ecol. Evol. Syst. 2011. 42:411–40
First published online as a Review in Advance onAugust 25, 2011
The Annual Review of Ecology, Evolution, andSystematics is online at ecolsys.annualreviews.org
This article’s doi:10.1146/annurev-ecolsys-102209-144726
Copyright c© 2011 by Annual Reviews.All rights reserved
1543-592X/11/1201-0411$20.00
Keywords
compound-specific isotope analysis, diet reconstruction, isotopic routing,isotopic turnover, lipid extraction, isotope mixing models
Abstract
Stable isotope analysis (SIA) has proven to be a useful tool in reconstruct-ing diets, characterizing trophic relationships, elucidating patterns of re-source allocation, and constructing food webs. Consequently, the numberof studies using SIA in trophic ecology has increased exponentially over thepast decade. Several subdisciplines have developed, including isotope mix-ing models, incorporation dynamics models, lipid-extraction and correctionmethods, isotopic routing models, and compound-specific isotopic analy-sis. As with all tools, there are limitations to SIA. Chief among these aremultiple sources of variation in isotopic signatures, unequal taxonomic andecosystem coverage, over-reliance on literature values for key parameters,lack of canonical models, untested or unrealistic assumptions, low predictivepower, and a paucity of experimental studies. We anticipate progress in SIAresulting from standardization of methods and models, calibration of modelparameters through experimentation, and continued development of severalrecent approaches such as isotopic routing models and compound-specificisotopic analysis.
411
Ann
u. R
ev. E
col.
Evo
l. Sy
st. 2
011.
42:4
11-4
40. D
ownl
oade
d fr
om w
ww
.ann
ualr
evie
ws.
org
by C
SIC
- C
onse
jo S
uper
ior
de I
nves
tigac
ione
s C
ient
ific
as o
n 05
/28/
14. F
or p
erso
nal u
se o
nly.

ES42CH19-Boecklen ARI 27 September 2011 14:2
SIA: stable isotopeanalysis
INTRODUCTION
Stable isotope analysis (SIA) has been accepted broadly by ecologists, evolutionary biologists,wildlife biologists, and conservation biologists as an important tool to examine animal migrationand movement (Hobson 1999, Rubenstein & Hobson 2004); resource partitioning ( Jackson et al.1995, Young et al. 2010); host-parasite interactions (El-Hajj et al. 2004, Neilson et al. 2005); plantwater use and nutrient status (Flanagan & Ehleringer 1991, Dawson et al. 2002); ecophysiologicalprocesses (Gannes et al. 1998, Cernusak & Hutley 2011); and ecosystem fluxes of carbon, nitrogen,and water (Peterson & Fry 1987).
The focus of this review is on the application of SIA to trophic ecology. SIA is used to reconstructdiets (Minson et al. 1975, Tieszen et al. 1983, Samelius et al. 2007), to assign species to trophic po-sitions in food webs (Minagawa & Wada 1984, Fry 1991, Post 2002; see also Hoeinghaus & Zeug2008), to elucidate patterns of resource acquisition and allocation (O’Brien et al. 2000, Cherelet al. 2005, Waas et al. 2010), and to characterize niche properties (Genner et al. 1999, Bearhopet al. 2004, Newsome et al. 2007). It is not surprising that SIA has had a major impact on theseresearch areas, as SIA offers significant advantages over traditional methods that may be unethical(destructive sampling of endangered species), impractical (quantifying complex food webs overlarge temporal and spatial scales), prohibitively expensive (observational studies of ocean-goingand deep-sea organisms), or simply impossible (reconstructing diets of long-extinct species).
The central conjecture of SIA in trophic ecology is perhaps best represented by the obser-vation, “You are what you eat (plus a few per mil)” (DeNiro & Epstein 1976). This conjecturefollows from the pioneering work of Smith & Epstein (1970), Minson et al. (1975), and Haines(1976), which suggested that the isotopic signatures (expressed as δ, the ratio of heavy to lightisotope, and reported in parts per thousand as per mil) of consumers resembled the isotopic sig-natures of associated plants. This conjecture was given greater exposition by Fry et al. (1978) andDeNiro & Epstein (1978, 1981), who noted consistent differences between the isotopic signa-tures of consumers and their dietary resources. Elucidating the sources of variation in the isotopicsignatures of species and understanding the magnitudes and causes of the differences betweenconsumer and resource isotopic signatures (consumer-resource discrimination, expressed as �)are the centerpieces of SIA in trophic ecology.
Three decades of work and several thousand papers have identified many factors that con-tribute to variation in isotopic signatures and consumer-resource discrimination (Table 1). Thesefactors have been addressed largely in an effort to define more precisely those “. . . few per mil.”We consider two sources of variation as emergent factors: diet and trophic position. These arethe principal factors that SIA in trophic ecology hopes to explain. We submit that variation inthese factors is driven at a fundamental level by isotopic differences among resources, such as inphotosynthetic pathways (Park & Epstein 1960, Smith & Epstein 1971) and by consumer-resourcediscrimination (DeNiro & Epstein 1978, 1981). We regard these factors as principal mechanisticfactors. Secondary mechanistic factors include biotic and abiotic factors that can be partitionedaccording to properties of the consumer, properties of the dietary resources, properties of the en-vironment, and properties of SIA analysis. Properties of the consumer can be partitioned furtherto reflect variation in tissue properties, life histories, physiological condition, and ecological andevolutionary history and circumstance.
The large number of factors generating variation in isotopic signatures makes comparisonacross studies problematic. Conceptually, each study must be placed in a multidimensional spacedefined by the factors. The high dimensionality of this space means that each study will likelyoccupy a unique position and that many coordinates in the space (combinations of factors) will beempty. Consequently, it will be difficult to generate large samples of studies that match in even a
412 Boecklen et al.
Ann
u. R
ev. E
col.
Evo
l. Sy
st. 2
011.
42:4
11-4
40. D
ownl
oade
d fr
om w
ww
.ann
ualr
evie
ws.
org
by C
SIC
- C
onse
jo S
uper
ior
de I
nves
tigac
ione
s C
ient
ific
as o
n 05
/28/
14. F
or p
erso
nal u
se o
nly.

ES42CH19-Boecklen ARI 27 September 2011 14:2
Table 1 Sources of variation in the isotopic signatures of organisms
Factors Source of variation ReferenceEmergent factors Diet Smith & Epstein 1970
Trophic position Haines 1976
Principalmechanistic factors
Consumer-resourcediscrimination
DeNiro & Epstein 1978
Photosynthetic pathway Park & Epstein 1960
Secondarymechanistic factors
Properties of theorganism
Tissue level Tissue examined Tieszen et al. 1983Lipid content McConnaughey & McRoy 1979
Carbon:nitrogen ratio Mintenbeck et al. 2008
Uric acid and urea content Bearhop et al. 2000
Life-history level Ontogenetic stage Tibbets et al. 2008
Body size Fry & Arnold 1982
Gender Mariano-Jelicich et al. 2008
Reproductive status Fuller et al. 2004
Physiological level Metabolic rate MacAvoy et al. 2006
Starvation and nutrient stress Hobson et al. 1993
Water stress Ambrose & DeNiro 1986
Isotopic routing Schwarcz 1991
Trophic versus source aminoacids
McClelland & Montoya 2002
Excretion dynamics Olive et al. 2003
Ecological/evolutionary level
Diet switch Tieszen et al. 1983Feeding guild Hobson & Clark 1992
Taxonomic identity Vanderklift & Ponsard 2003
Symbionts and parasites Miura et al. 2006
Migratory status Hobson 1999
Intraspecific competition Forero et al. 2002
Properties of theresource
Lipid content Gaye-Siessegger et al. 2004Protein content Kelly & Martinez del Rio 2010
Elemental concentration Pearson et al. 2003
Isotopic signatures Caut et al. 2009
Properties of theenvironment
Biome level Marine versus terrestrial Michener & Schell 1994Tropical versus temperate Martinelli et al. 1999
Benthic versus pelagic Hobson et al. 1994
Inshore versus offshore Cherel & Hobson 2007
Habitat level Drought Peuke et al. 2006
Latitude Kelly & Finch 1998
Season Perga & Gerdeax 2005
Temperature Bosley et al. 2002
Humidity Murphy et al. 2007
Elevation Graves et al. 2002
Pollution Schlacher et al. 2005
Fire Grogan et al. 2000(Continued )
www.annualreviews.org • SIA in Trophic Ecology 413
Ann
u. R
ev. E
col.
Evo
l. Sy
st. 2
011.
42:4
11-4
40. D
ownl
oade
d fr
om w
ww
.ann
ualr
evie
ws.
org
by C
SIC
- C
onse
jo S
uper
ior
de I
nves
tigac
ione
s C
ient
ific
as o
n 05
/28/
14. F
or p
erso
nal u
se o
nly.

ES42CH19-Boecklen ARI 27 September 2011 14:2
Table 1 (Continued)
Factors Source of variation ReferenceSurface runoff McClelland et al. 1997
El Nino southern oscillation Stapp et al. 1999
Analyticalproperties
Mass-spectrometer bias Mill et al. 2008Tissue preservation Kelly et al. 2006
Lipid correction method Sweeting et al. 2006
Acidification Jaschinski et al. 2008
small subset of factors. Without sufficient sample sizes, statistically robust models are not possibleand those “few per mil” will not be estimated precisely.
Several factors listed in Table 1 have attracted sufficient research interest to have producedseveral subdisciplines in trophic ecology SIA. These include trophic positioning and food webreconstruction, lipid correction of tissue samples, mixing models and diet reconstruction, iso-tope incorporation dynamics, and most recently, isotopic routing and single-compound-specificSIA. Disagreements over the conjectures, assumptions, models, and caveats attendant to eachsubdiscipline have fueled vigorous research programs.
The remainder of this review is in five parts. The first is a meta-analysis of SIA studies publishedbetween 2007 and 2009, inclusive. Here, we address issues such as taxonomic and ecosystemcoverage and prevalence of experimental studies. We examine variation in isotopic signatureswith respect to trophic position, ontogenetic stage, biome, taxonomic group, and tissue type. Thesecond part analyzes mixing models (Phillips & Gregg 2001, 2003; Ward et al. 2010) used toreconstruct diets of consumers that use two or more resources. We discuss several mathematicaland statistical constraints inherent in diet reconstruction based on SIA. We also examine thepredictive power of mixing models. The third part reviews isotope incorporation dynamics models(Fry & Arnold 1982, Hobson & Clark 1992, Hesslein et al. 1993, Martinez del Rio & Wolf 2005).These models describe the change in isotopic signatures of consumers following a diet switch andare used to estimate isotopic turnover rates in consumer tissues. The fourth part of the reviewaddresses the practice of lipid correction of tissue samples prior to the determination of isotopicsignatures (McConnaughey & McRoy 1979, Post et al. 2007, Mintenbeck et al. 2008). Last, weexamine two emerging areas of SIA in trophic ecology: isotopic routing (Podlesak & McWilliams2007, Kelly & Martinez del Rio 2010) and compound-specific SIA (Chamberlain et al. 2004).
META-ANALYSIS OF STABLE ISOTOPE ANALYSIS (2007–2009)
We were motivated to conduct this meta-analysis simply because we wanted to understand thecharacteristics of the typical study using SIA in trophic ecology. In particular, we are interested inthe extent of taxonomic and ecosystem coverage. We are particularly interested in the prevalenceof experimental studies. This review follows other such reviews (e.g., Kelly 2000, Dawson et al.2002, McCutchan et al. 2003, Vanderklift & Ponsard 2003, Caut et al. 2009, Martinez del Rioet al. 2009) and assesses progress in the field.
Methods
We examined the ISI Web of Knowledge using the key phrase “stable isotopes.” The papersreturned were then filtered by subject area. We restricted the analysis to papers in the following
414 Boecklen et al.
Ann
u. R
ev. E
col.
Evo
l. Sy
st. 2
011.
42:4
11-4
40. D
ownl
oade
d fr
om w
ww
.ann
ualr
evie
ws.
org
by C
SIC
- C
onse
jo S
uper
ior
de I
nves
tigac
ione
s C
ient
ific
as o
n 05
/28/
14. F
or p
erso
nal u
se o
nly.
ES42CH19-Boecklen ARI 27 September 2011 14:2
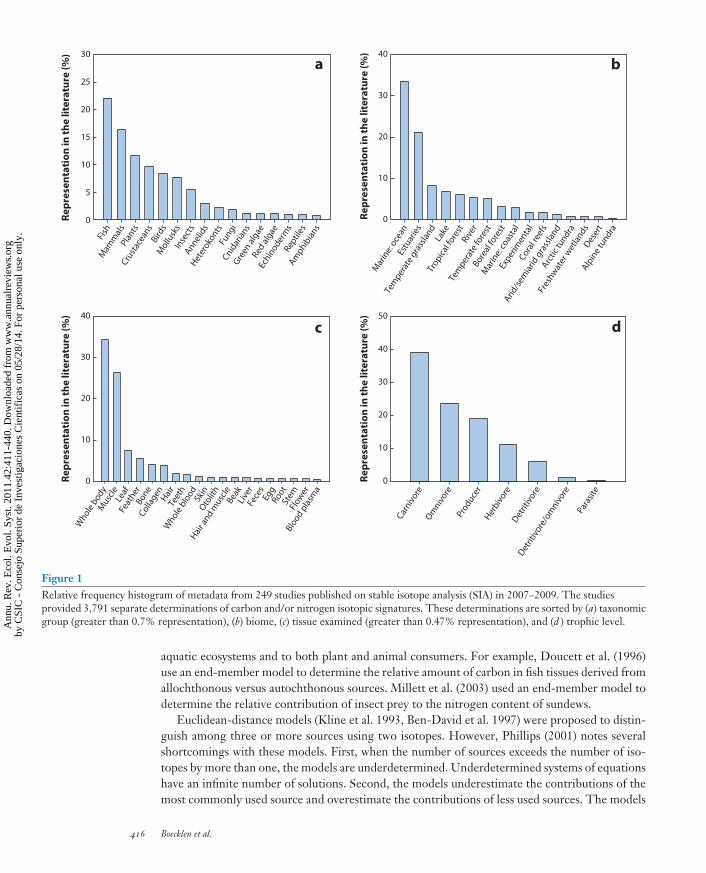
disciplines: biochemistry and molecular biology; biodiversity conservation; biotechnology and ap-plied microbiology; ecology; entomology; environmental sciences; evolutionary biology; fisheries;limnology; marine and freshwater biology; microbiology; ornithology; paleontology; parasitology;plant sciences; zoology; and agriculture, dairy and animal science. We eliminated papers from thisanalysis when unsuccessful in obtaining electronic copies. These were relatively few in number,and we are confident that their omission does not significantly bias our analysis with respect totaxonomic group or ecosystem type. We used the biome classification provided by the Universityof California Museum of Paleontology (http://www.ucmp.berkeley.edu/exhibits/biomes). Intotal, we compiled data from 249 studies, representing 1,720 species and species groups, and 3,791separate determinations of carbon and/or nitrogen isotopic signatures.
Taxonomic and Ecosystem Coverage
The isotopic literature examined a diverse collection of organisms, with 39 major taxonomicgroups represented. However, the literature was dominated by fish, mammals, plants, crustaceans,birds, and mollusks (Figure 1a). These taxa collectively constituted approximately 76% of allisotopic determinations. A total of 16 major biomes were represented in the literature. There was asignificant bias in ecosystem coverage (Figure 1b): Approximately 72% of all isotopic samples werecollected from marine, estuarine, and freshwater ecosystems. The bias toward marine, estuarine,and freshwater studies is not surprising given that these systems are the least amenable to traditionalmethods of trophic analysis. Isotopic determination involving direct experimentation constitutedless than 2% of all records.
Tissue and Trophic Level Coverage
A diverse set of tissue types were represented in the literature (Figure 1c). Approximately 61%of all isotopic determinations involved two tissue types: whole body and muscle. Carnivores werethe most common trophic level represented (Figure 1d ), whereas detritivores and parasites werelargely neglected.
MIXING MODELS AND DIET RECONSTRUCTION
A variety of isotope mixing models have been proposed to reconstruct consumer diets. The simplestones are one-isotope, two-source linear models (e.g., France 1996, Raikow & Hamilton 2001,Dawson et al. 2002, Doi et al. 2008, Marquez & Boecklen 2010). They generally take the form
δ′ X = pδ1 X + (1 − p)δ2 X + �,
where δ′X is the isotopic ratio of element X in the consumer’s tissue, p is the percentagecontribution of source 1, � is the consumer-resource discrimination, and δ1X and δ2X are the iso-topic ratios of element X in source 1 and 2, respectively. Models of this type are fully determinedas the number of equations equals the number of unknowns. Kwak & Zedler (1997) extendedlinear models to two isotopes and three sources.
End-member models (Forsberg et al. 1993, Tesitel et al. 2010) are generally rearrangementsof one-isotope, two-source linear models and are of the form
%E1 = [δ′ X − δ2 X ]/[δ1 X − δ2 X ] × 100,
where %E1 is the percent elemental contribution of source 1 to the consumer, and δ′X, δ1X,and δ2X are as defined above. End-member models have been applied widely to terrestrial and
www.annualreviews.org • SIA in Trophic Ecology 415
Ann
u. R
ev. E
col.
Evo
l. Sy
st. 2
011.
42:4
11-4
40. D
ownl
oade
d fr
om w
ww
.ann
ualr
evie
ws.
org
by C
SIC
- C
onse
jo S
uper
ior
de I
nves
tigac
ione
s C
ient
ific
as o
n 05
/28/
14. F
or p
erso
nal u
se o
nly.
ES42CH19-Boecklen ARI 27 September 2011 14:2
Fish
Mam
mal
sPl
ants
Crust
acea
nsBi
rds
Mol
lusk
sIn
sect
sA
nnelid
s
Het
erok
onts
Fungi
Cnidar
ians
Gre
en a
lgae
Red a
lgae
Echin
oder
ms
Reptil
esA
mphib
ians
Repr
esen
tati
on in
the
liter
atur
e (%
)
Repr
esen
tati
on in
the
liter
atur
e (%
)
Repr
esen
tati
on in
the
liter
atur
e (%
)
Repr
esen
tati
on in
the
liter
atur
e (%
)
0
5
10
15
20
25
30
0
10
20
30
40
0
10
20
30
40
0
10
20
30
40
50
a b
c d
Mar
ine:
oce
anEs
tuar
ies
Tem
perat
e gra
ssla
ndLa
ke
Trop
ical
fore
stRi
ver
Tem
perat
e fo
rest
Bore
al fo
rest
Mar
ine:
coa
stal
Exper
imen
tal
Coral
reef
s
Arid
/sem
iarid
gra
ssla
nd
Arc
tic tu
ndra
Fres
hwat
er w
etla
ndsD
eser
t
Alp
ine
tundra
Bloo
d pla
sma
Whol
e bod
yM
uscl
eLe
afFe
ather
Bone
Colla
genH
air
Teet
h
Whol
e blo
odSk
inO
tolit
h
Hai
r and m
uscl
eBe
akLi
ver
Fece
sEg
gRo
otSt
emFl
ower
Para
site
Carniv
ore
Om
nivor
e
Prod
ucer
Her
bivor
eD
etrit
ivor
e
Det
ritiv
ore/
omniv
ore
Figure 1Relative frequency histogram of metadata from 249 studies published on stable isotope analysis (SIA) in 2007–2009. The studiesprovided 3,791 separate determinations of carbon and/or nitrogen isotopic signatures. These determinations are sorted by (a) taxonomicgroup (greater than 0.7% representation), (b) biome, (c) tissue examined (greater than 0.47% representation), and (d ) trophic level.
aquatic ecosystems and to both plant and animal consumers. For example, Doucett et al. (1996)use an end-member model to determine the relative amount of carbon in fish tissues derived fromallochthonous versus autochthonous sources. Millett et al. (2003) used an end-member model todetermine the relative contribution of insect prey to the nitrogen content of sundews.
Euclidean-distance models (Kline et al. 1993, Ben-David et al. 1997) were proposed to distin-guish among three or more sources using two isotopes. However, Phillips (2001) notes severalshortcomings with these models. First, when the number of sources exceeds the number of iso-topes by more than one, the models are underdetermined. Underdetermined systems of equationshave an infinite number of solutions. Second, the models underestimate the contributions of themost commonly used source and overestimate the contributions of less used sources. The models
416 Boecklen et al.
Ann
u. R
ev. E
col.
Evo
l. Sy
st. 2
011.
42:4
11-4
40. D
ownl
oade
d fr
om w
ww
.ann
ualr
evie
ws.
org
by C
SIC
- C
onse
jo S
uper
ior
de I
nves
tigac
ione
s C
ient
ific
as o
n 05
/28/
14. F
or p
erso
nal u
se o
nly.

ES42CH19-Boecklen ARI 27 September 2011 14:2
assume that all sources are actually consumed and that the partitioning of sources is the same forboth elements. Last, the models return estimates of source contributions even when the consumer’sisotopic ratios do not overlap those of the sources.
Phillips & Gregg (2001) present a mixing model that addresses most, but not all, the short-comings identified for the Euclidean-distance models. The Phillips & Gregg (2001) model isstructurally the same as the linear model proposed by Kwak & Zedler (1997). Perhaps the majoradvance over previous models is that the Phillips & Gregg (2001) model generates error estimatesabout predicted source contributions (http://www.epa.gov/wed/pages/models.htm). It is im-portant to note, however, that the error estimates assume no covariation between isotopic ratios.This assumption is unlikely to be met in most systems. In addition, the Phillips & Gregg (2001)model assumes that the partitioning of sources is the same for all elements. Phillips & Koch (2002)relax this assumption by incorporating concentration dependency.
As noted above, when the number of unknowns (sources) exceeds the number of equations(number of isotopes + 1), the system of equations is underdetermined and has an infinite numberof solutions. Two strategies have been proposed to address undetermined models: combiningsources and the IsoSource mixing model (Phillips & Gregg 2003). Phillips et al. (2005) presenttwo strategies for combining sources and discuss the relative merits of both approaches. TheIsoSource model has, in many ways, become the workhorse of isotopic diet reconstruction. Itis the most commonly used model by ecologists (see below). The IsoSource model considersall possible contributions of each source. These are incremented in small units (typically 1%),and combinations that sum to the consumer’s isotopic signature (within a tolerance of 0.1 permil) are considered feasible solutions. A frequency distribution of the percentage contributionof each source is generated. Of course, this approach does not solve the problems inherent withundetermined systems of equations. Phillips & Gregg (2003) clearly recognize the problem asthey encourage researchers to report the range of percentage contribution of each source ratherthan simply reporting point estimates.
Wilson et al. (2009) adapted the IsoSource model to account for concentration dependency.The IsoSource model and the concentration-dependent IsoSource model (two isotopes and foursources) were applied to a variety of consumers inhabiting Apalachicola Bay, FL, and substantialdifferences were observed between the models. Wilson et al. (2009) conclude that concentrationeffects are a significant factor in determining source contributions and that mixing models shouldbe modified to incorporate them.
Rasmussen (2009) presents a spatially explicit, gradient-based mixing model to examine con-tributions of sources whose isotopic signatures vary little but exhibit spatial gradients. Rasmussen(2009) argues that this approach may be useful especially in river systems where isotope ratiosof autochthonous carbon exhibit gradients along rivers, but the isotope ratios of allochthonouscontributions do not.
Bayesian Models
Bayesian models offer an alternative to the IsoSource family of models. Proponents of Bayesianmodels argue that such models better accommodate uncertainties regarding consumer-resourcediscrimination, variation in consumer and source isotopic signatures, and external sources ofvariation not directly connected to isotopic variation per se (Ogle et al. 2004, Moreno et al. 2010).Proponents also claim that Bayesian models can solve the problem of undetermined systems ofequations common in mixing models (Moore & Semmens 2008, Parnell et al. 2010). We disagree.Bayesian methods may represent an alternative to other methods (e.g., maximum entropy methods)for constraining the set of feasible solutions in undetermined systems of equations, but they do not
www.annualreviews.org • SIA in Trophic Ecology 417
Ann
u. R
ev. E
col.
Evo
l. Sy
st. 2
011.
42:4
11-4
40. D
ownl
oade
d fr
om w
ww
.ann
ualr
evie
ws.
org
by C
SIC
- C
onse
jo S
uper
ior
de I
nves
tigac
ione
s C
ient
ific
as o
n 05
/28/
14. F
or p
erso
nal u
se o
nly.
ES42CH19-Boecklen ARI 27 September 2011 14:2
eliminate the problem. Freely available Bayesian mixing model software includes MixSIR (Moore& Semmens 2008, Jackson et al. 2009, Semmens et al. 2009) and SIAR (Parnell et al. 2010).
Model Selection and Application
An electronic literature search using the ISI Web of Knowledge with the keywords “stable isotopemixing models” yielded 119 studies that form the basis of the following analyses. These studiesgenerated 1,481 separate mixing models. In terms of model selection, the literature is dominatedby the IsoSource model (Phillips & Gregg 2003), as 37% (47/127; several studies used morethan one model) of all studies used it (Figure 2a). End-member models were used in roughly15% of studies, whereas Bayesian models were used in only approximately 5% of studies. We arenot surprised by the low representation of Bayesian models in the literature, as these models arerelatively new (e.g., Semmens et al. 2009, Ward et al. 2010).
The studies exhibited substantial differences in their use of consumer-resource discriminationvalues, treatment of source categories, and inclusion of supporting evidence. Most studies (approx-imately 92%) used mixing models that incorporated values of consumer-resource discrimination(Figure 2b). Of these, only approximately 8% (9/110) used estimates derived directly from thestudy organisms; the majority used values extracted from the literature. Most studies (roughly83%) used sources that represented a combined category of separate dietary items (Figure 2c).For example, Reich & Worthy (2006) used a two-isotope, three-source model to characterizethe diets of manatees. The three sources were marine, estuary, and freshwater vegetation. Eachvegetation category represented the average isotopic signature of 7–13 species. In most instances,an isotopic ratio was estimated for a mixture of dietary items treated as a single sample. It wascommon practice to present diet reconstructions based solely on the results of mixing models andwithout benefit of supporting evidence (Figure 2d ). Only about 21% of studies complementedthe results of the mixing model analysis with gut-content or fecal data, and only about 4% providedexperimental evidence.
The studies covered a broad taxonomic range of consumers (Figure 2e), but were dominatedby fish, crustaceans, mollusks, and aquatic insects. In fact, the studies were directed primarily atwet things and wet places—approximately 71% of the studies examined marine or aquatic taxa andonly approximately 20% of the studies represented the terrestrial biome (Figure 2f ). Terrestrialinsects are clearly underrepresented in the SIA literature (Yarnes et al. 2005), whereas vertebratesmay be overrepresented.
At the level of individual mixing models, the literature is dominated by one-isotope, two-sourcemodels and two-isotope, four-source models (Figure 3a). Of the two-isotope models, approxi-mately 68% of models are underdetermined. Fish, crustaceans, mollusks, and aquatic insectscollectively represent roughly 65% of all mixing models (Figure 3b).
Predictive Power
Mixing models return estimates of the percentage contribution of each dietary source to theconsumer’s overall diet. Consequently, the predictive power of mixing models will be relateddirectly to the precision of these point estimates. Studies using linear models report standarddeviations as estimates of the variation about point estimates. Bayesian models typically report95% confidence intervals or ranges, whereas IsoSource models (Phillips & Gregg 2003) mostfrequently report ranges (Table 2). Models based on the Phillips & Gregg (2001) model reportstandard errors, standard deviations, or 95% confidence intervals. It is surprising that roughly 43%of studies do not present error estimates of any sort. We have excluded Euclidian-distance models
418 Boecklen et al.
Ann
u. R
ev. E
col.
Evo
l. Sy
st. 2
011.
42:4
11-4
40. D
ownl
oade
d fr
om w
ww
.ann
ualr
evie
ws.
org
by C
SIC
- C
onse
jo S
uper
ior
de I
nves
tigac
ione
s C
ient
ific
as o
n 05
/28/
14. F
or p
erso
nal u
se o
nly.

ES42CH19-Boecklen ARI 27 September 2011 14:2
Freq
uenc
y
0
10
20
30
40
50
Freq
uenc
y
0
20
40
60
80
100
Freq
uenc
y
0
20
40
60
80
100
120
Freq
uenc
y
0
20
40
60
80
100
Freq
uenc
y
0
5
10
15
20
25
30
35
Freq
uenc
y
0
5
10
15
20
25
30
a
c d
e f
b
Baye
sian
End m
ember
Eucl
idea
n dis
tance
Linea
rO
ther
Phill
ips
2001
Phill
ips
& G
regg 2
001
Phill
ips
& K
och 2
002
Phill
ips
& G
regg 2
003
Estim
ated
Non
e
Lite
ratu
re v
alue
s
Combin
ed
Dis
tinct
Exper
imen
tal
Non
e
Gut
con
tents
Feca
l anal
ysis
Tunic
ates
Fish
Crust
acea
nsM
ollu
sks
Inse
cts
Bird
sM
amm
als
Annel
ids
Plan
tsSO
M/P
OM
Spid
ers
Reptil
es
Zoop
lankt
onBa
cter
iaCnid
aria
Echin
oder
ms
Nem
atod
es
Oth
er
Mar
ine
Estu
ary
Rive
r
Lake
Terr
estr
ial
Figure 2Frequency histogram of metadata from studies using isotope mixing models for diet reconstruction. Models are characterized by(a) type of model, (b) type of consumer-resource discrimination value, (c) source category, (d ) type of supporting evidence,(e) taxonomic group, and ( f ) ecosystem. Abbreviations: POM, particulate organic matter; SOM, soil organic matter.
www.annualreviews.org • SIA in Trophic Ecology 419
Ann
u. R
ev. E
col.
Evo
l. Sy
st. 2
011.
42:4
11-4
40. D
ownl
oade
d fr
om w
ww
.ann
ualr
evie
ws.
org
by C
SIC
- C
onse
jo S
uper
ior
de I
nves
tigac
ione
s C
ient
ific
as o
n 05
/28/
14. F
or p
erso
nal u
se o
nly.

ES42CH19-Boecklen ARI 27 September 2011 14:2
Freq
uenc
y
0
100
200
300
400
500
600
a
Freq
uenc
y
0
50
100
150
200
250
300
b
3 is
otop
es, 6
sou
rces
1 is
otop
e, 2
sou
rces
1 is
otop
e, 3
sou
rces
1 is
otop
e, 4
+ s
ourc
es
2 is
otop
es, 2
sou
rces
2 is
otop
es, 3
sou
rces
2 is
otop
es, 4
sou
rces
2 is
otop
es, 5
sou
rces
2 is
otop
es, 6
+ s
ourc
es
3 is
otop
es, 4
sou
rces
Nem
atod
es
Mol
lusk
sFi
sh
Crust
acea
ns
Aqua
tic in
sect
sBi
rds
Plan
tsIn
sect
sA
nnelid
sM
amm
als
Spid
ers
SOM
POM
Zoop
lankt
on
Echin
oder
ms
Reptil
esBa
cter
iaCnid
aria
Tunic
ates
Figure 3Frequency histograms of isotope mixing models by (a) number of isotopes and sources and (b) taxonomic groups. Abbreviations: POM,particulate organic matter; SOM, soil organic matter.
from this analysis because of their limited use in the literature and because of many concerns raisedby Phillips & Gregg (2001) regarding their construction and use.
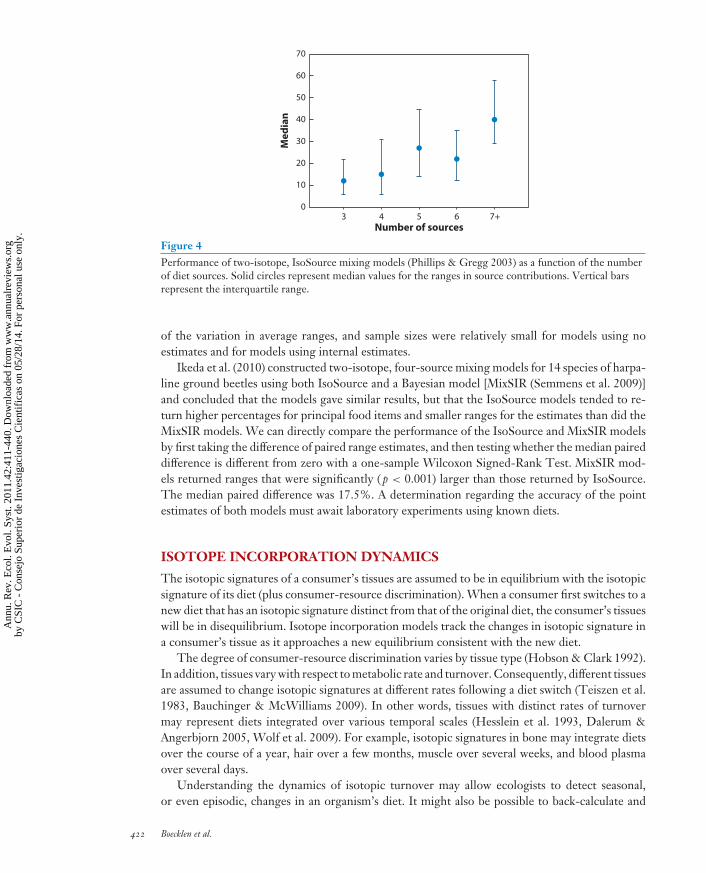
Direct comparisons of the predictive power of the various models are complicated by differ-ences in the type of error estimate used. Nevertheless, several generalizations obtain. First, theone-isotope, two-source models [linear, end-member (Phillips & Gregg 2001, 2003; Phillips &Koch 2002)] exhibit roughly similar performance. These models generally estimate the percent-age contribution of dietary items with a 95% confidence interval that spans approximately 33%(weighted average of 95% confidence intervals and 4× standard errors). Second, the two-isotope,three-source models based on the Phillips & Gregg (2001) model generally exhibit less preci-sion than do their one-isotope, two-source counterparts. Third, the two-isotope, three-sourceIsoSource models (Phillips & Gregg 2003) return relatively precise estimates with a median range(n = 291) that spans only 12%. Last, as the IsoSource models become increasingly underdeter-mined, the median of range estimates generally increases (Figure 4).
Phillips & Gregg (2001) present a sensitivity analysis that indicates that the level of precision ofpoint estimates should be inversely related to the magnitude of the difference in isotopic signaturesof the sources. We have sufficient data to test this proposition for two-isotope IsoSource modelswith three, four, and five-or-more sources. We used linear regression with the average range forsources returned by a given model as the response variable, and range in source carbon signaturesand range in source nitrogen signatures as predictor variables. We found no significant relationshipfor the three-source models ( p = 0.38, R2 = 3.3%). We found a significant relationship with lowexplanatory power for the four-source models ( p = 0.031, R2 = 12.1%), and a highly significantrelationship with moderate explanatory power for the five-or-more source models ( p < 0.001,R2 = 33.5%). In all cases, differences in source nitrogen signatures had the stronger effect. Al-though we consider these results to be highly preliminary, they do suggest that further experimentalinvestigation is warranted.
We also have sufficient data to test for an effect of type of fraction estimates (none, estimated,literature) on the average range returned by two-isotope IsoSource models with three and four
420 Boecklen et al.
Ann
u. R
ev. E
col.
Evo
l. Sy
st. 2
011.
42:4
11-4
40. D
ownl
oade
d fr
om w
ww
.ann
ualr
evie
ws.
org
by C
SIC
- C
onse
jo S
uper
ior
de I
nves
tigac
ione
s C
ient
ific
as o
n 05
/28/
14. F
or p
erso
nal u
se o
nly.
ES42CH19-Boecklen ARI 27 September 2011 14:2
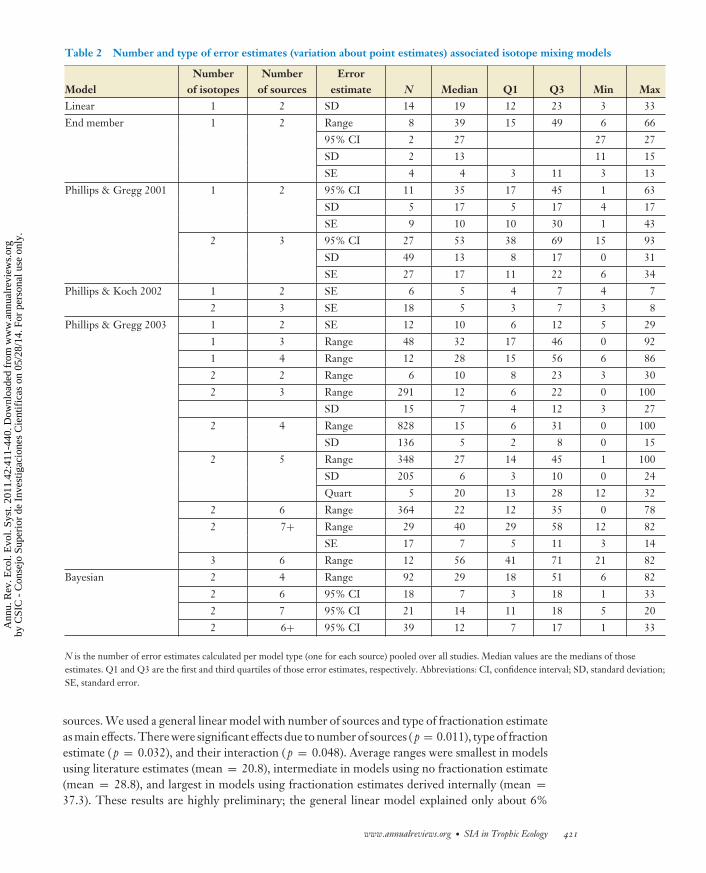
Table 2 Number and type of error estimates (variation about point estimates) associated isotope mixing models
ModelNumber
of isotopesNumber
of sourcesError
estimate N Median Q1 Q3 Min MaxLinear 1 2 SD 14 19 12 23 3 33
End member 1 2 Range 8 39 15 49 6 66
95% CI 2 27 27 27
SD 2 13 11 15
SE 4 4 3 11 3 13
Phillips & Gregg 2001 1 2 95% CI 11 35 17 45 1 63
SD 5 17 5 17 4 17
SE 9 10 10 30 1 43
2 3 95% CI 27 53 38 69 15 93
SD 49 13 8 17 0 31
SE 27 17 11 22 6 34
Phillips & Koch 2002 1 2 SE 6 5 4 7 4 7
2 3 SE 18 5 3 7 3 8
Phillips & Gregg 2003 1 2 SE 12 10 6 12 5 29
1 3 Range 48 32 17 46 0 92
1 4 Range 12 28 15 56 6 86
2 2 Range 6 10 8 23 3 30
2 3 Range 291 12 6 22 0 100
SD 15 7 4 12 3 27
2 4 Range 828 15 6 31 0 100
SD 136 5 2 8 0 15
2 5 Range 348 27 14 45 1 100
SD 205 6 3 10 0 24
Quart 5 20 13 28 12 32
2 6 Range 364 22 12 35 0 78
2 7+ Range 29 40 29 58 12 82
SE 17 7 5 11 3 14
3 6 Range 12 56 41 71 21 82
Bayesian 2 4 Range 92 29 18 51 6 82
2 6 95% CI 18 7 3 18 1 33
2 7 95% CI 21 14 11 18 5 20
2 6+ 95% CI 39 12 7 17 1 33
N is the number of error estimates calculated per model type (one for each source) pooled over all studies. Median values are the medians of thoseestimates. Q1 and Q3 are the first and third quartiles of those error estimates, respectively. Abbreviations: CI, confidence interval; SD, standard deviation;SE, standard error.
sources. We used a general linear model with number of sources and type of fractionation estimateas main effects. There were significant effects due to number of sources ( p = 0.011), type of fractionestimate ( p = 0.032), and their interaction ( p = 0.048). Average ranges were smallest in modelsusing literature estimates (mean = 20.8), intermediate in models using no fractionation estimate(mean = 28.8), and largest in models using fractionation estimates derived internally (mean =37.3). These results are highly preliminary; the general linear model explained only about 6%
www.annualreviews.org • SIA in Trophic Ecology 421
Ann
u. R
ev. E
col.
Evo
l. Sy
st. 2
011.
42:4
11-4
40. D
ownl
oade
d fr
om w
ww
.ann
ualr
evie
ws.
org
by C
SIC
- C
onse
jo S
uper
ior
de I
nves
tigac
ione
s C
ient
ific
as o
n 05
/28/
14. F
or p
erso
nal u
se o
nly.
ES42CH19-Boecklen ARI 27 September 2011 14:2
Number of sources3 4 5 6 7+
Med
ian
0
10
20
30
40
50
60
70
Figure 4Performance of two-isotope, IsoSource mixing models (Phillips & Gregg 2003) as a function of the numberof diet sources. Solid circles represent median values for the ranges in source contributions. Vertical barsrepresent the interquartile range.
of the variation in average ranges, and sample sizes were relatively small for models using noestimates and for models using internal estimates.
Ikeda et al. (2010) constructed two-isotope, four-source mixing models for 14 species of harpa-line ground beetles using both IsoSource and a Bayesian model [MixSIR (Semmens et al. 2009)]and concluded that the models gave similar results, but that the IsoSource models tended to re-turn higher percentages for principal food items and smaller ranges for the estimates than did theMixSIR models. We can directly compare the performance of the IsoSource and MixSIR modelsby first taking the difference of paired range estimates, and then testing whether the median paireddifference is different from zero with a one-sample Wilcoxon Signed-Rank Test. MixSIR mod-els returned ranges that were significantly ( p < 0.001) larger than those returned by IsoSource.The median paired difference was 17.5%. A determination regarding the accuracy of the pointestimates of both models must await laboratory experiments using known diets.
ISOTOPE INCORPORATION DYNAMICS
The isotopic signatures of a consumer’s tissues are assumed to be in equilibrium with the isotopicsignature of its diet (plus consumer-resource discrimination). When a consumer first switches to anew diet that has an isotopic signature distinct from that of the original diet, the consumer’s tissueswill be in disequilibrium. Isotope incorporation models track the changes in isotopic signature ina consumer’s tissue as it approaches a new equilibrium consistent with the new diet.
The degree of consumer-resource discrimination varies by tissue type (Hobson & Clark 1992).In addition, tissues vary with respect to metabolic rate and turnover. Consequently, different tissuesare assumed to change isotopic signatures at different rates following a diet switch (Teiszen et al.1983, Bauchinger & McWilliams 2009). In other words, tissues with distinct rates of turnovermay represent diets integrated over various temporal scales (Hesslein et al. 1993, Dalerum &Angerbjorn 2005, Wolf et al. 2009). For example, isotopic signatures in bone may integrate dietsover the course of a year, hair over a few months, muscle over several weeks, and blood plasmaover several days.
Understanding the dynamics of isotopic turnover may allow ecologists to detect seasonal,or even episodic, changes in an organism’s diet. It might also be possible to back-calculate and
422 Boecklen et al.
Ann
u. R
ev. E
col.
Evo
l. Sy
st. 2
011.
42:4
11-4
40. D
ownl
oade
d fr
om w
ww
.ann
ualr
evie
ws.
org
by C
SIC
- C
onse
jo S
uper
ior
de I
nves
tigac
ione
s C
ient
ific
as o
n 05
/28/
14. F
or p
erso
nal u
se o
nly.

ES42CH19-Boecklen ARI 27 September 2011 14:2
determine the timing of a diet switch (Phillips & Eldridge 2006, Klaassen et al. 2010, Oppel& Powell 2010). Of course, to make these approaches operational, the dynamics of isotopicturnover must be modeled, and the models must be calibrated to the particulars of the systemexamined.
Parameter estimates from incorporation models can be used to estimate tissue-specific isotopichalf-lives. It is important to note, however, that the concept of half-life in isotope incorporationmodels differs from the more widely used concept used in physics and other disciplines. Thetraditional interpretation of half-life is the time required, assuming exponential decay, to reducethe initial amount of something by one half. In isotope incorporation models, half-life measuresthe time required for an isotope ratio to change halfway from its initial equilibrium value to its newequilibrium value. (We suggest the use of isotopic half-life in order to avoid confusion.) Becauseequilibrium values are determined by the isotopic compositions of the diets, estimates of isotopichalf-lives are a function of the tissue and element examined and of the isotopic magnitude of the dietshift. Experimenters have used a wide range of isotopic diet shifts, introducing an additional sourceof variation in estimates of tissue-specific isotopic half-lives. This variation makes comparisonsacross studies complicated and cautions against the use of literature values in modeling isotopicturnover.
Models and Assumptions
There are four major classes of isotope incorporation models: growth-dependent models (Fry &Arnold 1982, Maruyama et al. 2001), time-dependent models (Hobson & Clark 1992, O’Brienet al. 2000, Martinez del Rio & Wolf 2005), growth-and-time-dependent models (Hesslein et al.1993, Carleton & Martinez del Rio 2010), and multi-compartment models (Ayliffe et al. 2004,Cerling et al. 2007, Carleton et al. 2008). Within each major class there are variations.
Growth-dependent models. These models track changes in isotopic ratios as a function of thegrowth of the consumer. Fry & Arnold (1982) and Maruyama et al. (2001) present models of thefollowing forms:
δX (t) = δX (∞) − [δX (0) − δX (∞)][w(t)/w(0)]C andδX (t) = δX (∞) − [δX (0) − δX (∞)][w(0)/w(t)]Ct,
respectively. δX(t) is the isotopic ratio of element X in the consumer’s tissue at time t, δX(∞) is theasymptotic isotopic ratio, δX(0) is the initial isotopic ratio, w(t) is the body mass at time t, and w(0)is the initial body mass. In the Fry & Arnold (1982) model, C is the metabolic decay constant. C isdimensionless and represents the relative contribution of metabolic turnover to changes in isotopicratios. A value of C = −1 indicates turnover due to growth only (simple dilution), whereas greatercontributions of metabolic turnover are indicated as C becomes progressively more negative. It ispossible to solve for half-lives in these models if one knows the parameters of the growth curve asa function of time.
Time-dependent models. These models track changes in isotopic ratios as a function of timeand have the general form
δX (t) = δX (∞) − [δX (∞) − δX (0)]e−λt,
where λ is the turnover rate constant and has units of (time)−1. Isotopic half-life is calculated asln(2)/λ. Martinez del Rio & Anderson-Sprecher (2008) suggest a model where λ is replaced by1/T. T is the average residence time of an element. Isotopic half-lives can be calculated as ln(2)T.
www.annualreviews.org • SIA in Trophic Ecology 423
Ann
u. R
ev. E
col.
Evo
l. Sy
st. 2
011.
42:4
11-4
40. D
ownl
oade
d fr
om w
ww
.ann
ualr
evie
ws.
org
by C
SIC
- C
onse
jo S
uper
ior
de I
nves
tigac
ione
s C
ient
ific
as o
n 05
/28/
14. F
or p
erso
nal u
se o
nly.
ES42CH19-Boecklen ARI 27 September 2011 14:2
Growth-and-time-dependent models. Hesslein et al. (1993) suggest a modification of the abovemodel to account for the joint contributions of growth and metabolism to isotopic turnover. Inparticular, λ is replaced by (k + m), where k is the isotopic turnover constant owing to growthand m is the turnover constant owing to metabolism. The estimation of k typically assumes thatgrowth is related to time as a function of e−kt and is determined either by nonlinear regression ofgrowth versus time or by solving the equation, k = ln[w( f )/w(0)]/t, where t is the time betweeninitial and final measurements, and w(0) and w( f ) are the initial and final masses, respectively.Both k and m are rate constants with units of (time)−1. Nevertheless, many authors report k asgrams per day. Isotopic half-lives can be calculated as ln(2)/(k + m).
The model assumes that growth and metabolism act independently. This assumption is unlikelyto be true in real systems as covariation between body size and metabolism has long been recognized(e.g., Kleiber 1932). This assumption can also cause problems in parameter estimation. Typically,nonlinear regression is used to fit a model with the exponential term, e−βt. Once β is estimated,the metabolic turnover constant is calculated as m = β − k, where k has been estimated asdescribed above. Unless the effects of growth and metabolism act independently on isotopicturnover, then estimates of m are incorrect. In fact, we have seen models that have returned valuesof m < 0. Attempts to partition isotopic turnover into the percentage contributions of growthand metabolism from these models (e.g., MacAvoy et al. 2005, Reich et al. 2008, Buchheister &Latour 2010) are likewise suspect.
Multicompartment models. Ayliffe et al. (2004) developed a time-dependent, exponential modelwith three distinct isotope pools to examine carbon isotopic turnover in tail hair and breath ofhorses following a change from a C3 to C4 diet. The dynamics of both tail hair and breathwere best described by three isotopic pools that exhibited short-, intermediate-, and long-termturnover. Cerling et al. (2007) proposed the reaction progress variable as a means of determiningthe number of isotopic pools. The reaction progress variable (F) measures the degree of progressmade in the approach of the system (F = 0 at t = 0) to a new isotopic equilibrium (F = 1).For a one-pool system, ln(1 − F) = −λt, where λ is the isotopic turnover rate constant. Con-sequently, a plot of ln(1 − F) versus time should be linear with slope = −λ. Deviations froma linear relationship are assumed to indicate the presence of more than one isotope pool (seealso Martinez del Rio & Anderson-Sprecher 2008). Carleton et al. (2008) tested the generality ofmulticompartmental models on a variety of tissues from house sparrows (Passer domesticus). Sometissues were better described by one-compartment models, others by two-compartment models.Significantly, estimates of isotopic half-lives varied by model type. Recently, Carleton & Martinezdel Rio (2010) presented a multicompartment model that includes both growth-dependent andmetabolic-dependent turnover.
We can identify several potentially problematic issues with the application and testing of mul-ticompartmental models. First, a nonlinear relationship between ln(1 – F) and time may obtainfor a variety of reasons other than the presence of multiple isotope pools. For example, valuesof λ may not be invariant temporally as assumed by the models. A nonlinear relationship mightobtain simply from model lack-of-fit—isotopic turnover may be better modeled by higher pow-ered exponential functions (e.g., e−βt, where β = λx and x > 1). Second, Akaike’s informationcriteria are used for model selection. The models are hierarchical in nature, and we suggest us-ing the principle of conditional error to determine whether the inclusion of terms representingadditional isotope pools significantly improves the one-pool model. Last, the models assume thatthe isotope pools act independently. Perhaps a more realistic model would allow the pools tointeract.
424 Boecklen et al.
Ann
u. R
ev. E
col.
Evo
l. Sy
st. 2
011.
42:4
11-4
40. D
ownl
oade
d fr
om w
ww
.ann
ualr
evie
ws.
org
by C
SIC
- C
onse
jo S
uper
ior
de I
nves
tigac
ione
s C
ient
ific
as o
n 05
/28/
14. F
or p
erso
nal u
se o
nly.

ES42CH19-Boecklen ARI 27 September 2011 14:2
Model Application and Isotopic Half-Life Estimates
An electronic literature search returned 75 studies that modeled isotope incorporation dynamics.Collectively, these studies generated 262 separate models for carbon isotopes, 174 for nitrogen,and 15 for sulfur. Of the 75 studies, 37 used time-dependent models, 28 used growth-and-time-dependent models, 9 used compartmental models, and 8 used growth-dependent models. Therewas substantial bias in taxonomic coverage for isotopic half-life determination (growth-dependentmodels excluded), as approximately 80% of studies and 85% of individual models were directedat birds, mammals, and fish (Table 2). Muscle, liver, whole blood, and whole body were the mostcommon tissues examined.
There was considerable variation in carbon isotopic half-lives between taxa (birds, mammals,and fish) and between tissue types (Figure 5). We had estimates of median half-lives for 9 tissuescommon to birds and mammals. The half-lives for mammals were significantly longer than thosefor birds ( p = 0.030; n = 9) as indicated by a Wilcoxon Signed-Rank Test on paired differ-ences. Small sample sizes did not permit a meaningful test for nitrogen isotopic half-lives betweenmammals and birds (n = 3) or for comparisons of birds versus fish or mammals versus fish.
Overall, there was little consistency within a tissue type across taxa. For example, half-livesfor bird and mammal livers were similar (3–7 days), but those for fish were quite distinct(1–7 weeks). Mammal muscles exhibited half-lives on the order of 1–3 months, birds 1–3 weeks, andfish 2–8 weeks. We have sufficient data to test for differences in carbon isotopic half-lives betweentaxa (birds, mammals, and fish) and tissue type (muscle, whole blood, liver). There were signifi-cant effects due to taxa ( p < 0.001), tissue type ( p = 0.002), and their interaction ( p = 0.007)as determined by a general linear model. For fish and bird tissues, isotopic half-lives were or-dered: liver < muscle < whole blood. For mammals the order was liver < whole blood < muscle.Differences between tissues were greatest for fish and least for birds.
Fisk et al. (2009) suggest that rates of isotopic change may depend on the direction (enrichedversus depleted) of the diet switch. Juvenile corn snakes exhibited larger metabolic rate constants(thus, smaller isotopic half-lives) when switched to depleted diets (elimination phase) than they didwhen switched to enriched diets (uptake phase). We tested for this pattern in birds, in mammals,and in fish. For each taxon, we restricted the analysis to tissue types that had replication at the levelof direction of diet switch. We used general linear models with tissue and direction as main effectsfor both carbon and nitrogen isotopic half-lives. We found little evidence to support the patternobserved by Fisk et al. (2009). Only mammalian carbon half-lives varied significantly with respectto direction of diet switch ( p = 0.010). This effect was largely due to several unusually large half-lives for muscle. When muscle was excluded from the analysis, there was no longer a significanteffect for direction ( p = 0.124). Of the six possible comparisons (three taxa by two elements),switches to enriched diets had lower half-lives than did switches to depleted diets—a patternqualitatively at odds with that observed by Fisk et al. (2009). Of course, we may have introducedexcessive variation into these tests by combining data from multiple studies. Consequently, wefeel that directionality effects remain an open question.
LIPID EXTRACTION AND CORRECTION
Individuals and tissues within individuals vary in lipid content. Lipids tend to be depleted inheavier 13C isotopes (DeNiro & Epstein 1977, 1978; Focken & Becker 1998). Consequently,comparisons of carbon isotopic ratios between individuals or across species may be confoundedby variation in lipid content (Post et al. 2007). Several chemical procedures have been suggestedto extract lipids from tissue samples prior to isotopic determination (Logan et al. 2008). However,these procedures may introduce their own artifacts as they may affect nitrogen isotopic signatures
www.annualreviews.org • SIA in Trophic Ecology 425
Ann
u. R
ev. E
col.
Evo
l. Sy
st. 2
011.
42:4
11-4
40. D
ownl
oade
d fr
om w
ww
.ann
ualr
evie
ws.
org
by C
SIC
- C
onse
jo S
uper
ior
de I
nves
tigac
ione
s C
ient
ific
as o
n 05
/28/
14. F
or p
erso
nal u
se o
nly.

ES42CH19-Boecklen ARI 27 September 2011 14:2
Isotopic half-life (days)
Breath
Blood serum
Liver
Blood plasma
Kidney
Heart
Fat
Whole blood
Brain
Blood cellular fraction
Skin
Muscle
Fur
Wing membrane
Mammals
Isotopic half-life (days)0 20 40 60 80 100 120
0 20 40 60 80 100 120 140
BreathExcreta
Blood plasmaLiver
Small intestineIntestine
Whole bloodPancreas
GizzardKidney
ProventriculusMuscle
HeartBlood cellular fraction
BrainSkin
ClawBone collagen
Birds
Isotopic half-life (days)0 50 100 150 200 250
Whole body
Heart
Liver
Muscle
Fin
Blood plasma solutes
Mucus
Whole blood
Blood cellular fraction
Fish
Figure 5Median isotopic half-lives by taxa and by tissue types. Horizontal bars represent the interquartile range.
426 Boecklen et al.
Ann
u. R
ev. E
col.
Evo
l. Sy
st. 2
011.
42:4
11-4
40. D
ownl
oade
d fr
om w
ww
.ann
ualr
evie
ws.
org
by C
SIC
- C
onse
jo S
uper
ior
de I
nves
tigac
ione
s C
ient
ific
as o
n 05
/28/
14. F
or p
erso
nal u
se o
nly.
ES42CH19-Boecklen ARI 27 September 2011 14:2
Lipid extractionmethods: acceleratedsolvent extraction (A),Bligh & Dyer (andwith modifications)(B), Soxhlet (S),ultrasonication (U),and other (O)
C:N: carbon-to-nitrogen ratio
LE: lipid extracted
NLE: not lipidextracted
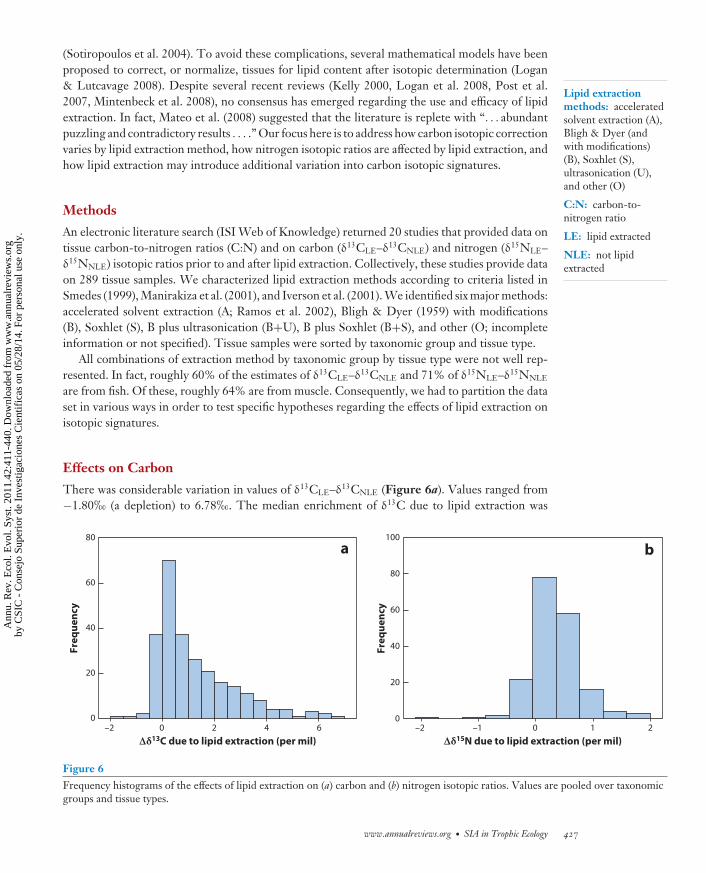
(Sotiropoulos et al. 2004). To avoid these complications, several mathematical models have beenproposed to correct, or normalize, tissues for lipid content after isotopic determination (Logan& Lutcavage 2008). Despite several recent reviews (Kelly 2000, Logan et al. 2008, Post et al.2007, Mintenbeck et al. 2008), no consensus has emerged regarding the use and efficacy of lipidextraction. In fact, Mateo et al. (2008) suggested that the literature is replete with “. . . abundantpuzzling and contradictory results . . . .” Our focus here is to address how carbon isotopic correctionvaries by lipid extraction method, how nitrogen isotopic ratios are affected by lipid extraction, andhow lipid extraction may introduce additional variation into carbon isotopic signatures.
Methods
An electronic literature search (ISI Web of Knowledge) returned 20 studies that provided data ontissue carbon-to-nitrogen ratios (C:N) and on carbon (δ13CLE–δ13CNLE) and nitrogen (δ15NLE–δ15NNLE) isotopic ratios prior to and after lipid extraction. Collectively, these studies provide dataon 289 tissue samples. We characterized lipid extraction methods according to criteria listed inSmedes (1999), Manirakiza et al. (2001), and Iverson et al. (2001). We identified six major methods:accelerated solvent extraction (A; Ramos et al. 2002), Bligh & Dyer (1959) with modifications(B), Soxhlet (S), B plus ultrasonication (B+U), B plus Soxhlet (B+S), and other (O; incompleteinformation or not specified). Tissue samples were sorted by taxonomic group and tissue type.
All combinations of extraction method by taxonomic group by tissue type were not well rep-resented. In fact, roughly 60% of the estimates of δ13CLE–δ13CNLE and 71% of δ15NLE–δ15NNLE
are from fish. Of these, roughly 64% are from muscle. Consequently, we had to partition the dataset in various ways in order to test specific hypotheses regarding the effects of lipid extraction onisotopic signatures.
Effects on Carbon
There was considerable variation in values of δ13CLE–δ13CNLE (Figure 6a). Values ranged from−1.80� (a depletion) to 6.78�. The median enrichment of δ13C due to lipid extraction was
Freq
uenc
y
0
20
40
60
80
100
b
Δδ13C due to lipid extraction (per mil) Δδ15N due to lipid extraction (per mil)–2 0 2 4 6 –2 –1 0 1 2
Freq
uenc
y
0
20
40
60
80
a
Figure 6Frequency histograms of the effects of lipid extraction on (a) carbon and (b) nitrogen isotopic ratios. Values are pooled over taxonomicgroups and tissue types.
www.annualreviews.org • SIA in Trophic Ecology 427
Ann
u. R
ev. E
col.
Evo
l. Sy
st. 2
011.
42:4
11-4
40. D
ownl
oade
d fr
om w
ww
.ann
ualr
evie
ws.
org
by C
SIC
- C
onse
jo S
uper
ior
de I
nves
tigac
ione
s C
ient
ific
as o
n 05
/28/
14. F
or p
erso
nal u
se o
nly.

ES42CH19-Boecklen ARI 27 September 2011 14:2
KW: Kruskal-Wallistest
0.975 δ13C (Wilcoxon Signed-Rank Test p < 0.001; 95% Wilcoxon confidence interval: 0.800�,1.170�).
We suspect that some of this variation may be attributable to the lipid extraction method.We had sufficient data to test for differences in extraction methods (A, B, S, B+U, B+S) forfish muscle. There were marginally significant differences between methods as determined by aKruskal-Wallis Test (KW) ( p = 0.065; n = 117). The greatest differences in δ13CLE–δ13CNLE
were with B and B+U, while the smallest were with S.A substantial part of the variation in δ13CLE–δ13CNLE is due to differences in tissue type. There
were highly significant differences between liver, bone, and muscle within fish (KW; p < 0.001;n = 133). The median difference was 0.19� for bone, 0.64� for muscle, and 4.98� for liver.The small median difference for muscle is surprising, given how often researchers correct for lipidsin muscle samples and given the widely held assumption that fish tissues are relatively lipid-rich(Portner 2002). Differences of magnitudes observed here call into question the need for lipidcorrection of muscle and bone tissues.
There was also substantial variation in δ13CLE–δ13CNLE due to taxonomic group. We hadsufficient data to test for differences between birds, fish, and mammals with respect to muscle.A Kruskal-Wallis Test indicated significant differences between taxa ( p < 0.001; n = 142). Themedian difference was 0.70� for fish, 0.20� for birds, and −0.04� for mammals. Once again,these results challenge the need to lipid-correct muscle tissues.
Lastly, we have sufficient data to test whether variation in δ13CLE–δ13CNLE can be attributedto habitat. There were significant differences between marine, terrestrial, and freshwater birdsin median differences in muscle (KW; p = 0.028; n = 31). Median differences were 0.60�for marine birds, 0.02� for freshwater birds, and −0.01� for terrestrial birds. There were alsosignificant differences between marine, estuarine, and freshwater fishes (KW; p = 0.036; n = 94).Median differences were 1.10� for marine fish, 0.49� for estuarine fish, and 0.50� for freshwaterfish.
Effects on Nitrogen
There was substantial variation in δ15NLE–δ15NNLE owing to lipid extraction (Figure 6b). Valuesranged from −2.11� to 2.00�. The median difference (0.30�) was significantly different from0.0�, as determined by a Wilcoxon Signed-Rank Test ( p < 0.001; n = 185). A 95% Wilcoxonconfidence interval spanned 0.25� to 0.35�.
We had sufficient data to test for differences in δ15NLE–δ15NNLE between taxa (fish, birds, andmammals) and between extraction methods (B and S). A general linear model indicated signifi-cant differences between extraction methods ( p = 0.012) and marginally significant differencesbetween taxa ( p = 0.074). The interaction effect was not significant ( p = 0.294).
The magnitude of δ15N enrichment following lipid extraction was greatest for the Bligh &Dyer (1959) method with ultrasonication (B+U) for data pooled across taxa and tissue types. Themedian enrichment for method B was 0.30�, while that for B+U was 0.71�. The differencein these medians (0.41�) represents the added enrichment due to ultrasonication alone. Whilewe consider these results to be highly preliminary, they do suggest that further experimentalinvestigation is warranted.
Lipid Correction Models
Various mathematical corrections, or lipid normalizations, have been suggested to “correct”nonlipid-extracted tissue samples in postisotopic analysis (Kiljunen et al. 2006, Post et al. 2007).
428 Boecklen et al.
Ann
u. R
ev. E
col.
Evo
l. Sy
st. 2
011.
42:4
11-4
40. D
ownl
oade
d fr
om w
ww
.ann
ualr
evie
ws.
org
by C
SIC
- C
onse
jo S
uper
ior
de I
nves
tigac
ione
s C
ient
ific
as o
n 05
/28/
14. F
or p
erso
nal u
se o
nly.

ES42CH19-Boecklen ARI 27 September 2011 14:2
CSIA: compound-specific isotopeanalysis
IRMS: isotope-ratiomass spectrometer
EA-IRMS: elementalanalyzer-IRMS
The models relate δ13CLE–δ13CNLE to C:N ratios (or in a few cases,%lipids or %C) and fall intothree major categories: linear, mass-balance, and nonlinear models. Linear models are most ap-propriate for relatively low values of C:N (i.e., 2 < C:N < 10), while nonlinear models are usedover a broader range of C:N values (2 < C:N < 63). Mass-balance models typically assume thattissue samples are composed of only protein and lipids and require estimates of C:N ratios ofpure proteins specific to a given tissue (Sweeting et al. 2006). Lipid correction models vary greatlyin terms of predictive power (0.25 < R2 < 0.96) and in terms of generality; many authors addadditional parameters to fine-tune a more general model to their specific systems. Consequently,the number of parameters varies from two in linear models to eight in some nonlinear models. Itis not uncommon to use literature values for several of these parameters.
COMPOUND-SPECIFIC ISOTOPE ANALYSIS
Analytical techniques are now readily available for the measurement of isotope ratios from in-dividual compounds (Krummen et al. 2004, Sessions 2006), known as compound-specific iso-tope analysis (CSIA), primarily through the coupling of capillary gas-chromatography or liquid-chromatography systems to an isotope-ratio mass spectrometer (IRMS). Applications of CSIA introphic ecology center on the stable isotopic measurement of two of the major biological macro-molecules: amino acids (e.g., Fantle et al. 1999, Fogel & Tuross 2003) and fatty acids (e.g., Hammeret al. 1998, Morrison et al. 2010). As the metabolism and biochemistry of these compounds aregenerally well known, CSIA has the potential to increase greatly the resolution of SIA in forag-ing studies and to elucidate underlying physiological assumptions concerning the stable isotopeecology of organisms.
Advantages
In general, CSIA may provide greater clarification of foraging studies than bulk analysis alone(elemental analyzer isotope-ratio mass spectrometry, EA-IRMS). First, isotopic signatures esti-mated by averaging over individual constituent compounds closely agree with those estimateddirectly from bulk tissues (Popp et al. 2007, McMahon et al. 2010, Morrison et al. 2010). How-ever, isotopic variation among individual compounds produces a much greater range of isotopicvalues, and therefore, the potential for additional ecological information. Second, the interpreta-tion of CSIA requires fewer assumptions than bulk isotopic values. Specifically, the metabolic andphysiological forces affecting isotopic values of a single group of compounds are less numerous,and often better understood, than the diversity of forces that are known to affect bulk tissues.Further, because the sample matrix is less complicated and individual compounds are separated,concerns about sample contamination are often less grave.
Amino Acids
The carbon and nitrogen isotopes found in amino acids reflect both diet composition and metabolicprocesses. Additionally, hydrogen isotopes of amino acids may also provide source informationregarding drinking water, and ultimately, geographic origin. To date, applications using oxygenisotopes of amino acids have not been published.
Average amino acid δ15N mirrors bulk δ15N (McClelland & Montoya 2002); however, the rangeof δ15N is much greater for amino acids than for bulk tissues. For example, Lorrain et al. (2009)report a δ15N range of 3.4� for blood samples from penguin chicks, but a 26.2� δ15N range foramino acids in the same experimental group, as some amino acids are strongly fractionated relative
www.annualreviews.org • SIA in Trophic Ecology 429
Ann
u. R
ev. E
col.
Evo
l. Sy
st. 2
011.
42:4
11-4
40. D
ownl
oade
d fr
om w
ww
.ann
ualr
evie
ws.
org
by C
SIC
- C
onse
jo S
uper
ior
de I
nves
tigac
ione
s C
ient
ific
as o
n 05
/28/
14. F
or p
erso
nal u
se o
nly.
ES42CH19-Boecklen ARI 27 September 2011 14:2
FAME: fatty acidmethyl ester
to diet, whereas others are not. The pattern of isotopic discrimination between amino acids appearsto be predictable based on differences in metabolic processing (Chikaraishi et al. 2009). This hasled to the categorization of trophic and source amino acids (McClelland & Montoya 2002, Poppet al. 2007). Trophic amino acids are strongly fractionated relative to diet and include glutamicacid, alanine, aspartic acid, leucine, isoleucine, and proline, whereas source amino acids are notstrongly fractionated relative to diet and include glycine, phenylalanine, and histidine. Importantly,Chikaraishi et al. (2009) and others (e.g., Olson et al. 2010) suggest that the comparison of trophicand source amino acid δ15N may allow for the trophic placement of organisms in cases where thedirect measurement of producers is not feasible.
Average amino acid δ13C also mirrors that of bulk tissues (McMahon et al. 2010). The carbonisotopic signatures of amino acids are largely defined by the differences between essential andnonessential amino acids. Essential amino acids appear to be very conservative indicators of diet,while nonessential amino acids may show increased or decreased isotopic discrimination, reflectingvariation in amino acid catabolism as well as the various origins of carbon skeletons (metabolites ofglycolysis or the citric acid cycle) used during de novo amino acid synthesis. In general, synthesisof nonessential amino acids should decrease as the protein content of diet increases ( Jim et al.2006), reflecting rates of direct incorporation, but exceptions have been found (McMahon et al.2010). Amino acid δ13C may also indicate the degree of carnivory in omnivores, as essential aminoacids should be preferentially derived from high-protein animal sources (Fogel & Tuross 2003).
Presently, only scant effort has been directed at understanding the δD of amino acids. However,early studies indicate that hydrogen isotopes of amino acids may be particularly useful. Usingbacterial cultures grown with deuterium-labeled water and growth media, Fogel and colleaguesdetermined that while δD of essential amino acids matched the δD of diet, the δD of nonessentialamino acids instead matched that of the supplied water (Fogel et al. 2010). Although additionalstudy of δD of amino acids in other organisms and natural conditions is required, the utility of thedual tracer presented by hydrogen isotopes of amino acids would add a desirable spatial componentto stable isotope applications in foraging studies.
Fatty Acids
Fatty acid profiling of fatty acid methyl esters (FAMEs) has been used extensively in foragingstudies, especially in marine systems (Iverson et al. 2004, Loseto et al. 2009). However, untilrecently (Hammer et al. 1998, Chamberlain et al. 2006, Budge et al. 2008), the CSIA of FAMEhas been restricted to a handful of marine (e.g., Uhle et al. 1997, McLeod & Wing 2007, Paceet al. 2007) and soil ecosystem studies (e.g., Zak & Kling 2006). CSIA of FAME has the advantageof providing both fatty acid profiles and isotopic information for dietary studies. The δ13C ofbulk carbon is similar to the pooled isotopic value of the individual FAME (Morrison et al. 2010);however, individual storage fatty acid will differ from dietary fatty acid due to subsequent chainelongation and dehydrogenation as well as turnover processes (Stott et al. 1997, Hammer et al.1998). This is not the case for essential fatty acids, such as omega fatty acids (e.g., linoleic acid18:2n–6), as this group of fatty acids is directly incorporated and represents dietary fatty acids(Stott et al. 1997).
Limitations
CSIA is not, however, a panacea and bears some notable limitations. First, in contrast to bulkisotope studies, CSIA applications have been limited to the stable isotopes of carbon, nitrogen
430 Boecklen et al.
Ann
u. R
ev. E
col.
Evo
l. Sy
st. 2
011.
42:4
11-4
40. D
ownl
oade
d fr
om w
ww
.ann
ualr
evie
ws.
org
by C
SIC
- C
onse
jo S
uper
ior
de I
nves
tigac
ione
s C
ient
ific
as o
n 05
/28/
14. F
or p
erso
nal u
se o
nly.

ES42CH19-Boecklen ARI 27 September 2011 14:2
DEB: dynamic energybudget
DIB: dynamic isotopebudget
and hydrogen; oxygen and sulfur techniques have not been well demonstrated and pose significantanalytical problems to date (Sessions 2006).
The precision of CSIA also often varies dramatically between compounds, presumably throughdifferences in combustion and chromatography. For example, Popp et al. (2007) report a repro-ducibility range of 0.1–4.4� for δ15N measurements of individual amino acids (average: 1.4�);similar values have been reported elsewhere for both amino acids and other compounds (Fogel& Tuross 2003, McCarthy et al. 2007). In contrast, the precision of δ15N from bulk analysis viaEA-IRMS is routinely near 0.2�. Sufficient separation of compounds and strict data processingare critical (Ricci et al. 1994). Additionally, for many nonvolatile compounds, compounds must bederivatized prior to analysis by gas chromatography. Problematically, the derivative molecule willinevitably contain some nonanalyte carbon and/or nitrogen, forcing the measured isotope-ratioto be corrected, thereby leading to additional measurement error.
ISOTOPIC ROUTING
The differential incorporation of dietary macronutrients into various tissues poses problems fordiet reconstruction using stable isotopes (Schwarcz 1991). One example of isotopic routing in-volves the carbon isotope variation of bone. Carbon in bone collagen originates disproportion-ately from dietary protein due to the necessary recycling of essential amino acids, whereas theapatite carbon that originates from blood bicarbonate should be isotopically similar to bulk diet(Ambrose & Norr 1992). Unfortunately, the problem of isotopic routing is not limited to bone.For example, Podlesak & McWilliams (2006) demonstrate that the δ13C of protein-rich tissuesof yellow-rumped warblers (Dendroica coronata) fed a high-protein diet was derived equally fromprotein and nonprotein dietary sources, while those fed a low-protein diet derived most carbonfrom sources other than dietary protein. Additionally, variation in consumer-diet discriminationwas amplified for δ15N in low-protein diets, presumably due to the homogenization of amine ni-trogen during transamination reactions. A companion study of δ13C of storage lipids (Podlesak &McWilliams 2007) also demonstrated that consumer-diet discrimination was highest in low-lipiddiets. High-lipid diets result in storage lipids with similar isotopic composition (Stott et al. 1997,Podlesak & McWilliams 2007). Similarly, Voigt et al. (2008) found that the δ13C of breath CO2
from short-tailed bats, Carollia perspicillata, was derived primarily from nectar and fruit sources,while the δ13C of bat wing tissue matched the δ13C from protein-rich insect prey. Significantisotopic routing of dietary protein has been demonstrated in omnivorous fish, as well (Kelly &Martinez del Rio 2010). These findings pose serious problems for foraging studies that includeomnivores, as diet estimation from certain tissues may require prior knowledge of dietary proteincontent and quality.
Isotopic routing also poses significant problems for the application of mixing models, yieldingbiased results that may over- or underestimate the contribution of various sources to diet. Whileisotopic routing can be easily estimated by measuring different tissues under controlled-diets andconditions, only limited attempts have been made to model the phenomenon. The primary difficul-ties come in modeling the complexity of diet variation and metabolism, and the parameterization ofsubsequent models. Pecquerie and colleagues (2010) extend dynamic energy budget (DEB) mod-eling (Kooijman 2010) to explore the impact of metabolism on the flux of stable isotopes withinorganisms. Their dynamic isotope budget (DIB) specifically defines points of isotopic discrim-ination during metabolism, while incorporating the processes of turnover and isotopic routing.A promising application of DIB modeling involves the identification of key metabolic processesand physiological traits associated with patterns of isotopic variation in organisms, including iso-topic routing. Another, presently more utilitarian, model presented by Martinez del Rio & Wolf
www.annualreviews.org • SIA in Trophic Ecology 431
Ann
u. R
ev. E
col.
Evo
l. Sy
st. 2
011.
42:4
11-4
40. D
ownl
oade
d fr
om w
ww
.ann
ualr
evie
ws.
org
by C
SIC
- C
onse
jo S
uper
ior
de I
nves
tigac
ione
s C
ient
ific
as o
n 05
/28/
14. F
or p
erso
nal u
se o
nly.

ES42CH19-Boecklen ARI 27 September 2011 14:2
(2005) attempts to account for isotopic routing within the framework of a linear mixing model. Inprinciple, this model adjusts the mixing line to account for the fractional abundance of protein inthe diet, as well as the quality of protein. However, additional research is still needed to determinethe rates of the direct incorporation and endogenous production of amino acids under differentdietary compositions (e.g., Jim et al. 2006).
CONCLUSIONS
The eminent statisticians George Box and Norman Draper once remarked, “Remember that allmodels are wrong; the practical question is how wrong do they have to be to not be useful”(Box & Draper 1987). In many ways, similar considerations face stable isotope ecologists. On onehand, SIA offers great promise to trophic ecology, allowing investigation of species that wouldnot be tractable using traditional techniques. On the other hand, much variation in stable isotopemetrics remains unexplained, hindering the development of statistically robust predictive models.All things considered, we suspect that SIA in trophic ecology will remain a vigorous researchprogram.
SIA in trophic ecology works best for systems for which key isotopic parameters have been cal-ibrated with laboratory and field data. As literature values are substituted for these parameters, thepredictive power of models declines and inferences become increasingly limited; the models mayserve to illustrate broad patterns, but it is unlikely that they can define diets and trophic positionsreliably and precisely. A fundamental challenge facing stable isotope ecology is an understand-ing of how error (variation) in isotopic signatures propagates throughout models and ecologicalsystems, and to what degree this error limits inferences derived from SIA.
SUMMARY POINTS
1. Experimentation is still a minor component of SIA in trophic ecology. This is disap-pointing given the numerous and repeated calls for more laboratory experiments (e.g.,Haines 1976, Gannes et al. 1997, Martinez del Rio et al. 2009).
2. SIA in trophic ecology is unequally focused across taxonomic groups and across majorhabitats. In fact, the literature appears inordinately concerned with wet things and wetplaces.
3. The use of mixing models for diet reconstruction is characterized by an excessive useof underdetermined models, overreliance on literature values for key parameters, and ageneral lack of experimental or complementary evidence.
4. There is substantial unexplained variation in isotopic half-lives within a given tissue,across taxa, and across tissue types. The assumption that a given tissue type will integratediets over a consistent time frame for a diverse set of systems appears to be unwarranted.
5. The appropriateness of lipid correction varies according to taxonomic groups, methodof extraction, habitat, and tissue type. The potential of lipid extraction to alter nitrogenisotopic ratios may introduce unwanted bias into SIA.
6. Compound-specific stable isotope analysis is a promising development in SIA. However,refinement of analytical techniques and increased experimental study may be necessaryto make the approach operational for field-based research.
432 Boecklen et al.
Ann
u. R
ev. E
col.
Evo
l. Sy
st. 2
011.
42:4
11-4
40. D
ownl
oade
d fr
om w
ww
.ann
ualr
evie
ws.
org
by C
SIC
- C
onse
jo S
uper
ior
de I
nves
tigac
ione
s C
ient
ific
as o
n 05
/28/
14. F
or p
erso
nal u
se o
nly.
ES42CH19-Boecklen ARI 27 September 2011 14:2
FUTURE ISSUES
1. We anticipate more efforts directed at quantifying intrapopulation variation in key iso-topic variables, including isotopic ratios, values of consumer-resource discrimination,source utilization, and isotopic turnover rates (Grey et al. 2004, Urton & Hobson 2005,Hatase et al. 2006, Barnes et al. 2008, Anseeuw et al. 2009).
2. At some point, the generation of new models (and variants of existing models) maybecome counterproductive. The field may be best served by a few well-tested models thathave sufficient generality. This may be especially true for the areas of lipid correctionand isotopic incorporation.
3. Continued application and development of compound-specific stable isotope analysis introphic ecology will not only expand the tools and library of SI information available toecologists but also likely shed light on variation in bulk SIA, as well as inform emergingissues such as isotopic routing, turnover, and incorporation dynamics.
DISCLOSURE STATEMENT
The authors are not aware of any affiliations, memberships, funding, or financial holdings thatmight be perceived as affecting the objectivity of this review.
ACKNOWLEDGMENTS
This work was supported, in part, by NSF Grant (DUE: 0926743) to W. Boecklen and A. James.We thank D. Simberloff and M. Ballyk for insightful comments and suggestions.
LITERATURE CITED
Ambrose SH, DeNiro MJ. 1986. The isotopic ecology of East African mammals. Oecologia 69:395–406Ambrose SH, Norr L. 1992. On stable isotopic data and prehistoric subsistence in the Soconusco Region.
Curr. Anthropol. 33:401–4Anseeuw D, Guelinckx J, Snoeks J. 2009. Differences in stable isotope composition within and among zoo-
planktivorous Utaka cichlid populations from Lake Malawi. Afr. J. Ecol. 48:378–85Ayliffe LK, Cerling TE, Robinson T, West AG, Sponheimer M, et al. 2004. Turnover of carbon isotopes in
tail hair and breath CO2 of horses fed an isotopically varied diet. Oecologia 139:11–22Barnes C, Jennings S, Polunin NVC, Lancaster JE. 2008. The importance of quantifying inherent variability
when interpreting stable isotope field data. Oecologia 155:227–35Bauchinger U, McWilliams S. 2009. Carbon turnover in tissues of a passerine bird: allometry, isotopic clocks,
and phenotypic flexibility in organ size. Physiol. Biochem. Zool. 82:787–97Bearhop S, Adams CE, Waldron S, Fuller RA, Macleod H. 2004. Determining trophic niche width: a novel
approach using stable isotope analysis. J. Anim. Ecol. 73:1007–12Bearhop S, Teece MA, Waldron S, Furness RW. 2000. Influence of lipid and uric acid on δ13C and δ15N
values of avian blood: implications for trophic studies. Auk 117:504–7Ben-David M, Flynn RW, Schell DM. 1997. Annual and seasonal changes in diets of martens: evidence from
stable isotope analysis. Oecologia 111:280–91Bligh EG, Dyer WJ. 1959. A rapid method of total lipid extraction and purification. Can. J. Biochem. Physiol.
37:911–17Bosley KL, Witting DA, Chambers RC, Wainright SC. 2002. Estimating turnover rates of carbon and nitrogen
in recently metamorphosed winter flounder Pseudopleuronectes americanus with stable isotopes. Mar. Ecol.Prog. Ser. 236:233–40
www.annualreviews.org • SIA in Trophic Ecology 433
Ann
u. R
ev. E
col.
Evo
l. Sy
st. 2
011.
42:4
11-4
40. D
ownl
oade
d fr
om w
ww
.ann
ualr
evie
ws.
org
by C
SIC
- C
onse
jo S
uper
ior
de I
nves
tigac
ione
s C
ient
ific
as o
n 05
/28/
14. F
or p
erso
nal u
se o
nly.
ES42CH19-Boecklen ARI 27 September 2011 14:2
Box G, Draper N. 1987. Empirical Model-Building and Response Surfaces. New York: John WileyBuchheister A, Latour RJ. 2010. Turnover and fractionation of carbon and nitrogen stable isotopes in tissues of
a migratory coastal predator, summer flounder (Paralichthys dentatus). Can. J. Fish. Aquat. Sci. 67:445–61Budge SM, Wooller MJ, Springer AM, Iverson SJ, McRoy CP, Divoky GJ. 2008. Tracing carbon flow in an
arctic marine food web using fatty acid-stable isotope analysis. Oecologia 157:117–29Carleton SA, Kelly L, Anderson-Sprecher R, Martınez del Rio C. 2008. Should we use one-, or multi-
compartment models to describe 13C incorporation into animal tissues? Rapid Commun. Mass Spectrom.22:3008–14
Carleton SA, Martınez del Rio C. 2010. Growth and catabolism in isotopic incorporation: a new formulationand experimental data. Funct. Ecol. 24:805–12
Caut S, Angulo E, Courchamp F. 2009. Variation in discrimination factors (δ15N and δ13C): the effect of dietisotopic values and applications for diet reconstruction. J. Appl. Ecol. 46:443–53
Cerling TE, Ayliffe LK, Dearing MD, Ehleringer JR, Passey BH, et al. 2007. Determining biological tissueturnover using stable isotopes: the reaction progress variable. Oecologia 151:175–89
Cernusak LA, Hutley LB. 2011. Stable isotopes reveal the contribution of corticular photosynthesis to growthin branches of Eucalyptus miniata. Plant Physiol. 155:515–23
Chamberlain PM, Bull ID, Black HIJ, Ineson P, Evershed RP. 2004. Lipid content and carbon assimilationin Collembola: implications for the use of compound-specific carbon isotope analysis in animal dietarystudies. Oecologia 139:325–35
Chamberlain PM, Bull ID, Black HIJ, Ineson P, Evershed RP. 2006. Collembolan trophic preferences deter-mined using fatty acid distributions and compound-specific stable carbon isotope values. Soil Biol. Biochem.38:1275–81
Cherel Y, Hobson KA. 2007. Geographical variation in carbon stable isotope signatures of marine predators:a tool to investigate their foraging areas in the Southern Ocean. Mar. Ecol. Prog. Ser. 329:281–87
Cherel Y, Hobson KA, Weimerskirch H. 2005. Using stable isotopes to study resource acquisition and allo-cation in procellariiform seabirds. Oecologia 145:533–40
Chikaraishi Y, Ogawa NO, Kashiyama Y, Takano Y, Suga H, et al. 2009. Determination of aquatic food-webstructure based on compound-specific nitrogen isotopic composition of amino acids. Limnol. Oceanogr.Meth. 7:740–50
Dalerum F, Angerbjorn A. 2005. Resolving temporal variation in vertebrate diets using naturally occurringstable isotopes. Oecologia 144:647–58
Dawson TE, Mambelli S, Plamboeck AH, Templer PH, Tu KP. 2002. Stable isotopes in plant ecology. Annu.Rev. Ecol. Syst. 33:507–59
DeNiro M, Epstein S. 1976. You are what you eat (plus a few per mil): the carbon isotope cycle in food chains.Geol. Soc. Am. 8:834–35 (Abstr.)
DeNiro MJ, Epstein S. 1977. Mechanism of carbon isotope fractionation associated with lipid synthesis. Science197:261–63
DeNiro MJ, Epstein S. 1978. Influence of diet on distribution of carbon isotopes in animals. Geochim.Cosmochim. Acta 42:495–506
DeNiro MJ, Epstein S. 1981. Influence of diet on the distribution of nitrogen isotopes in animals. Geochim.Cosmochim. Acta 45:341–51
Doi H, Yurlova NI, Vodyanitskaya SN, Kikuchi E, Shilkano S, et al. 2008. Parasite-induced changes innitrogen isotope signatures of host tissues. J. Parasitol. 94:292–95
Doucett RR, Power G, Barton DR, Drimmie RJ, Cunjak RA. 1996. Stable isotope analysis of nutrient pathwaysleading to Atlantic salmon. Can. J. Fish. Aquat. Sci. 53:2058–66
El-Hajj Z, Kavanagh K, Rose C, Kanaan-Atallah Z. 2004. Nitrogen and carbon dynamics of a foliar biotrophicfungal parasite in fertilized Douglas-fir. New Phytol. 163:139–47
Fantle MS, Dittel AI, Schwalm SM, Epifanio CE, Fogel ML. 1999. A food web analysis of the juvenileblue crab, Callinectes sapidus, using stable isotopes in whole animals and individual amino acids. Oecologia120:416–26
Fisk AT, Sash K, Maerz J, Palmer W, Carroll JP, MacNeil MA. 2009. Metabolic turnover rates of carbon andnitrogen stable isotopes in captive juvenile snakes. Rapid Commun. Mass Spectrom. 23:319–26
434 Boecklen et al.
Ann
u. R
ev. E
col.
Evo
l. Sy
st. 2
011.
42:4
11-4
40. D
ownl
oade
d fr
om w
ww
.ann
ualr
evie
ws.
org
by C
SIC
- C
onse
jo S
uper
ior
de I
nves
tigac
ione
s C
ient
ific
as o
n 05
/28/
14. F
or p
erso
nal u
se o
nly.
ES42CH19-Boecklen ARI 27 September 2011 14:2
Flanagan LB, Ehleringer JR. 1991. Stable isotope composition of stem and leaf water: applications to the studyof plant water use. Funct. Ecol. 5:270–77
Focken U, Becker K. 1998. Metabolic fractionation of stable carbon isotopes: implications of different proxi-mate compositions for studies of the aquatic food webs using δ13C data. Oecologia 115:337–43
Fogel ML, Griffin P, Newsome SD. 2010. Hydrogen isotopes in amino acids trace food and water. Presented atInt. Conf. Appl. Stable Isotope Tech. Ecol. Stud., 7th, Fairbanks, AK
Fogel ML, Tuross N. 2003. Extending the limits of paleodietary studies of humans with compound specificcarbon isotope analysis of amino acids. J. Archaeol. Sci. 30:535–45
Forero MG, Hobson KA, Bortolotti GR, Donazar JA, Bertellotti M, Blanco G. 2002. Food resource utilisationby the Magellanic penguin evaluated through stable-isotope analysis: segregation by sex and age andinfluence on offspring quality. Mar. Ecol. Prog. Ser. 234:289–99
Forsberg BR, Araujolima C, Martinelli LA, Victoria RL, Bonassi JA. 1993. Autotrophic carbon sources forfish of the central Amazon. Ecology 74:643–52
France RL. 1996. Carbon-13 conundrums: limitations and cautions in the use of stable isotope analysis instream ecotonal research. Can. J. Fish. Aquat. Sci. 53:1916–19
Fry B. 1991. Stable isotope diagrams of fresh-water food webs. Ecology 72:2293–97Fry B, Arnold C. 1982. Rapid 13C/12C turnover during growth of brown shrimp (Penaeus aztecus). Oecologia
54:200–4Fry B, Joern A, Parker PL. 1978. Grasshopper food web analysis: use of carbon isotope ratios to examine
feeding relationships among terrestrial herbivores. Ecology 59:498–506Fuller BT, Fuller JL, Sage NE, Harris DA, O’Connell TC, Hedges REM. 2004. Nitrogen balance and δ15N:
why you’re not what you eat during pregnancy. Rapid Commun. Mass Spectrom. 18:2889–96Gannes LZ, Martınez del Rio C, Koch P. 1998. Natural abundance variations in stable isotopes and their
potential uses in animal physiological ecology. Comp. Biochem. Physiol. A 119:725–37Gannes LZ, O’Brien DM, Martınez del Rio C. 1997. Stable isotopes in animal ecology: assumptions, caveats,
and a call for more laboratory experiments. Ecology 78:1271–76Gaye-Siessegger J, Focken U, Abel H, Becker K. 2004. Dietary lipid content influences the activity of lipogenic
enzymes in the liver and on whole body delta13C values of Nile tilapia, Oreochromis niloticus (L.). Isot.Environ. Health Stud. 40:181–90
Genner MJ, Turner GF, Barker S, Hawkins SJ. 1999. Niche segregation among Lake Malawi cichlid fishes?Evidence from stable isotope signatures. Ecol. Lett. 2:185–90
Graves GR, Romanek CS, Navarro AR. 2002. Stable isotope signature of philopatry and dispersal in a migratorysongbird. Proc. Natl. Acad. Sci. USA 99:8096–100
Grey J, Waldron S, Hutchinson R. 2004. The utility of carbon and nitrogen isotope analyses to trace con-tributions from fish farms to the receiving communities of freshwater lakes: a pilot study in EsthwaiteWater, UK. Hydrobiologia 524:253–62
Grogan P, Bruns TD, Chapin FS. 2000. Fire effects on ecosystem nitrogen cycling in a Californian bishoppine forest. Oecologia 122:537–44
Haines EB. 1976. Relation between the stable carbon isotope composition of fiddler crabs, plants, and soils ina salt marsh. Limnol. Oceanogr. 21:880–83
Hammer BT, Fogel ML, Hoering TC. 1998. Stable carbon isotope ratios of fatty acids in seagrass and redheadducks. Chem. Geol. 152:29–41
Hatase H, Sato K, Yamaguchi M, Takahashi K, Tsukamoto K. 2006. Individual variation in feeding habitatuse by adult female green sea turtles (Chelonia mydas): Are they obligately neritic herbivores? Oecologia149:52–64
Hesslein RH, Hallard KA, Ramlal P. 1993. Replacement of sulfur, carbon, and nitrogen in tissue of growingbroad whitefish (Coregonus nasus) in response to a change in diet traced by δ34S, δ13C, and δ15N. Can. J.Fish. Aquat. Sci. 50:2071–76
Hobson KA. 1999. Tracing origins and migration of wildlife using stable isotopes: a review. Oecologia 120:314–26
Hobson KA, Alisauskas RT, Clark RG. 1993. Stable nitrogen isotope enrichment in avian tissues due to fastingand nutritional stress: implications for isotopic analyses of diet. Condor 95:388–94
www.annualreviews.org • SIA in Trophic Ecology 435
Ann
u. R
ev. E
col.
Evo
l. Sy
st. 2
011.
42:4
11-4
40. D
ownl
oade
d fr
om w
ww
.ann
ualr
evie
ws.
org
by C
SIC
- C
onse
jo S
uper
ior
de I
nves
tigac
ione
s C
ient
ific
as o
n 05
/28/
14. F
or p
erso
nal u
se o
nly.

ES42CH19-Boecklen ARI 27 September 2011 14:2
Hobson KA, Clark RG. 1992. Assessing avian diets using stable isotopes I: turnover of 13C in tissues. Condor94:181–88
Hobson KA, Piatt JF, Pitocchelli J. 1994. Using stable isotopes to determine seabird trophic relationships.J. Anim. Ecol. 63:786–98
Hoeinghaus DJ, Zeug SC. 2008. Can stable isotope ratios provide for community-wide measures of trophicstructure? Comment. Ecology 89:2353–57
Ikeda H, Kubota K, Kagawa A, Sota T. 2010. Diverse diet compositions among harpaline ground beetlespecies revealed by mixing model analyses of stable isotope ratios. Ecol. Entomol. 35:307–16
Iverson SJ, Field C, Bowen WD, Blanchard W. 2004. Quantitative fatty acid signature analysis: a new methodof estimating predator diets. Ecol. Monogr. 74:211–35
Iverson SJ, Lang SLC, Cooper MH. 2001. Comparison of the Bligh and Dyer and Folch methods for totallipid determination in a broad range of marine tissue. Lipids 36:1283–87
Jackson AL, Inger R, Bearhop S, Parnell A. 2009. Erroneous behaviour of MixSIR, a recently publishedBayesian isotope mixing model: a discussion of Moore & Semmens (2008). Ecol. Lett. 12:E1–E5
Jackson PC, Cavelier J, Goldstein G, Meinzer FC, Holbrook NM. 1995. Partitioning of water resourcesamong plants of a lowland tropical forest. Oecologia 101:197–203
Jaschinski S, Hansen T, Sommer U. 2008. Effects of acidification in multiple stable isotope analyses. Limnol.Oceanogr. Meth. 6:12–15
Jim S, Jones V, Ambrose SH, Evershed RP. 2006. Quantifying dietary macronutrient sources of carbon forbone collagen biosynthesis using natural abundance stable carbon isotope analysis. Brit. J. Nutr. 95:1055–62
Kelly B, Dempson JB, Power M. 2006. The effects of preservation on fish tissue stable isotope signatures.J. Fish Biol. 69:1595–611
Kelly JF. 2000. Stable isotopes of carbon and nitrogen in the study of avian and mammalian trophic ecology.Can. J. Zool. 78:1–27
Kelly JF, Finch DM. 1998. Tracking migrant songbirds with stable isotopes. Trends Ecol. Evol. 13:48–49Kelly LJ, Martınez del Rio C. 2010. The fate of carbon in growing fish: an experimental study of isotopic
routing. Physiol. Biochem. Zool. 83:473–80Kiljunen M, Grey J, Sinisalo T, Harrod C, Immonen H, Jones RI. 2006. A revised model for lipid-normalizing
δ13C values from aquatic organisms, with implications for isotope mixing models. J. Appl. Ecol. 43:1213–22Klaassen M, Piersma T, Korthals H, Dekinga A, Dietz MW. 2010. Single-point isotope measurements in
blood cells and plasma to estimate the time since diet switches. Funct. Ecol. 24:796–804Kleiber M. 1932. Body size and metabolism. Hilgardia 6:315–51Kline TC, Goering JJ, Mathisen OA, Poe PH, Parker PL, Scalan RS. 1993. Recycling of elements transported
upstream by runs of Pacific salmon: II. δ15N and δ13C evidence in the Kvichak River Watershed, BristolBay, Southwestern Alaska. Can. J. Fish. Aquat. Sci. 50:2350–65
Kooijman S. 2010. Dynamic Energy Budget Theory for Metabolic Organisation. Cambridge, UK: CambridgeUniv. Press
Krummen M, Hilkert AW, Juchelka D, Duhr A, Schluter HJ, Pesch R. 2004. A new concept for isotope ratiomonitoring liquid chromatography/mass spectrometry. Rapid Commun. Mass Spectrom. 18:2260–66
Kwak TJ, Zedler JB. 1997. Food web analysis of southern California coastal wetlands using multiple stableisotopes. Oecologia 110:262–77
Logan JM, Jardine TD, Miller TJ, Bunn SE, Cunjak RA, Lutcavage ME. 2008. Lipid corrections in carbonand nitrogen stable isotope analyses: comparison of chemical extraction and modelling methods. J. Anim.Ecol. 77:838–46
Logan JM, Lutcavage ME. 2008. A comparison of carbon and nitrogen stable isotope ratios of fish tissuesfollowing lipid extractions with non-polar and traditional chloroform/methanol solvent systems. RapidCommun. Mass Spectrom. 22:1081–86
Lorrain A, Graham B, Menard F, Popp B, Bouillon S, et al. 2009. Nitrogen and carbon isotope values ofindividual amino acids: a tool to study foraging ecology of penguins in the Southern Ocean. Mar. Ecol.Prog. Ser. 391:293–306
Loseto LL, Stern GA, Connelly TL, Deibel D, Gemmill B, et al. 2009. Summer diet of beluga whales inferredby fatty acid analysis of the eastern Beaufort Sea food web. J. Exp. Mar. Biol. Ecol. 374:12–18
436 Boecklen et al.
Ann
u. R
ev. E
col.
Evo
l. Sy
st. 2
011.
42:4
11-4
40. D
ownl
oade
d fr
om w
ww
.ann
ualr
evie
ws.
org
by C
SIC
- C
onse
jo S
uper
ior
de I
nves
tigac
ione
s C
ient
ific
as o
n 05
/28/
14. F
or p
erso
nal u
se o
nly.

ES42CH19-Boecklen ARI 27 September 2011 14:2
MacAvoy SE, Arneson LS, Bassett E. 2006. Correlation of metabolism with tissue carbon and nitrogen turnoverrate in small mammals. Oecologia 150:190–201
MacAvoy SE, Macko SA, Arneson LS. 2005. Growth versus metabolic tissue replacement in mouse tissuesdetermined by stable carbon and nitrogen isotope analysis. Can. J. Zool. 83:631–41
Manirakiza P, Covaci A, Schepens P. 2001. Comparative study on total lipid determination using Soxhlet,Roese-Gottlieb, Bligh & Dyer, and modified Bligh & Dyer extraction methods. J. Food Compos. Anal.14:93–100
Mariano-Jelicich R, Botto F, Martinetto P, Iribarne O, Favero M. 2008. Trophic segregation between sexesin the Black Skimmer revealed through the analysis of stable isotopes. Mar. Biol. 155:443–50
Marquez MJ, Boecklen WJ. 2010. Isotopic shift in an introduced population of gemsbok (Oryx gazella). J. AridEnviron. 74: 928–32
Martinelli LA, Piccolo MC, Townsend AR, Vitousek PM, Cuevas E, et al. 1999. Nitrogen stable isotopiccomposition of leaves and soil: tropical versus temperate forests. Biogeochemistry 46:45–65
Martınez del Rio C, Anderson-Sprecher R. 2008. Beyond the reaction progress variable: the meaning andsignificance of isotopic incorporation data. Oecologia 156:765–72
Martınez del Rio C, Sabat P, Anderson-Sprecher R, Gonzalez SP. 2009. Dietary and isotopic specialization:the isotopic niche of three Cinclodes ovenbirds. Oecologia 161:149–59
Martınez del Rio C, Wolf BO. 2005. Mass-balance models for animal isotopic ecology. In Physiological andEcological Adaptations to Feeding in Vertebrates, ed. JM Starck, T Wang, pp. 141–74. Enfield, NH: Sci.Publ.
Maruyama A, Yamada Y, Rusuwa B, Yuma M. 2001. Change in stable nitrogen isotope ratio in the muscletissue of a migratory goby, Rhinogobius sp., in a natural setting. Can. J. Fish. Aquat. Sci. 58:2125–28
Mateo MA, Serrano O, Serrano L, Michener RH. 2008. Effects of sample preparation on stable isotope ratiosof carbon and nitrogen in marine invertebrates: implications for food web studies using stable isotopes.Oecologia 157:105–15
McCarthy MD, Benner R, Lee C, Fogel ML. 2007. Amino acid nitrogen isotopic fractionation patterns asindicators of heterotrophy in plankton, particulate, and dissolved organic matter. Geochim. Cosmochim.Acta 71: 4727–44
McClelland JW, Montoya JP. 2002. Trophic relationships and the nitrogen isotopic composition of aminoacids in plankton. Ecology 83:2173–80
McClelland JW, Valiela I, Michener RH. 1997. Nitrogen-stable isotope signatures in estuarine food webs: arecord of increasing urbanization in coastal watersheds. Limnol. Oceanogr. 42:930–37
McConnaughey T, McRoy CP. 1979. Food-web structure and the fractionation of carbon isotopes in theBering Sea. Mar. Biol. 53:257–62
McCutchan JH, Lewis WM, Kendall C, McGrath CC. 2003. Variation in trophic shift for stable isotope ratiosof carbon, nitrogen, and sulfur. Oikos 102:378–90
McLeod RJ, Wing SR. 2007. Hagfish in the New Zealand fjords are supported by chemoautotrophy of forestcarbon. Ecology 88:809–16
McMahon KW, Fogel ML, Elsdon TS, Thorrold SR. 2010. Carbon isotope fractionation of amino acids infish muscle reflects biosynthesis and isotopic routing from dietary protein. J. Anim. Ecol. 79:1132–41
Michener RH, Schell DM. 1994. Stable isotope ratios as tracers in marine aquatic food webs. In Stable Isotopesin Ecology and Environmental Science, ed. K Lajtha, RH Michener, pp. 138–57. Boston: Blackwell Sci.
Mill AC, Sweeting CJ, Barnes C, Al-Habsi SH, MacNeil MA. 2008. Mass-spectrometer bias in stable isotopeecology. Limnol. Oceanogr. Meth. 6:34–39
Millett J, Jones RI, Waldron S. 2003. The contribution of insect prey to the total nitrogen content of sundews(Drosera spp.) determined in situ by stable isotope analysis. New Phytol. 158:527–34
Minagawa M, Wada E. 1984. Stepwise enrichment of 15N along food chains: further evidence and the relationbetween δ15N and animal age. Geochim. Cosmochim. Acta 48:1135–40
Minson DJ, Ludlow MM, Troughton JH. 1975. Differences in natural carbon isotope ratios of milk and hairfrom cattle grazing tropical and temperate pastures. Nature 256:602
Mintenbeck K, Brey T, Jacob U, Knust R, Struck U. 2008. How to account for the lipid effect on carbonstable-isotope ratio (δ13C): sample treatment effects and model bias. J. Fish Biol. 72:815–30
www.annualreviews.org • SIA in Trophic Ecology 437
Ann
u. R
ev. E
col.
Evo
l. Sy
st. 2
011.
42:4
11-4
40. D
ownl
oade
d fr
om w
ww
.ann
ualr
evie
ws.
org
by C
SIC
- C
onse
jo S
uper
ior
de I
nves
tigac
ione
s C
ient
ific
as o
n 05
/28/
14. F
or p
erso
nal u
se o
nly.
ES42CH19-Boecklen ARI 27 September 2011 14:2
Miura O, Kuris AM, Torchin ME, Hechinger RF, Chiba S. 2006. Parasites alter host phenotype and maycreate a new ecological niche for snail hosts. Proc. R. Soc. B Biol. Sci. 273:1323–28
Moore JW, Semmens BX. 2008. Incorporating uncertainty and prior information into stable isotope mixingmodels. Ecol. Lett. 11:470–80
Moreno R, Jover L, Munilla I, Velando A, Sanpera C. 2010. A three-isotope approach to disentangling thediet of a generalist consumer: the yellow-legged gull in northwest Spain. Mar. Biol. 157:545–53
Morrison DJ, Cooper K, Preston T. 2010. Reconstructing bulk isotope ratios from compound-specific isotoperatios. Rapid Commun. Mass Spectrom. 24:1799–804
Murphy BP, Bowman D, Gagan MK. 2007. The interactive effect of temperature and humidity on the oxygenisotope composition of kangaroos. Funct. Ecol. 21:757–66
Neilson R, Boag B, Hartley G. 2005. Temporal host-parasite relationships of the wild rabbit, Oryctolaguscuniculus (L.) as revealed by stable isotope analyses. Parasitology 131:279–85
Newsome SD, Martınez del Rio C, Bearhop S, Phillips DL. 2007. A niche for isotopic ecology. Front. Ecol.Environ. 5:429–36
O’Brien DM, Schrag DP, Martınez del Rio C. 2000. Allocation to reproduction in a hawkmoth: a quantitativeanalysis using stable carbon isotopes. Ecology 81:2822–31
Ogle K, Wolpert RL, Reynolds JF. 2004. Reconstructing plant root area and water uptake profiles. Ecology85:1967–78
Olive PJW, Pinnegar JK, Polunin NVC, Richards G, Welch R. 2003. Isotope trophic-step fractionation: adynamic equilibrium model. J. Anim. Ecol. 72:608–17
Olson RJ, Popp BN, Graham BS, Lopez-Ibarra GA, Galvan-Magana F, et al. 2010. Food-web inferences ofstable isotope spatial patterns in copepods and yellowfin tuna in the pelagic eastern Pacific Ocean. Prog.Oceanogr. 86:124–38
Oppel S, Powell AN. 2010. Carbon isotope turnover in blood as a measure of arrival time in migratory birdsusing isotopically distinct environments. J. Ornithol. 151:123–31
Pace ML, Carpenter SR, Cole JJ, Coloso JJ, Kitchell JF, et al. 2007. Does terrestrial organic carbon subsidizethe planktonic food web in a clear-water lake? Limnol. Oceanogr. 52:2177–89
Park R, Epstein S. 1960. Carbon isotope fractionation during photosynthesis. Geochim. Cosmochim. Acta 21:110–26
Parnell AC, Inger R, Bearhop S, Jackson AL. 2010. Source partitioning using stable isotopes: coping with toomuch variation. PLoS One 5:e9672
Pearson SF, Levey DJ, Greenberg CH, Martınez del Rio C. 2003. Effects of elemental composition on theincorporation of dietary nitrogen and carbon isotopic signatures in an omnivorous songbird. Oecologia135:516–23
Pecquerie L, Nisbet RM, Fablet R, Lorrain A, Kooijman S. 2010. The impact of metabolism on stable isotopedynamics: a theoretical framework. Philos. Trans. R. Soc. B 365:3455–68
Perga ME, Gerdeaux D. 2005. ‘Are fish what they eat’ all year round? Oecologia 144:598–606Peterson BJ, Fry B. 1987. Stable isotopes in ecosystems. Annu. Rev. Ecol. Syst. 18:293–320Peuke AD, Gessler A, Rennenberg H. 2006. The effect of drought on C and N stable isotopes in different
fractions of leaves, stems and roots of sensitive and tolerant beech ecotypes. Plant Cell Environ. 29:823–35Phillips DL. 2001. Mixing models in analyses of diet using multiple stable isotopes: a critique. Oecologia
127:166–70Phillips DL, Eldridge PM. 2006. Estimating the timing of diet shifts using stable isotopes. Oecologia 147:195–
203Phillips DL, Gregg JW. 2001. Uncertainty in source partitioning using stable isotopes. Oecologia 127:171–79Phillips DL, Gregg JW. 2003. Source partitioning using stable isotopes: coping with too many sources.
Oecologia 136:261–69Phillips DL, Koch PL. 2002. Incorporating concentration dependence in stable isotope mixing models.
Oecologia 130:114–25Phillips DL, Newsome SD, Gregg JW. 2005. Combining sources in stable isotope mixing models: alternative
methods. Oecologia 144:520–27Podlesak DW, McWilliams SR. 2006. Metabolic routing of dietary nutrients in birds: effects of diet quality
and macronutrient composition revealed using stable isotopes. Physiol. Biochem. Zool. 79:534–49
438 Boecklen et al.
Ann
u. R
ev. E
col.
Evo
l. Sy
st. 2
011.
42:4
11-4
40. D
ownl
oade
d fr
om w
ww
.ann
ualr
evie
ws.
org
by C
SIC
- C
onse
jo S
uper
ior
de I
nves
tigac
ione
s C
ient
ific
as o
n 05
/28/
14. F
or p
erso
nal u
se o
nly.

ES42CH19-Boecklen ARI 27 September 2011 14:2
Podlesak DW, McWilliams SR. 2007. Metabolic routing of dietary nutrients in birds: effects of dietary lipidconcentration on δ13C of depot fat and its ecological implications. Auk 124:916–25
Popp BN, Graham BS, Olson RJ, Hannides CCS, Lott MJ, et al. 2007. Insight into the trophic ecology ofyellowfin tuna, Thunnus albacares, from compound-specific nitrogen isotope analysis of proteinaceousamino acids. In Terrestrial Ecology. Vol. 1: Stable Isotopes as Indicators of Ecological Change, ed. T Dawson,R Siegwolf, pp. 173–90. Amsterdam: Elsevier/Academic
Portner HO. 2002. Physiological basis of temperature-dependent biogeography: trade-offs in muscle designand performance in polar ectotherms. J. Exp. Biol. 205:2217–30
Post DM. 2002. The long and short of food-chain length. Trends Ecol. Evol. 17:269–77Post DM, Layman CA, Arrington DA, Takimoto G, Quattrochi J, Montana CG. 2007. Getting to the fat of
the matter: models, methods and assumptions for dealing with lipids in stable isotope analyses. Oecologia152:179–89
Raikow DF, Hamilton SK. 2001. Bivalve diets in a midwestern US stream: a stable isotope enrichment study.Limnol. Oceanogr. 46:514–22
Ramos L, Kristenson EM, Brinkman UAT. 2002. Current use of pressurised liquid extraction and subcriticalwater extraction in environmental analysis. J. Chromatogr. A 975:3–29
Rasmussen JB. 2009. Estimating terrestrial contribution to stream invertebrates and periphyton using agradient-based mixing model for δ13C. J. Anim. Ecol. 79:393–402
Reich KJ, Bjorndal KA, Martınez del Rio C. 2008. Effects of growth and tissue type on the kinetics of 13C and15N incorporation in a rapidly growing ectotherm. Oecologia 155:651–63
Reich KJ, Worthy GAJ. 2006. An isotopic assessment of the feeding habits of free-ranging manatees.Mar. Ecol. Prog. Ser. 322:303–9
Ricci MP, Merritt DA, Freeman KH, Hayes JM. 1994. Acquisition and processing of data for isotope-ratio-monitoring mass-spectrometry. Org. Geochem. 21:561–71
Rubenstein DR, Hobson KA. 2004. From birds to butterflies: animal movement patterns and stable isotopes.Trends Ecol. Evol. 19:256–63
Samelius G, Alisauskas RT, Hobson KA, Lariviere S. 2007. Prolonging the arctic pulse: long-term exploitationof cached eggs by arctic foxes when lemmings are scarce. J. Anim. Ecol. 76:873–80
Schlacher TA, Liddell B, Gaston TF, Schlacher-Hoenlinger M. 2005. Fish track wastewater pollution toestuaries. Oecologia 144:570–84
Schwarcz HP. 1991. Some theoretical aspects of isotope paleodiet studies. J. Archaeol. Sci. 18:261–75Semmens BX, Ward EJ, Moore JW, Darimont CT. 2009. Quantifying inter- and intra-population niche
variability using hierarchical bayesian stable isotope mixing models. PLoS One 4:e6187Sessions AL. 2006. Isotope-ratio detection for gas chromatography. J. Sep. Sci. 29:1946–61Smedes F. 1999. Determination of total lipid using non-chlorinated solvents. Analyst 124:1711–18Smith BN, Epstein S. 1970. Biogeochemistry of stable isotopes of hydrogen and carbon in salt marsh biota.
Plant Physiol. 46:738–42Smith BN, Epstein S. 1971. Two categories of 13C/12C ratios for higher plants. Plant Physiol. 47:380–84Sotiropoulos MA, Tonn WM, Wassenaar LI. 2004. Effects of lipid extraction on stable carbon and nitrogen
isotope analyses of fish tissues: potential consequences for food web studies. Ecol. Freshw. Fish 13:155–60Stapp P, Polls GA, Pinero FS. 1999. Stable isotopes reveal strong marine and El Nino effects on island food
webs. Nature 401:467–69Stott AW, Davies E, Evershed RP, Tuross N. 1997. Monitoring the routing of dietary and biosynthesised lipids
through compound-specific stable isotope (δ13C) measurements at natural abundance. Naturwissenschaften84:82–86
Sweeting CJ, Polunin NVC, Jennings S. 2006. Effects of chemical lipid extraction and arithmetic lipid cor-rection on stable isotope ratios of fish tissues. Rapid Commun. Mass Spectrom. 20:595–601
Tesitel J, Plavcova L, Cameron DD. 2010. Heterotrophic carbon gain by the root hemiparasites, Rhinanthusminor and Euphrasia rostkoviana (Orobanchaceae). Planta 231:1137–44
Tibbets TM, Wheeless LA, Martınez del Rio C. 2008. Isotopic enrichment without change in diet: an onto-genetic shift in δ15N during insect metamorphosis. Funct. Ecol. 22:109–13
Tieszen LL, Boutton TW, Tesdahl KG, Slade NA. 1983. Fractionation and turnover of stable carbon isotopesin animal tissues: implications for δ13C analysis of diet. Oecologia 57:32–37
www.annualreviews.org • SIA in Trophic Ecology 439
Ann
u. R
ev. E
col.
Evo
l. Sy
st. 2
011.
42:4
11-4
40. D
ownl
oade
d fr
om w
ww
.ann
ualr
evie
ws.
org
by C
SIC
- C
onse
jo S
uper
ior
de I
nves
tigac
ione
s C
ient
ific
as o
n 05
/28/
14. F
or p
erso
nal u
se o
nly.

ES42CH19-Boecklen ARI 27 September 2011 14:2
Uhle ME, Macko SA, Spero HJ, Engel MH, Lea DW. 1997. Sources of carbon and nitrogen in modernplanktonic foraminifera: the role of algal symbionts as determined by bulk and compound specific stableisotopic analyses. Org. Geochem. 27:103–13
Urton EJM, Hobson KA. 2005. Intrapopulation variation in gray wolf isotope (δ15N and δ13C) profiles:implications for the ecology of individuals. Oecologia 145:317–26
Vanderklift MA, Ponsard S. 2003. Sources of variation in consumer-diet δ15N enrichment: a meta-analysis.Oecologia 136:169–82
Voigt CC, Rex K, Michener RH, Speakman JR. 2008. Nutrient routing in omnivorous animals tracked bystable carbon isotopes in tissue and exhaled breath. Oecologia 157:31–40
Waas S, Werner RA, Starck JM. 2010. Fuel switching and energy partitioning during the postprandialmetabolic response in the ball python (Python regius). J. Exp. Biol. 213:1266–71
Ward EJ, Semmens BX, Schindler DE. 2010. Including source uncertainty and prior information in theanalysis of stable isotope mixing models. Environ. Sci. Technol. 44:4645–50
Wilson RM, Chanton J, Lewis G, Nowacek D. 2009. Combining organic matter source and relative trophicposition determinations to explore trophic structure. Estuar. Coasts 32:999–1010
Wolf N, Carleton SA, Martınez del Rio C. 2009. Ten years of experimental animal isotopic ecology. Funct.Ecol. 23:17–26
Yarnes CT, Rockwell JN, Boecklen WJ. 2005. Patterns of trophic shift in δ15N and δ13C through a cynipidgall wasp community (Neuroterus sp.) in Quercus turbinella. Environ. Entomol. 34:1471–76
Young HS, McCauley DJ, Dirzo R, Dunbar RB, Shaffer SA. 2010. Niche partitioning among and withinsympatric tropical seabirds revealed by stable isotope analysis. Mar. Ecol. Prog. Ser. 416:285–94
Zak DR, Kling GW. 2006. Microbial community composition and function across an arctic tundra landscape.Ecology 87:1659–70
440 Boecklen et al.
Ann
u. R
ev. E
col.
Evo
l. Sy
st. 2
011.
42:4
11-4
40. D
ownl
oade
d fr
om w
ww
.ann
ualr
evie
ws.
org
by C
SIC
- C
onse
jo S
uper
ior
de I
nves
tigac
ione
s C
ient
ific
as o
n 05
/28/
14. F
or p
erso
nal u
se o
nly.

ES42-FrontMatter ARI 11 October 2011 16:5
Annual Review ofEcology, Evolution,and Systematics
Volume 42, 2011Contents
Native Pollinators in Anthropogenic HabitatsRachael Winfree, Ignasi Bartomeus, and Daniel P. Cariveau � � � � � � � � � � � � � � � � � � � � � � � � � � � � � � 1
Microbially Mediated Plant Functional TraitsMaren L. Friesen, Stephanie S. Porter, Scott C. Stark, Eric J. von Wettberg,
Joel L. Sachs, and Esperanza Martinez-Romero � � � � � � � � � � � � � � � � � � � � � � � � � � � � � � � � � � � � � � � � �23
Evolution in the Genus HomoBernard Wood and Jennifer Baker � � � � � � � � � � � � � � � � � � � � � � � � � � � � � � � � � � � � � � � � � � � � � � � � � � � � � � � � � �47
Ehrlich and Raven Revisited: Mechanisms Underlying Codiversificationof Plants and EnemiesNiklas Janz � � � � � � � � � � � � � � � � � � � � � � � � � � � � � � � � � � � � � � � � � � � � � � � � � � � � � � � � � � � � � � � � � � � � � � � � � � � � � � � � � � �71
An Evolutionary Perspective on Self-Organized Division of Laborin Social InsectsAna Duarte, Franz J. Weissing, Ido Pen, and Laurent Keller � � � � � � � � � � � � � � � � � � � � � � � � � � � �91
Evolution of Anopheles gambiae in Relation to Humans and MalariaBradley J. White, Frank H. Collins, and Nora J. Besansky � � � � � � � � � � � � � � � � � � � � � � � � � � � � � � 111
Mechanisms of Plant Invasions of North America and European GrasslandsT.R. Seastedt and Petr Pysek � � � � � � � � � � � � � � � � � � � � � � � � � � � � � � � � � � � � � � � � � � � � � � � � � � � � � � � � � � � � � � � 133
Physiological Correlates of Geographic Range in AnimalsFrancisco Bozinovic, Piero Calosi, and John I. Spicer � � � � � � � � � � � � � � � � � � � � � � � � � � � � � � � � � � � � � 155
Ecological Lessons from Free-Air CO2 Enrichment (FACE) ExperimentsRichard J. Norby and Donald R. Zak � � � � � � � � � � � � � � � � � � � � � � � � � � � � � � � � � � � � � � � � � � � � � � � � � � � � � 181
Biogeography of the Indo-Australian ArchipelagoDavid J. Lohman, Mark de Bruyn, Timothy Page, Kristina von Rintelen,
Robert Hall, Peter K.L. Ng, Hsi-Te Shih, Gary R. Carvalho,and Thomas von Rintelen � � � � � � � � � � � � � � � � � � � � � � � � � � � � � � � � � � � � � � � � � � � � � � � � � � � � � � � � � � � � � � � � 205
Phylogenetic Insights on Evolutionary Novelties in Lizardsand Snakes: Sex, Birth, Bodies, Niches, and VenomJack W. Sites Jr, Tod W. Reeder, and John J. Wiens � � � � � � � � � � � � � � � � � � � � � � � � � � � � � � � � � � � � 227
v
Ann
u. R
ev. E
col.
Evo
l. Sy
st. 2
011.
42:4
11-4
40. D
ownl
oade
d fr
om w
ww
.ann
ualr
evie
ws.
org
by C
SIC
- C
onse
jo S
uper
ior
de I
nves
tigac
ione
s C
ient
ific
as o
n 05
/28/
14. F
or p
erso
nal u
se o
nly.
ES42-FrontMatter ARI 11 October 2011 16:5
The Patterns and Causes of Variation in Plant Nucleotide Substitution RatesBrandon Gaut, Liang Yang, Shohei Takuno, and Luis E. Eguiarte � � � � � � � � � � � � � � � � � � � � � 245
Long-Term Ecological Records and Their Relevance to Climate ChangePredictions for a Warmer WorldK.J. Willis and G.M. MacDonald � � � � � � � � � � � � � � � � � � � � � � � � � � � � � � � � � � � � � � � � � � � � � � � � � � � � � � � � � 267
The Behavioral Ecology of Nutrient Foraging by PlantsJames F. Cahill Jr and Gordon G. McNickle � � � � � � � � � � � � � � � � � � � � � � � � � � � � � � � � � � � � � � � � � � � � � 289
Climate Relicts: Past, Present, FutureArndt Hampe and Alistair S. Jump � � � � � � � � � � � � � � � � � � � � � � � � � � � � � � � � � � � � � � � � � � � � � � � � � � � � � � � 313
Rapid Evolutionary Change and the Coexistence of SpeciesRichard A. Lankau � � � � � � � � � � � � � � � � � � � � � � � � � � � � � � � � � � � � � � � � � � � � � � � � � � � � � � � � � � � � � � � � � � � � � � � � � � 335
Developmental Patterns in Mesozoic Evolution of Mammal EarsZhe-Xi Luo � � � � � � � � � � � � � � � � � � � � � � � � � � � � � � � � � � � � � � � � � � � � � � � � � � � � � � � � � � � � � � � � � � � � � � � � � � � � � � � � � � 355
Integrated Land-Sea Conservation Planning: The Missing LinksJorge G. Alvarez-Romero, Robert L. Pressey, Natalie C. Ban, Ken Vance-Borland,
Chuck Willer, Carissa Joy Klein, and Steven D. Gaines � � � � � � � � � � � � � � � � � � � � � � � � � � � � � � � 381
On the Use of Stable Isotopes in Trophic EcologyWilliam J. Boecklen, Christopher T. Yarnes, Bethany A. Cook, and Avis C. James � � � � 411
Phylogenetic Methods in BiogeographyFredrik Ronquist and Isabel Sanmartın � � � � � � � � � � � � � � � � � � � � � � � � � � � � � � � � � � � � � � � � � � � � � � � � � � � 441
Toward an Era of Restoration in Ecology: Successes, Failures,and Opportunities AheadKatharine N. Suding � � � � � � � � � � � � � � � � � � � � � � � � � � � � � � � � � � � � � � � � � � � � � � � � � � � � � � � � � � � � � � � � � � � � � � � 465
Functional Ecology of Free-Living Nitrogen Fixation:A Contemporary PerspectiveSasha C. Reed, Cory C. Cleveland, and Alan R. Townsend � � � � � � � � � � � � � � � � � � � � � � � � � � � � � � 489
Indexes
Cumulative Index of Contributing Authors, Volumes 38–42 � � � � � � � � � � � � � � � � � � � � � � � � � � � 513
Cumulative Index of Chapter Titles, Volumes 38–42 � � � � � � � � � � � � � � � � � � � � � � � � � � � � � � � � � � � 517
Errata
An online log of corrections to Annual Review of Ecology, Evolution, and Systematicsarticles may be found at http://ecolsys.annualreviews.org/errata.shtml
vi Contents
Ann
u. R
ev. E
col.
Evo
l. Sy
st. 2
011.
42:4
11-4
40. D
ownl
oade
d fr
om w
ww
.ann
ualr
evie
ws.
org
by C
SIC
- C
onse
jo S
uper
ior
de I
nves
tigac
ione
s C
ient
ific
as o
n 05
/28/
14. F
or p
erso
nal u
se o
nly.

AnnuAl Reviewsit’s about time. Your time. it’s time well spent.
AnnuAl Reviews | Connect with Our expertsTel: 800.523.8635 (us/can) | Tel: 650.493.4400 | Fax: 650.424.0910 | Email: [email protected]
New From Annual Reviews:
Annual Review of Statistics and Its ApplicationVolume 1 • Online January 2014 • http://statistics.annualreviews.org
Editor: Stephen E. Fienberg, Carnegie Mellon UniversityAssociate Editors: Nancy Reid, University of Toronto
Stephen M. Stigler, University of ChicagoThe Annual Review of Statistics and Its Application aims to inform statisticians and quantitative methodologists, as well as all scientists and users of statistics about major methodological advances and the computational tools that allow for their implementation. It will include developments in the field of statistics, including theoretical statistical underpinnings of new methodology, as well as developments in specific application domains such as biostatistics and bioinformatics, economics, machine learning, psychology, sociology, and aspects of the physical sciences.
Complimentary online access to the first volume will be available until January 2015. table of contents:•What Is Statistics? Stephen E. Fienberg•A Systematic Statistical Approach to Evaluating Evidence
from Observational Studies, David Madigan, Paul E. Stang, Jesse A. Berlin, Martijn Schuemie, J. Marc Overhage, Marc A. Suchard, Bill Dumouchel, Abraham G. Hartzema, Patrick B. Ryan
•The Role of Statistics in the Discovery of a Higgs Boson, David A. van Dyk
•Brain Imaging Analysis, F. DuBois Bowman•Statistics and Climate, Peter Guttorp•Climate Simulators and Climate Projections,
Jonathan Rougier, Michael Goldstein•Probabilistic Forecasting, Tilmann Gneiting,
Matthias Katzfuss•Bayesian Computational Tools, Christian P. Robert•Bayesian Computation Via Markov Chain Monte Carlo,
Radu V. Craiu, Jeffrey S. Rosenthal•Build, Compute, Critique, Repeat: Data Analysis with Latent
Variable Models, David M. Blei•Structured Regularizers for High-Dimensional Problems:
Statistical and Computational Issues, Martin J. Wainwright
•High-Dimensional Statistics with a View Toward Applications in Biology, Peter Bühlmann, Markus Kalisch, Lukas Meier
•Next-Generation Statistical Genetics: Modeling, Penalization, and Optimization in High-Dimensional Data, Kenneth Lange, Jeanette C. Papp, Janet S. Sinsheimer, Eric M. Sobel
•Breaking Bad: Two Decades of Life-Course Data Analysis in Criminology, Developmental Psychology, and Beyond, Elena A. Erosheva, Ross L. Matsueda, Donatello Telesca
•Event History Analysis, Niels Keiding•StatisticalEvaluationofForensicDNAProfileEvidence,
Christopher D. Steele, David J. Balding•Using League Table Rankings in Public Policy Formation:
Statistical Issues, Harvey Goldstein•Statistical Ecology, Ruth King•Estimating the Number of Species in Microbial Diversity
Studies, John Bunge, Amy Willis, Fiona Walsh•Dynamic Treatment Regimes, Bibhas Chakraborty,
Susan A. Murphy•Statistics and Related Topics in Single-Molecule Biophysics,
Hong Qian, S.C. Kou•Statistics and Quantitative Risk Management for Banking
and Insurance, Paul Embrechts, Marius Hofert
Access this and all other Annual Reviews journals via your institution at www.annualreviews.org.
Ann
u. R
ev. E
col.
Evo
l. Sy
st. 2
011.
42:4
11-4
40. D
ownl
oade
d fr
om w
ww
.ann
ualr
evie
ws.
org
by C
SIC
- C
onse
jo S
uper
ior
de I
nves
tigac
ione
s C
ient
ific
as o
n 05
/28/
14. F
or p
erso
nal u
se o
nly.