
ON THE USE OF REFERENCE MONITORS IN … THE USE OF REFERENCE MONITORS IN SUBJECTIVE TESTING FOR HDTV...
6
ON THE USE OF REFERENCE MONITORS IN SUBJECTIVE TESTING FOR HDTV Christian Keimel and Klaus Diepold Technische Universit¨ at M ¨ unchen, Institute for Data Processing, Arcisstr. 21, 80333 M¨ unchen, Germany [email protected], [email protected] ABSTRACT Most international standards recommend the use of reference moni- tors in subjective testing for visual quality. But do we really need to use reference monitors? In order to find an answer to this question, we conducted extensive subjective tests with reference, color cali- brated high quality and uncalibrated standard monitors. We not only used different HDTV sequences, but also two fundamentally differ- ent encoders: AVC/H.264 and Dirac. Our results show that using the uncalibrated standard monitor, the test subjects underestimate the visual quality compared to the reference monitor. Between the reference and a less expensive color calibrated high quality monitor, however, we were unable to find a statistically significant difference in most cases. This might be an indication that both can be used equivalently in subjective testing, although further studies will be necessary in order to get a definitive answer. Index Terms— subjective testing, reference monitor, Dirac, AVC/H.264, HDTV. 1. INTRODUCTION International standards on subjective testing for visual video qual- ity often recommend the use of professional reference monitors in tests [1, 2]. The reasoning is, that these devices have only a negli- gible impact on the overall visual quality due to their superior built quality and their strict adherence to video standards as ITU-R rec- ommendation BT.709 [3] for HDTV. Also their conformance to the standards is guaranteed by the manufacturers and signal processing for so-called picture enhancement found in many consumer devices is omitted. Thus the influence of the displays on the visual quality in subjective testing can be assumed to be a fixed, well known con- stant. Furthermore, the reproducibility of the results between differ- ent laboratories is therefore highly likely, presuming that all other parameters are also fixed. One problem in practice is, however, that such equipment is rather expensive, even when compared to high quality computer monitors. This may not pose a problem for public and private broad- casting companies, the industry or specialized research institutes working on visual quality, but for researchers and developers work- ing primarily on other research areas, these costs may very well be prohibitive. Imagine for example the developer of a video encoder who wants to ascertain the visual quality achieved by his encoder during development: he will be hard pressed to justify the costs for acquiring a reference monitor. But do we really need to use reference monitors? Or might it be sufficient to use less expensive color calibrated high quality com- puter monitors? In order to find a answer to these questions, we will compare in this contribution the results of subjective visual tests per- formed using a reference monitor with the results obtained by using normal computer monitors. We propose two different scenarios: firstly, a color calibrated high quality computer monitor to represent a sensible and reasonably priced solution. Secondly, an uncalibrated standard computer moni- tor as a worst case scenario. We will perform the same subjective test with the reference monitor, the color calibrated high quality monitor and the uncalibrated standard monitor in order to determine possi- ble differences in the perceived visual quality by the test subjects. We will use the HDTV test sequences from the SVT test set [4] and encode them with two different coding technologies AVC/H.264 [5] and Dirac [6, 7]. As differences are more likely to occur at higher vi- sual quality, we selected only bit rates on the upper end of the scale for encoding. We do not intend to compare the visual quality of the different monitors themselves, but rather their influence on the results of sub- jective tests. The results achieved with the reference monitor will be considered to be the true visual quality in this context .To the best of our knowledge this is the first contribution on this topic for HDTV. This contribution is organized as follows: firstly, we will de- scribe the used monitors and their calibration. Then we introduce the setup of the subjective tests before presenting and discussing the results. Finally, we conclude with a short summary. 2. EQUIPMENT In this section we will briefly introduce the LCD monitors used and the calibration process. We selected two additional monitors in addi- tion to our reference monitor representing high quality and standard devices. Also we color calibrated the high quality monitor to get it as close as possible to our reference monitor. 2.1. LCD monitors In addition to our Cine-tal Cinemag´ e 2022 reference monitor, we se- lected two representatives for our proposed high quality and standard monitor scenario: a monitor aimed at professional color processing, the EIZO CG243W, representing high quality devices and a normal office display, the Fujitsu-Siemens B24W-5, representing standard devices. The first one was particularly chosen for the possibility of Table 1: LCD monitors used in the test Reference High Quality Standard Type Cine-tal EIZO Fujitsu-Siemens Cinemag´ e 2022 CG243W B24W-5 Diagonal 24 inch 24 inch 24 inch Resolution 1920 × 1080 1920 × 1200 1920 × 1200 Input HD-SDI DVI DVI
Transcript of ON THE USE OF REFERENCE MONITORS IN … THE USE OF REFERENCE MONITORS IN SUBJECTIVE TESTING FOR HDTV...
ON THE USE OF REFERENCE MONITORS IN SUBJECTIVE TESTING FOR HDTV
Christian Keimel and Klaus Diepold
Technische Universitat Munchen, Institute for Data Processing, Arcisstr. 21, 80333 Munchen, [email protected], [email protected]
ABSTRACT
Most international standards recommend the use of reference moni-tors in subjective testing for visual quality. But do we really need touse reference monitors? In order to find an answer to this question,we conducted extensive subjective tests with reference, color cali-brated high quality and uncalibrated standard monitors. We not onlyused different HDTV sequences, but also two fundamentally differ-ent encoders: AVC/H.264 and Dirac. Our results show that usingthe uncalibrated standard monitor, the test subjects underestimatethe visual quality compared to the reference monitor. Between thereference and a less expensive color calibrated high quality monitor,however, we were unable to find a statistically significant differencein most cases. This might be an indication that both can be usedequivalently in subjective testing, although further studies will benecessary in order to get a definitive answer.
Index Terms— subjective testing, reference monitor, Dirac,AVC/H.264, HDTV.
1. INTRODUCTION
International standards on subjective testing for visual video qual-ity often recommend the use of professional reference monitors intests [1, 2]. The reasoning is, that these devices have only a negli-gible impact on the overall visual quality due to their superior builtquality and their strict adherence to video standards as ITU-R rec-ommendation BT.709 [3] for HDTV. Also their conformance to thestandards is guaranteed by the manufacturers and signal processingfor so-called picture enhancement found in many consumer devicesis omitted. Thus the influence of the displays on the visual qualityin subjective testing can be assumed to be a fixed, well known con-stant. Furthermore, the reproducibility of the results between differ-ent laboratories is therefore highly likely, presuming that all otherparameters are also fixed.
One problem in practice is, however, that such equipment israther expensive, even when compared to high quality computermonitors. This may not pose a problem for public and private broad-casting companies, the industry or specialized research institutesworking on visual quality, but for researchers and developers work-ing primarily on other research areas, these costs may very well beprohibitive. Imagine for example the developer of a video encoderwho wants to ascertain the visual quality achieved by his encoderduring development: he will be hard pressed to justify the costs foracquiring a reference monitor.
But do we really need to use reference monitors? Or might itbe sufficient to use less expensive color calibrated high quality com-puter monitors? In order to find a answer to these questions, we willcompare in this contribution the results of subjective visual tests per-formed using a reference monitor with the results obtained by usingnormal computer monitors.
We propose two different scenarios: firstly, a color calibratedhigh quality computer monitor to represent a sensible and reasonablypriced solution. Secondly, an uncalibrated standard computer moni-tor as a worst case scenario. We will perform the same subjective testwith the reference monitor, the color calibrated high quality monitorand the uncalibrated standard monitor in order to determine possi-ble differences in the perceived visual quality by the test subjects.We will use the HDTV test sequences from the SVT test set [4] andencode them with two different coding technologies AVC/H.264 [5]and Dirac [6,7]. As differences are more likely to occur at higher vi-sual quality, we selected only bit rates on the upper end of the scalefor encoding.
We do not intend to compare the visual quality of the differentmonitors themselves, but rather their influence on the results of sub-jective tests. The results achieved with the reference monitor will beconsidered to be the true visual quality in this context .To the best ofour knowledge this is the first contribution on this topic for HDTV.
This contribution is organized as follows: firstly, we will de-scribe the used monitors and their calibration. Then we introducethe setup of the subjective tests before presenting and discussing theresults. Finally, we conclude with a short summary.
2. EQUIPMENT
In this section we will briefly introduce the LCD monitors used andthe calibration process. We selected two additional monitors in addi-tion to our reference monitor representing high quality and standarddevices. Also we color calibrated the high quality monitor to get itas close as possible to our reference monitor.
2.1. LCD monitors
In addition to our Cine-tal Cinemage 2022 reference monitor, we se-lected two representatives for our proposed high quality and standardmonitor scenario: a monitor aimed at professional color processing,the EIZO CG243W, representing high quality devices and a normaloffice display, the Fujitsu-Siemens B24W-5, representing standarddevices. The first one was particularly chosen for the possibility of
Table 1: LCD monitors used in the test
Reference High Quality Standard
Type Cine-tal EIZO Fujitsu-SiemensCinemage 2022 CG243W B24W-5
Diagonal 24 inch 24 inch 24 inchResolution 1920× 1080 1920× 1200 1920× 1200Input HD-SDI DVI DVI
Christian
Schreibmaschinentext
© 2010 IEEE. Personal use of this material is permitted. Permission from IEEE must be obtained for all other uses, in any current or future media, including reprinting/republishing this material for advertising or promotional purposes, creating new collective works, for resale or redistribution to servers or lists, or reuse of any copyrighted component of this work in other works. Digital Object Identifier: 10.1109/QOMEX.2010.5518305

(a) (b) (c)
Fig. 1: The reference monitor (a), the color calibrated high quality monitor (b) and the uncalibrated standard monitor (c).
hardware color calibration i.e. not the 8 bit look-up table (LUT) inthe graphic card of the computer is modified during calibration, butthe internal 12 bit LUT in the display is directly modified, thus al-lowing a higher precision in calibrating without reducing the numberof available colors. The monitors are shown in Fig.1, further detailscan be found in Table 1.
The reference monitor was connected directly to our videoserver via a HD-SDI single link. As the high quality monitorsupports the desired HDTV resolution of 1920 × 1080, only a con-version from HD-SDI to HDMI/DVI was done using a AJA Hi5-3Gconverter, that also performed the expansion of the video signalfrom the video range (16–235) into the full range (0–255). Unfor-tunately the used standard monitor does not support the 16:9 inputsignal. Therefore a Doremi Labs GHX-10 cross converter was usedto display the 1920 × 1080 on the native 1920 × 1200 screen andalso to expand the video signal to the full range. On both monitorsthe video was shown with a 1:1 aspect ratio and letter boxing.
2.2. Calibration
For calibration we used a X-Rite i1 Pro spectrophotometer. Thecolor gamut, white point, color temperature and gamma were cho-sen according to ITU-R BT.709 [3]. The target luminance was set to100 cd
m2 , similar to most reference monitors. In Table 2 the target val-ues for the calibration and the measured values for the high qualitymonitor after calibration are shown.
Table 2: Calibration target and results
Target High Quality Standard(a)
Luminance [ cdm2 ] 100 100.18 332
Gamma 2.2 2.2 2.2Color Temperature 6504K 6541K 6900KWhite point [x,y] 0.313, 0.329 0.312, 0.329 0.309, 0.329
ChromaticityRed [x,y] 0.640, 0.330 0.639, 0.328 0.651, 0.318Green [x,y] 0.300, 0.600 0.298, 0.603 0.199, 0.660Blue [x,y] 0.150, 0.060 0.152, 0.059 0.149, 0.056
(a) uncalibrated
The standard monitor was not color calibrated but only reset toits factory defaults with a color temperature of 6500K and the sRGBcolor gamut. We then used the spectrophotometer to measure its col-orimetric properties. Table 2 shows clearly that not only the lumi-nance is too high, but that also the primaries are not matching ITU-R
Table 3: Tested video sequences
Sequence Frame Rate Bit Rate [MBit/s]
CrowdRun 25 fps 19.2 / 28.5InToTree 25 fps 13.1 / 17.1OldTownCross 25 fps 13.7 / 19.0ParkJoy 25 fps 20.1 / 30.9
BT.709 very well at its factory defaults. In particular the green pri-mary is way off, shifting the color gamut far into the green. Our testsubjects also remarked on the extremely high brightness comparedto the other monitors.
3. SUBJECTIVE TESTING
After describing the used equipment in the last section, we will nowdiscuss the selection of the used video sequences and encoder set-tings, but also the general test setup and the used methodology.
3.1. Sequences and Encoder Scenarios
We selected two different bit rates from 13 Mbit/s to 30 Mbit/s onthe upper end of the reasonable bit rate scale. These two rate pointsrepresent on one hand nearly perfect quality, where the coded videois often indistinguishable from the uncoded reference, and on theother hand still a very high quality, but with noticeable artifacts. Wedecided to use only comparably high bit rates as one can assume thatespecially for very high quality either inferior signal processing e.g.smaller LUTs or dithering in the monitor introduces significant non-coding artifacts like blurring or the unnatural presentation of colorslower the perceived visual quality. Whereas for lower bit rates, theoverall visual quality is already so bad, that additional degradationdue to the monitor does not play such an prominent part in the overallperception of the visual quality.
The test sequences were chosen from the SVT high definitionmulti format test set [4] with a spatial resolution of 1920×1080 pixeland a frame rate of 25 frames per second (fps) was used. The particu-lar sequences are CrowdRun, ParkJoy, InToTree and OldTownCross.Each of those videos was encoded at the selected bit rates. The ar-tifacts introduced into the videos by this encoding include pump-ing effects i.e. periodically changing quality, a typical result of ratecontrol problems, obviously visible blocking, blurring or ringing ar-tifacts, flicker, banding i.e. unwanted visible changes in color andsimilar effects. An overview of the sequences and bit rates is givenin Table 3.
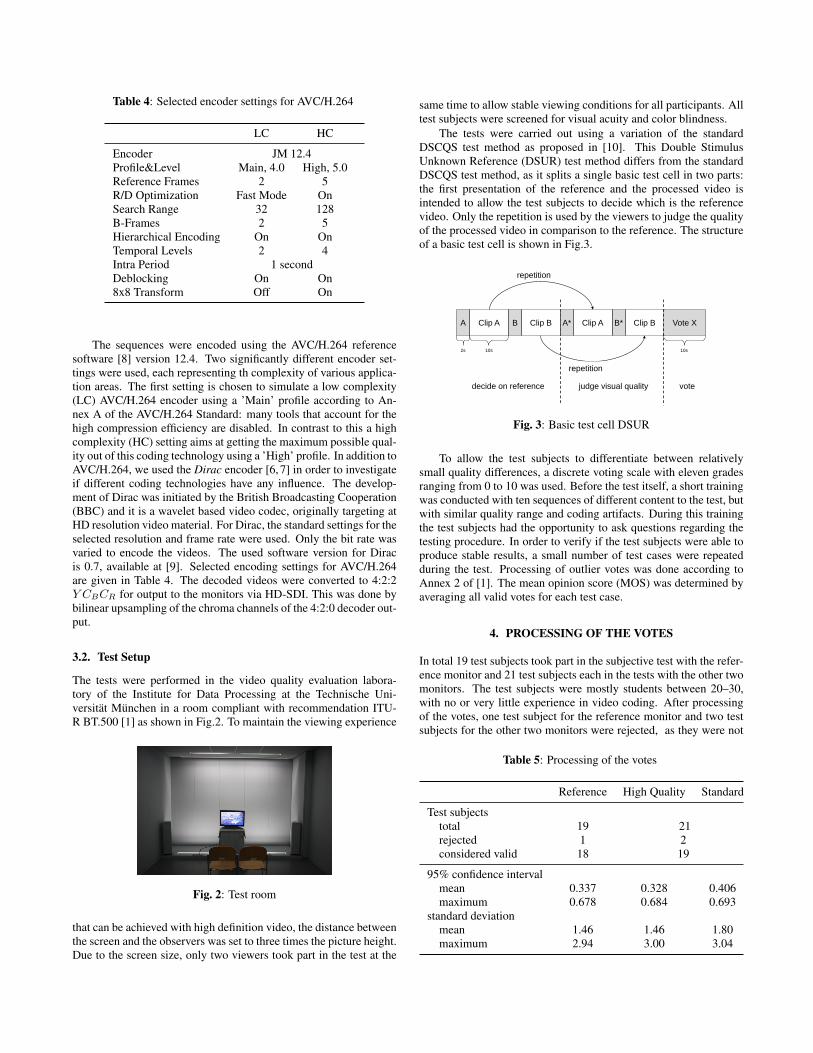
Table 4: Selected encoder settings for AVC/H.264
LC HC
Encoder JM 12.4Profile&Level Main, 4.0 High, 5.0Reference Frames 2 5R/D Optimization Fast Mode OnSearch Range 32 128B-Frames 2 5Hierarchical Encoding On OnTemporal Levels 2 4Intra Period 1 secondDeblocking On On8x8 Transform Off On
The sequences were encoded using the AVC/H.264 referencesoftware [8] version 12.4. Two significantly different encoder set-tings were used, each representing th complexity of various applica-tion areas. The first setting is chosen to simulate a low complexity(LC) AVC/H.264 encoder using a ’Main’ profile according to An-nex A of the AVC/H.264 Standard: many tools that account for thehigh compression efficiency are disabled. In contrast to this a highcomplexity (HC) setting aims at getting the maximum possible qual-ity out of this coding technology using a ’High’ profile. In addition toAVC/H.264, we used the Dirac encoder [6, 7] in order to investigateif different coding technologies have any influence. The develop-ment of Dirac was initiated by the British Broadcasting Cooperation(BBC) and it is a wavelet based video codec, originally targeting atHD resolution video material. For Dirac, the standard settings for theselected resolution and frame rate were used. Only the bit rate wasvaried to encode the videos. The used software version for Diracis 0.7, available at [9]. Selected encoding settings for AVC/H.264are given in Table 4. The decoded videos were converted to 4:2:2Y CBCR for output to the monitors via HD-SDI. This was done bybilinear upsampling of the chroma channels of the 4:2:0 decoder out-put.
3.2. Test Setup
The tests were performed in the video quality evaluation labora-tory of the Institute for Data Processing at the Technische Uni-versitat Munchen in a room compliant with recommendation ITU-R BT.500 [1] as shown in Fig.2. To maintain the viewing experience
Fig. 2: Test room
that can be achieved with high definition video, the distance betweenthe screen and the observers was set to three times the picture height.Due to the screen size, only two viewers took part in the test at the
same time to allow stable viewing conditions for all participants. Alltest subjects were screened for visual acuity and color blindness.
The tests were carried out using a variation of the standardDSCQS test method as proposed in [10]. This Double StimulusUnknown Reference (DSUR) test method differs from the standardDSCQS test method, as it splits a single basic test cell in two parts:the first presentation of the reference and the processed video isintended to allow the test subjects to decide which is the referencevideo. Only the repetition is used by the viewers to judge the qualityof the processed video in comparison to the reference. The structureof a basic test cell is shown in Fig.3.
A B A* B*Clip A Clip B Clip A Clip B Vote X
2s 10s
repetition
repetition
10s
votedecide on reference judge visual quality
Fig. 3: Basic test cell DSUR
To allow the test subjects to differentiate between relativelysmall quality differences, a discrete voting scale with eleven gradesranging from 0 to 10 was used. Before the test itself, a short trainingwas conducted with ten sequences of different content to the test, butwith similar quality range and coding artifacts. During this trainingthe test subjects had the opportunity to ask questions regarding thetesting procedure. In order to verify if the test subjects were able toproduce stable results, a small number of test cases were repeatedduring the test. Processing of outlier votes was done according toAnnex 2 of [1]. The mean opinion score (MOS) was determined byaveraging all valid votes for each test case.
4. PROCESSING OF THE VOTES
In total 19 test subjects took part in the subjective test with the refer-ence monitor and 21 test subjects each in the tests with the other twomonitors. The test subjects were mostly students between 20–30,with no or very little experience in video coding. After processingof the votes, one test subject for the reference monitor and two testsubjects for the other two monitors were rejected, as they were not
Table 5: Processing of the votes
Reference High Quality Standard
Test subjectstotal 19 21rejected 1 2considered valid 18 19
95% confidence intervalmean 0.337 0.328 0.406maximum 0.678 0.684 0.693
standard deviationmean 1.46 1.46 1.80maximum 2.94 3.00 3.04

6
7
8
9
10
ndar
d m
onito
r [M
OS]
y = 1,0219x - 1,4272R² = 0,8817
4
5
6
7
8
9
10
4 5 6 7 8 9 10
stan
dard
mon
itor [
MO
S]
reference monitor [MOS]
Fig. 4: Reference monitor compared to standard monitor including95% confidence intervals and linear regression line.
6
7
8
9
10
ndar
d m
onito
r [M
OS]
AVC HCAVC LC
4
5
6
7
8
9
10
4 5 6 7 8 9 10
stan
dard
mon
itor [
MO
S]
reference monitor [MOS]
AVC HCAVC LCDirac
CrowdRunInToTreeOldTownCrossParkJoy
Fig. 5: Reference monitor compared to standard monitor with detailson sequence and codec.
able to reproduce their own results. All votes of these subjects wereremoved from the data base. Hence we considered 18 test subjectsfor the reference monitor and 19 test subjects for the other two mon-itors in the further processing of the votes.
Some of the results for the reference display have already beenused in [11, 12]. The mean and maximum of the 95% confidenceintervals and the standard deviation of the subjective votes over allsingle test cases, separated according to the different tests is shownin Table 5. We can already see now from Table 5 that the standardmonitor exhibits a larger variance of the votes.
5. RESULTS
The results of the subjective test are shown in detail in Fig. 8 toFig. 11. Unfortunately the results do not show a obvious generaltendency regarding the influence of the used monitors on the visualquality. One thing we notice is, that the standard monitor apparentlyleads to a statistical significant, consistent underestimation of theperceived visual quality by the test subjects. Also the uncertainty isreduced at the higher rate point as shown by the reduced confidenceintervals. But between reference monitor and high quality monitor,
7
8
9
10
qual
ity m
onito
r [M
OS]
y = 0,7874x + 1,6707R² = 0,8191
5
6
7
8
9
10
5 6 7 8 9 10
high
qua
lity
mon
itor [
MO
S]
reference monitor [MOS]
Fig. 6: Reference monitor compared to high quality monitor includ-ing 95% confidence intervals and linear regression line.
7
8
9
10
qual
ity m
onito
r [M
OS]
AVC HCAVC LC
5
6
7
8
9
10
5 6 7 8 9 10
high
qua
lity
mon
itor [
MO
S]
reference monitor [MOS]
AVC HCAVC LCDirac
CrowdRunInToTreeOldTownCrossParkJoy
Fig. 7: Reference monitor compared to high quality monitor withdetails on sequence and codec.
there is often no statistical significant difference noticeable betweenthe votes.
In Fig. 4 we can see more clearly that the standard monitor leadsto an underestimation of the visual quality. If we perform a linearregression, we notice that the slope is close to the desired 1, whilewe have a constant offset of −1, 43. Thus the visual quality is al-ways perceived lower. Additionally we can see in Fig. 5 that thisunderestimation occurs regardless of sequence or codec. This seemsto confirm our earlier assumption that a standard monitor reduces theperceived quality in particular at high bit rates. If this also holds truein general for lower quality video is an open question.
The results for the high quality monitor, however, do not exhibitsuch a obvious behavior as we can see in Fig. 6. If we once againperform a linear regression, we get a slope of 0.78 and an offset of+1.67. Note that the coefficient of determination R2 is lower thanfor the standard monitor, suggesting that the linear model in this caseis not able to describe the variance of the data as well as before. Ingeneral there does not seem to be a statical significant differencebetween the high quality and reference monitor in most cases. Thismight be caused by the low statistical sample size of only 19 differentsamples. Even tough in [13] the lower bound of 15 test subjects was

shown to be sufficient, it may be that due to the apparently smallquality difference between the results from the two different tests,more test subjects are needed in order to further reduce the variance.
Nevertheless, we can notice that there are small differences notonly depending on sequence, but especially on the used video codec.If we look on the comparison between reference and high qualitymonitor in detail in Fig. 7, we notice that the visual quality on thehigh quality monitor seems to be underestimated for AVC HC andDirac, but overestimated for AVC LC. This shows that it is not onlyimportant to use different sequences, but also to use different en-coders as proposed in [14].
6. CONCLUSION
We compared a reference monitor to a color calibrated high qualitymonitor and a standard monitor with regards to their use in subjec-tive testing for HDTV. In order to achieve this goal, we performedextensive subjective tests using different sequences and codecs. Weselected two different rate points at the upper end of the bit rate scale.
Our results show, that if we use a uncalibrated standard monitorin subjective testing, the visual quality is usually underestimated bythe test subjects compared to the reference monitor. Between a refer-ence monitor and color calibrated, less expensive high quality mon-itor, however, we were not able to determine a statistical significantdifference between the results from subjective tests conducted witheither one in most cases. But we should keep in mind that we onlyhave a rather small sample size, so this might only be an indicationthat a reference monitor and a high quality monitor are equivalent intheir use in subjective testing.
Moreover, we have seen that not only the different sequences i.e.different content influenced the perceived visual quality on the dif-ferent monitors, but also that the different coding technologies madea difference. Therefore it is sensible to not only include different se-quences, but also different codecs in subjective testing. Especially ifgeneral questions regarding subjective testing are to be considered.
In future work we will aim at further determining what differ-ence –if any at all– between reference and hight quality monitorsexists with regard to subjective testing.
7. REFERENCES
[1] ITU-R BT.500 Methodology for the Subjective Assessment ofthe Quality for Television Pictures, ITU-R Std., Rev. 11, Jun.2002.
[2] ITU-R BT.710 Subjective assessment methods for image qual-ity in high-definition television, ITU-R Std., Rev. 4, Nov. 1998.
[3] ITU-R BT.709: Parameter values for the HDTV standardsfor production and international programme exchange, ITU-R Std., Rev. 5, Apr. 2002.
[4] SVT. (2006, Feb.) The SVT high definition multi format testset. [Online]. Available: http://www.ldv.ei.tum.de/lehrstuhl/team/Members/tobias/sequences
[5] ITU-T Rec. H.264 and ISO/IEC 14496-10 (MPEG4-AVC), Ad-vanced Video Coding for Generic Audiovisual Services, ITU,ISO Std., Rev. 4, Jul. 2005.
[6] T. Borer, T. Davies, and A. Suraparaju, “Dirac video compres-sion,” BBC Research & Development, Tech. Rep. WHP 124,Sep. 2005.
[7] T. Borer and T. Davies, “Dirac - video compression using opentechnology,” BBC Research & Development, Tech. Rep. WHP117, Jul. 2005.
[8] K. Suhring. (2007) H.264/AVC software coordination. [On-line]. Available: http://iphome.hhi.de/suehring/tml/index.htm
[9] C. Bowley. Dirac video codec developers’ website. [Online].Available: http://dirac.sourceforge.net
[10] V. Baroncini, “New tendencies in subjective video quality eval-uation,” IEICE Transaction Fundamentals, vol. E89-A, no. 11,pp. 2933–2937, Nov. 2006.
[11] C. Keimel, T. Oelbaum, and K. Diepold, “No-reference videoquality evaluation for high-definition video,” Acoustics, Speechand Signal Processing, 2009. ICASSP 2009. IEEE Interna-tional Conference on, pp. 1145 –1148, April 2009.
[12] ——, “Improving the prediction accuracy of video qualtiy met-rics.” Acoustics, Speech and Signal Processing, 2010. ICASSP2010. IEEE International Conference on, pp. 2442–2445, Mar.2010.
[13] S. Winkler, “On the properties of subjective ratings in videoquality experiments,” Quality of Multimedia Experience, 2009.QoMEx 2009. International Workshop on, pp. 139 –144, July2009.
[14] C. Keimel, T. Oelbaum, and K. Diepold, “Improving the verifi-cation process of video quality metrics,” Quality of MultimediaExperience, 2009. QoMEx 2009. International Workshop on,pp. 121 –126, July 2009.
Vote: X
AReference
AB
10VERY GOOD 9
8GOOD 7
6FAIR 5
4POOR 3
22BAD 1
0
Fig. 12: Discrete eleven point voting scale as used in the tests.
(a) Reference monitor (b) High quality monitor
(c) Standard monitor
Fig. 13: Test setups for the different monitors.

6 0
7,0
8,0
9,0
10,0
al q
ualit
y [M
OS]
4,0
5,0
6,0
7,0
8,0
9,0
10,0
15 20 25 30
visu
al q
ualit
y [M
OS]
bit rate [MBit/s]
standardhigh qualityreference
(a) Dirac
6 0
7,0
8,0
9,0
10,0
al q
ualit
y [M
OS]
4,0
5,0
6,0
7,0
8,0
9,0
10,0
15 20 25 30
visu
al q
ualit
y [M
OS]
bit rate [MBit/s]
standardhigh qualityreference
(b) AVC HC
6 0
7,0
8,0
9,0
10,0
al q
ualit
y [M
OS]
4,0
5,0
6,0
7,0
8,0
9,0
10,0
15 20 25 30
visu
al q
ualit
y [M
OS]
bit rate [MBit/s]
standardhigh qualityreference
(c) AVC LC
Fig. 8: Results for the subjective tests with the reference, high quality and standard monitor for CrowdRun .
6 0
7,0
8,0
9,0
10,0
al q
ualit
y [M
OS]
4,0
5,0
6,0
7,0
8,0
9,0
10,0
15 20 25 30
visu
al q
ualit
y [M
OS]
bit rate [MBit/s]
standardhigh qualityreference
(a) Dirac
6 0
7,0
8,0
9,0
10,0
al q
ualit
y [M
OS]
4,0
5,0
6,0
7,0
8,0
9,0
10,0
15 20 25 30
visu
al q
ualit
y [M
OS]
bit rate [MBit/s]
standardhigh qualityreference
(b) AVC HC
6 0
7,0
8,0
9,0
10,0
al q
ualit
y [M
OS]
4,0
5,0
6,0
7,0
8,0
9,0
10,0
15 20 25 30
visu
al q
ualit
y [M
OS]
bit rate [MBit/s]
standardhigh qualityreference
(c) AVC LC
Fig. 9: Results for the subjective tests with the reference, high quality and standard monitor for ParkJoy .
6 0
7,0
8,0
9,0
10,0
al q
ualit
y [M
OS]
4,0
5,0
6,0
7,0
8,0
9,0
10,0
10 15 20
visu
al q
ualit
y [M
OS]
bit rate [MBit/s]
standardhigh qualityreference
(a) Dirac
6 0
7,0
8,0
9,0
10,0
al q
ualit
y [M
OS]
4,0
5,0
6,0
7,0
8,0
9,0
10,0
10 15 20
visu
al q
ualit
y [M
OS]
bit rate [MBit/s]
standardhigh qualityreference
(b) AVC HC
6 0
7,0
8,0
9,0
10,0
al q
ualit
y [M
OS]
standardhigh qualityreference
4,0
5,0
6,0
7,0
8,0
9,0
10,0
10 15 20
visu
al q
ualit
y [M
OS]
bit rate [MBit/s]
standardhigh qualityreference
(c) AVC LC
Fig. 10: Results for the subjective tests with the reference, high quality and standard monitor for InToTree .
6 0
7,0
8,0
9,0
10,0
al q
ualit
y [M
OS]
4,0
5,0
6,0
7,0
8,0
9,0
10,0
10 15 20
visu
al q
ualit
y [M
OS]
bit rate [MBit/s]
standardhigh qualityreference
(a) Dirac
6 0
7,0
8,0
9,0
10,0
al q
ualit
y [M
OS]
4,0
5,0
6,0
7,0
8,0
9,0
10,0
10 15 20
visu
al q
ualit
y [M
OS]
bit rate [MBit/s]
standardhigh qualityreference
(b) AVC HC
6 0
7,0
8,0
9,0
10,0
al q
ualit
y [M
OS]
4,0
5,0
6,0
7,0
8,0
9,0
10,0
10 15 20
visu
al q
ualit
y [M
OS]
bit rate [MBit/s]
standardhigh qualityreference
(c) AVC LC
Fig. 11: Results for the subjective tests with the reference, high quality and standard monitor for OldTownCross .