On the use of long term observation of water level and ...
29
1 On the use of long term observation of water level and temperature along the shore for a better understanding of the dynamics: Example of Toulon area, France Vincent REY 1,* , Christiane DUFRESNE 2 , Jean-Luc FUDA 1 , Didier MALLARINO 1 , Tathy MISSAMOU 1 , Caroline PAUGAM 1 , Gilles ROUGIER 1 , Isabelle TAUPIER- LETAGE 1 1. Université de Toulon, CNRS/INSU, IRD, Mediterranean Institute of Oceanography (MIO), UM 110, 83041 Toulon Cedex 09, France. Aix Marseille Université, CNRS/INSU, IRD, Mediterranean Institute of Oceanography (MIO), OSU PYTHEAS, UM 110, 13288 Marseille, France. 2. Université du Québec à Rimouski, Institut des Sciences de la Mer (UQAR-ISMER), Rimouski, Canada * Corresponding author: [email protected] Abstract : A dense network of instruments has been deployed within harbours along the Mediterranean coast, in the Toulon Metropole area, between the Hyères islands and the Sanary Bay in the framework of the observation network HTM-NET. Each station is equipped with two piezometric sensors, the first immersed and the second emerged, which allows the calculation of the water level. Both piezometric sensors are also equipped with a temperature sensor. Water level and temperature data are analyzed and discussed, also considering meteorological data provided by Météo-France stations. The tide gauges provide information about tide harmonic components, extreme water level and seiching. Moreover, significant differences are observed between sheltered zones in enclosed bays and offshore zones, such as between the back of the Bay of Toulon and at the Port-Cros Island. Differences in water level up to 0.10m are indeed observed under windy conditions, of same order as the tidal range (order of 0.20m) or the annual level variability due to the volumetric expansion (order of 0.10m). Water level variations, up to about 1m, are found to be mainly due to atmospheric effects, with a more or less isostatic behavior according to the weather events. In addition, seiching with an amplitude of few centimeters is observed within the Little Bay of Toulon, for east wind conditions. The near-surface water temperature is measured at the submerged piezometer location (depth of immersion range 0.10m - 1.80m according to the station and to the water level). The analysis of the temperature associated with the weather conditions allows to detail a strong variability of the upwelling intensity under Mistral wind conditions in summer, leading to more or less pronounced temperature drops according to the shore configuration. The Bay of Toulon is more prone to the generation of upwellings than the neighboring bays. During winter, water exchanges between the Little Bay of Toulon and offshore are also clearly observed during windy conditions. The HTM-NET long-term observation network thus provides useful insights to increase our knowledge of the hydrodynamics and mass fluxes, and therefore enhances our modeling capacity and risk assessment at the scale of a bay. Key-words: Observation network, water level, temperature, tide, extreme water level, seiching, upwelling, water mass mixing.
Transcript of On the use of long term observation of water level and ...

1
On the use of long term observation of water level and temperature along the shore for a better understanding of the
dynamics: Example of Toulon area, France
Vincent REY 1,*, Christiane DUFRESNE 2, Jean-Luc FUDA 1, Didier MALLARINO 1,
Tathy MISSAMOU 1, Caroline PAUGAM 1, Gilles ROUGIER 1, Isabelle TAUPIER-
LETAGE 1
1. Université de Toulon, CNRS/INSU, IRD, Mediterranean Institute of Oceanography (MIO), UM
110, 83041 Toulon Cedex 09, France.
Aix Marseille Université, CNRS/INSU, IRD, Mediterranean Institute of Oceanography (MIO),
OSU PYTHEAS, UM 110, 13288 Marseille, France.
2. Université du Québec à Rimouski, Institut des Sciences de la Mer (UQAR-ISMER), Rimouski,
Canada
* Corresponding author: [email protected]
Abstract :
A dense network of instruments has been deployed within harbours along the Mediterranean
coast, in the Toulon Metropole area, between the Hyères islands and the Sanary Bay in the framework
of the observation network HTM-NET. Each station is equipped with two piezometric sensors, the first
immersed and the second emerged, which allows the calculation of the water level. Both piezometric
sensors are also equipped with a temperature sensor. Water level and temperature data are analyzed and
discussed, also considering meteorological data provided by Météo-France stations. The tide gauges
provide information about tide harmonic components, extreme water level and seiching. Moreover,
significant differences are observed between sheltered zones in enclosed bays and offshore zones, such
as between the back of the Bay of Toulon and at the Port-Cros Island. Differences in water level up to
0.10m are indeed observed under windy conditions, of same order as the tidal range (order of 0.20m) or
the annual level variability due to the volumetric expansion (order of 0.10m). Water level variations, up
to about 1m, are found to be mainly due to atmospheric effects, with a more or less isostatic behavior
according to the weather events. In addition, seiching with an amplitude of few centimeters is observed
within the Little Bay of Toulon, for east wind conditions. The near-surface water temperature is
measured at the submerged piezometer location (depth of immersion range 0.10m - 1.80m according to
the station and to the water level). The analysis of the temperature associated with the weather conditions
allows to detail a strong variability of the upwelling intensity under Mistral wind conditions in summer,
leading to more or less pronounced temperature drops according to the shore configuration. The Bay of
Toulon is more prone to the generation of upwellings than the neighboring bays. During winter, water
exchanges between the Little Bay of Toulon and offshore are also clearly observed during windy
conditions. The HTM-NET long-term observation network thus provides useful insights to increase our
knowledge of the hydrodynamics and mass fluxes, and therefore enhances our modeling capacity and
risk assessment at the scale of a bay.
Key-words: Observation network, water level, temperature, tide, extreme water level, seiching,
upwelling, water mass mixing.
2
1. Introduction
The Mediterranean and in particular its coastal zones are exposed to natural and man-made
hazards. Coastal vulnerability is exacerbated by climate change, leading to the development of risk
analysis plans (see e.g. Nicholls and Hoozemans, 1996; Satta et al, 2017). The study of coastal dynamics
is often complex, and must integrate both circulation at the basin scale and local forcing. Classical
numerical approaches use nested models, which allow a detailed description of the dynamics at the bay
scale with a high-resolution model, while offshore forcing at the open boundary is provided by a large
scale model. This was done for instance for the Gulf of Taranto in Italy (Gaeta et al, 2016; Federico et
al, 2017), or the Bay of Toulon (Dufresne et al, 2014). Such numerical approaches are validated in the
coastal zone of interest by the use of data including velocity fields, surface current, water temperature
profiles, sea level, often collected at the seasonal scale. Water level at the shore, in the same way as the
dynamics at the Western Mediterranean scale, are characterized however by a pluri-annual variability,
due to both weather conditions at the Mediterranean basin scale and the North Atlantic dynamics
(Tsimplis and Shaw, 2008). Coastal water levels have been measured for many decades by tide gauges,
supplemented at the scale of the ocean basins by satellite measurements (see e.g Vigo et al, 2011). While
satellite measurements allow a detailed study of the water level variability at seasonal or multiannual
scales, measurements in the coastal fringe remain a challenge despite recent improvement in the spatial
resolution, that allows small-scale observation of ocean dynamics (Morrow et al, 2017). Sea level at the
coast have then to be validated with a few tide gauge, located in major ports, most often several hundred
kilometers apart in the Western Mediterranean (Bonaduce et al, 2016).
In the Western Mediterranean, the tidal range is generally low, and most of the water level
variations at the scale of several days are then related to the atmospheric pressure variations associated
to weather events. The barometric factor, which is the ratio between the water level and the atmospheric
pressure variations is generally of -1cm/hPa. Significant differences may however exist. They can be
due to long wave propagation over continental shelves, as pointed out by Hamon (1956). They are also
observed in semi-enclosed basins (Garrett, 1983; Tsimplis et al, 1994). In the Mediterranean for
instance, the water level variation may not follow the atmospheric pressure variations without the
conjunction of currents within straights or passages. Such level variations may lead to flooding and
erosion, with possible damages in anthropized areas. Many studies have been carried-out to better
understand the sea-level variation at the scale of the Mediterranean basin, including tide gauges and
altimetric data and numerical modelling (Tsimplis et al, 1995; Fenoglio-Marc, 2002; Vigo et al, 2005;
Oddo et al, 2014; Bonaduce et al, 2016). For a better insight of coastal risks such as flooding or erosion,
nested models including global and regional circulation, representing atmospheric and oceanic dynamics
are proposed. They may be used to produce sea-level rise hazard scenarios as done by Torresan et al
(2019) for the North Adriatic Sea coast, characterized by a large tide range and prone to frequent storm
surge flooding.
The North Western Mediterranean circulation along the coast is governed by the Northern Current,
with a flow rate of about 1 Sverdrup (106 m3·s-1) (Millot and Taupier-Letage, 2005). Originating between
North Corsica and the gulf of Genoa, it follows the continental slope up the Hyères islands, where its
dynamics becomes more complex due to both a complex bathymetry and the beginning of the
continental shelf of the Gulf of Lions at the west of Toulon (Guihou, 2013 ; Guihou et al, 2013 ; Taupier-
Letage et al., 2013; Berta et al, 2018). The tidal current is weak since the mean tidal range is low,
approximately 0.20 m (Albérola et al., 1995). Its variability is due to both the dynamics at the scale of
the Western Mediterranean basin and the weather conditions on the northern coasts. The low Rossby
number, of the order of 5 to 15 km and variable according to the stratification (Grilli and Pinardi, 1998),
requires a refinement of the large scale models and the observation of fine-scale dynamics for its
validation. Morrow et al (2018) recently studied small-scale circulation in the Northwestern
Mediterranean Sea from long-term observations of the sea level and the sea surface temperature (SST)
from satellite data, and coastal surface currents from VHF radar, associated with salinity and velocity
measurements in the water column from gliders deployed offshore. Promising results were obtained
concerning the capture of fine-scale dynamics, even if further developments were proposed in the coastal
band to separate geostrophic and ageostrophic current components. Indeed, wind conditions play an

3
important role in the variability of the upper part of the Northern Current as observed by Berta et al
(2018) during strong westerly wind events. During summertime (stratified conditions), upwelling cells
develop in some specific places of the gulf of Lions, which induce episodically a strong cooling of water
near the coast, as already reported fourty years ago by Millot (1979). These water mass dynamics play
an important role in the water mass exchanges along the coast, especially within the bays, as reported
by Dufresne et al (2014; 2018) for the Bay of Toulon, an urbanized and industrial center with pollution
hazards. Water temperature is also a key parameter to monitor, since its evolution (increase) with climate
change is expected to impact the marine life. Large-scale positive temperature anomalies already
occurred in the northwestern Mediterranean Sea in 1999, 2003 and 2006 (Pairaud et al, 2014 and
references cited). These anomalies were associated with mass mortality events of macrobenthic species
in coastal areas (0–40 m in depth). In addition, recent studies highlight the significant contribution of
the SST to heavy precipitation events and heat waves in Europe, as mentioned by Pastor et al (2018), in
their detailed analysis of daily SST data series derived from satellites. However, such a data only gives
information on the surface layer, and are noisy and hardly exploitable in the nearshore. The deployment
of CTD probes allows measurements of vertical temperature and salinity profiles. They are generally
used during field campaigns, and adapted to either ocean or coastal measurements. Measurements in
deep water conditions have been also provided by drifting autonomous instruments since the 1980’s, as
in the framework of the MedArgo program (Poulain et al, 2007). Glider transects have also been used
more recently in the Western Mediterranean, as reported for instance by Berta et al (2018). In the
nearshore, temperature sensors are often available on wave buoys or currentmeters. Characterization of
local temperature and stratification is very important for a better understanding and modelling of the
interannual variability in the nearshore. A high resolution temperature time series is provided by the T-
MEDNet data base (Bensoussan et al, 2018) for coastal waters in the range 5-40m spanning more than
10 years, mainly along the shores of the northern half of the Mediterranean. The seasonal and multi-
annual variability observed from the large scale circulation to the scale of the bay demonstrates the need
to collect long term time series.
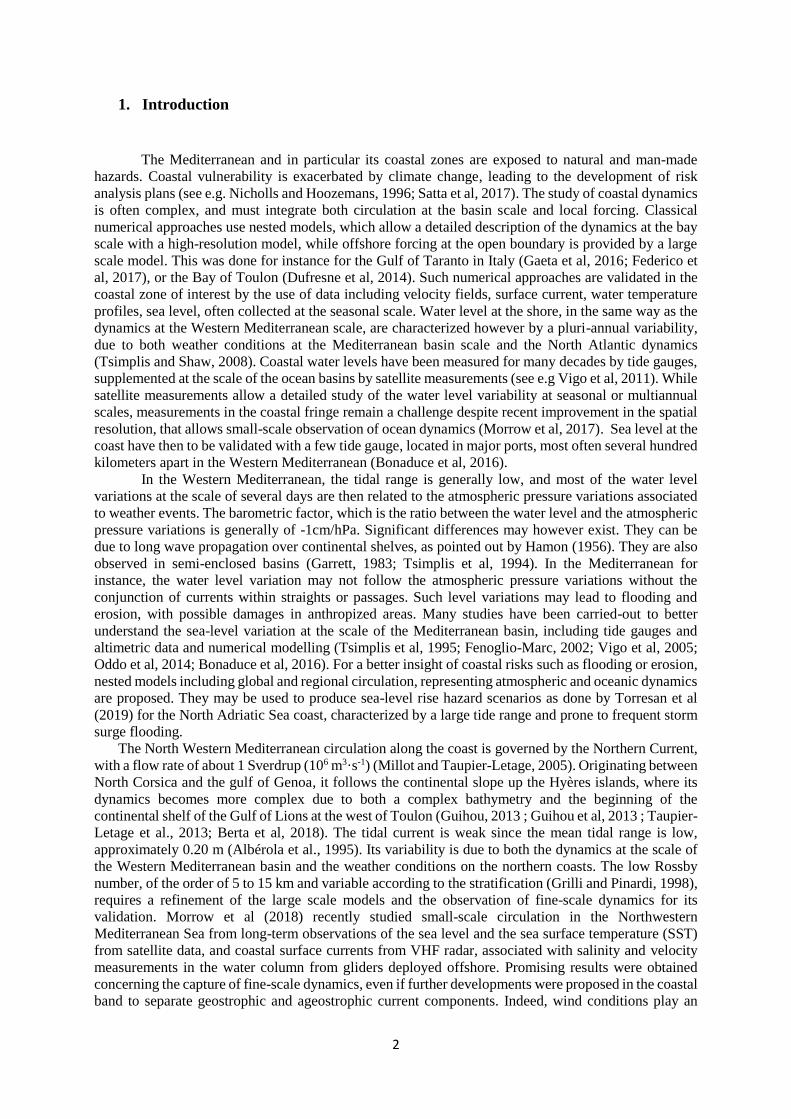
Toulon is located on the north coast of the Western Mediterranean (Fig. 1). The Toulon area
is exposed to the threat of the sea level increase with climate change, particularly towards the peninsula
of Giens (Mavromatidi et al, 2018). It is also an urbanized zone, with varied socio-economic activities.
Recent studies have focused on the dynamics of the Bay of Toulon for socio-economic purposes
(Dufresne et al, 2014 and 2018). During these latest studies, some questions arose about the possible
effects of the water level differences at the scale of the bays on induced flows. Indeed, if wind-forced
mass-flux between the Little Bay of Toulon and offshore were clearly observed and modelled,
significant currents at the entrance of the Little Bay are sometimes also observed under calm wind
conditions (Dufresne, 2014). If sea level data has been collected for a long time by the tide gauge of
Toulon, located at the back of the Little Bay (see Fig. 1), no other information on the water level
variability was available in the area of interest, since tide gauges are only few and restricted to the
Mediterranean main harbors (see e.g. Bonaduce et al, 2016). Since strong upwelling events are also
observed in the area of Toulon, information on sea surface temperature also appears as a key parameter
to better understand the water circulation and mass exchanges at the bay scale. It was then decided to
develop a dense network of instruments for the long term measurement of water level and near-surface
temperature within and around the Bay of Toulon.
The aim of the present paper is to give an overview of the potentiality of such a long-term dataset
to provide insights on the variability of the water level and of the near-surface temperature, from one
bay to another, on time scales ranging from the weather episode to the season, and up to the interannual
variability. The area of study is presented in section 2, the network in section 3. Water level and near-
surface temperature changes are presented and analyzed in sections 4 and 5 respectively. Discussion and
conclusion are given in section 6.
2. Description of the study area
East of the Sanary bay the continental shelf is very narrow (Fig. 1), so that the Northern Current,
guided by the continental slope (upper part at ~200m), flows close to the coast. Westward, the Northern
Current follows the continental slope off the Gulf of Lions, while a superficial branch often continues
4
inside the gulf and follows the coastline. Mesoscale dynamics is mainly forced by the Northern Current
instability, more intense in wintertime (e.g. Millot, 1987). Its width can vary due to the meanders it
generates, and that propagate downstream (see Fig. 8 in Taupier-Letage et al., 2013, and Fig. 7 in Van
Haren et al., 2011). In addition, due to the abrupt bathymetry near the Hyères islands, meanders may
form downstream the islands (Berta et al, 2018), which may affect the nearshore circulation. The
coastline in the vicinity of Toulon, France, presents many types of configurations including open or
semi-enclosed bays of intermediate or shallow water, peninsulas, and islands. The strongly anthropized
area of Toulon Metropole neighbors the preserved area of the National Park of Port-Cros. Socio-
economic activities and interests are various and sometimes conflicting, with fisheries and a strongly
developed tourism on one hand, and military, Toulon being France's largest naval port, or civilian
maritime economic activities on the other hand.
There are two main prevailing winds: the Mistral, a cold and dry north-westerly wind which
blows 40% of the time, and the East Wind, which is warmer and more humid. Calm weather with low
wind speed (< 5m·s-1) occurs 20% of the time. Originating offshore, the East wind is usually
accompanied by clouds, rain and swell, it blows less frequently during summer and corresponds to low
atmospheric pressure conditions. The fall and winter seasons are often characterized by a succession of
strong Mistral and East wind events. As described by Dufresne et al. (2014), the circulation within the
Bay of Toulon is mainly wind-driven, with several episodes of either upwelling or downwelling
according to the wind direction. Such a water mass dynamics has also been described at other locations
on the French Riviera such as Cassis (Albérola and Millot, 2003) or Marseille (Pairaud et al. 2011).
Toulon is surrounded by rugged hills that influence weather conditions, particularly rainfall and wind
speeds and directions. Several weather stations, operated by Météo-France, the French national
meteorological and climatological service, are therefore installed in the area of interest. The wind data
of the stations of Cépet, Toulon, Porquerolles and Levant (see locations in Fig. 1) are used in this study.
Toulon's port is equipped with a tide-gauge RONIM since March 1998, using a Radar gauge
since 2008, located at the back of the Little Bay of Toulon (see Fig.1). The observatory is managed by
the hydrographic service of the Navy (Shom).
Fig. 1. Studied area and location of the stations.

5
3. The HTM-NET network
Ten instruments compose the HTM-NET network in the Toulon Metropole area (HTM-NET
network https://htmnet.mio.osupytheas.fr). Instruments are installed within harbors from the Island of
Port-Cros to the Sanary Bay (see Fig. 1). The sites and their date of installation are given in Tab. 1. Two
piezometric sensors, manufactured by the society Keller, measure both pressure and temperature. One
sensor is immersed all the time (series 36XiW), the other one is aerial (series ARC1) (Fig.2). The aerial
sensor houses the GSM transmission system and the data storage unit, to prevent data loss in the event
of the GSM malfunction. As of now, the memory capacity allows 65 days at a 10-minute sampling
period. To date, 8 of the 10 stations are equipped with a GSM transmitter, which makes data available
within few hours on the network’s web site. Sensors are fixed on both ends and inside of a cylindrical
tube made of PVC, fixed inside of a protection tube of diameter 0.15m made of aluminum (see Fig. 2).
The PVC cylinder is removable to allow maintenance operations. The aluminium cylinder is fixed
vertically next to piers or pontoons. Cylindrical tubes are 2m long, their depth of immersion slightly
varies from one site to another according to the harbor pier height. The depth of immersion of the sensor
is in the range 0.10m - 1.80m according to the water level and the pier height.
Neglecting the pressure variation in the air column, the water level relative to the lower
pressure sensor location is given by = p/g, p being the difference between the pressure measured
by both sensors, the water density and g=9.81m.s-2 the acceleration due to gravity. For the processing,
water density is fixed at 1025kg.m-3, which corresponds to a salinity S=35 PSU and a temperature
T=19°C. The variations of density from S=32 PSU to S=38 PSU, or of temperature from 14°C to 25°C,
result in less than 2% (about 1mm) of uncertainty on the water level, which corresponds to the precision
of the pressure measurements. Each piezometer is equipped with a temperature gauge (requested for the
computation of the pressure), having a precision of 0.5°C.
Data was collected every 10 min up to the beginning of the year 2019. Biofouling impact on the
measurements is found to remain weak even on long periods, instruments are however cleaned at least
once a year. The proximity between the La Seyne/Ifremer station and the Shom tide gauge initially made
it possible to readjust the HTM-NET station data with respect to the French hydrographic reference NGF
by comparing them with those of the Shom tide gauge, the latter being provided with respect to the zero
NGF. For a precise sea level reference, HTM-NET station level data are referenced with respect to the
French hydrographic reference NGF thanks to the French Navy hydrographic service Shom. Water level
data are also available on the Shom REFMAR web site (tide reference, www.refmar.shom.fr).

6
Fig. 2. Stations configuration
As an example, time series for the hourly averaged water level (with respect to the NGF
reference) and the hourly averaged temperature are presented in Fig. 3 for the station La Seyne/Ifremer.
The observed water level and temperature variations at the network stations are discussed in detail in
the next sections.
Site Date of installation
La Seyne/Ifremer 17th October 2013 (prototype)
Port-Cros (GSM after the 21/09/2016) 1st July 2014
Lazaret (GSM after the 5/09/2017) 13 th March 2015
Tamaris 18 th March 2015
Madrague of Giens (GSM) 6 th May 2015
Port Saint Louis (GSM) 18 th December 2015
Saint Elme (GSM) 12 th February 2016
Brusc (GSM) 20 th April 2016
La Capte (GSM) 6 th April 2017

7
Porquerolles (GSM) 14 th September 2018
Tab. 1: Stations and dates of installation.
Fig. 3. Example of data series: (a) water level, (b) water temperature, site of La
Seyne/Ifremer (IF).
4. Water level variations
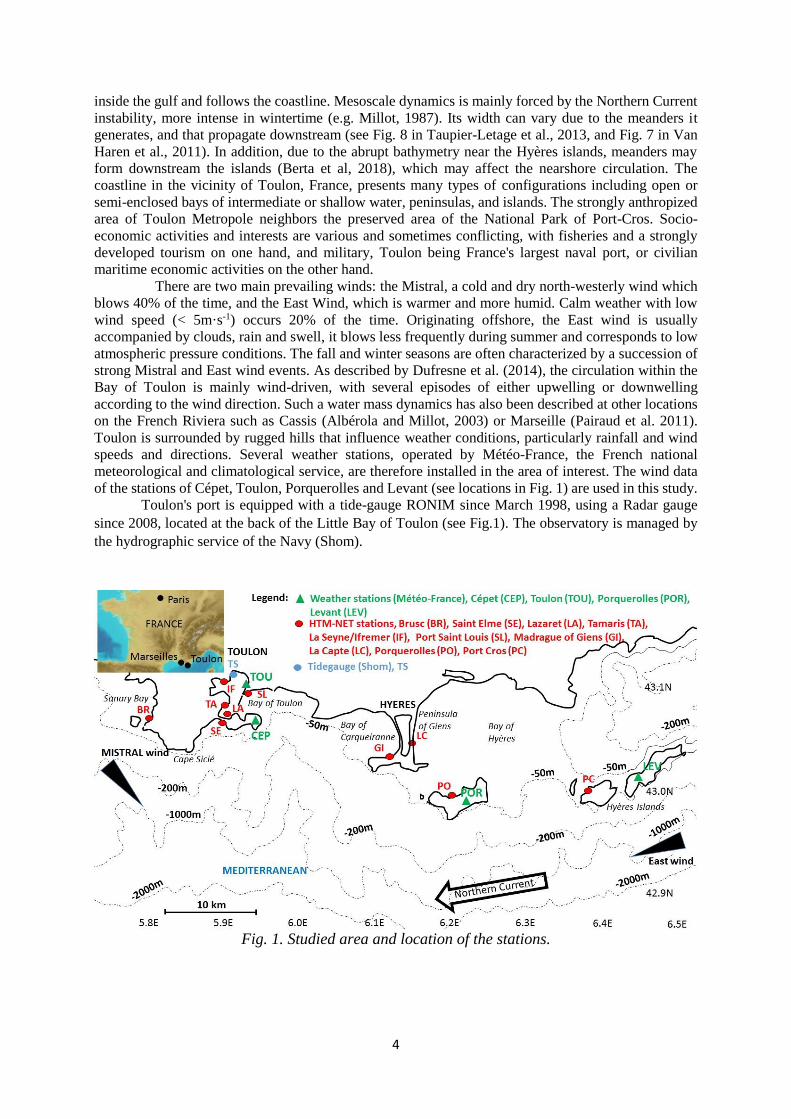
Histograms of the water level data collected at stations La Seyne/Ifremer and Port-Cros are
presented in Fig. 4. The maximum of occurrence corresponds more or less to the mean water level,
0.42m with respect to the NGF reference at the location of the tide gauge of the Shom in the harbor of
Toulon (see Fig.1). The difference between the lower and upper water levels is about 1m. The origins
of such variations are discussed in the following subsections.
8
Fig. 4. Water level histograms, (a) La Seyne/Ifremer (IF), (b) Port-Cros (PC)
4.1 Tides
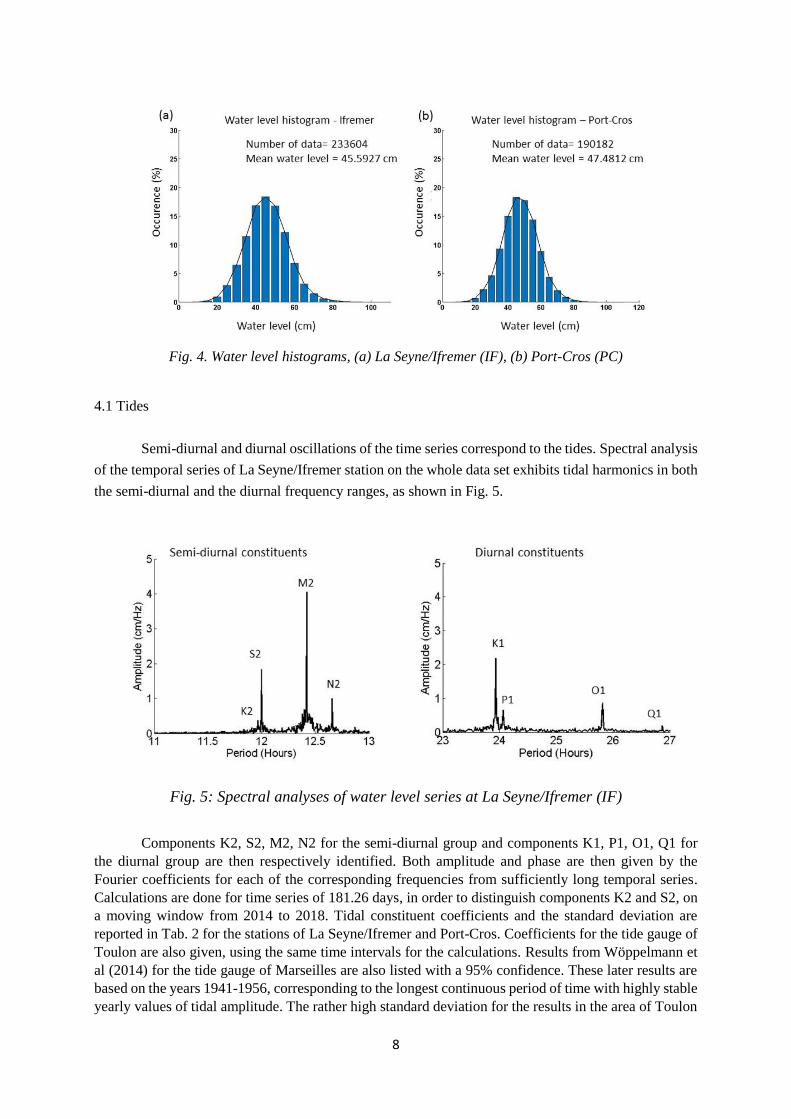
Semi-diurnal and diurnal oscillations of the time series correspond to the tides. Spectral analysis
of the temporal series of La Seyne/Ifremer station on the whole data set exhibits tidal harmonics in both
the semi-diurnal and the diurnal frequency ranges, as shown in Fig. 5.
Fig. 5: Spectral analyses of water level series at La Seyne/Ifremer (IF)
Components K2, S2, M2, N2 for the semi-diurnal group and components K1, P1, O1, Q1 for
the diurnal group are then respectively identified. Both amplitude and phase are then given by the
Fourier coefficients for each of the corresponding frequencies from sufficiently long temporal series.
Calculations are done for time series of 181.26 days, in order to distinguish components K2 and S2, on
a moving window from 2014 to 2018. Tidal constituent coefficients and the standard deviation are
reported in Tab. 2 for the stations of La Seyne/Ifremer and Port-Cros. Coefficients for the tide gauge of
Toulon are also given, using the same time intervals for the calculations. Results from Wöppelmann et
al (2014) for the tide gauge of Marseilles are also listed with a 95% confidence. These later results are
based on the years 1941-1956, corresponding to the longest continuous period of time with highly stable
yearly values of tidal amplitude. The rather high standard deviation for the results in the area of Toulon
9
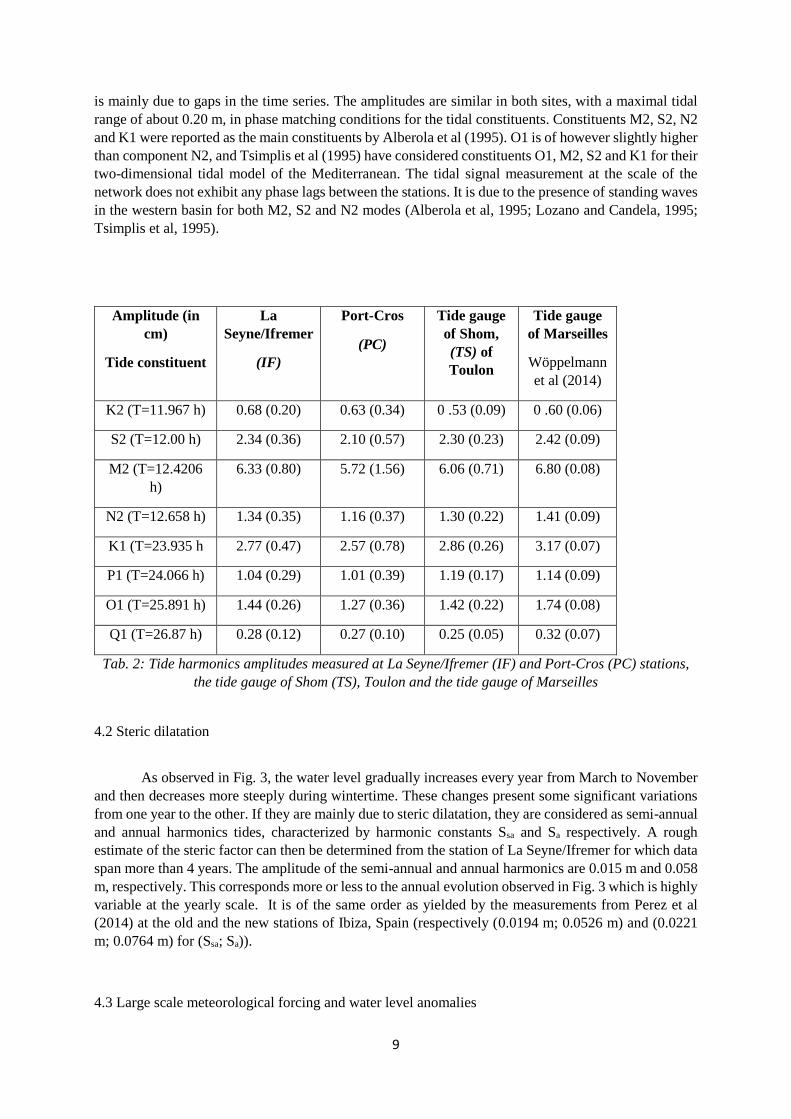
is mainly due to gaps in the time series. The amplitudes are similar in both sites, with a maximal tidal
range of about 0.20 m, in phase matching conditions for the tidal constituents. Constituents M2, S2, N2
and K1 were reported as the main constituents by Alberola et al (1995). O1 is of however slightly higher
than component N2, and Tsimplis et al (1995) have considered constituents O1, M2, S2 and K1 for their
two-dimensional tidal model of the Mediterranean. The tidal signal measurement at the scale of the
network does not exhibit any phase lags between the stations. It is due to the presence of standing waves
in the western basin for both M2, S2 and N2 modes (Alberola et al, 1995; Lozano and Candela, 1995;
Tsimplis et al, 1995).
Amplitude (in
cm)
Tide constituent
La
Seyne/Ifremer
(IF)
Port-Cros
(PC)
Tide gauge
of Shom,
(TS) of
Toulon
Tide gauge
of Marseilles
Wöppelmann
et al (2014)
K2 (T=11.967 h) 0.68 (0.20) 0.63 (0.34) 0 .53 (0.09) 0 .60 (0.06)
S2 (T=12.00 h) 2.34 (0.36) 2.10 (0.57) 2.30 (0.23) 2.42 (0.09)
M2 (T=12.4206
h)
6.33 (0.80) 5.72 (1.56) 6.06 (0.71) 6.80 (0.08)
N2 (T=12.658 h) 1.34 (0.35) 1.16 (0.37) 1.30 (0.22) 1.41 (0.09)
K1 (T=23.935 h 2.77 (0.47) 2.57 (0.78) 2.86 (0.26) 3.17 (0.07)
P1 (T=24.066 h) 1.04 (0.29) 1.01 (0.39) 1.19 (0.17) 1.14 (0.09)
O1 (T=25.891 h) 1.44 (0.26) 1.27 (0.36) 1.42 (0.22) 1.74 (0.08)
Q1 (T=26.87 h) 0.28 (0.12) 0.27 (0.10) 0.25 (0.05) 0.32 (0.07)
Tab. 2: Tide harmonics amplitudes measured at La Seyne/Ifremer (IF) and Port-Cros (PC) stations,
the tide gauge of Shom (TS), Toulon and the tide gauge of Marseilles
4.2 Steric dilatation
As observed in Fig. 3, the water level gradually increases every year from March to November
and then decreases more steeply during wintertime. These changes present some significant variations
from one year to the other. If they are mainly due to steric dilatation, they are considered as semi-annual
and annual harmonics tides, characterized by harmonic constants Ssa and Sa respectively. A rough
estimate of the steric factor can then be determined from the station of La Seyne/Ifremer for which data
span more than 4 years. The amplitude of the semi-annual and annual harmonics are 0.015 m and 0.058
m, respectively. This corresponds more or less to the annual evolution observed in Fig. 3 which is highly
variable at the yearly scale. It is of the same order as yielded by the measurements from Perez et al
(2014) at the old and the new stations of Ibiza, Spain (respectively (0.0194 m; 0.0526 m) and (0.0221
m; 0.0764 m) for (Ssa; Sa)).
4.3 Large scale meteorological forcing and water level anomalies

10
As shown in Figs. 3 and 4, maximum water level variations are of order 1m, much higher than
the tidal range of the Mediterranean in this area. As mentioned in the introduction, the barometric factor,
the ratio between the water level and the atmospheric pressure variations, is generally of -1cm.hPa-1,
which corresponds to isostatic variations. Between low and high atmospheric pressure conditions,
respectively of about 985 and 1035 hPa in this area, water level changes may be of about 0.50m.
However, significant differences may exist. The Fig. 6 illustrates cases of isostatic and non isostatic
behaviors of the water level in line with atmospheric pressure evolutions are presented in Fig. 6. Time
series of both the atmospheric pressure and the water level are as recorded at the station La
Seyne/Ifremer. Daily averaged data are presented on both schemes. We can observe an isostatic response
of the water level from November 16th to December 20th, when an increase of the atmospheric pressure
of about 30 hPa resulted in a decrease of the water level by 30cm. On the contrary, non isostatic behavior
is observed afterwards, since atmospheric pressure variations of about 35 hPa result in a water level
change of about 20cm. In order to quantify the co-variation of the water level with the atmospheric
pressure, histograms of the water level anomaly are calculated for the water level series after filtering
out both the tide and the steric contributions (see Fig. 7). Zero values correspond to isostatic variations.
The residual level observed in Fig. 7 confirms that the isostatic conditions are not always fulfilled. We
can conclude that high water level values corresponding to low pressure conditions can be roughly
estimated, with an uncertainty of about 0.25m in the present, corresponding to the maximum of the
residual level (see Fig. 7). One may notice that for low atmospheric conditions, the high water level is
enhanced in autumn due to the steric effects discussed in section 4.2.
Fig. 6: Atmospheric pressure induced water level variations, station La Seyne/Ifremer (IF).
Daily averaged series of (a) atmospheric pressure and (b) water level.

11
Fig. 7: Histograms after filtering the water level variations due to both tide and atmospheric pressure
with the isostatic assumption, (a) La Seyne/Ifremer (IF), (b) Port-Cros (PC)
Fig. 8: Wind induced water level variations: (a) wind speed and (b) wind direction at
meteorological stations Cépet, Porquerolles and Levant, (c) daily averaged water level at stations
Port-Cros (PC, blue) and La Seyne/Ifremer (IF, black).

12
Fig. 9: Wind induced water level variations the last Mistral event: (a) wind speed and (b)
wind direction at meteorological stations Cépet, Porquerolles and Levant, (c) hourly (dashed lines)
and daily (full lines) averaged water level at stations Port-Cros and La Seyne/Ifremer.

13
Fig. 10: Wind induced water level variations for the last easterly wind: (a) wind speed and (b)
wind direction at meteorological stations Cépet, Porquerolles and Levant (c) hourly (dashed lines)
and daily (full lines) averaged water level at stations Port-Cros and La Seyne/Ifremer.
4.4 Meteorological forcing at local scale
Since HTM-NET stations are located in harbors, which are by definition sheltered, the water
level variations do not include the wave set-up. However, they provide information about the wind
influence on the water level at the scale of the network, including locations within enclosed bays (e. g.
La Seyne/Ifremer, in the Little Bay of Toulon) and “offshore” in the Hyères islands. Wind conditions
are provided by the meteorological stations of Cépet, Porquerolles and Levant, from west to east. (see
Fig. 1). Corresponding three hours averaged wind speed and direction are presented in Figs. 8a and 8.b
respectively. Fig. 8c shows the comparison of daily averaged water levels at stations La Seyne/Ifremer
and Port-Cros for the period ranging between August, 8th and December, 12th, 2016. Solid line rectangles
indicate Mistral (northwesterly) episodes, and dotted line rectangles indicate East wind episodes. Mistral
blows offshoreward in the Bay of Toulon, whereas the east wind blows shoreward. We can observe
water level differences of few centimeters under both wind conditions between the two stations. Under
Mistral conditions (resp. easterly), the water level at La Seyne/Ifremer is systematically lower (resp.
higher) than in Port-Cros. This corresponds to additional water dragged by wind stress under
offshoreward- (resp. shoreward-) blowing conditions. Wind conditions and hourly and daily averaged
water levels are presented in Figs. 9 and 10 for the last Mistral and East wind events respectively.
Differences of level can reach 0.10m as shown in Figs. 9c and 10c for the last events of Mistral and East
wind. However, the wind effect at the scale of the network, which is of the order of that of the tide, as
shown by the hourly averaged level variations, remains small compared to the atmospheric pressure

14
effect (~0.5m). Indeed, as shown in Fig. 8.c, the water level is always higher (resp. lower) for easterly
(resp. Mistral) conditions, since they correspond to low (resp. high) atmospheric pressure conditions.
This level difference is not always significant, as shown by the lack of variation during the east wind
episode of September 28th. As a general trend, this difference in water level is observed during windy
periods, and results in a higher level in Port-Cros for Mistral events and a higher level in the Little Bay
of Toulon (station La Seyne/Ifremer) during east wind events. The daily averaged water level difference
(PC-IF) versus the mean wind speed measured at station Cépet is presented in Fig. 11, for wind events
lasting at least two days for the period summer 2014 - autumn 2018. We can observe water level
differences of few centimeters for both wind directions, up to almost 10cm for stronger wind conditions.
Let us note that wind speed and direction may vary from west (station Cépet) to east (station Levant),
and that the wind speed at Cépet is not fully representative of the averaged wind field over the entire
study area. Hourly averaged water level differences may be higher depending on the wind event duration
and regularity, as the values greater than 10cm that can be observed in Figs. 9.c and 10.c.
Fig. 11: Modulus of the daily averaged water level difference between stations of Port-Cros
(PC) and La Seyne/Ifremer (IF) versus wind speed measured at the meteorological station of Cépet
(CEP); Water level is higher (resp. lower) at Port-Cros during Mistral (resp. east wind) events.
4.5 Seiching
A well-known source of water level variations within an enclosed bay or a harbor is seiching,
due to long wave resonance. For semi-enclosed basins, the fundamental standing wave wavelength is
four times the basin length L from the entrance to the rear. This corresponds to a node at the open
boundary and to an antinode at the impervious boundary. The fundamental wavelength is twice the basin
length in the transverse direction, both boundaries being impervious. Since for long waves the celerity
is 𝑐 = √𝑔ℎ, where h is the water depth, the wave period T =/c is of the order of several minutes for
basins of several hundred meters length and of about 4m deep. It is of order of several tens of minutes
for larger and deeper bay. Millot et al (1981) have shown the presence of such oscillations within the
Little Bay of Toulon, the main oscillations corresponding to periods of 20 and 45 min. In their study,
the seiching of period 20min is ascribed to the oscillation within the Little Bay considered as a closed
basin, while the period of 45min corresponds to the fundamental mode of oscillation of the whole Bay
of Toulon. A spectral analysis of the data series of station La Seyne/Ifremer using a moving window of
one day (not shown here) evidences signals at about 22min and 45 min. Since our sampling period is
10min, the lower period is at the limit of what we can describe (close to Nyquist frequency). Thus we
consider here only the oscillations at the period T=45 min. After calculation of the amplitude of the
corresponding Fourier coefficient on the above moving window (32 wave periods) versus time for the
stations located within the Bay of Toulon, we can identify some events for which maxima amplitude of
several centimeters are observed.

15
Results for the period ranging between December 17th and 22th, 2016 are presented in Fig. 12.
Seiching appears on December, 19th 2016 for easterly conditions. The oscillation amplitude is of same
order of magnitude at the stations Ifremer, Tamaris and St Louis. This corresponds to the observations
of Millot et al (1981) since the amplitude is maximum at the western boundary of the Little Bay for this
mode. No seiching is observed at the Lazaret station, which is on the southern boundary, rather far from
the western side of the bay and actually not on the oscillation node.
Fig. 12. Seiching analysis between December, 17th and 22th, 2016. (a) Wind speed and (b)
wind direction at the meteorological station of Toulon, (c) seiching amplitude, T=45min, at
stations of La Seyne/Ifremer (black), Lazaret (blue), Tamaris (red) and Port St Louis of
Mourillon (green).
5. Analysis of near-surface temperature variations
SST, measured either by satellites or in situ sensors, is a key parameter for upper-ocean circulation
modeling at least. SST may significantly vary daily. Donlon et al (2007) distinguished skin and subskin
temperature measurements from remote sensing techniques and in situ measurement and proposed
typical near-surface vertical profiles according to solar radiation for light wind. The diurnal cycle of
SST is necessary for accurately computing air-sea heat fluxes as underlined by Pimentel et al (2018).
These authors modelled the fine-scale SST near-surface structure in the Mediterranean, allowing
comparisons between SST characteristics such as foundation (insensitive to diurnal cycle), depth,
subskin and skin. The net heat flux at the air-sea interface is the sum of four dominant terms, the net
short wave radiation flux, the net long wave radiation flux, the latent heat flux of evaporation and the
sensible heat flux. Averaged short wave and long wave radiation fluxes given in the ERA-40 data set
are 162 W.m-2 and -79 W.m-2, respectively, for the Mediterranean (Pettenuzzo et al, 2010). Intense air-
sea exchanges favored by strong northerly and north-westerly dry wind situations (Mistral and
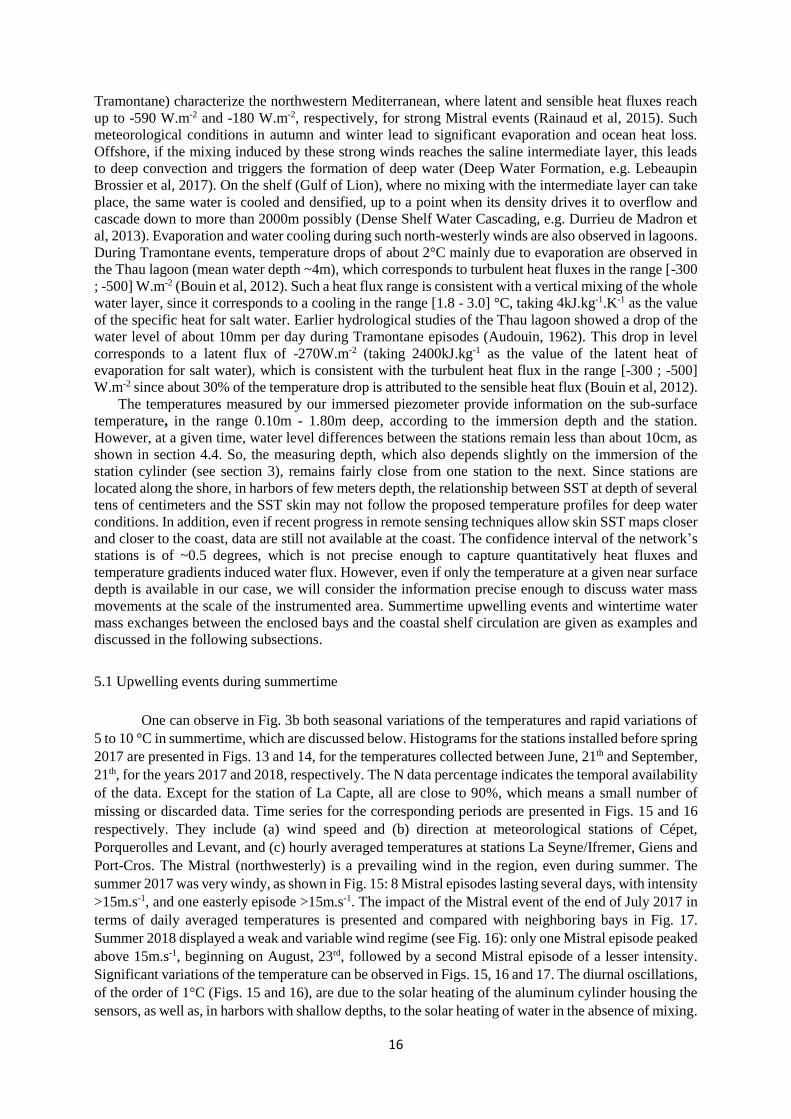
16
Tramontane) characterize the northwestern Mediterranean, where latent and sensible heat fluxes reach
up to -590 W.m-2 and -180 W.m-2, respectively, for strong Mistral events (Rainaud et al, 2015). Such
meteorological conditions in autumn and winter lead to significant evaporation and ocean heat loss.
Offshore, if the mixing induced by these strong winds reaches the saline intermediate layer, this leads
to deep convection and triggers the formation of deep water (Deep Water Formation, e.g. Lebeaupin
Brossier et al, 2017). On the shelf (Gulf of Lion), where no mixing with the intermediate layer can take
place, the same water is cooled and densified, up to a point when its density drives it to overflow and
cascade down to more than 2000m possibly (Dense Shelf Water Cascading, e.g. Durrieu de Madron et
al, 2013). Evaporation and water cooling during such north-westerly winds are also observed in lagoons.
During Tramontane events, temperature drops of about 2°C mainly due to evaporation are observed in
the Thau lagoon (mean water depth ~4m), which corresponds to turbulent heat fluxes in the range [-300
; -500] W.m-2 (Bouin et al, 2012). Such a heat flux range is consistent with a vertical mixing of the whole
water layer, since it corresponds to a cooling in the range [1.8 - 3.0] °C, taking 4kJ.kg-1.K-1 as the value
of the specific heat for salt water. Earlier hydrological studies of the Thau lagoon showed a drop of the
water level of about 10mm per day during Tramontane episodes (Audouin, 1962). This drop in level
corresponds to a latent flux of -270W.m-2 (taking 2400kJ.kg-1 as the value of the latent heat of
evaporation for salt water), which is consistent with the turbulent heat flux in the range [-300 ; -500]
W.m-2 since about 30% of the temperature drop is attributed to the sensible heat flux (Bouin et al, 2012).
The temperatures measured by our immersed piezometer provide information on the sub-surface
temperature, in the range 0.10m - 1.80m deep, according to the immersion depth and the station.
However, at a given time, water level differences between the stations remain less than about 10cm, as
shown in section 4.4. So, the measuring depth, which also depends slightly on the immersion of the
station cylinder (see section 3), remains fairly close from one station to the next. Since stations are
located along the shore, in harbors of few meters depth, the relationship between SST at depth of several
tens of centimeters and the SST skin may not follow the proposed temperature profiles for deep water
conditions. In addition, even if recent progress in remote sensing techniques allow skin SST maps closer
and closer to the coast, data are still not available at the coast. The confidence interval of the network’s
stations is of ~0.5 degrees, which is not precise enough to capture quantitatively heat fluxes and
temperature gradients induced water flux. However, even if only the temperature at a given near surface
depth is available in our case, we will consider the information precise enough to discuss water mass
movements at the scale of the instrumented area. Summertime upwelling events and wintertime water
mass exchanges between the enclosed bays and the coastal shelf circulation are given as examples and
discussed in the following subsections.
5.1 Upwelling events during summertime
One can observe in Fig. 3b both seasonal variations of the temperatures and rapid variations of
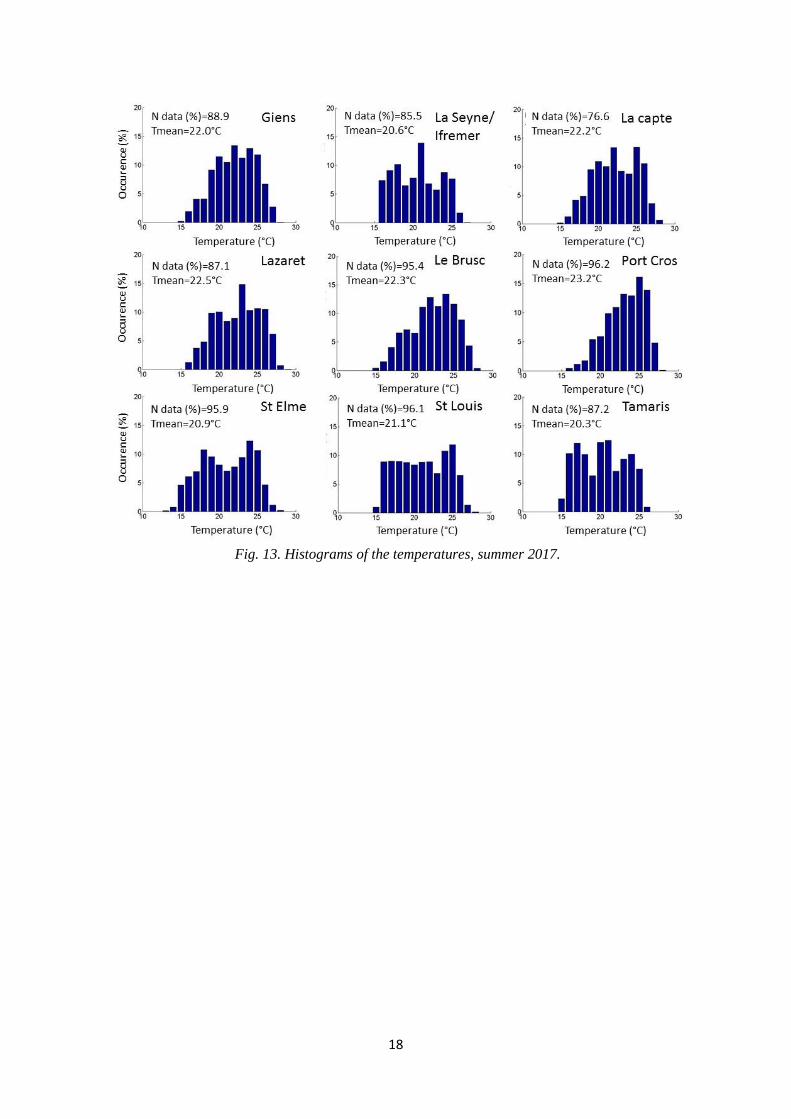
5 to 10 °C in summertime, which are discussed below. Histograms for the stations installed before spring
2017 are presented in Figs. 13 and 14, for the temperatures collected between June, 21th and September,
21th, for the years 2017 and 2018, respectively. The N data percentage indicates the temporal availability
of the data. Except for the station of La Capte, all are close to 90%, which means a small number of
missing or discarded data. Time series for the corresponding periods are presented in Figs. 15 and 16
respectively. They include (a) wind speed and (b) direction at meteorological stations of Cépet,
Porquerolles and Levant, and (c) hourly averaged temperatures at stations La Seyne/Ifremer, Giens and
Port-Cros. The Mistral (northwesterly) is a prevailing wind in the region, even during summer. The
summer 2017 was very windy, as shown in Fig. 15: 8 Mistral episodes lasting several days, with intensity
>15m.s-1, and one easterly episode >15m.s-1. The impact of the Mistral event of the end of July 2017 in
terms of daily averaged temperatures is presented and compared with neighboring bays in Fig. 17.
Summer 2018 displayed a weak and variable wind regime (see Fig. 16): only one Mistral episode peaked
above 15m.s-1, beginning on August, 23rd, followed by a second Mistral episode of a lesser intensity.
Significant variations of the temperature can be observed in Figs. 15, 16 and 17. The diurnal oscillations,
of the order of 1°C (Figs. 15 and 16), are due to the solar heating of the aluminum cylinder housing the
sensors, as well as, in harbors with shallow depths, to the solar heating of water in the absence of mixing.

17
Steep drops of temperature of several degrees are also observed. Such drops cannot be due to cooling
by evaporation, since they would amount to ~ 1.2°C per day for a net heat flux of about -500W.m-2,
assuming vertical mixing within a water column of 10m. They indicate the upwelling formation related
to the Mistral events. These events are discussed hereafter for summers 2017 and 2018.
During summer 2017, one can observe that the temperatures recorded at the stations of Port-
Cros, La Capte, Giens and Brusc remain the warmest overall (average temperature between 22.0°C and
23.2°C), with few events with temperature under 20°C, contrary to the stations of La Seyne/Ifremer,
Saint Elme, Tamaris and Saint Louis (average temperature between 20.6°C and 21.1°C) (Fig. 13). In
Fig. 15.c, the temperature time series show sudden drops of temperature, up to 10°C within less than 3
days. The station of St Elme, facing the sea, and stations of Ifremer, Tamaris, and St Louis, within the
Bay of Toulon, are strongly impacted by the upwelling cells induced by the strong Mistral episodes, and
marked by minima of ~ 15°C (on July, 1st, 14th and 27th and on August, 13th). These upwelling events
allow a rapid water mass renewal, especially in the Little Bay as already observed by Dufresne et al
(2014). The temperature decrease is much less pronounced for stations Giens and Port Cros, further east.
Note that the Mistral veers from northwest to west, as it progresses eastward from Cépet to Levant.
Temperature variations within the Bay of Toulon and neighboring bays are detailed in Fig. 17 for the
Mistral event of the end of July, 2017. We can observe that stations of Brusc, Giens and Lazaret are
much less affected by the upwelling than stations of Tamaris, La Seyne/Ifremer and Port Saint Louis.
Stations of Brusc and Giens are indeed located in semi-enclosed bays westerly oriented and exposed to
the waves with Mistral conditions. The near-surface water mass is then pushed at the back of the bay.
We can observe a regular decrease of the temperature of about 0.8°C per day during the Mistral event,
lasting from July, 23rd to July, 29th. Cold water which appears later at the near surface is then mainly
due to both cooling by evaporation and wind and wave induced water column mixing and possibly to
the coldest water masses induced nearshore circulation. The station of Lazaret is located within a
sheltered part of the Little Bay of Toulon, of shallow water. This may explain the more moderate drop
in temperature. Station of St Elme, facing the sea, and stations of Ifremer, Tamaris, and St Louis, within
the Bay of Toulon, are strongly impacted by the upwellings, with temperature drops down to 15°C.
During summer 2018, the average temperatures are much higher than during summer 2017, with
only two events of temperature below 20°C, whatever the station. The coldest mean temperature was
recorded at Tamaris for both years, with an average value of 20.3°C in 2017 and 23.5°C in 2018. The
Port-Cros station exhibits the warmest mean temperatures, with 23.3°C in 2017 and 25.4°C in 2018.
This correlates with the small number of Mistral events of significant duration (at least 2 days), observed
that summer: only 2 were recorded, beginning on August, 23rd and 31st, respectively. The few short
Mistral events of July were not long enough (no more than one-day duration) to allow the development
of upwelling: the water temperature remains above 20°C at the station of La Seyne/Ifremer. On the
contrary, the intense event of August (from August, 23rd) decreased the water temperature by almost
10°C in 3 days at the La Seyne/Ifremer station.
18
Fig. 13. Histograms of the temperatures, summer 2017.

19
Fig. 14. Histograms of the temperatures, summer 2018.

20
Fig. 15. Time series of the (a) wind speed and (b) wind direction at meteorological stations of Cépet,
Porquerolles and Levant. (c) hourly averaged temperature time series at stations La Seyne/Ifremer,
Port Cros and Giens, summer 2017.

21
Fig. 16. Time series of the (a) wind speed and (b) wind direction at meteorological stations of Cépet,
Porquerolles and Levant. (c) hourly averaged temperature time series at stations La Seyne/Ifremer,
Port Cros and Giens, summer 2018.
Fig. 17. Time series of the daily averaged temperature time series at stations Brusc, Saint Elme,
Tamaris, La Seyne/Ifremer, Port Saint Louis and Giens, Mistral event, July 2017.
22
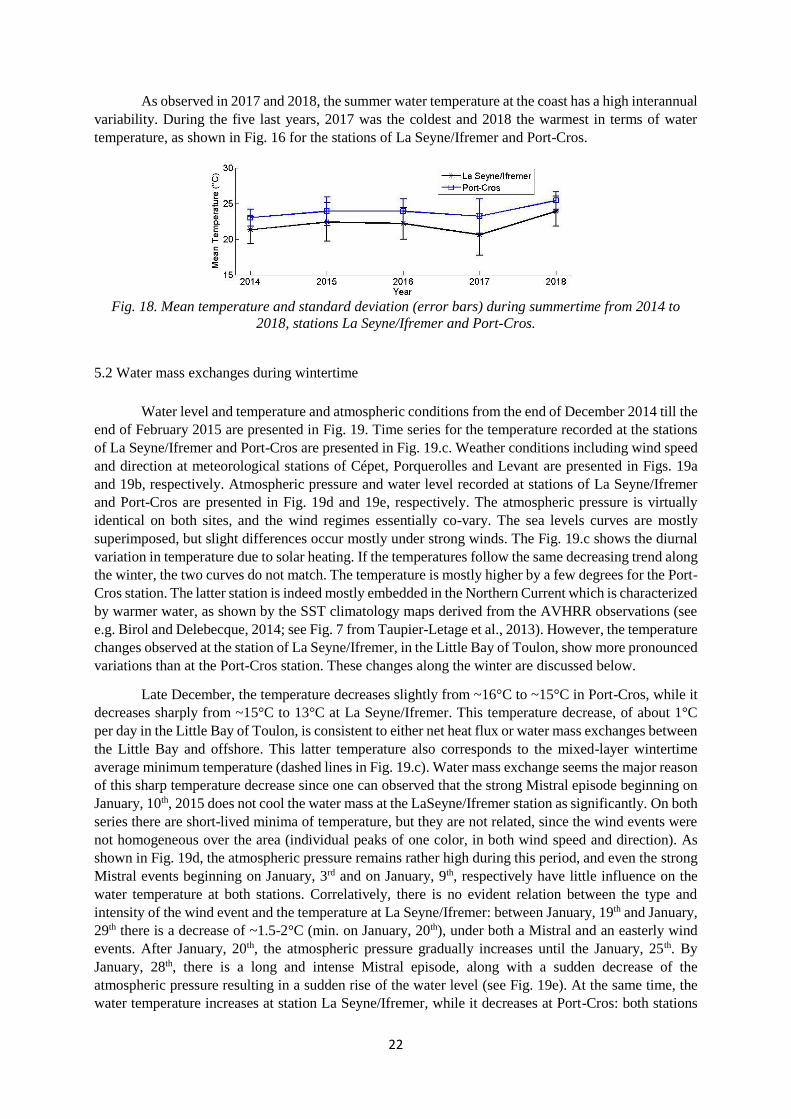
As observed in 2017 and 2018, the summer water temperature at the coast has a high interannual
variability. During the five last years, 2017 was the coldest and 2018 the warmest in terms of water
temperature, as shown in Fig. 16 for the stations of La Seyne/Ifremer and Port-Cros.
Fig. 18. Mean temperature and standard deviation (error bars) during summertime from 2014 to
2018, stations La Seyne/Ifremer and Port-Cros.
5.2 Water mass exchanges during wintertime
Water level and temperature and atmospheric conditions from the end of December 2014 till the
end of February 2015 are presented in Fig. 19. Time series for the temperature recorded at the stations
of La Seyne/Ifremer and Port-Cros are presented in Fig. 19.c. Weather conditions including wind speed
and direction at meteorological stations of Cépet, Porquerolles and Levant are presented in Figs. 19a
and 19b, respectively. Atmospheric pressure and water level recorded at stations of La Seyne/Ifremer
and Port-Cros are presented in Fig. 19d and 19e, respectively. The atmospheric pressure is virtually
identical on both sites, and the wind regimes essentially co-vary. The sea levels curves are mostly
superimposed, but slight differences occur mostly under strong winds. The Fig. 19.c shows the diurnal
variation in temperature due to solar heating. If the temperatures follow the same decreasing trend along
the winter, the two curves do not match. The temperature is mostly higher by a few degrees for the Port-
Cros station. The latter station is indeed mostly embedded in the Northern Current which is characterized
by warmer water, as shown by the SST climatology maps derived from the AVHRR observations (see
e.g. Birol and Delebecque, 2014; see Fig. 7 from Taupier-Letage et al., 2013). However, the temperature
changes observed at the station of La Seyne/Ifremer, in the Little Bay of Toulon, show more pronounced
variations than at the Port-Cros station. These changes along the winter are discussed below.
Late December, the temperature decreases slightly from ~16°C to ~15°C in Port-Cros, while it
decreases sharply from ~15°C to 13°C at La Seyne/Ifremer. This temperature decrease, of about 1°C
per day in the Little Bay of Toulon, is consistent to either net heat flux or water mass exchanges between
the Little Bay and offshore. This latter temperature also corresponds to the mixed-layer wintertime
average minimum temperature (dashed lines in Fig. 19.c). Water mass exchange seems the major reason
of this sharp temperature decrease since one can observed that the strong Mistral episode beginning on
January, 10th, 2015 does not cool the water mass at the LaSeyne/Ifremer station as significantly. On both
series there are short-lived minima of temperature, but they are not related, since the wind events were
not homogeneous over the area (individual peaks of one color, in both wind speed and direction). As
shown in Fig. 19d, the atmospheric pressure remains rather high during this period, and even the strong
Mistral events beginning on January, 3rd and on January, 9th, respectively have little influence on the
water temperature at both stations. Correlatively, there is no evident relation between the type and
intensity of the wind event and the temperature at La Seyne/Ifremer: between January, 19th and January,
29th there is a decrease of ~1.5-2°C (min. on January, 20th), under both a Mistral and an easterly wind
events. After January, 20th, the atmospheric pressure gradually increases until the January, 25th. By
January, 28th, there is a long and intense Mistral episode, along with a sudden decrease of the
atmospheric pressure resulting in a sudden rise of the water level (see Fig. 19e). At the same time, the
water temperature increases at station La Seyne/Ifremer, while it decreases at Port-Cros: both stations

23
reach similar temperatures of ~13°C (January, 31st). The local weather conditions decreased the
temperature at the shallow station of la Seyne below 13°C, while at the same time offshore the mixed-
layer deepened. Under such intense Mistral conditions the water renewal in the Bay of Toulon must
have advected ~13°C-offshore mixed-layer water. We have shown in section 5.1 that Mistral episodes
are at the origin of the mass exchanges through the development of upwellings during summertime.
During wintertime, the water temperature is lower within the Little Bay because of its small extent and
its shallow water depth compared to offshore. The relative increase of the temperature within the Little
Bay of Toulon (to 13°C) might correspond to an intrusion of the offshore water masses, warmer, through
a sudden increase of the water level, following the flush of the wind-cooled water. They may be linked
with the variability of the North Current, observed throughout the year (see e.g Millot, 1987; Carret et
al, 2019). Alternately, at Port-Cros the Mistral induced a strong mixing, and decreased the temperature
to that of the mixed-layer. The exact interplay of wind regimes, sea levels and temperatures in the bays
has yet to be investigated in details. However, it is clear that even the collection of cost-effective low-
resolution subsurface temperature at the network’s stations helps to understand the dynamics in such
complex nearshore systems.

24
Fig. 19. Evolution of near surface water temperature from the end of December 2014 till end of
February 2015, Wind speed (a) and direction (b); (c) temperature, (d) atmospheric pressure, (e) daily
averaged water level, Ifremer (black) and Port-Cros (blue).
6. Discussion and conclusion
We have shown with these examples and illustrations the potentiality of the HTM-NET network
in the understanding of the nearshore circulation and water mass exchanges through a long term
collection of data on the water level and the near surface temperature along the shore of Toulon area.
The collection of water level data have long been restricted to the main French ports (Marseille, Toulon
and Nice along the Mediterranean). But the HTM-NET data show that even low-cost solutions can fill
the gaps and achieve the important goal to monitor water level at such a fine scale. Indeed, unlike the
level variations due to the tide and atmospheric pressure variations which are more or less the same in

25
this area, some level differences, due to the influence of the wind for example, can exist between
different stations in the study area. Seiching and its origin may also be better understood by such a
network of data around the basins. If contributions of the wind or oscillations to the level change are
found to be of several centimeters, they may however contribute to high water level and coastal flooding
and erosion with potential disastrous socio-economic consequences. It is thus important to be able to
quantify maximum water levels, either for the understanding of the dynamics or for socio-economical
purposes. In addition, water level reconstruction models use a combination of coastal tide gauges with
water level fields in the whole basin from altimetry data (see Adloff et al, 2018 and references cited).
We have shown that differences in the order or 0.10 m could be observed between tide gauges in the
rear of enclosed bays and in open boundaries such as on the Port-Cros island. This may induce
significant bias in the technique of reconstruction.
Concerning the near-surface temperature, we could observe the strong variability of the
temperatures at the scale of the network and from one bay to another, some places being strongly
affected by upwellings. A strong interannual variability is also observed, directly related to the weather
conditions in terms of number of wind events. The present network provides also complementary
information to SST thematic products computed with satellite data, not only to improve the resolution
in the coastal zones, but most importantly to correct the bias of the products where coastal upwelling
areas are often flagged as bad data since way off the summertime climatology (Buongiorno Nardelli et
al, 2013).
In the present analysis, the sampling period is 10 min. This sampling period was prompted by
the need to minimize the maintenance effort for downloading the data. It is presently being reduced to
2 min for the whole network along with the GSM-transmitter equipment of all stations. This new
sampling period is motivated by the monitoring of seiching, which was previously limited to periods
over 20min, and then inadequate for faster oscillations as observed also in the Little Bay of Toulon
(Millot et al, 1981) or potentially existing in bays or harbors of smaller extent. In addition, the sampling
period of 10 min was also found inadequate in recording the amplitudes of the tsunami induced water
level oscillations following the earthquake of Boumerdès-Zemmouri (Algeria) on 21 May 2003 (Sahal
et al, 2009). For more detailed analyses of the water level regarding either tide, storms or other hazards
origins, the sampling period of 2 minutes appears as a good compromise between the technical
constraints and the quality of the data. The data stored in the station spans now ~ 12 running days, which
proves enough to plan the maintenance in case of a faulty GSM transmission.
The network is being extended westward up to the Cape Couronne (West of Marseilles), with 4
additional stations (see the updated map on the site https://htmnet.mio.osupytheas.fr). These stations are
located at the eastern part of the Gulf of Lion, characterized by a strong variability of the Northern-
Current (Alberola and Millot, 2003) and strong upwelling events (Millot, 1979). The circulation is rather
complex and still under investigation, not only for scientific purposes, but also to address socio-
economic issues. Long term data sets on both water level and near-surface temperature will thus provide
important information for the understanding and the modelling of dynamics.
7. Data availability
Data on relative water levels of the HTM-NET network stations and the water level with respect
to the reference level NGF (official altimetric reference in the French continental metropolitan territory)
26
of the tide gauge of Toulon, operated by the Shom, can be downloaded from the website
DATA.SHOM.FR.
Data from the last 60 days of temperature, water level and atmospheric pressure of the HTM-
NET network stations are displayed on the website of the network: https://htmnet.mio.osupytheas.fr.
Data of water and air temperature, and water and air pressure are available on request, on the catalogue
of the Pytheas observatory
https://dataset.osupytheas.fr/geonetwork/srv/fre/catalog.search#/metadata/7d538d6b-dd15-42af-9de7-
c9eac27a840d.
Meteorological data are available on request on the dedicated website of Météo-France, the
French national meteorological and climatological service, https://donneespubliques.meteofrance.fr/.
8. Acknowledgements
Financial supports from the Toulon Metropole (Contracts HTM-NET, OLBIA, CAPTILE) and from the
French national scientific programs SOERE and DYNALIT- ILICO on the long term observation of the
coastline are acknowledged. The French National park of Port-Cros (PNPC), Toulon Metropole and the
city of Hyères are acknowledged for the installation of the stations, the French Navy service Shom for
its collaboration and MétéoFrance for the meteorological data.
9. References
Adloff, F., Jorda, G., Somot, S., sevault, F., Arsouze, T., Meyssignac, B., Li, L. and Planton, S., 2018,
Improving water level simulation in Mediterranean regional climate models, Clim. Dyn, 51, 1167-1178.
Albérola, C., Millot, C., 2003. Circulation in the French mediterranean coastal zone near Marseilles: the
influence of wind and the Northern Current. Continent. Shelf Res. 23, 587–610.
http://dx.doi.org/10.1016/S0278-4343(03)00002-5.
Albérola C., Rousseau S., Millot C., Astraldi M., Font J., Garcia-Lafuente J., Gasparini G.-P., Send U.,
Vangriesheim A. (1995) Tidal currents in the Western Mediterranean Sea. Oceanologica Acta 18:273-
284.
Audouin, J., 1962, Hydrologie de l’étang de Thau, Rev. Trav. Inst. Pêches Marit., 26(1), 72p. (in french).
Bensoussan N, Garrabou J & the T-MEDNet network (2018) T-MEDNet observation network and
resource platform on climate change effects in Mediterranean coastal ecosystems. International
Conference on Marine Data and Information Systems, Barcelona, Spain, 5-7 November 2018.
Berta, M., Bellomo, L., Griffa, A., Magaldi, M. G., Molcard, A., Mantovani, C., Gasparini, G. P.,
Marmain, J., Vetrano, A., Béguery, L., Borghini, M., Barbin, Y., Gaggelli, J. and Quentin, C., 2018,
Wind-induced variability in the Northern Current (northwestern Mediterranean Sea) as depicted by a
multi-platform observing system, Ocean Sci., 14, 689-710.
Birol, F. and Delebecque, C., 2014, Using high sampling rate (10/20 Hz) altimeter data for the
observation of coastal surface currents: A case study over the northwestern Mediterranean Sea, Journal
of Marine Systems, 129, 318–333.
Bonaduce, A., Pinardi, N., Oddo, P., Spada, G. and Larnicol, G., 2016, Water level variability in the
Mediterranean sea from altimetry and tide gauges, Clim. Dyn., 47, 2851-2866.

27
Bouin, M-N., Caniaux, G., Traullé, O., Legain, D. and Le Moigne, P., 2012, Long-term heat exchanges
over a Mediterranean lagoon, J. Geophys. Res, 115, D23104, doi:10.1029/2012JD017857.
Buongiorno Nardelli B., Tronconi, C., Pisano, A., Santoleri, R., 2013: High and Ultra-High resolution
processing of satellite Sea Surface Temperature data over Southern European Seas in the framework of
MyOcean project, Rem. Sens. Env., 129, 1-16, doi:10.1016/j.rse.2012.10.012.
Carret, A., Birol, F., Estournel, C., Zakardjian,B. and Testor, P., 2019, Synergy between in situ and
altimetry data to observe and study Northern Current variations (NW Mediterranean Sea), Ocean Sci.,
15, 269–290.
Donlon, C., Robinson, I., Casey, K. S., Vazquez-Cuervo, J., Armstrong, E., Arino, O., et al. (2007),
The global ocean data assimilation experiment high-resolution sea surface temperature pilot project.
Bulletin of the American Meteorological Society, 88, 1197–1213. https://doi.org/10.1175/BAMS-88-8-
1197.
Dufresne, C., « Compréhension et analyse des processus hydro-sédimentaires de la baie de Toulon.
Apport à la modélisation de la dispersion des radionucléides», Ph-D thesis, University of Toulon, nov.
2014 (in french).
Dufresne, C. Duffa, C., Rey, V., 2014, Wind forced circulation in the Bay of Toulon and water
exchanges at the Little Bay fairway, Ocean Dynamics., doi 10.1007/s10236-013-0676-3.
Durrieu de Madron, X., Houpert, L., Puig, P., Sanchez-Vidal, A., Testor, P., Bosse, A., Estournel, C.,
Somot, S., Bourrin, F., Bouin, M. N., Beauverger, M., Beguery, L., Calafat, A., Canals, M., Cassou,
C., Coppola, L., Dausse, D., D’Ortenzio, F., Font, J., Heussner, S., Kunesch, S., Lefevre, D., Le
Goff, H., Martín, J., Mortier, L., Palanques, A. and Raimbault P., 2013, Interaction of dense shelf
water cascading and open-sea convection in the northwestern Mediterranean during winter 2012,
Geophys. Res. Letters, 40, 1379–1385, doi:10.1002/grl.50331, 2013.
Federico, I., Pinardi N., Coppini, G., Oddo, P., Lecci, R., Mossa, M., 2017, Coastal ocean forecasting
with an unstructured grid model in the southern Adriatic and northern Ionian seas, Nat. Hazards Earth
Syst. Sci., 17, 45–59.
Fenoglio-Marc, L., 2002, Long-term water level change in the Mediterranean Sea from multi-satellite
altimetry and tide gauges, Physics and Chemistry of the Earth., 27, 1419-1431.
Gaeta, M. G., Samaras, A. G., Federico, I., Archetti, R., 2016, A coupled wave-3D hydrodynamics
model of the Taranto Sea (Italy): a multiple-nesting approach, Nat. Hazards Earth Syst. Sci., 16, 2071–
2083.
Garrett, C., 1983, Variable water level and straight flow in the Mediterranean : A theoretical study of
the response to meteorological forcing, Oceanologica Acta, 6, 79-87.
Guihou, K., (2013), Étude de la dynamique du Courant Nord au large de Toulon, à l’aide de modèle,
observations in-situ et données satellites, Ph-D thesis, University of Toulon, dec. 2013 (in french).
Guihou, K., Marmain, J., Ourmières, Y., Molcard, A., Zakardjian, B., Forget, P., 2013. A case study of
the mesoscale dynamics in the North-Western Mediterranean Sea : combined data-model approach,
Ocean Dynamics., DOI 10.1007/s10236-013-0619-z.
Grilli, F. and Pinardi, N., 1998, The computation of Rossby radii of deformation for the Mediterranean
Sea, MTP news 6 (4), 4-5.

28
Hamon, B. V. 1966, Continental shelf waves and the effects of atmospheric pressure and wind stress on
water level, J. Geoph. Res., 71, 2883-2893.
Lebeaupin Brossier, C., Leger, F., Giordani, H., Beuvier, J., Bouin, M.-N., Ducrocq, V. and Fourrié,
N. (2017), Dense water formation in the northwestern Mediterranean area during HyMeX-SOP2 in
1/368 ocean simulations: Ocean-atmosphere coupling impact, J. Geophys. Res. Oceans, 122, 5749–
5773, doi:10.1002/2016JC012526.
Lozano, J., Candela J. (1995) The M2 tide in the Mediterranean Sea : dynamic analysis and data
assimilation. Oceanologica Acta. 18 (4), 19-441.
Mavromatidi, A., Briche, E., Clayes, C., 2018, Mapping and analyzing socio-environmental
vulnerability to coastal hazards induced by climate change: An application to coastal Mediterranean
cities in France, Cities, 72, 189-200.
Millot, C., Wind induced upwellings in the Gulf of Lions, Oceanologica Acta, 2, 1979.
Millot, C., 1987, The structure of mesoscale phenomena in the Ligurian Sea inferred from the DYOME
Experiment, Annales Geophysicae SERIES B-TERRESTRIAL AND PLANETARY PHYSICS, 5(1), pp.
21–30. Millot, C., Broyard, R., Metais, O., Tine, J., 1981, Les oscillations propres de la Rade de Toulon,
Oceanologica Acta, 4(3), 259-262 (in french).
Millot, C., Taupier-Letage, I., 2005, Circulation in the Mediterranean sea. The Handbook of Environment
Chemistry, 5(3), Alain Salot volume Ed., Springer Verlag, Berlin Heidelberg, 29-66. Doi:
10.1007/b107143.
Morrow, R., Carret, A., Birol, F., Nino, F., Valladeau, G., Boy, F., Bachelier, C., Zakardjian, B. 2017.
Observability of fine-scale ocean dynamics in the northwestern Mediterranean Sea, Ocean Sci., 13, 13–
29.
Nicholls, R.J., Hoozemans, F.M.J., 1996. The Mediterranean: vulnerability to coastal implications of
climate change. Ocean Coast Manag. 31, 105–132. http://dx.doi.org/10.1016/S0964-5691(96)00037-
3.
Oddo, P., Bonaduce, A., Pinardi, N. and Guarnieri, A., 2014, Sensitivity of the Mediterranean water
level to atmospheric pressure and free surface elevation numerical formulation in NEMO, Geosci. Model
Dev., 7, 3001-3015.
Pairaud, I., L., Bensoussan, N., Garreau, P., Faure, V., Garrabou, J., 2014. Impacts of climate change on
coastal benthic ecosystems: Assessing the current risk of mortality outbreaks associated with thermal
stress in NW Mediterranean coastal areas, Ocean Dynamics.,64(1), 103-115.
Pastor, F., Valiente, J. A., Palau, J. L., 2018, Sea Surface Temperature in the Mediterranean: Trends and
Spatial Patterns (1982–2016), Pure and Applied Geophys., 175 (11), 4017–4029.
Pérez, B., Payo, A., Lopez, D., Woodworth, P. L., Alvarez Fanjul, E., 2014, Overlapping water level
time series measured using different technologies: an example from REDMAR Spanish network, Nat.
Hazards Earth Syst. Sci., 14, 589–610.
Pettenuzzo, D., Large, W. G. and Pinardi, N., 2010, On the corrections of ERA‐40 surface flux products
consistent with the Mediterranean heat and water budgets and the connection between basin surface total
heat flux and NAO, J. Geophys. Res, 115, C06022, doi:10.1029/2009JC005631.
29
Poulain, P.-M, Barbanti, R., Font, J., Cruzado, A., Millot, C., Gertman, I., Griffa, A., Molcard, A.,
Rupolo, V., 2007, Le Bras, S., and Petit de la Villeon, L., MedArgo: a drifting profiler program in the
Mediterranean Sea, Ocean Sci., 3, 379–395.
Rainaud, R., Lebeaupin Brossier, C., Ducrocq, V., Giordani, H., Nuret, M., Fourrié, N., Bouin, M.-N.,
Taupier-Letage, I. , Legaina, D., 2015, Characterization of air–sea exchanges over the Western
Mediterranean Sea during HyMeX SOP1 using the AROME–WMED Model, Q. J. R. Meteorol. Soc.
142 (Suppl 1): 173–187, August 2016 DOI:10.1002/qj.2480.
Sahal, A., Roger, J., Allgeyer, S., Lemaire, B., Hébert, H., Schindelé, F., Lavigne, F., 2009, The tsunami
triggered by the 21 May 2003 Boumerdès-Zemmouri (Algeria) earthquake: field investigations on the
French Mediterranean coast and tsunami modelling, Nat. Hazards Earth Syst. Sci., 9, 1823–1834.
Satta, A., Puddu, M., Venturini, S., Giupponi, C., 2017, Assessment of coastal risks to climate change
related impacts at the regional scale: The case of Mediterranean region, Int. J. Disaster risk Reduction.,
24, 284–296.
Taupier-Letage, I., Piazzola J., Zakardjian, B., 2013. Les îles d’Hyères dans le système de circulation
marine et atmosphérique de la Méditerranée. Sci. Rep. Port-Cros natl Park, 27: 29-52 (in french).
Torresan, S., Gallina, V., Gualdi, S., Bellafiore, D., Umgiesser, G., Carniel, S., Sclavo, M., Benetazzo,
A., Giubilato, E., Critto, A., 2019. Assessment of Climate Change Impacts in the North Adriatic Coastal
Area. Part I: A Multi-Model Chain for the Definition of Climate Change Hazard Scenarios. Water, 11(6),
1157.
Tsimplis, M. N., Proctor, R. and Flather, R. A., 1995, A two-dimensional tidal model for the
Mediterranean sea, J. Geoph. Res., 100, 16223-16239.
Tsimplis, M. N. and Vlahakis, G. N., 1994, Meteorological forcing and water level variability in the
Aegean Sea, J. Geoph. Res., 71, 2883-2893.
Tsimplis, M. N. and Shaw, A. G. P., 2008, The forcing of mean sea level variability around Europe,
Global and Planetary Change., 63, 196-202.
Van Haren H., Taupier-Letage I. and the ANTARES collaboration, 2011. Acoustic and optical variations
during rapid downward motion episodes in the deep north-western Mediterranean Sea. Deep Sea
Research I: 875-884.
Vigo, M. I., Sánchez-Reales, J. M., Trottini, M., Chao, B. F., 2011. Mediterranean Sea level variations:
Analysis of the satellite altimetric data, 1992-2008, Journal of Geodynamics, 52 (3), 271-278.
Wöppelmann, G., Marcos, M, Coulomb, A., Martin Miguez, B., Bonnetain, P., Boucher, C., Gravelle,
M. Simon, B , Tiphaneau, P., 2014, Rescue of the historal water level record of Marseille (France) from
1885 to 1988 and its extension back to 1849-1851 , J. Geod., 71, 869-885.