On the Spectral Efficiency and Energy Efficiency Analysis ...
143
University of Calgary PRISM: University of Calgary's Digital Repository Graduate Studies The Vault: Electronic Theses and Dissertations 2021-01-07 On the Spectral Efficiency and Energy Efficiency Analysis of Cache-Enabled Heterogeneous Networks with Device-to-Device Communication and Cooperative Transmission Ochia, Okechukwu Emmanuel Ochia, O. E. (2021). On the Spectral Efficiency and Energy Efficiency Analysis of Cache-Enabled Heterogeneous Networks with Device-to-Device Communication and Cooperative Transmission (Unpublished doctoral thesis). University of Calgary, Calgary, AB. http://hdl.handle.net/1880/112973 doctoral thesis University of Calgary graduate students retain copyright ownership and moral rights for their thesis. You may use this material in any way that is permitted by the Copyright Act or through licensing that has been assigned to the document. For uses that are not allowable under copyright legislation or licensing, you are required to seek permission. Downloaded from PRISM: https://prism.ucalgary.ca
Transcript of On the Spectral Efficiency and Energy Efficiency Analysis ...

University of Calgary
PRISM: University of Calgary's Digital Repository
Graduate Studies The Vault: Electronic Theses and Dissertations
2021-01-07
On the Spectral Efficiency and Energy Efficiency
Analysis of Cache-Enabled Heterogeneous Networks
with Device-to-Device Communication and
Cooperative Transmission
Ochia, Okechukwu Emmanuel
Ochia, O. E. (2021). On the Spectral Efficiency and Energy Efficiency Analysis of Cache-Enabled
Heterogeneous Networks with Device-to-Device Communication and Cooperative Transmission
(Unpublished doctoral thesis). University of Calgary, Calgary, AB.
http://hdl.handle.net/1880/112973
doctoral thesis
University of Calgary graduate students retain copyright ownership and moral rights for their
thesis. You may use this material in any way that is permitted by the Copyright Act or through
licensing that has been assigned to the document. For uses that are not allowable under
copyright legislation or licensing, you are required to seek permission.
Downloaded from PRISM: https://prism.ucalgary.ca

UNIVERSITY OF CALGARY
On the Spectral Efficiency and Energy Efficiency Analysis of Cache-Enabled Heterogeneous Networks with
Device-to-Device Communication and Cooperative Transmission
by
Okechukwu Emmanuel Ochia
A THESIS
SUBMITTED TO THE FACULTY OF GRADUATE STUDIES
IN PARTIAL FULFILLMENT OF THE REQUIREMENTS FOR THE
DEGREE OF DOCTOR OF PHILOSOPHY
GRADUATE PROGRAM IN ELECTRICAL AND COMPUTER ENGINEERING
CALGARY, ALBERTA
JANUARY, 2021
© Okechukwu Emmanuel Ochia 2021

Abstract
The Heterogeneous network (HetNet) is a viable candidate for achieving high spectral efficiency (SE) and
energy efficiency (EE) in fifth generation (5G) networks. Cache-enabled HetNets with device-to-device (D2D)
communication can exploit the availability of cheap memory to improve file delivery and reduce file download
latency. In HetNets with simultaneous requests for different file types, the design problems centered on what
file to store and how to utilize limited caching capacity impact the SE and EE.
In this thesis, an association scheme that computes the D2D communication range based on out-of-cell
interference is proposed for establishing cellular and D2D links in a HetNet. The proposed interference-
aware, D2D distance threshold-based association scheme achieves up to 67% gain in the SE and EE compared
to the state-of-the-art minimum path loss-based association scheme. Further, a popularity and size-aware
(PSA) caching scheme is proposed in a hybrid microwave/millimeter wave HetNet. The PSA caching scheme
allocates memory blocks for caching according to Pareto, lognormal, and Gamma file size distributions based
on empirical measurements and is different than the state-of-the-art probabilistic, size-weighted-popularity
(SWP)-based, and most-popular-content (MPC) caching schemes that assume equal file size. Numerical
results show that the proposed PSA caching scheme provides up to 33% increase in the cache hit probability
compared to the probabilistic and MPC caching schemes. Besides, the PSA scheme achieves up to 17% gain
in the file transmission success probability compared to the state of the art. Also, cooperative transmission
among transmitters under the PSA caching scheme realizes up to 70% gain in the file transmission success
probability compared to a non-cooperative transmission scheme.
Lastly, the integration of large scale antenna arrays is proposed to enhance the transmission capacity of
a cache-enabled HetNet with D2D communication. The results reveal that the transmission capacity of the
HetNet scales linearly with the number of antenna elements per transmitter, provided that the number of
antenna elements is not so large. The results in this thesis prove the usefulness of adopting content-aware
caching and multiple transmission schemes to improve the performance of a HetNet with unlimited file
requests and limited caching capacity.
ii

Acknowledgements
I would like to express my utmost gratitude to my supervisor, Dr. Abraham Fapojuwo who provided me with
the opportunity to undertake this research project that has culminated in a thesis. I have been fortunate to
work under his supervision which has enabled me to develop my research and communication skills. I am
equally thankful for his mentorship and the numerous feedback he provided that have greatly improved the
quality of my scholarly works.
I would equally like to thank the members of my examination committee, including Dr. Abu-Bakarr
Sesay, Dr. Geoffrey Messier, Dr. Vassil Dimitrov, and Dr. Carey Williamson. I would like to thank Dr.
Ekram Hossain of the University of Manitoba who was the external examiner for my thesis.
I would also like to thank my past and present colleagues at the Wireless Networking Research Lab,
including Dr. Kasun Hemachandra, Dr. Kazi Ashrafuzzaman, Dr. Fatemeh Ghods, Dr. Ismail Kamal,
Dr. Xiaobin Yang, Dr. Isaac Osunkunle, Dr. Jonathan Kwan, Dr. Hai Wang, Simon Windmuller, Akash
Melethil, Dr. Ahmed Darwesh, Manobendu Sarker, Vatsala Sharma, Lisa Zhao- I am most grateful for your
companionship. I would especially like to thank Dr. Ahmed Darwesh whom I worked with on multiple
projects. His insightful feedback on my work were invaluable to the completion of this thesis.
Last but not the least, I would like to thank my father, mother, and siblings for their moral and spiritual
support throughout my doctoral program. I would not have been able to complete the program without
their support.
iii

Table of Contents
Abstract ii
Acknowledgements iii
Table of Contents vi
List of Tables vii
List of Figures ix
List of Abbreviations x
List of Symbols xii
1 Introduction 11.1 Background . . . . . . . . . . . . . . . . . . . . . . . . . . . . . . . . . . . . . . . . . . . . . . 11.2 System Modeling Using Stochastic Geometry . . . . . . . . . . . . . . . . . . . . . . . . . . . 31.3 Problem Statement and Objectives . . . . . . . . . . . . . . . . . . . . . . . . . . . . . . . . . 41.4 Contributions and Outline . . . . . . . . . . . . . . . . . . . . . . . . . . . . . . . . . . . . . . 5
2 Literature Review 82.1 Device-to-Device Communication in Heterogeneous Networks . . . . . . . . . . . . . . . . . . 82.2 Content-Aware Caching in Heterogeneous Networks . . . . . . . . . . . . . . . . . . . . . . . 102.3 Cooperative Transmission and Multiple-Input Multiple-Output in Heterogeneous Networks . 13
3 Device-to-Device Communication in Heterogeneous Networks 163.1 Introduction . . . . . . . . . . . . . . . . . . . . . . . . . . . . . . . . . . . . . . . . . . . . . . 163.2 System Model . . . . . . . . . . . . . . . . . . . . . . . . . . . . . . . . . . . . . . . . . . . . . 17
3.2.1 Network Topology . . . . . . . . . . . . . . . . . . . . . . . . . . . . . . . . . . . . . . 173.2.2 Propagation Model . . . . . . . . . . . . . . . . . . . . . . . . . . . . . . . . . . . . . . 183.2.3 Content Placement and Delivery . . . . . . . . . . . . . . . . . . . . . . . . . . . . . . 183.2.4 Device Communication Modes . . . . . . . . . . . . . . . . . . . . . . . . . . . . . . . 19
3.3 Analysis of Device Communication Probabilities . . . . . . . . . . . . . . . . . . . . . . . . . 203.3.1 Receive mode Probability . . . . . . . . . . . . . . . . . . . . . . . . . . . . . . . . . . 203.3.2 Transmit mode Probability . . . . . . . . . . . . . . . . . . . . . . . . . . . . . . . . . 213.3.3 HD-only mode Probability . . . . . . . . . . . . . . . . . . . . . . . . . . . . . . . . . . 213.3.4 FD-only mode Probability . . . . . . . . . . . . . . . . . . . . . . . . . . . . . . . . . . 213.3.5 Mixed FD/HD mode Probability . . . . . . . . . . . . . . . . . . . . . . . . . . . . . . 22
3.4 Analysis of Coverage Probability . . . . . . . . . . . . . . . . . . . . . . . . . . . . . . . . . . 223.5 Analysis of Cluster Average Spectral Efficiency . . . . . . . . . . . . . . . . . . . . . . . . . . 253.6 Analysis of Content Average Download Latency . . . . . . . . . . . . . . . . . . . . . . . . . . 253.7 Evaluation Methodology and Discussion of Numerical Results . . . . . . . . . . . . . . . . . . 253.8 Summary . . . . . . . . . . . . . . . . . . . . . . . . . . . . . . . . . . . . . . . . . . . . . . . 30
iv
4 Spectral Efficiency and Energy Efficiency Analysis of Device-to-Device-Enabled Millime-ter Wave Networks 334.1 Introduction . . . . . . . . . . . . . . . . . . . . . . . . . . . . . . . . . . . . . . . . . . . . . . 334.2 System Model . . . . . . . . . . . . . . . . . . . . . . . . . . . . . . . . . . . . . . . . . . . . . 34
4.2.1 Network Topology . . . . . . . . . . . . . . . . . . . . . . . . . . . . . . . . . . . . . . 344.2.2 Path Loss and Channel Fading Models . . . . . . . . . . . . . . . . . . . . . . . . . . . 354.2.3 Blockage Models and Antenna Array Pattern . . . . . . . . . . . . . . . . . . . . . . . 36
4.3 Association Schemes and Resource Allocation . . . . . . . . . . . . . . . . . . . . . . . . . . . 374.3.1 Distance Threshold-Based and Interference-Aware Association . . . . . . . . . . . . . 374.3.2 Orthogonal Resource Allocation and Performance Tradeoffs . . . . . . . . . . . . . . . 40
4.4 Coverage Probability Analysis . . . . . . . . . . . . . . . . . . . . . . . . . . . . . . . . . . . . 414.4.1 Coverage Probability under a General Network Model . . . . . . . . . . . . . . . . . . 414.4.2 Special Case I: Noise-Limited Network with Nakagami-m Fading . . . . . . . . . . . . 424.4.3 Special Case II: Interference-Limited Network with Nakagami-m Fading . . . . . . . . 43
4.5 Joint Optimization of Spectral Efficiency and Energy Efficiency . . . . . . . . . . . . . . . . . 444.5.1 Analysis of Average Rate, Spectral Efficiency, and Energy Efficiency . . . . . . . . . . 444.5.2 Problem Formulation for Spectral Efficiency and Energy Efficiency Optimization . . . 454.5.3 A Goal Attainment Algorithm for Spectral Efficiency and Energy Efficiency Optimization 46
4.6 Evaluation Methodology and Discussion of Numerical Results . . . . . . . . . . . . . . . . . . 474.7 Summary . . . . . . . . . . . . . . . . . . . . . . . . . . . . . . . . . . . . . . . . . . . . . . . 57
5 Popularity and Size-Aware Caching with Cooperative Transmission in Hybrid Microwave/Millimeterwave Heterogeneous Networks 615.1 Introduction . . . . . . . . . . . . . . . . . . . . . . . . . . . . . . . . . . . . . . . . . . . . . . 615.2 System Model . . . . . . . . . . . . . . . . . . . . . . . . . . . . . . . . . . . . . . . . . . . . . 62
5.2.1 Network Topology . . . . . . . . . . . . . . . . . . . . . . . . . . . . . . . . . . . . . . 625.2.2 Radiation Pattern and Directional Beamforming . . . . . . . . . . . . . . . . . . . . . 645.2.3 Path Loss, Fading, and Blockage Modeling . . . . . . . . . . . . . . . . . . . . . . . . 655.2.4 File Request and File Size Distributions . . . . . . . . . . . . . . . . . . . . . . . . . . 665.2.5 User Association Scheme and Cooperative Transmission Design . . . . . . . . . . . . . 67
5.3 Performance Analysis . . . . . . . . . . . . . . . . . . . . . . . . . . . . . . . . . . . . . . . . 685.3.1 Analysis of Cache Hit Probability . . . . . . . . . . . . . . . . . . . . . . . . . . . . . 685.3.2 Analysis of Coverage Probability . . . . . . . . . . . . . . . . . . . . . . . . . . . . . . 685.3.3 Analysis of File Transmission Success Probability . . . . . . . . . . . . . . . . . . . . . 72
5.4 File Popularity and Size-Aware Caching Scheme . . . . . . . . . . . . . . . . . . . . . . . . . 735.5 Optimization Under The File PSA Caching Scheme . . . . . . . . . . . . . . . . . . . . . . . . 74
5.5.1 Optimization of the Network Average Cache Hit Probability . . . . . . . . . . . . . . 745.5.2 Dynamic Programming with Backtracking . . . . . . . . . . . . . . . . . . . . . . . . . 755.5.3 Branch and Bound Algorithm . . . . . . . . . . . . . . . . . . . . . . . . . . . . . . . . 765.5.4 Optimization of the Network Average Success Probability . . . . . . . . . . . . . . . . 79
5.6 Evaluation Methodology and Discussion of Numerical Results . . . . . . . . . . . . . . . . . . 815.6.1 Evaluation Methodology . . . . . . . . . . . . . . . . . . . . . . . . . . . . . . . . . . . 815.6.2 Impact of the File Size Distribution on the Network Average Cache Hit Probability . 825.6.3 Impact of the File Size Distribution on the Network Average Success Probability . . . 845.6.4 Impact of Dense Pico BS Deployment and Cooperative Transmissions With Coded
Caching . . . . . . . . . . . . . . . . . . . . . . . . . . . . . . . . . . . . . . . . . . . . 865.7 Summary . . . . . . . . . . . . . . . . . . . . . . . . . . . . . . . . . . . . . . . . . . . . . . . 87
6 Popularity and Size-Aware Caching in Millimeter Wave Networks with Device-to-DeviceCommunication and Large-Scale Antenna Arrays 896.1 Introduction . . . . . . . . . . . . . . . . . . . . . . . . . . . . . . . . . . . . . . . . . . . . . . 896.2 System Model . . . . . . . . . . . . . . . . . . . . . . . . . . . . . . . . . . . . . . . . . . . . . 90
6.2.1 Network Architecture . . . . . . . . . . . . . . . . . . . . . . . . . . . . . . . . . . . . 906.2.2 Antenna Design and Radiation Pattern . . . . . . . . . . . . . . . . . . . . . . . . . . 92
v

6.2.3 Path Loss, Fading, and Blockage Modeling . . . . . . . . . . . . . . . . . . . . . . . . 926.2.4 File Request and File Size Distributions . . . . . . . . . . . . . . . . . . . . . . . . . . 936.2.5 Association Scheme and Signal Transmission Model . . . . . . . . . . . . . . . . . . . 93
6.3 File Popularity and Size-aware Caching scheme . . . . . . . . . . . . . . . . . . . . . . . . . . 956.4 Performance Analysis . . . . . . . . . . . . . . . . . . . . . . . . . . . . . . . . . . . . . . . . 95
6.4.1 Analysis of Cache Hit Probability . . . . . . . . . . . . . . . . . . . . . . . . . . . . . 956.4.2 Analysis of Average Achievable Rate Per Unit Bandwidth . . . . . . . . . . . . . . . . 966.4.3 Analysis of Rate Coverage Probability and Successful Content Delivery Probability . . 97
6.5 Evaluation Methodology and Discussion of Numerical Results . . . . . . . . . . . . . . . . . . 986.5.1 Evaluation Methodology . . . . . . . . . . . . . . . . . . . . . . . . . . . . . . . . . . . 986.5.2 Impact of the Device Density and Communication Mode on the Cache Hit Probability 996.5.3 Impact of the BS Transmit Power and Number of BS Antenna Elements on the Average
Achievable Rate Per Unit Bandwidth . . . . . . . . . . . . . . . . . . . . . . . . . . . 1016.5.4 Impact of the Rate Threshold and BS Density on the Successful Content Delivery
Probability . . . . . . . . . . . . . . . . . . . . . . . . . . . . . . . . . . . . . . . . . . 1016.6 Summary . . . . . . . . . . . . . . . . . . . . . . . . . . . . . . . . . . . . . . . . . . . . . . . 102
7 Conclusions 1047.1 Major Research Findings . . . . . . . . . . . . . . . . . . . . . . . . . . . . . . . . . . . . . . 1047.2 Engineering Significance of Findings . . . . . . . . . . . . . . . . . . . . . . . . . . . . . . . . 1067.3 Suggestions for Future Work . . . . . . . . . . . . . . . . . . . . . . . . . . . . . . . . . . . . 107
Bibliography 109
A 120A.1 Proof of Ψrx,d2d in Eqn. (3.3) . . . . . . . . . . . . . . . . . . . . . . . . . . . . . . . . . . . . 120A.2 Proof of Lintra(s) in Eqn. (3.16) . . . . . . . . . . . . . . . . . . . . . . . . . . . . . . . . . . 120
B 122B.1 Proof of the Mean Interference Terms in Eqns. (4.13) and (4.14) . . . . . . . . . . . . . . . . 122B.2 Proof of SINR coverage probability in Eqn. (4.18) . . . . . . . . . . . . . . . . . . . . . . . . 123B.3 Proof of the Laplace Transforms in Eqn. (4.19) . . . . . . . . . . . . . . . . . . . . . . . . . . 123B.4 Proof of the Non-Convexity of Eqn. (4.28) . . . . . . . . . . . . . . . . . . . . . . . . . . . . . 124
C 125C.1 Proof of the SINR Coverage Probability Expression in the Pico BS Tier — Theorem 5.1 . . . 125C.2 Proof of Lemma 1 . . . . . . . . . . . . . . . . . . . . . . . . . . . . . . . . . . . . . . . . . . 126C.3 Proof of (5.35) . . . . . . . . . . . . . . . . . . . . . . . . . . . . . . . . . . . . . . . . . . . . 126
D 127D.1 Proof of Average Achievable Rate Per Unit Bandwidth — Theorem 6.1 . . . . . . . . . . . . 127D.2 Proof of Rate Coverage Probability — Theorem 6.2 . . . . . . . . . . . . . . . . . . . . . . . 128
vi

List of Tables
1.1 Summary of Main Contributions of Thesis . . . . . . . . . . . . . . . . . . . . . . . . . . . . . 7
2.1 Comparison of the Proposed Schemes/Algorithms with Existing Schemes/Algorithms in theLiterature . . . . . . . . . . . . . . . . . . . . . . . . . . . . . . . . . . . . . . . . . . . . . . . 15
3.1 Values of System Parameters . . . . . . . . . . . . . . . . . . . . . . . . . . . . . . . . . . . . 26
4.1 Values of System Parameters . . . . . . . . . . . . . . . . . . . . . . . . . . . . . . . . . . . . 49
5.1 Comparison of the Proposed File PSA and State-of-the-art Caching Schemes. . . . . . . . . . 785.2 Values of System Parameters. . . . . . . . . . . . . . . . . . . . . . . . . . . . . . . . . . . . . 82
6.1 Summary of Major Notations . . . . . . . . . . . . . . . . . . . . . . . . . . . . . . . . . . . . 906.2 Values of System Parameters. . . . . . . . . . . . . . . . . . . . . . . . . . . . . . . . . . . . . 98
vii

List of Figures
1.1 Global IP traffic growth [1] . . . . . . . . . . . . . . . . . . . . . . . . . . . . . . . . . . . . . 11.2 Global device connection growth [1] . . . . . . . . . . . . . . . . . . . . . . . . . . . . . . . . 2
3.1 Topology of a HetNet divided into clusters where λc = 10−5m−2, σc = 50, and Nc = 5. . . 183.2 Device communication probability vs. Zipf exponent (M = 1000, Nc = 100). . . . . . . . . . . 273.3 Device communication probability vs. Number of users in a cluster (M = 1000, νr = 1.5). . . 283.4 D2D coverage probability vs. Number of users in a cluster (M = 1000, γT = −6dB, νr = 1.5). 293.5 Cellular coverage probability vs. Standard deviation of cluster at different SINR thresholds
(M = 1000, νr = 0.8, Nc = 100, λc = 10−4m−2). . . . . . . . . . . . . . . . . . . . . . . . 293.6 Cluster average spectral efficiency vs. Number of users in a cluster (M = 1000, λc =10−3m−2,
νr = 1.5). . . . . . . . . . . . . . . . . . . . . . . . . . . . . . . . . . . . . . . . . . . . . . . . 303.7 Cluster average spectral efficiency vs. Density of cluster heads for different cluster sizes (M =
1000, νr = 1.5). . . . . . . . . . . . . . . . . . . . . . . . . . . . . . . . . . . . . . . . . . . . . 313.8 Content average download latency vs. Number of users in a cluster (M = 1000, γT = −6dB,
νr = 1.5). . . . . . . . . . . . . . . . . . . . . . . . . . . . . . . . . . . . . . . . . . . . . . . . 31
4.1 Topology of a mmWave cellular network with 3 cells comprising base stations, users, a typicalcellular link, and a typical D2D link. . . . . . . . . . . . . . . . . . . . . . . . . . . . . . . . . 35
4.2 Cellular and D2D association probabilities vs. average cell radius under blockage model-Awhere rnet = 1km and λ3 = 100 users/km2 (BS = base station, D2D = device-to-device, MinPL = minimum path loss, Max BRP = maximum biased received power). . . . . . . . . . . . 50
4.3 Cellular and D2D association probabilities vs. average cell radius under blockage model-B. . 524.4 Association probability and D2D distance threshold vs. average cell radius for the proposed
association scheme and under the blockage models. . . . . . . . . . . . . . . . . . . . . . . . 534.5 SNR coverage probability vs. SNR threshold for BS and D2D association modes where λ3 =
100 users/km2 and rcell = 200m. . . . . . . . . . . . . . . . . . . . . . . . . . . . . . . . . . . 544.6 SIR coverage probability vs. SIR threshold for Cellular and D2D association modes where λ3
= 100 users/km2 and rcell = 200m. . . . . . . . . . . . . . . . . . . . . . . . . . . . . . . . . . 554.7 SINR Coverage Probability vs. BS density λ1 with λ3 = 100 users/km2 and γ = 25 dB. . . . 564.8 Area SE and EE vs. BS density λ1 with λ3 = 100 users/km2 and γ = 25 dB. . . . . . . . . . 584.9 Network Objective Function and Power Consumption vs. BS density λ1 with λ3 = 100
users/km2, P1,min, P1,max = 43, 46dBm, P3,min, P3,max = 17, 20dBm, ω = β = τ =0.5, ηobj = 5 b/s/Hz, and S∗ = 20 b/s/Hz. . . . . . . . . . . . . . . . . . . . . . . . . . . . . . 59
5.1 Hybrid HetNet architecture with macro BSs (operating in the microwave frequency bands)and pico BSs (operating in the mmWave frequency bands). . . . . . . . . . . . . . . . . . . . 63
5.2 Network average cache hit probability vs. aggregate cache capacity. . . . . . . . . . . . . . . . 845.3 Network average cache hit probability vs. Pareto shape parameter and Pareto scale parameter. 845.4 Network average cache hit probability vs. lognormal location parameter with σ = log 0.01
GB, M1 = 2 GB, and M2 = 1 GB. . . . . . . . . . . . . . . . . . . . . . . . . . . . . . . . . . 855.5 Network average success probability vs. SINR threshold under Pareto file size distribution
with ξ = 0.1 GB, β = 2.0, M1 = 2 GB, and M2 = 1 GB. . . . . . . . . . . . . . . . . . . . . . 85
viii

5.6 Network average success probability vs. SINR threshold under lognormal file size distributionwith µ = log 0.01 GB, σ = log 0.1 GB, M1 = 2 GB, and M2 = 1 GB. . . . . . . . . . . . . . . 86
5.7 Network average success probability vs. pico BS density with ξ = 0.1 GB, β = 2.0, µ = log 0.01GB, σ = log 0.1 GB, M1 = 2 GB, and M2 = 1 GB. . . . . . . . . . . . . . . . . . . . . . . . . 86
5.8 Comparison between cooperative transmission with coded caching and non-cooperative trans-mission without coded caching. . . . . . . . . . . . . . . . . . . . . . . . . . . . . . . . . . . . 87
6.1 Millimeter wave network with cellular communications and device-to-device communications. 916.2 Cellular cache hit probability vs. density of BSs. . . . . . . . . . . . . . . . . . . . . . . . . . 1006.3 D2D cache hit probability vs. D2D partition factor. . . . . . . . . . . . . . . . . . . . . . . . 1006.4 Average achievable rate per unit bandwidth vs. BS transmit power. . . . . . . . . . . . . . . 1016.5 Average achievable rate per unit bandwidth vs. number of BS antenna elements for Pb = 30
dBm . . . . . . . . . . . . . . . . . . . . . . . . . . . . . . . . . . . . . . . . . . . . . . . . . . 1026.6 Successful content delivery probability vs. rate threshold. . . . . . . . . . . . . . . . . . . . . 1036.7 Successful content delivery probability vs. density of BSs. . . . . . . . . . . . . . . . . . . . . 103
ix

List of Abbreviations
Abbreviation Definition
3GPP Third Generation Partnership Project
5G Fifth Generation
BS Base Station
CoMP Coordinated MultiPoint
D2D Device-to-Device
EE Energy Efficiency
FD Full Duplex
FHPPP Finite Homogeneous Poisson Point Process
GB Gigabytes
HD Half Duplex
HetNet Heterogeneous Network
HPPP Homogeneous Poisson Point Process
i.i.d independent and identically distributed
IP Internet Protocol
KP Knapsack Problem
LOS Line-of-Sight
LTE Long Term Evolution
MIMO Multiple-Input Multiple-Output
mmWave millimeter wave
MPC Most-Popular-Content
MRT Maximum-Ratio-Transmission
NLOS Non-Line-of-Sight
OFDMA Orthogonal Frequency Division Multiple Access
x

PCP Poisson Cluster Process
pdf probability density function
PPP Poisson Point Process
PSA Popularity and Size-Aware
RB Resource Block
SE Spectral Efficiency
SINR Signal-to-Interference-Plus-Noise Ratio
SIR Signal-to-Interference Ratio
SNR Signal-to-Noise Ratio
SWP Size-Weighted Popularity
UT User Terminal
VNI Visual Networking Index
xi

List of Symbols
Symbol Definition
Φ1 Macro BS PPP
Φ2 Pico BS PPP
Φ3 User PPP
Φc CH PPP
λ1 Macro BS density
λ2 Pico BS density
λ3 User density
λc CH density
σc Variance of PCP
P1 Macro BS transmit power
P2 Pico BS transmit power
P3 User transmit power
Pt CH transmit power
α Path loss exponent
αL LOS path loss exponent
αN NLOS path loss exponent
εL LOS path loss intercept
εN NLOS path loss intercept
η Nakagami shape parameter
ηL LOS Nakagami shape parameter
U(.) Unit step function
1(.) Indicator function
β Shape parameter of Pareto file size distribution
xii

ξ Scale parameter of Pareto file size distribution
$ Shape parameter of Gamma file size distribution
κ Scale parameter of Gamma file size distribution
µ Location parameter of lognormal file size distribution
σ Scale parameter of lognormal file size distribution
PL(x) Path loss experienced by a link of length x
PL(x) LOS probability for a link of length x
C LOS range under blockage model-A
RL LOS range under blockage model-B
R Network radius
rd D2D range
GkMaximum array gain of a node type k (k = 1 = macro BS,
k = 2 = pico BS)
Gi Random array gain of an interfering BS
θk main lobe signal beamwidth of a node type k
Mk Cache capacity of a node type k
γ SINR coverage threshold
ψ rate threshold for successfully decoding a received file
Ψc Cellular association probability
Ψd D2D association probability
Ψtx D2D transmit mode probability
Ψrx,d2d D2D receive mode probability
ΨHD HD-only mode probability
ΨFD FD-only mode probability
ΨFD/HD Mixed FD/HD mode probability
Υcov,cell Cellular coverage probability
Υcov,FD/HD Mixed FD/HD coverage probability
Γc(r) Cellular received SINR for a link of length r
Γd(r) D2D received SINR for a link of length r
Γd D2D average received SINR
Υcov,k(γ, f) SINR coverage probability of a file f in a tier of node type k
Sk,f (γ, f) Transmission success probability of file f in a tier of node type k
Sk Average success probability in the k-th tier
xiii

qkf Caching probability of a file f in a node type k
ckf Cache hit probability of a file f in a node type k
ck Cache hit probability in the k-th tier
SEavg Cluster average SE
Sc Cellular SE
Sd D2D SE
S Area SE
Rc Cellular rate
Rd D2D rate
R Network rate
Rk(ψ, f) Rate coverage probability of a file f in a node type k
Ec Cellular EE
Ed D2D EE
E Network EE
DLavg,δ Content average download latency for δ-communication mode (cellular or D2D)
H(ψ) Successful content delivery probability
xiv

Chapter 1
Introduction
1.1 Background
The demand for data-centric services and the scale of content generation has seen unprecedented growth
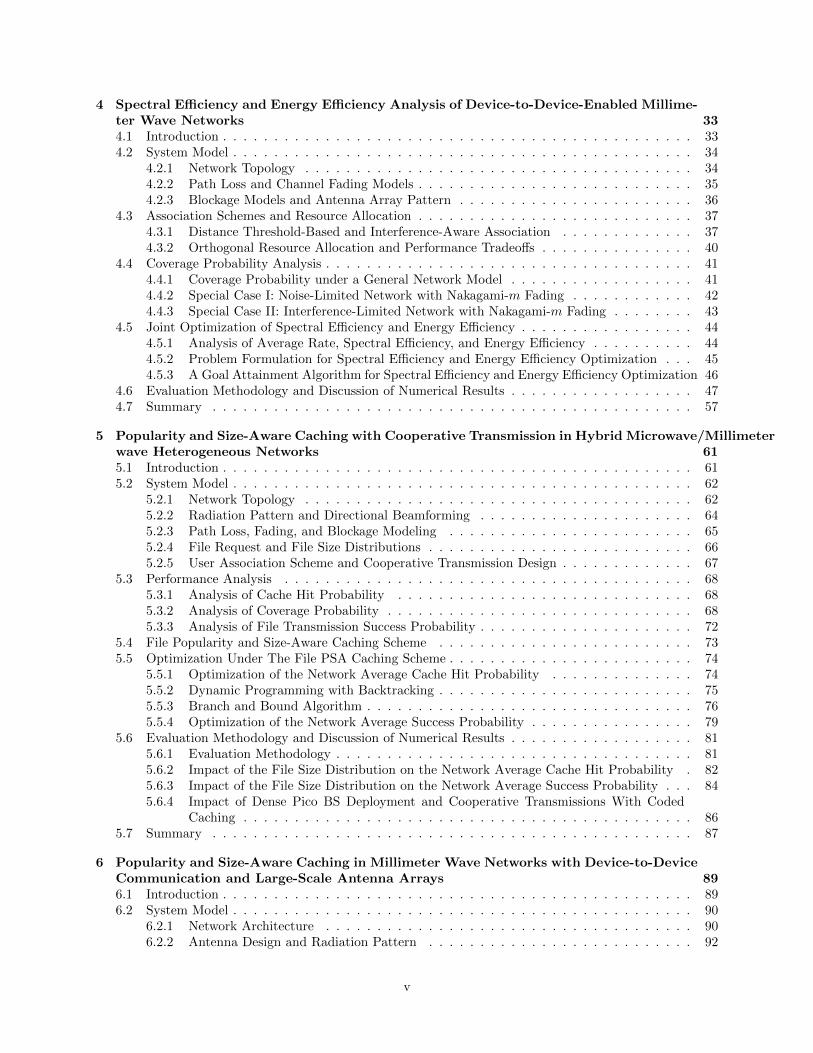
in recent years. For example, the Cisco Visual Networking Index (VNI) reports that the amount of global
Internet Protocol (IP) traffic will reach 400 exabytes per month by 2022, representing a 3-fold increase from
2017 [1] as illustrated in Fig. 1.1. Moreover, Fig. 1.2 shows that more than 8 billion mobile smartphones
and tablets will be able to connect to the Internet by 2022. Thus, the huge demand for bandwidth and data
requires innovative technologies that can extend the spectral efficiency (SE) and energy efficiency (EE) of
the fifth generation (5G) and beyond networks.
Figure 1.1: Global IP traffic growth [1]
The heterogeneous network (HetNet) architecture is currently a promising solution for supporting the
massive density of wireless communications and the ubiquitous device connections [2, 3, 4]. In general, a
1

Figure 1.2: Global device connection growth [1]
HetNet comprises multiple tiers of base stations (BSs), such as macro BSs, pico BSs, and femto BSs. The
macro BS tier provides wide area coverage within a cell, whereas the pico and femto BSs provide broadband
coverage at cell edges and in hotspots [5]. Besides, cooperative transmission schemes can enable multiple
BSs within a tier or in different tiers to serve user requests and enhance the aggregate cellular capacity [6, 7].
The millimeter wave (mmWave) spectrum, which extends from 30 − 300 GHz [8, 9], has attracted cur-
rent research efforts because of the availability of wide bandwidth, which is necessary for high data rate
applications. Notably, the 28− 86 GHz range of mmWave bands have favorable propagation conditions [10]
and are incorporated in 5G HetNets to address the spectrum crunch. However, the mmWave peculiarities
such as the highly directional nature of the signals and the significant blockage require antenna beamforming
techniques [11, 12]. Nonetheless, Device-to-device (D2D) communications can operate in mmWave bands to
enhance the reliability of cellular systems. In this regard, some studies have focused on the integration of
D2D communications into hybrid microwave/mmWave HetNets where the D2D tier can be deployed either
in underlay or overlay modes [13, 14, 15]. Additionally, analytical methods such as point process theory and
the tools of stochastic geometry are adopted to model the spatial randomness of nodes and to evaluate the
achievable performance of D2D-enabled HetNets [16, 17, 18, 19].
The offloading of content from the core network for caching at the edge and in user terminals (UTs) can
alleviate the pressure on the backhaul of the HetNet. In a cache-enabled HetNet, a UT that requests for
content can be serviced through D2D communication by a neighboring UT that has the content in its local
cache. The performance analysis of cache-enabled D2D HetNets has revealed performance gains such as the
maximization of the cache hit probability and successful transmission probability using most-popular-content
caching [20], enhancement in throughput via frequency reuse [21], and the use of a distributed caching policy
to minimize the interference in dense HetNets [22]. Lastly, large scale antenna arrays or massive multiple-
input multiple-output (MIMO) provide multiple degrees of freedom that allow a high degree of spatial
multiplexing and diversity. Thus, cache-enabled HetNets with massive MIMO can achieve higher coverage
2
probability and average rate compared to conventional MIMO systems without caching, provided appropriate
caching algorithms and precoding schemes are employed [23, 24].
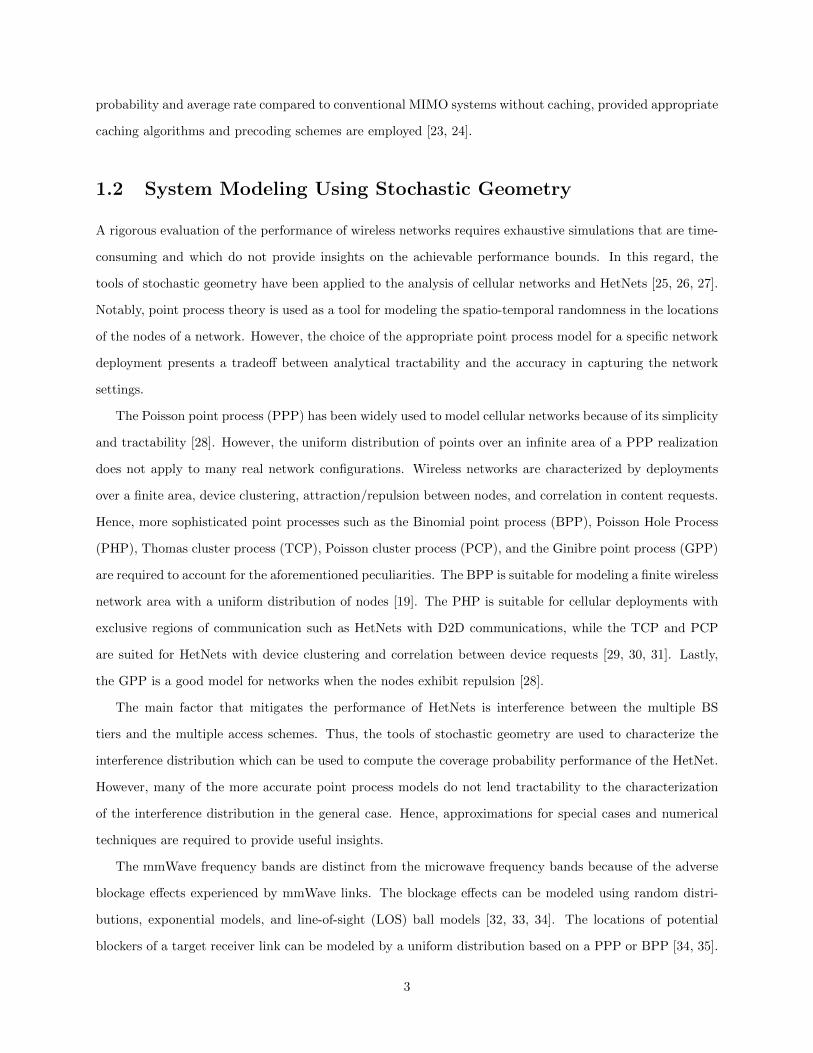
1.2 System Modeling Using Stochastic Geometry
A rigorous evaluation of the performance of wireless networks requires exhaustive simulations that are time-
consuming and which do not provide insights on the achievable performance bounds. In this regard, the
tools of stochastic geometry have been applied to the analysis of cellular networks and HetNets [25, 26, 27].
Notably, point process theory is used as a tool for modeling the spatio-temporal randomness in the locations
of the nodes of a network. However, the choice of the appropriate point process model for a specific network
deployment presents a tradeoff between analytical tractability and the accuracy in capturing the network
settings.
The Poisson point process (PPP) has been widely used to model cellular networks because of its simplicity
and tractability [28]. However, the uniform distribution of points over an infinite area of a PPP realization
does not apply to many real network configurations. Wireless networks are characterized by deployments
over a finite area, device clustering, attraction/repulsion between nodes, and correlation in content requests.
Hence, more sophisticated point processes such as the Binomial point process (BPP), Poisson Hole Process
(PHP), Thomas cluster process (TCP), Poisson cluster process (PCP), and the Ginibre point process (GPP)
are required to account for the aforementioned peculiarities. The BPP is suitable for modeling a finite wireless
network area with a uniform distribution of nodes [19]. The PHP is suitable for cellular deployments with
exclusive regions of communication such as HetNets with D2D communications, while the TCP and PCP
are suited for HetNets with device clustering and correlation between device requests [29, 30, 31]. Lastly,
the GPP is a good model for networks when the nodes exhibit repulsion [28].
The main factor that mitigates the performance of HetNets is interference between the multiple BS
tiers and the multiple access schemes. Thus, the tools of stochastic geometry are used to characterize the
interference distribution which can be used to compute the coverage probability performance of the HetNet.
However, many of the more accurate point process models do not lend tractability to the characterization
of the interference distribution in the general case. Hence, approximations for special cases and numerical
techniques are required to provide useful insights.
The mmWave frequency bands are distinct from the microwave frequency bands because of the adverse
blockage effects experienced by mmWave links. The blockage effects can be modeled using random distri-
butions, exponential models, and line-of-sight (LOS) ball models [32, 33, 34]. The locations of potential
blockers of a target receiver link can be modeled by a uniform distribution based on a PPP or BPP [34, 35].
3

Besides, the exponential model can be combined with large-scale path loss whereby a multiplicative term
that decays exponentially with the link length is added to the path loss function. The LOS radius model
assumes a fixed radius within which a mmWave link is LOS with respect to a BS or transmitter, while a
link is non-line-of-sight (NLOS) outside the LOS radius, which results in significant blockage. The choice
of the appropriate blockage model depends on the deployment environment. Intuitively, an urban network
deployment has a high density of potential blockers within a small area, hence, the LOS radius model with
a pre-selected radius measured by experiments is suitable to capture the blockage effects. In contrast, the
blockage effects in rural or suburban deployments with a low density of potential blockers can be modeled
by a slowly-decaying exponential profile as a function of the mmWave link length.
In summary, the choice of the tools of stochastic geometry and the selection of point process models
rely on an understanding of the deployment parameters of the HetNet, and appropriate approximations are
required to simplify the subsequent performance analysis.
1.3 Problem Statement and Objectives
The open problems that form the research topics in this thesis are divided into four areas listed as follows:
• How does the performance of a mixed full duplex (FD)/half duplex (HD) scheme compare with an
FD-only or HD-only scheme [36, 37, 38] in a D2D-enabled HetNet? The analysis and discussions of
Chapter 3 address this problem.
• How can D2D communications be managed to extend the coverage of a HetNet and what protocols will
govern the association of UTs to BSs or D2D UT transmitters? Further, what propagation models are
needed to leverage the strong directional characteristics of mmWave frequencies and how can the system
parameters be tuned to achieve a desired SE-EE goal? How can mmWave propagation characteristics
and directional beamforming techniques be exploited to enhance the existing minimum path loss-based
and maximum average received power-based association schemes [15, 39, 40, 41, 42, 43, 33, 44, 45]?
The content in Chapter 4 focuses on the stated problems.
• Given backhaul capacity constraints, how can caching and cooperative transmission schemes exploit
knowledge of the available content to improve the performance of a hybrid microwave/mmWave Het-
Net? Notably, how does a caching scheme that maximizes the aggregate popularity of the cached files
impact the system performance, and what are the tradeoffs compared to caching schemes that are not
content-aware [46, 47, 17, 48, 49]? These problems form the topic of Chapter 5.
4

• How does a content-aware caching scheme affect the average achievable rate and successful content
delivery probability of a HetNet with D2D communication and large scale antenna arrays? This
problem is addressed in Chapter 6.
The following thesis objectives, which are aimed at solving the aforementioned open problems, are outlined
in the following:
• Enhance the SE and average download latency of a cache-enabled HetNet with D2D communications.
Chapter 3 focuses on this objective and introduces a mixed FD/HD D2D mode selection scheme where
a device is capable of operating in both FD and HD D2D communication modes.
• Formulate and solve an optimization problem to jointly maximize the SE and EE of a D2D-enabled Het-
Net operating in mmWave frequencies. In Chapter 4, this objective is realized through an association
scheme that accounts for mmWave propagation effects and the antenna design parameters. Besides, a
goal attainment algorithm is introduced as a solution to the SE-EE optimization problem.
• Design a caching scheme that exploits knowledge of the available content to improve the successful
transmission of files in a cache-enabled HetNet operating in microwave and mmWave frequencies.
Based on this objective, Chapter 5 proposes a file popularity and size-aware (PSA) caching scheme
that exploits the knowledge of the file popularity and non-uniform file size of the available content
to improve the average cache hit probability and average file transmission success probability in the
HetNet.
• Study the achievable performance of a cache-enabled HetNet with D2D communications and large scale
antenna arrays. Chapter 6 addresses this objective by investigating the impact of linear precoding and
large scale antenna arrays on the performance of the HetNet.
1.4 Contributions and Outline
The objectives in Section 1.3 reveal the need to couple the caching design and the physical layer design to
optimize the SE and EE in a cache-enabled HetNet with D2D communications. In this regard, the main
contributions of the thesis are listed in the following:
• Chapter 3 assesses the performance of a HetNet that can serve content requests via cellular or D2D
links. Specifically, the analytical expressions for the key performance metrics of device communica-
tion probability, coverage probability, average SE, and content average download latency are derived.
Further, the average download latency of the D2D-enabled HetNet is studied and compared under
5

FD-only, HD-only, and mixed FD/HD communication modes. Lastly, insights are provided on the
optimal communication mode subject to the content popularity distribution.
• Chapter 4 introduces the peculiar characteristics of mmWave propagation and investigates the perfor-
mance of a D2D-enabled network operating in mmWave frequencies. Moreover, an association scheme
that is parameterized by an interference-aware distance threshold is proposed. The interference-aware
association scheme also accounts for the antenna radiation and the random blockage pattern experi-
enced by the mmWave signals. Using the tools of stochastic geometry, the analytical expressions for
the association probability, coverage probability, SE, and EE are derived. Finally, a goal attainment
algorithm for the joint optimization of the SE and EE is proposed. The goal attainment algorithm
incorporates a dynamic transmit power and bandwidth allocation scheme and is compared with a
baseline scheme that assumes constant transmit power and bandwidth allocation.
• Chapter 5 proposes a PSA caching scheme for a hybrid microwave/mmWave HetNet that comprises
macro BSs and pico BSs. The available files are assumed to have sizes that are drawn from independent
Pareto and lognormal distributions according to studies on the statistics of content in servers. Second,
the caching strategy is aimed at maximizing the aggregate popularity of the stored files of a BS, which
is modeled as a zero-one knapsack problem (0-1 KP). The 0-1 KP is solved using dynamic programming
and branch and bound algorithms. Finally, the downlink performance of the cache-enabled HetNet is
analyzed under the PSA caching scheme, and the results are compared with the conventional caching
schemes.
• Chapter 6 extends the study of the PSA caching scheme to a HetNet with large scale antenna arrays.
The main contribution of this chapter is the downlink performance analysis of a mmWave HetNet with
D2D communications and maximum-ratio-transmission precoding. The expressions for the cache hit
probability, average achievable rate, and successful content delivery probability are derived and the
impact of the large-scale antenna arrays on the system performance is investigated.
Besides Chapters 3-6, Chapter 2 reviews the related literature and Chapter 7 presents the thesis conclu-
sions, the significance of the findings, and suggestions for future work.
6

Table 1.1: Summary of Main Contributions of Thesis
S/N Contributions Chapter/Section Publication1 Analysis of the device communication proba-
bility, coverage probability, average SE, andcontent average download latency in a D2D-enabled HetNet
3 [50]
2 Presentation and analysis of an interference-aware distance threshold-based associationscheme that accounts for the propagationcharacteristics in a D2D-enabled mmWave cel-lular network
4.3 [51]
3 Analysis of cellular and D2D association prob-abilities, SE, and EE in a D2D-enabledmmWave cellular network
4.4, 4.5.1 [51]
4 Presentation of a goal attainment algorithmas a solution to the SE-EE joint optimizationproblem
4.5.2, 4.5.3 [51]
5 Presentation and analysis of a PSA cachingscheme under random file size distributions ina cache-enabled HetNet
5.4 A journal paper, currentlyundergoing peer reviewin IEEE Transactions onCommunications
6 Formulation and solution to a 0-1 KP basedon the PSA caching scheme
5.5 A journal paper, currentlyundergoing peer reviewin IEEE Transactions onCommunications
7 Performance analysis of the average achiev-able rate and successful content delivery prob-ability under the PSA caching scheme in acache-enabled HetNet with D2D communica-tions and large scale antenna arrays
6 A manuscript, currentlybeing finalized for submis-sion to the IEEE Transac-tions on Communications
7
Chapter 2
Literature Review
This chapter reviews the body of related works and casts the research undertaken in this thesis within the
context of the state of the art. Specifically, the related works are divided into three research areas relevant
to the scope of this thesis. The first research area focuses on D2D communications in HetNets and surveys
association schemes for D2D communications, which are aimed at improving the SE and EE of HetNets.
The second research area deals with content-aware caching in HetNets, and reviews the caching schemes
that account for the content popularity distribution and system parameters of HetNets. The last research
area is concerned with the performance assessment of cooperative transmission techniques in cache-enabled
HetNets with D2D communications and large scale antenna arrays. A comparison between the work in this
thesis and the state of the art is also presented in this chapter.
2.1 Device-to-Device Communication in Heterogeneous Networks
D2D communication involves the direct exchange of content between user devices without routing the content
through the access or core network. In terms of standardization, the Third Generation Partnership Project
(3GPP) incorporated D2D communication under the Proximity Services feature in the LTE Release 12
and identified its use cases including network offloading, commercial/social-centric communication, third
party application development that leverages 3GPP Proximity Services, and public safety communications
during disaster recovery periods [52]. In [13], an outline of the D2D taxonomy is presented where D2D
is categorized under inband D2D (underlay or overlay) on licensed 3GPP spectrum or outband (network
controlled or autonomous) on unlicensed spectrum. Mathematical techniques have also been proposed to
optimize resource allocation and power consumption in D2D-enabled cellular systems. These techniques
include convex optimization approaches [53] and stochastic geometry [54].
8

The current literature on D2D-enabled HetNets focuses on resource allocation, power control, and inter-
ference management schemes as techniques to improve the network SE and EE. The authors of [55] propose
a heuristic algorithm for resource allocation to enhance the total system rate in a heterogeneous cellular
network comprising multiple microwave and mmWave bands. The idea of the heuristic algorithm is to make
full use of the advantages of cellular network and mmWave network, while minimizing interference and maxi-
mizing the system transmission rate. Moreover, a multicasting service that uses software-defined networking
is proposed in [56] to facilitate D2D communication in HetNets. As noted in [56], the advantage of the
software-defined networking paradigm is the centralized management of the network, which stems from the
separation of the control plane from the data plane. A three-tier HetNet that comprises D2D users, small
cell users, and macro BSs is studied in [57] and a resource selection and scheduling algorithm is proposed
to reasonably allocate the resources in the HetNet. Moreover, the studies account for the caching strategy,
user density, and D2D radius in activating the links and scheduling resources.
Interference is a major drawback in HetNets where D2D links can access licensed cellular bands. In-
terference alignment is a promising solution aimed at reducing the impact of interfering signals by aligning
them in orthogonal subspaces relative to desired signal subspace. In this regard, a D2D-assisted interference
alignment framework in a multi-tier HetNet is investigated by the authors of [58] and they study the use of
precoders and optimal receive filters at the small BSs as a means of enhancing the interference mitigation.
The backhaul is also a major constraint that limits the traffic capacity of a HetNet with multiple node tiers,
thus, the work in [16] proposes a non-uniform deployment of D2D communications to offload the backhaul
traffic and reduce the average traffic delay in a HetNet with cloud computing capabilities. A D2D underlay
with a relay selection mechanism is adopted in [59] to improve the resource utilization and mitigate interfer-
ence from resource reuse in a HetNet with macrocells and femtocells. Moreover, the work in [60] formulates
a joint power allocation and user scheduling problem to maximize the ergodic sum rate of users in a HetNet
with D2D communications and non-orthogonal multiple access. The tools of stochastic geometry and the
Poisson cluster process (PCP) are used in [61] to analyze the uplink of a D2D-enabled HetNet and the results
show that the D2D tier enhances the coverage probability of the HetNet when compared to a HetNet without
D2D. Additionally, [62] considers a channel assignment and power control optimization problem for a Het-
Net with D2D. Specifically, a resource allocation algorithm is proposed for the power control optimization
problem while the results show an improvement in the throughput of cellular users and an improvement in
the EE of D2D users.
Other works have considered mode selection algorithms for optimizing the performance of D2D commu-
nications in HetNets. For example, the work in [63] proposes a mode selection algorithm for interference
mitigation in D2D-enabled HetNets and a power consumption minimization algorithm for mode selection and
9

EE in a D2D-enabled HetNet is studied in [64]. The use of multi-level codebooks with multicast scheduling
is proposed in [65] to improve the EE and network throughput in a D2D-enabled HetNet.
None of the reviewed literature has studied network-aware association schemes for activating the commu-
nication links in a mmWave-based HetNet with D2D communications. In this regard, this thesis proposes an
association scheme for establishing cellular and D2D links that is parameterized by a distance threshold and
accounts for the system parameters including the out-of-cell interference, the antenna radiation pattern, and
the blockage effects. Additionally, the proposed association scheme is compared with the existing minimum
path loss-based and maximum average received power-based schemes adopted in [15, 39, 66]. Moreover, the
analytical expressions of the coverage probability under noise and interference-limited assumptions of the
mmWave HetNet are derived and insights are provided on the impact of the system parameters. The SE
and EE performance metrics present competing tradeoffs in terms of resource allocation and power con-
sumption, hence, a goal attainment algorithm is proposed to jointly maximize the network area SE and
EE metrics. The algorithm incorporates the system design parameters including transmit power and band-
width allocation. The performance of the interference-aware association scheme and the goal attainment
algorithm is investigated under typical system conditions and compared with the existing works that adopt
the minimum path loss-based and maximum average received power-based association schemes, which are
not interference-aware. User clustering in a cache-enabled HetNet is modeled using the PCP, which is dif-
ferent than the lattice and Poisson point process (PPP) models that are adopted in the existing literature
[16, 36, 37, 57]. Different than the work of [61], which equally adopts the PCP for modeling spatial inter-
actions between users, the effect of activating full-duplex, half-duplex, and hybrid full-duplex/half-duplex
D2D communications is investigated.
2.2 Content-Aware Caching in Heterogeneous Networks
The availability of cheap memory and storage capabilities on edge nodes and user devices has motivated
research efforts in content caching schemes that aim to offload traffic from the access and core networks and
minimize the content retrieval delay. Various caching schemes that are content-aware have been proposed
in recent works, such as proactive caching schemes that rely on predictions of content demand and reactive
caching schemes that optimize the delivery of content by observing previous content requests. In [67], a
proactive caching technique that exploits the social and spatial structure of the network is investigated and
shown to achieve some savings in the backhaul utilization. The authors in [17] propose an optimal geographic
content placement scheme that makes use of spatial point models such as the Gibbs or Isings model to capture
the interaction between D2D nodes in a wireless network. The spatially correlated content caching model
10
of [17] specifies exclusion regions where users that cache the same files do not reside, thus, exploiting the
spatial diversity to improve the cache hit probability. The results of the analysis demonstrate higher cache
hit probabilities compared to a baseline independent content placement scheme with no spatial interaction.
Some other works such as [19] have proposed optimal cluster-centric caching to maximize the collective
performance of D2D users within a cluster. Using stochastic geometry, the results in [68] investigate the
impact of the density of cache-enabled nodes on the SE of a small cell network.
Caching schemes have equally been extended to HetNets with multiple tiers of BSs that have different
densities and caching capabilities. The combination of dense small cells, macro BSs with wide area coverage,
and multiple frequency bands are promising solutions to enhance the performance of HetNets. Notably, a
cache-enabled two-tier HetNet with mmWave small cells is studied in [49] and the performance of the success-
ful transmission probability is shown to outperform the performance under traditional HetNet architecture
with no caching ability. A proactive caching technique is adopted in [69] as a means of exploiting D2D
communications in HetNets comprising users with different file popularity profiles. The caching scheme is
optimized and shows significant performance gains compared to a static caching scheme. Moreover, the MPC
caching scheme is optimal in single-cell networks but is sub-optimal in networks with overlapping coverage
and multiple access schemes [70]. The social relationships between users and user mobility are considered
in [71] where an optimal caching strategy for a HetNet with D2D underlay is studied. The results in [71]
show that the optimal caching scheme outperforms both MPC and random caching schemes. Similarly, user
mobility is considered in [72] and a collaborative hierarchical caching strategy is proposed to maximize the
EE in a D2D-enabled HetNet. The authors in [73] adopt a cache refreshment strategy that strikes a balance
between user satisfaction and infrastructure cost, whereas the economical efficiency of a cache-enabled Het-
Net is optimized in [74] with the aid of a scalable video coding framework. In [75], a hybrid caching strategy
that combines probabilistic caching and deterministic caching is employed in a cache-enabled HetNet. The
numerical results show that hybrid caching outperforms MPC caching in HetNets with limited backhaul.
Further, the optimal geographic content placement problem is revisited in [76] where the content placement
and activation densities in a HetNet are jointly maximized, subject to constraints on the cache size and BS
energy consumption. Similarly, the average cache hit rate of a cache-enabled HetNet is maximized in [77],
subject to the cache size constraint of the small BSs.
Joint optimization problems that involve the caching design and other system design aspects have also
been studied. Notably, joint consideration of the caching phase and the transmission phase is aimed at
maximizing the probability of finding requested files within caches and transmitting desired files with min-
imum path loss, favorable channel fading, and minimum interference effects. For example, the authors of
[78] consider joint cache-partitioning, content placement, and user association in D2D-enabled HetNets. By
11

accounting for the system parameters, the study proposes a two-stair algorithm to optimize the cache space
utilization. On the other hand, the work in [79] proposes a distributed content caching and delivery policy to
maximize the EE in a HetNet with different user preferences. The results of the study demonstrate higher EE
compared with the conventional caching schemes. Moreover, the authors of [80] employ a deep deterministic
and policy gradient algorithm to manage the relationships between user clustering and content caching in a
HetNet with no knowledge of the channel gains. On the other hand, a coded caching framework is adopted
in [81] which accounts for user mobility and content popularity and minimizes the amount of downloaded
data from the macro BSs of a HetNet.
In HetNets with no prior knowledge of the content popularity distribution, learning algorithms have been
proposed to track the content popularity profiles of the users. For example, the work in [82] proposes an
online learning algorithm to predict the file popularity profile of a HetNet comprising dense small cells in
order to maximize the SE. Further, a Bayes-based learning algorithm is proposed in [83] to estimate the
popularity distribution of small cell HetNets with unknown content popularity. However, the cost that arises
due to the extra delay from the learning phase is the main drawback. Moreover, a queue-aware cache update
scheduling algorithm is proposed in [84] for the timely update of cached content and to maximize the content
delivery in a HetNet.
The assumption of equal-sized content is adopted in the previous works on cache-enabled HetNets [68,
85, 86, 87, 88]. Different from the literature, this thesis focuses on the joint design of content/file popularity
and content/file size as a means to enhance the success probability of cache-enabled HetNets operating
in mmWave bands. Besides, the Pareto, lognormal, and Gamma distributions are adopted to model the
statistics of the file size. The choice of the aforementioned probability distributions is based on existing
works on file size statistics in content servers [89, 90]. Moreover, the cache capacity of the BSs and users
are provisioned in terms of raw byte-size, different than the existing works that model the cache capacity
in terms of the maximum number of files that can be stored. The optimal file caching problem is modeled
as a 0-1 KP and a class of polynomial-time algorithms is proposed to reduce the exponential complexity of
the problem formulation. Lastly, the performance under the proposed PSA caching scheme is benchmarked
with the conventional MPC, probabilistic, and size-weighted popularity (SWP)-based caching schemes in
the literature [46, 47, 49].
12

2.3 Cooperative Transmission and Multiple-Input Multiple-Output
in Heterogeneous Networks
Cooperative transmission schemes are considered an attractive solution to enhance the performance of multi-
cellular wireless networks. The 3GPP has standardized cooperative transmission techniques under the Co-
ordinated MultiPoint (CoMP) framework, which was introduced in LTE-Advanced and has been adopted in
fifth generation networks [91]. The CoMP framework makes provision for the synchronous or asynchronous
joint transmission of data from multiple BSs in a HetNet [6, 92] and coordinated beamforming of signals
of multiple BSs within a cluster [93, 94] to improve the SE and ergodic rate. In this regard, D2D commu-
nications in cache-enabled HetNets can exploit the aforementioned cooperative transmission techniques to
maximize the system performance.
The studies in [95, 96] propose small BS cooperative transmission under a random caching scheme with
the caching distribution as the design parameter. A random caching scheme stores files whose indices are
selected from a caching distribution, as opposed to a deterministic caching scheme where the probability of
storing a file is either zero or unity. The studies in [95, 96] show that the successful transmission probability is
maximized and exhibits better performance compared to deterministic caching schemes including MPC and
independent caching. In [97], a random caching-based cooperative transmission scheme is equally studied
in a HetNet with popularity prediction errors. The ensuing results also demonstrate the robustness of the
caching scheme when compared with the MPC caching scheme and the uniform caching scheme where all
files are cached with equal probabilities. Hybrid caching with base station cooperation is adopted in [98]
where popular files are fully cached and less popular files are partially cached in helper nodes. Moreover,
cooperative strategies are designed to deliver the cached content to users and the results indicate significant
gains in the performance of the system. Besides, the performance of a cooperative content delivery scheme
in a D2D-enabled HetNet with BSs and small cells is analyzed in [57].
A cluster-centric small cell network is considered in [99] where cooperative joint transmission and parallel
transmission are exploited to deliver the most popular and least popular content to requesting users. The
results demonstrate performance gains when compared to a similar system without cooperative transmission.
The authors in [100] study the impact of BS heights, transmission distance, cached contents, and cell load
on the cooperative transmission mechanism of a HetNet. On the other hand, an optimal cooperative content
caching and delivery policy for a HetNet is derived in [101]. The content delivery performance under the
optimal cooperative content delivery policy is shown to outperform the performance obtained under a greedy
caching scheme and a scheme without caching. In [102], a joint resource allocation and power control problem
is formulated for a cooperative D2D HetNet. A quantum coral reef algorithm is subsequently proposed to
13

maximize the total throughput of the network and the results demonstrate excellent performance.
In parallel, cache-enabled HetNets with D2D communications in mmWave bands can exploit large scale
antenna arrays or massive MIMO due to the extremely small wavelengths of the mmWave carrier frequencies
which enable the design of antennas with very small apertures. In this regard, the benefits of massive MIMO
are demonstrated in the uplink of a cache-enabled HetNet where users and small BSs can upload their content
to other users and the core network, respectively. The outage probability and the average delivery rate are
derived using the tools of stochastic geometry and the numerical results investigate the performance gains
of the proposed framework in terms of the operating network parameters.
The work in [24] investigates a cache-aided massive MIMO framework that exploits linear precoding and
interference cancellation. The results highlight the benefit of a joint linear precoding design with caching
and massive MIMO in achieving a gain in the system ergodic rate compared to a conventional MIMO design.
The analysis in [103] examines the joint caching design with massive MIMO for the downlink of a MIMO
channel with Rayleigh fading and the results demonstrate performance gains with an increase in the number
of antennas.
The effects of cell load and cache hit probability on the successful content delivery probability of an edge-
caching network with massive MIMO-aided self-backhaul is studied in [104]. The analysis reveals the need
to appropriately select the caching distribution to successfully deliver content. Moreover, massive MIMO-
aided backhauling is shown to achieve a similar delay in retrieving cached content compared to non-cached
content. The authors in [105] propose a non-linear programming model to optimize the EE and successful
content delivery probability of a cache-enabled mmWave cellular network with massive MIMO. The results
demonstrate performance gains compared to single-input single-output mmWave links. In [106], a hybrid
microwave and mmWave HetNet with massive MIMO is studied while content-based and location-based
user association schemes are proposed. The results demonstrate a positive correlation between the cache
capacity and the network performance but require trade-offs in the user association strategies, the caching
placement schemes, cache size, content popularity, blockages in the mmWave tier, and pilot contamination
due to channel estimation in the massive MIMO tier.
Similar to the literature on cache-enabled HetNets with D2D communications, the body of literature
that incorporate large scale antenna arrays into cache-enabled HetNets with D2D communications [24,
103, 104, 105, 107, 108, 109, 110, 111, 112, 113] do not account for the non-homogeneous content size.
Thus, a chapter of this thesis is dedicated to the downlink performance analysis of a mmWave cellular
HetNet with D2D communication and large scale antenna arrays under the PSA caching scheme. Also,
mathematical expressions are derived for the cache hit probability, average achievable rate, and the successful
content delivery probability of the system and the results are compared with the state-of-the-art SWP-based,
14

probabilistic, and MPC caching schemes.
Table 2.1: Comparison of the Proposed Schemes/Algorithms with Existing Schemes/Algorithms in theLiterature
Proposed Scheme/Algorithm Features of ProposedScheme/Algorithm
Features of ExistingSchemes/Algorithms
Mixed D2D FD/HD mode selectionscheme
A device is capable of operatingin both FD and HD modes witha non-zero probability
A device is capable of op-erating in either FD modeor HD mode but not both[36, 37, 38]
Interference-aware D2D distance-threshold based association scheme
Considers path loss, channel fad-ing effects, blockage environ-ment, and antenna design pa-rameters
Consider only path lossand channel fading effects[15, 39, 40, 41, 42, 43, 33,44, 45]
Goal attainment algorithm SE and EE are coupled intoa multi-objective optimizationproblem
SE and EE are decoupledinto single-objective opti-mization problems [114]
PSA caching scheme with random filesize distribution
Considers Pareto, Gamma, andlognormal distributions based onexperimental studies
Assumes determinis-tic and equal file sizes[86, 88, 68, 87, 85]
PSA caching scheme with dynamic pro-gramming and branch and bound algo-rithms
Accounts for popularity, size,and cache capacity in bytes
SWP-based caching ac-count for only popularityand size [46], Probabilis-tic and MPC/Popularity-based caching schemes ac-count for only popularity[47, 17, 48, 49]
15
Chapter 3
Device-to-Device Communication in
Heterogeneous Networks1
3.1 Introduction
This chapter presents the performance analysis of a HetNet operating in the microwave band that is capable of
servicing requests for content using cellular and D2D communications. The main contribution of this chapter
is the derivation of analytical expressions for the device communication probability, coverage probability,
cluster average SE, and content average download latency of a HetNet when user devices in the HetNet are
capable of operating in multiple communication modes. Moreover, the results highlight the importance of
configuring user devices to operate in a particular mode of communication according to a target network
design objective.
The conventional cellular architecture, where a user’s request is serviced by retrieving the requested
content from a content server in the core network, poses the drawback of excessive download latency and
increased energy consumption at the network infrastructure nodes. To address the latency and energy
consumption drawbacks, it has been proposed to offload popular content from the core network for caching
at the edge and in user devices [115]. Popularity-based content placement schemes have been proposed for
D2D-enabled networks, including device-centric placement where content is placed at a neighboring device
relative to a requesting device and cluster-centric placement, which focuses on optimizing the combined
performance of a group of devices with similar content preferences [19].
1The content of this chapter has generated a conference paper publication [50], K. T. Hemachandra, O. Ochia and A. O.Fapojuwo, ”Performance study on cache enabled full-duplex device-to-device networks,” in 2018 IEEE Wireless Communicationsand Networking Conference (IEEE 2018 WCNC), Barcelona, Spain, June 2018.
16

Spectrum sharing techniques in D2D-enabled HetNets have also been studied as a means of providing
a better quality of service and meeting increasing user demands [116]. In a D2D underlaid HetNet, D2D
transmissions reuse the cellular spectrum to maximize the network SE while access control techniques are
employed to limit the interference that is experienced by cellular transmissions [116, 117]. On the other hand,
in D2D overlaid HetNets, resource allocation for D2D communication is orthogonal with respect to cellular
communication which simplifies the interference avoidance techniques at the cost of decreased SE gains
[118, 119]. The performance analysis under a D2D overlaid HetNet with cluster-centric content placement
is described in the following subsections.
3.2 System Model
3.2.1 Network Topology
The spatial distribution of devices within a HetNet is modeled according to a PCP [18, 120]. Under the
PCP model, the HetNet is divided into two tiers where the first tier consists of BSs that are designated
as cluster heads (CHs) and the second tier consists of user devices. The locations of the CHs, termed the
parent points, are distributed according to a PPP Φc with density λc, and the locations of the user devices,
termed the offspring points, are independently distributed around each CH, forming non-overlapping clusters
that follow a symmetric Gaussian distribution with zero mean and variance σ2c ∈ R2 [19, 121]. Each cluster
represents a group of users with similar content preferences where the users are divided into cellular users
that communicate with a CH and D2D users that communicate with other users within the cluster according
to the content placement and delivery protocol that is described in Section 3.2.3.
The probability density function (pdf) of the location of a user device x ∈ R2 relative to its CH is given
by [19, 120]:
fX(x) =1
2πσ2c
exp(− ||x||
2
2σ2c
), (3.1)
where ||x|| represents the Euclidean distance between the user device and its CH. A D2D overlay model is
assumed in the HetNet where the available system bandwidth is divided between D2D and cellular links to
mitigate inter-tier interference. Additionally, communications within the same tier (cellular or D2D) occur in
the same spectrum, resulting in intra-cluster and inter-cluster interference. However, due to the short-range
nature of D2D links within a cluster, the D2D tier performance is limited by intra-cluster interference [18].
Hence, the D2D analysis focuses on a single representative cluster Co with a CH located at the origin, and
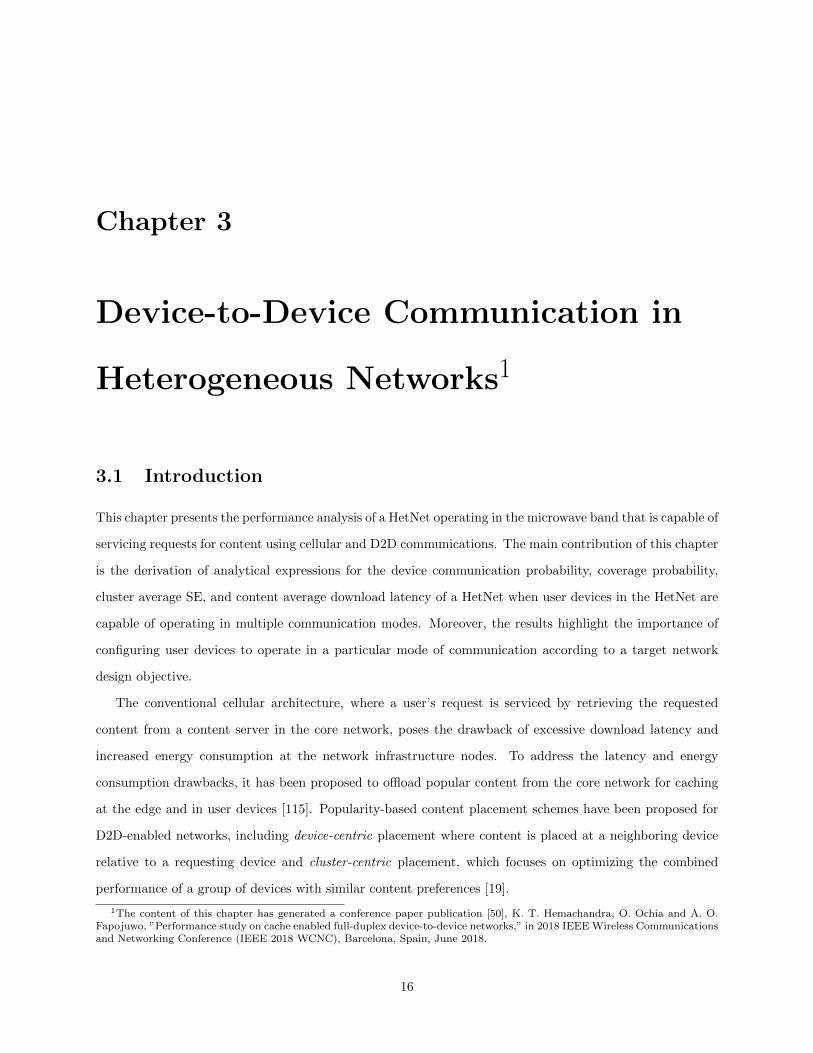
the cellular analysis considers inter-cluster interference from other transmitting CHs within the HetNet. Fig.
3.1 illustrates the topology of the HetNet where the number of user devices in a cluster is assumed to be a
17
constant Nc.
-600 -400 -200 0 200 400 600
-600
-400
-200
0
200
400
600
Cluster head
User device
Figure 3.1: Topology of a HetNet divided into clusters where λc = 10−5m−2, σc = 50, and Nc = 5.
3.2.2 Propagation Model
All communications are assumed to occur in the microwave spectrum2 and the propagation channel for a
communication link is modeled using small-scale Rayleigh fading and large-scale path loss. The channel
fading power gain is exponentially distributed with unit mean and the path loss is distance-dependent with
a path loss exponent α [122, 123]. The CHs are assumed to transmit to the cellular user devices in the cluster
with a constant power Pt and the user devices are assumed to transmit with a different constant power Pd.
3.2.3 Content Placement and Delivery
The users in Co can request files from a library of M most popular files of equal size 3 denoted by F =
f1, f2, . . . , fM where F is an ordered list such that the popularity of file fi is inversely proportional to
its index i [121]. In general, a user device can cache a subset of files in the set F according to its storage
capacity, however, for simplicity, it is assumed that the storage capacity available for caching at a user device
2Millimeter wave-based communication is discussed in Chapter 4.3File size distributions based on empirical studies are discussed in Chapters 5 and 6.
18
is limited to a single file4 from the set F [19, 121]. In addition, the first Nc files in F are assumed to be
cached at the Nc user devices in the cluster, such that user device i caches the i-th file without replicated
caching of the i-th file at the other user devices referred to as deterministic caching [121]. The remaining
M −Nc files can be stored either at the CH or in a file server. For worst-case analysis, all the Nc users are
assumed to simultaneously send requests to the CH for downloading a file from the file library set F .
A Zipf distribution is adopted to model the user requests based on measurements of the popularity of
files in user-generated systems [124]. Under the Zipf model, the probability that a user requests an arbitrary
file fi is given by [121, 125]
Ψfi =1iνr
M∑j=1
1jνr
, 1 ≤ i ≤M, (3.2)
where νr is the Zipf exponent which controls the skewness of the user requests. A large value of νr (νr > 1)
indicates that a high fraction of requests are dominated by few popular files and a small value of νr (0 <
νr < 1) means that the requests are spread out over the available files. In video streaming platforms like
Netflix™ and Amazon™ Prime Video, a large value of νr can be likened to a timeline when a popular movie
or series premieres and is seen by many subscribers over a short period. On the other hand, a small value of
νr can be likened to normal periods of subscriber viewership. Moreover, the Nc users in a cluster are equally
likely to request files in F and their respective requests are independent of each other. The CH is assumed to
have complete knowledge of the cached file in each user device and determines the content delivery method
for each user request as follows:
Consider the case when the i-th user ui in Co requests file fj (1 ≤ j ≤M).
• If fj is cached in ui, ui retrieves fj from its own cache, i.e., self-request and self-delivery.
• If fj is cached at user uj (j 6= i), the CH tags uj as a D2D transmitter for ui and uj transmits fj to
ui via a D2D link.
• if fj is neither cached in ui nor any device uj in Co, fj is delivered via a cellular link.
With the described content delivery policy, a user retrieves its file from a single source while it may service
the requests of multiple files via broadcast transmission.
3.2.4 Device Communication Modes
In order to analyze all the possible communication scenarios in the representative cluster Co, six communica-
tion modes for user devices are considered, namely D2D receive mode, cellular receive mode, D2D transmit
4Caching of multiple files is assumed in Chapters 5 and 6.
19
mode, HD-only mode, FD-only mode, and mixed FD/HD mode.
• D2D/Cellular receive modes: A user device ui operates in D2D receive mode when it requests a file
that is not in its cache but is available in the cache of another user device uj in the cluster where j 6= i.
If the requested file is not found in the cache of any user device in the cluster, the device operates in
cellular receive mode.
• D2D transmit mode: A user device ui that stores a file fi in its cache operates in transmit mode if at
least one of the other devices in the cluster requests fi.
• HD-only mode: A user device ui operates in HD-only mode if it either receives a requested file but
does not transmit or it transmits its cached file but does not receive within a transmission time interval
(TTI).
• FD-only mode: A user device ui operates in FD-only mode if it simultaneously transmits its cached
file and receives its requested file within a TTI.
• Mixed FD/HD mode: A user device that is capable of operating in FD or HD mode communicates
using the mixed FD/HD mode if it operates in FD mode with a probability p or HD mode with the
complementary probability (1 − p). Thus, p is the probability that the device operates in FD mode
given that the device can operate in FD or HD modes.
3.3 Analysis of Device Communication Probabilities
3.3.1 Receive mode Probability
The probability that a user device is a D2D receiver is given as:
Ψrx,d2d =1
N2c
∑∀i∈Nc
∑∀fj∈Fc
( Nc∑k=1
Ψfk −Ψfj
), 1 ≤ i ≤ |Nc|, 1 ≤ j ≤ Fc, (3.3)
where Nc represents the set of devices in the cluster with cardinality |Nc| = Nc and Fc is the set of all files
that are cached in the cluster, also with cardinality |Fc| = Nc.
Proof of (3.3). See Appendix A.1.
Remark. Note that Ψfj is the probability that a user requests file fj as given in (3.2). The termNc∑k=1
Ψfk
represents the probability that the requested file is cached in the cluster and Ψfj is subtracted fromNc∑k=1
Ψfk
20

to exclude self-requests. The factor 1N2c
results from averaging over the Nc user requests for the Nc cached
files in the cluster.
The probability that a user device is a cellular receiver is the complement of the probability that the
user device is a D2D receiver, i.e., Ψrx,cell = 1−Ψrx,d2d. Consequently, for a constant cluster size, a greater
fraction of D2D receivers results in a lesser fraction of cellular receivers, and vice-versa.
3.3.2 Transmit mode Probability
The probability that a user device operates as a D2D transmitter is given as:
Ψtx =1
N2c
∑∀k∈Nc
∑∀j∈Fc
(1− (1−Ψfj )
Nc−1), (3.4)
Remark. (1−Ψfj )Nc−1 represents the probability that the cached file fj at the user device is not requested
by any of the other (Nc − 1) devices in a cluster and 1− (1−Ψfj )Nc−1 is the probability that at least one of
the other (Nc − 1) devices in the cluster requests fj, thus making the device transmit file fj.
3.3.3 HD-only mode Probability
Following the definition of HD-only mode of communication in Section 3.2.4, the HD-only mode probability
is given by:
ΨHD =
Ψrx,d2d(1−Ψtx), user device operates as a D2D receiver in HD only mode
Ψtx(1−Ψrx,d2d), user device operates as a D2D transmitter in HD-only mode.
(3.5)
3.3.4 FD-only mode Probability
The probability that a user device operates in FD-only mode of communication is given as:
ΨFD = Ψrx,d2dΨtx, (3.6)
which follows from the independence of the two events, i.e., the event that the device operates as a D2D
receiver and the event that it operates as a D2D transmitter.
21
3.3.5 Mixed FD/HD mode Probability
The probability that a user device operates in either HD or FD modes of communication, i.e., the mixed
FD/HD mode probability, given that the device is capable of operating in FD or HD modes is given as:
ΨFD/HD =
p, user device operates in FD mode
1− p, user device operates in HD mode,
(3.7)
where
p =ΨFD
ΨFD + ΨHD. (3.8)
Now, considering the case when the user device operates as a D2D receiver in HD-only mode, by substituting
the corresponding expressions for ΨHD in (3.5) and ΨFD in (3.6) into (3.8), p simplifies to Ψtx, the probability
that the device operates as a transmitter.
3.4 Analysis of Coverage Probability
Coverage probability is defined as the probability that the received signal-to-interference-plus-noise ratio
(SINR) at a target receiver exceeds γT , a specified threshold for decoding received signals. First, the
analysis of the coverage probability for the case when a target D2D receiver operates in mixed FD/HD mode
is presented as a general case for D2D communication modes. Given that the target D2D receiver located
at a distance r from the desired D2D transmitter is operating in mixed FD/HD mode, the received SINR is
given by:
Γd(r) =Pdhdr
−α
εo + Iintra + IFD/HD, (3.9)
where hd is the channel fading power gain of the link between the desired D2D transmitter and the target
D2D receiver, εo is the additive white Gaussian noise power, Iintra is the interference from other active D2D
transmissions within the cluster, and IFD/HD is the self-interference (SI) at the target D2D receiver. Since
the D2D receiver is capable of operating in FD or HD modes, the expression for IFD/HD is given by
IFD/HD =
βPd, D2D receiver is in FD mode w.p. p
0, D2D receiver is in HD mode w.p. (1− p),(3.10)
where βPd is the SI of the target D2D receiver when it operates in FD mode and β is the portion of the
transmit power that leaks to the D2D receiver. Iintra is calculated by
22

Iintra =
NI∑j=1
Pdhjr−αj , (3.11)
where NI is the number of D2D transmitters in the cluster that interfere with the desired D2D transmission,
rj and hj are the distance and channel fading power gain between the j-th interfering D2D transmitter and
the target D2D receiver, respectively.
The expression for the coverage probability when the target D2D receiver operates in mixed FD/HD
mode, denoted by Υcov,FD/HD is given by:
Υcov,FD/HD = E[Pr(hd >
γT rα(ε
o+ Iintra + IFD/HD
)Pd
)], (3.12)
where the expectation is taken over the random variables r, Iintra, and IFD/HD. Given that hd ∼ exp(1),
(3.12) simplifies to:
Υcov,FD/HD = Er[
exp(−γT rαεo
Pd
)Lintra
(γT rαPd
)LFD/HD
(γT rαPd
)], (3.13)
where LX(s) , E(exp(−sX)) denotes the Laplace transform of the random variable X. Taking the expec-
tation with respect to r and considering (3.10), (3.13) expands to:
Υcov,FD/HD =
∞∫x=0
exp(−γTxαεo
Pd
)Lintra
(γTxαPd
)(p exp(−γTxαβ) + (1− p)
)gX(x) dx, (3.14)
where gX(x) is the pdf of the distance between the desired D2D transmitter and the target D2D receiver
which follows a Rayleigh distribution [19] given by:
gX(x) =x
2σ2c
exp
(− x2
4σ2c
). (3.15)
Further, Lintra(s) is approximated by
Lintra(s) ≈ exp
(− (Na − 1)Ψtx
∞∫y=0
sPdyα + sPd
gY (y) dy
), (3.16)
where the parameter s = γT xα
Pdand Na is the maximum number of active D2D transmitters in the cluster,
which depends on the mode of communication as follows:
23

Na =
Nc2 , HD-only mode
Nc, FD-only mode
Nc, mixed FD/HD mode only,
(3.17)
and gY (y) is the pdf of the random variable Y , representing the distance between an interfering D2D
transmitter and the target D2D receiver, which is also Rayleigh distributed [19].
Proof of (3.16) . See Appendix A.2.
Remark. Eqn. (3.14) gives the general expression of the coverage probability for all D2D communication
modes in the cluster. The coverage probability expressions for HD-only mode and FD-only mode can be
obtained by setting p = 0 and p = 1, respectively, in (3.14).
The analysis of the SINR and coverage probability for the case when the target receiver operates in
cellular receive mode is presented next. The expression for the SINR under cellular receive mode is given as:
Γc(r) =Pthtr
−α
εo + Iinter, (3.18)
where ht is the channel fading power gain of the link between a CH and the target cellular receiver and Iinter
is the interference from cellular transmissions outside Co. Iinter is calculated by:
Iinter =∑
k∈Φc\b
Pthkr−αk , (3.19)
where Φc \ b represents the set of interfering cluster heads whose transmissions interfere with the desired CH
labeled b. rk and hk are the distance and channel fading power gain between the k-th interfering CH and
the target cellular receiver, respectively.
The expression of the coverage probability under the cellular communication mode is derived similar to
the derivation under the D2D communication mode. Thus,
Υcov,cell =
∞∫x=0
exp(− γTx
αε0Pt
)Linter(
γTxα
Pt)fX(x) dx (3.20)
where fx(x) is the pdf of the location of the target receiver relative to its CH, which is given in (3.1). Further,
24

Linter(s∗) is derived based on similar analysis in [126]:
Linter(s∗) = exp
(− 2πλcΨrx,cell
∞∫y=0
s∗Ptyα + s∗Pt
dy
), (3.21)
where s∗ = γT xα
Ptand λcΨrx,cell represents the density of the interfering clusters heads in the cellular
communication mode.
3.5 Analysis of Cluster Average Spectral Efficiency
The cluster average spectral efficiency is determined as a product of the average number of D2D/cellular
transmitters and the target receiver in a cluster given by:
SEavg =
NaΨtxΥcov,δ log2(1 + γT ), δ ∈ FD,HD,FD/HD = D2D
λcΨrx,cellΥcov,δ log2(1 + γT ), δ = cellular,
(3.22)
where δ is the communication mode of the target receiver.
3.6 Analysis of Content Average Download Latency
The content average download latency (in seconds) for files that are downloaded inside a cluster is expressed
as:
DLavg,δ =ηW
BδΥcov,δ log2
(1 + γT
) , (3.23)
whereW is the size of the downloaded file in bits, assumed to be constant for all files, δ ∈ FD,HD,FD/HD,
cellular is the mode of downloading a file, Bδ is the bandwidth allocation in Hz for δ-communication mode,
and η is the probability that a downloaded file is not in the cache of the target receiver given that the file is
in the cluster, which is calculated as:
η =
Ψrx,d2dNc∑k=1
Ψfk
, δ = D2D
Ψrx,cellM∑
k=Nc+1
Ψfk
, δ = cellular.
. (3.24)
3.7 Evaluation Methodology and Discussion of Numerical Results
The values of the performance metrics of the HetNet are computed in MATLAB by following the steps:
25

• Declare the values of the system parameters, i.e., Nc,M, νr, Pt, Pd, . . . .
• Compute the value of the performance metric per user in the representative cluster Co, e.g., cellu-
lar/D2D coverage probability based on the propagation model of Section 3.2.2, the content placement
and delivery protocol of section 3.2.3, and the corresponding expressions for the performance metric.
• Compute the value of the performance metric for the HetNet by averaging over the Nc users in the
representative cluster Co.
The assumed values for the system parameters of the HetNet are chosen according to the related works
on microwave-based networks [37, 38, 123, 127]. The chosen values are listed in Table 3.1 and otherwise, are
stated under the discussion of the graphical results.
Table 3.1: Values of System Parameters
Notations Definition Assumed ValuesPt, Pd CH transmit power, D2D trans-
mit power33 dBm, 23 dBm [123, 37]
α, Bδ, εo Path loss exponent, band-width allocation in Hz forδ-communication mode, additivewhite Gaussian noise power
4, 1.4 × 10⁶ Hz, −174 +10 log10Bδ + NF dB, NF = 3 dB[127, 38]
M, W Number of files in file library,size of downloaded file
1000, 100 MB [123, 127, 37]
Fig. 3.2 illustrates the plot of the device communication probability vs. the Zipf exponent νr, where νr
has an inverse relationship with the number of popular file requests. It can be observed that Ψrx,d2d increases
monotonically with νr because user requests become more concentrated on a few popular files resulting in an
increase in the probability that the requested files are cached in the cluster. Conversely, Ψrx,cell decreases
monotonically with νr because the increase in the number of D2D receivers in the cluster decreases the
number of cellular receivers. Unlike Ψrx,d2d and Ψrx,cell, which exhibit strictly monotonic behaviors with νr,
Ψtx exhibits a concave behavior with νr. In the low νr range (0 < νr < 1), the requests are spread out over
the user devices in the cluster and Ψtx increases with νr, but up to a maximum point. Beyond the maximum
point, a further increase in νr concentrates the requests to a few distinct files, making Ψtx to decrease with
νr.
ΨFD exhibits a similar behavior to Ψtx because it is equal to the product of Ψtx (concave with νr) and
Ψrx,d2d (strictly monotonic with νr). Similar reasoning applies to the behaviors of ΨHD in D2D receiver
mode and ΨHD in D2D transmitter mode, which are equal to Ψrx,d2d(1−Ψtx) and Ψtx(Ψrx,d2d), respectively.
26

As expected, the curve for ΨFD/HD is identical to the curve for Ψtx when the target D2D receiver operates
in FD mode given, that it can operate in either FD mode or HD mode.
0 0.5 1 1.5
Zipf exponent r
0
0.1
0.2
0.3
0.4
0.5
0.6
0.7
0.8
0.9
1
Dev
ice
com
mu
nic
atio
n p
rob
abil
ity
rx, d2d
rx, cell
tx =
FD/HD
HD, receiver
HD, transmitter
FD
Figure 3.2: Device communication probability vs. Zipf exponent (M = 1000, Nc = 100).
The sensitivity of the device communication probability to the number of user devices in a cluster Nc is
presented in Fig. 3.3. The selected value of νr is chosen to ensure that the user requests are concentrated
on a few popular files. As explained in Fig. 3.2, there is a high probability of finding the requested file
in the cluster which serves as a reason for the increase of Ψrx,d2d with νr and conversely, the decrease of
Ψrx,cell with νr. However, as the value of Nc tends towards the constant value of the number of available
files M = 1000, Ψrx,d2d eventually converges to M−1M (≈ 1) and Ψrx,cell converges to 1 − M−1
M (≈ 0). The
explanation for the concave behavior of Ψtx with Nc is similar to the provided explanation in Fig. 3.2. In
addition, the explanation for the behaviors of ΨFD,ΨHD (transmit and receive modes), and ΨFD/HD follow
those provided for the corresponding probabilities in Fig. 3.2.
The impact of Nc on the D2D coverage probability is illustrated in Fig. 3.4, where a typical receiver in
HD-only mode exhibits the highest coverage probability while a typical receiver in FD-only mode exhibits
the smallest. Accounting for the non-ideal SI cancellation circuitry further degrades the coverage probability
in FD-only mode. The coverage probability obtained under the mixed FD/HD mode lies between that of the
FD-only mode and the HD-only mode because of the following reason: The coverage probability expression
for the mixed FD/HD mode is a weighted sum of the FD-only mode and HD-only mode coverage probabilities
with respective weighting factors Ψtx and (1 − Ψtx) as presented in (3.14). From Fig. 3.3, the weighting
27

0 20 40 60 80 100
Number of users in a cluster Nc
0
0.1
0.2
0.3
0.4
0.5
0.6
0.7
0.8
0.9
1
Dev
ice
com
mu
nic
atio
n p
rob
abil
ity
rx, d2d
rx, cell
tx =
FD/HD
HD, receiver
HD, transmitter
FD
Figure 3.3: Device communication probability vs. Number of users in a cluster (M = 1000, νr = 1.5).
factor for ΨHD, receive mode (= 1−Ψtx) is always higher than that for ΨFD(= Ψtx) because over the range
of Nc considered, Ptx is strictly less than 0.5. Hence, it follows that the performance of the mixed FD/HD
coverage probability is closer to that of the HD-only mode than that of the FD-only mode. The impact of
the scattering/clustering of the devices on the performance of the cellular coverage probability is illustrated
in Fig. 3.5 where an increase in the cluster standard deviation σc decreases the cellular coverage probability
due to longer link lengths within a cluster. Moreover, the cellular coverage probability decreases with an
increase in the SINR threshold γT as seen in Fig. 3.5 because of the higher received SINR which is required
to decode received file signals.
Fig. 3.6 presents the cluster average SE plotted versus Nc for the D2D communication modes. The SE
of the FD-only mode with perfect SI cancellation is higher than that of the HD-only mode because of the
higher number of active D2D transmitters, but only up to Nc = 30 users, beyond which HD-only mode
exhibits slightly better performance. However, the SE performance of the FD-only mode with imperfect SI
cancellation is always worse than that of the HD-only mode, which implies that SI limits the performance
of the FD-only mode. The mixed FD/HD mode provides the best SE performance among the D2D commu-
nication modes because of the following reasons: First, the coverage probability of the mixed FD/HD mode
is always higher than that for the FD-only mode and closer to the HD-only mode as observed in Fig. 3.4.
Second, the average number of active transmitters of the mixed FD/HD mode is greater than that of the
HD-only mode. In Fig. 3.7, the cluster average SE for cellular receive mode is plotted versus the density of
28

0 20 40 60 80 100
Number of users in a cluster Nc
0
0.1
0.2
0.3
0.4
0.5
0.6
0.7
0.8
0.9
1
D2
D c
ov
erag
e p
rob
abil
ity
HD only mode
Mixed FD/HD mode
FD only mode, = 0
FD only mode, = 10-6
Figure 3.4: D2D coverage probability vs. Number of users in a cluster (M = 1000, γT = −6dB, νr = 1.5).
50 100 150 200
Standard deviation of cluster c
0.2
0.3
0.4
0.5
0.6
0.7
0.8
Cel
lula
r co
ver
age
pro
bab
ilit
y
T = 0 dB
T = 4 dB
T = 6 dB
T = 8 dB
Figure 3.5: Cellular coverage probability vs. Standard deviation of cluster at different SINR thresholds(M = 1000, νr = 0.8, Nc = 100, λc = 10−4m−2).
29

cluster heads λc where the average SE is observed to increase with λc which follows from (3.22). Moreover,
a larger value of Nc diminishes the SE performance because of the corresponding decrease in the average
number of transmitting cluster heads as shown in Fig. 3.3.
0 20 40 60 80 100
Number of users in a cluster Nc
0
0.1
0.2
0.3
0.4
0.5
0.6
0.7
0.8
0.9
Clu
ster
aver
age
spec
tral
eff
icie
ncy
(b
ps/
Hz)
HD only mode
Mixed FD/HD mode
FD only mode, = 0
FD only mode, = 10-6
Figure 3.6: Cluster average spectral efficiency vs. Number of users in a cluster (M = 1000, λc =10−3m−2,νr = 1.5).
Lastly, Fig. 3.8 depicts the content average download latency for both cellular and D2D communication
modes. Note that (3.23) illustrates the inverse relationship between content average download latency and
the coverage probability. Thus, FD-only mode achieves the longest latency among the D2D communication
modes while HD-only mode provides the shortest. The latency of the mixed FD/HD mode is between that
of the HD-only mode and FD-only mode because of the explanation provided for its coverage probability
performance in Fig. 3.5.
3.8 Summary
In this chapter, the performance of a HetNet, which comprises cluster heads and user devices capable
of operating in multiple communication modes, was investigated. The analytical expressions for the key
performance metrics of communication probability, coverage probability, cluster average SE, and content
average download latency were derived in terms of the system parameters. In addition, graphical results
were presented to compare the performance of user devices that operate in different communication modes.
The findings in this chapter show that the cellular communication mode is desirable when requests are
30

1 2 3 4 5 6
Density of cluster heads c (m
-2) 10
-3
1
2
3
4
5
6
7
8
Clu
ster
av
erag
e sp
ectr
al e
ffic
iency
(b
its/
s/H
z)
10-4
Cellular receive mode, Nc = 100
Cellular receive mode, Nc = 250
Cellular receive mode, Nc = 500
Figure 3.7: Cluster average spectral efficiency vs. Density of cluster heads for different cluster sizes (M =1000, νr = 1.5).
0 20 40 60 80 100
Number of users in a cluster Nc
0
0.5
1
1.5
2
2.5
3
3.5
4
Co
nte
nt
aver
age
do
wn
load
lat
ency
(se
cs)
104
Cellular mode
HD only mode
Mixed FD/HD mode
FD only mode, = 0
FD only mode, = 10-6
Figure 3.8: Content average download latency vs. Number of users in a cluster (M = 1000, γT = −6dB,νr = 1.5).
31

spread out over less popular files, while the D2D communication mode is desirable when the requests are
concentrated on a few popular files. In addition, none of the D2D communication modes can simultaneously
satisfy the design objectives of high cluster average SE and low content average download latency. The
FD-only mode was shown to achieve high cluster average SE at the cost of high content average download
latency while the HD-only mode was shown to achieve lower content average download latency compared to
the FD-only mode, but at the cost of lower cluster average SE. Finally, the mixed FD/HD mode was seen to
provide the best balance in the tradeoff between high cluster average SE and low content average download
latency in D2D-enabled HetNets.
32

Chapter 4
Spectral Efficiency and Energy
Efficiency Analyses of
Device-to-Device-Enabled Millimeter
Wave Networks 1
4.1 Introduction
This chapter discusses the performance analysis of a mmWave network comprising users that can associate
with a BS for cellular communication or neighboring users for D2D communication. The main contributions
of this chapter are outlined in the following: First, an association scheme that is characterized by a distance
threshold is proposed for activating cellular and D2D links. The proposed association scheme accounts for
the underlying system conditions, including out-of-cell interference, antenna radiation, and blockage effects.
Second, the analytical expressions for the D2D and cellular association probabilities, coverage probability
assuming noise and interference-limited scenarios, SE, and EE are derived. Finally, a goal attainment
algorithm is proposed to maximize the network area SE and EE. The goal attainment algorithm incorporates
system design parameters as optimization variables, including transmit power and bandwidth allocations to
the cellular and D2D tiers. The performance of the proposed algorithm is studied and compared with the
1The content of this chapter has generated a journal paper publication [51], O. E. Ochia and A. O. Fapojuwo, ”Energy andSpectral Efficiency Analysis for a Device-to-Device-Enabled Millimeter-Wave OFDMA Cellular Network,” in IEEE Transactionson Communications, vol. 67, no. 11, pp. 8097-8111, Nov. 2019, doi: 10.1109/TCOMM.2019.2935728.
33

performance that is achieved under a baseline scheme that is characterized by constant transmit power and
bandwidth allocations to the cellular and D2D tiers.
The demand for enhanced mobile broadband services and ultra-low latency applications in the fifth
generation and future networks has prompted studies on higher frequency bands beyond the microwave
frequency band. The mmWave frequency band, which extends from 30-300 GHz [128], is of current research
interest and existing studies on the 28GHz, 38 GHz, and 73GHz bands have revealed much promise in terms
of providing significant enhancements in the capacity of cellular networks [9, 129, 12]. D2D communication,
which has been introduced in Chapter 3, can leverage the highly directional characteristics of mmWave
links to supplement the capacity of cellular systems that operate in mmWave bands. D2D communication
schemes have also been studied, including power control, device clustering, and spectrum partitioning schemes
[15, 41, 130]. Similar studies have focused on the joint optimization of the SE and the EE performance of
D2D-enabled mmWave systems [14, 131]. In this regard, the design problem of achieving coverage probability,
SE, and EE performance objectives in a D2D-enabled mmWave cellular network, while ensuring efficient load
balancing between cellular and D2D tiers, is investigated in this chapter. Also, the system-level performance
of the proposed association scheme and the goal attainment algorithm form the other topics in this chapter.
4.2 System Model
4.2.1 Network Topology
The mmWave cellular network consists of BSs and users that are deployed in an outdoor urban environment.
The BSs are assumed to be distributed according to a homogeneous PPP Φ1 with density λ1 and the users
are assumed to be distributed according to a second independent homogeneous PPP Φ3 with density λ3
within the network area of radius rnet. The user devices in a particular cell are located within the coverage
area of a BS, which is defined by an average cell radius rc. The BS PPP Φ1 is divided into a line-of-sight
(LOS) PPP denoted by Φ1L and a non-line-of-sight (NLOS) PPP denoted by Φ1N with respect to a typical
receiver and based on blockage models that will be described in Section 4.2.3. Similarly, the user PPP Φ3
is divided into a LOS PPP denoted by Φ3L and a NLOS PPP denoted by Φ3N with respect to a typical
receiver. Fig. 4.1 illustrates the described network topology.
34
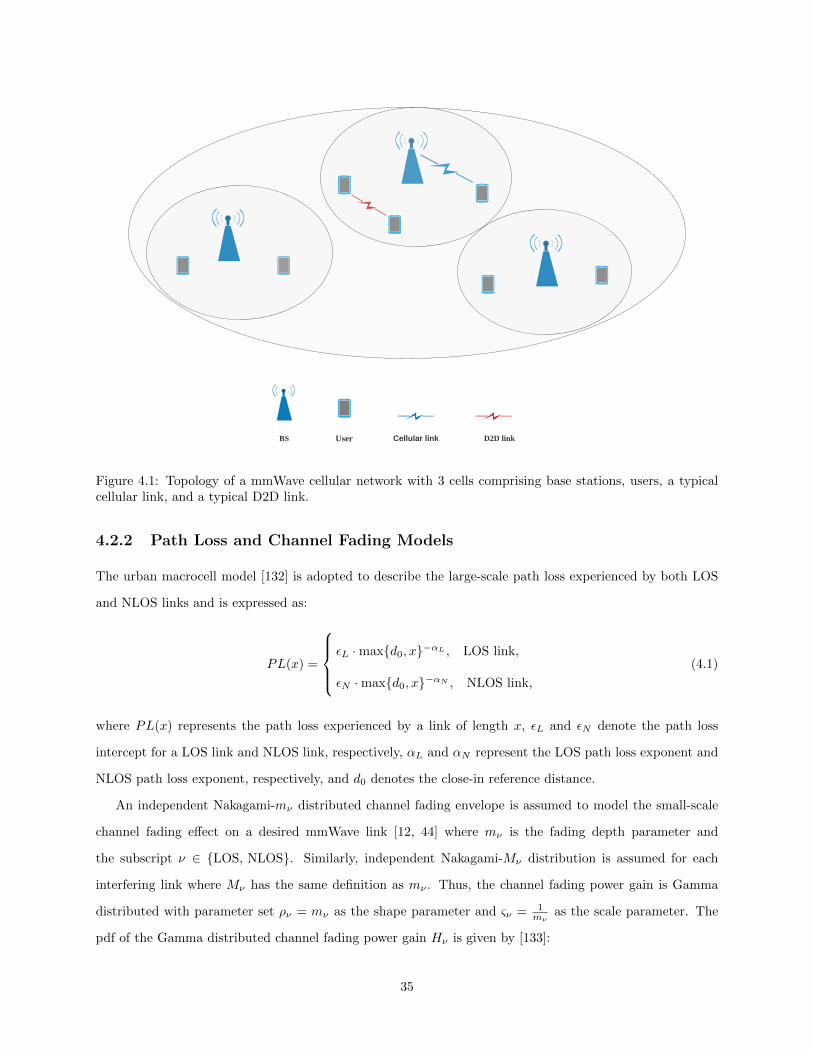
BS Cellular linkUser D2D link
Figure 4.1: Topology of a mmWave cellular network with 3 cells comprising base stations, users, a typicalcellular link, and a typical D2D link.
4.2.2 Path Loss and Channel Fading Models
The urban macrocell model [132] is adopted to describe the large-scale path loss experienced by both LOS
and NLOS links and is expressed as:
PL(x) =
εL ·maxd0, x−αL , LOS link,
εN ·maxd0, x−αN , NLOS link,
(4.1)
where PL(x) represents the path loss experienced by a link of length x, εL and εN denote the path loss
intercept for a LOS link and NLOS link, respectively, αL and αN represent the LOS path loss exponent and
NLOS path loss exponent, respectively, and d0 denotes the close-in reference distance.
An independent Nakagami-mν distributed channel fading envelope is assumed to model the small-scale
channel fading effect on a desired mmWave link [12, 44] where mν is the fading depth parameter and
the subscript ν ∈ LOS, NLOS. Similarly, independent Nakagami-Mν distribution is assumed for each
interfering link where Mν has the same definition as mν . Thus, the channel fading power gain is Gamma
distributed with parameter set ρν = mν as the shape parameter and ςν = 1mν
as the scale parameter. The
pdf of the Gamma distributed channel fading power gain Hν is given by [133]:
35

fHν (hν ; ρν , ςν) =ς−ρνν hρν−1
ν e−hνςν
Γ(ρν), hν > 0, ςν > 0, ςν > 0. (4.2)
Similar pdf of the channel fading power gain for each interfering link can be written.
4.2.3 Blockage Models and Antenna Array Pattern
The rectangular Boolean model [11, 43, 134, 135, 136], defined as blockage model-A, and the generalized LOS
ball model [12, 44, 137], defined as blockage model-B, are adopted to model the probability that a link of
length x is either LOS or NLOS with respect to a target receiver. The expression for the LOS probability
under blockage model-A is:
PL(x) = e−xC , (4.3)
where PL(x) is the probability that a link of length x is LOS and C is a constant parameter defined as the
average LOS range of the network which depends on the deployment environment [11, 43]. The expression
for the LOS probability under blockage model-B is:
PL(x) = pL1(x < RL), (4.4)
where PL(x) is the probability that a link of length x is LOS, RL is LOS range, pL ∈ [0, 1] is the LOS
probability given that x < RL [137], and 1(.) is the indicator function. The NLOS probability of a link of
length x is given by PN (x) = 1− PL(x) under the blockage models.
The radiation pattern of an antenna array is characterized by using the uniform linear array model and is
approximated by a sectored antenna model for analytical tractability [138, 139]. Under the sectored antenna
model, the array gain of a node type k ∈ BS,user is described as follows: The angles in the main lobe beam
are assumed to have a constant array gain Zk and the angles in the side lobe beams are assumed to have a
different constant array gain ζk where ζk < Zk. Moreover, a typical transmitter-receiver link is assumed to
perform perfect beam alignment to achieve a maximum array gain Go. In contrast, an interfering link has a
random array gain Gi, which is modeled as a discrete random variable [12]. The expressions for Go and Gi
are given in (4.5) and (4.6), respectively as:
Go = Z1Z3, (4.5)
36

Gi =
φi,1 = Z1Z3 w.p. ξ1 =(θ12π
)(θ32π
),
φi,2 = ζ1Z3 w.p. ξ2 =(
2π−θ12π
)(θ32π
),
φ1,3 = Z1ζ2 w.p. ξ3 =(θ12π
),(
2π−θ32π
),
φ1,4 = ζ1ζ2 w.p. ξ4 =(
2π−θ12π
)(2π−θ3
2π
),
(4.6)
where θk is the main lobe signal beamwidth of node type k, and φi,u is the sample value of Gi at combination
u occurring with probability ξu, where u ∈ [1, 4].
4.3 Association Schemes and Resource Allocation
4.3.1 Distance Threshold-Based and Interference-Aware Association
A typical user can associate with a BS for cellular communication or a neighboring user for D2D commu-
nication according to the following protocol: A D2D link can be established between a transmitter-receiver
pair of users if there exists at least one user located inside a ball of radius rd that is centered at a receiving
user’s location and LOS with respect to the receiving user. Further, a user is randomly selected out of the
LOS users inside the ball as the D2D transmitter for establishing a D2D link. On the other hand, if no LOS
user exists inside the ball of radius rd, a LOS BS that is located inside the annular region bounded by rd and
the average cell radius rc is randomly selected as the transmitting BS. Based on the described association
protocol, the pdfs of the lengths of a cellular link and a D2D link are:
fX(x) =
2xπr2d
[2 arccos
(x
2rd
)− x√
(4r2d−x2)
2r2d
], 0 ≤ x ≤ 2rd
0, otherwise,
(4.7)
gX(x) =
2xπr2c
[2 arccos
(x
2rc
)− x√
(4r2c−x2)
2r2c
], rd ≤ x ≤ 2rc
0, otherwise,
(4.8)
where fX(x) represents the pdf of a D2D link of random length X and sample value x, The expression on
the right hand side of (4.7) arises from considering the pdf of the distance between two random points that
are uniformly distributed inside a circle according to the results in Section 2.3.5 and 2.3.6 of [140]. On the
other hand, gX(x) represents the pdf of a cellular link of random length X and sample value x, while the
expression on the right hand side of (4.8) is obtained similar to (4.7), except that the annular region bounded
37

by [rd, rc] is considered.
The probability that the typical user associates to a BS or D2D transmitter is given respectively as:
Ψc = e−2πλ3
rd∫0
xPL(x) dx×(
1− e−2πλ1
rc∫rd
xPL(x) dx), (4.9)
Ψd = 1− e−2πλ3
rd∫0
xPL(x) dx, (4.10)
where Ψc is the cellular association probability and the expression on the right hand side of (4.9) is obtained
by considering the independent events that there is no LOS user inside the ball of radius rd that is centered
at the receiving user, and there is at least one LOS BS inside the annular region bounded by [rd, rc].
Additionally, Ψd follows from considering the event that there is at least one LOS user inside the ball of
radius rd centered at the receiving user.
A D2D overlay spectrum sharing strategy is adopted to mitigate inter-tier interference. The system
bandwidth W is divided into the cellular bandwidth Wc and the D2D bandwidth Wd, and orthogonal
frequency division multiple access (OFDMA) is used to allocate resource blocks (RBs) to active cellular/D2D
links in a cell. A frequency reuse factor of unity is assumed across all cells such that cellular and D2D
transmissions in a target cell experience interference from corresponding transmissions in other cells outside
the target cell, i.e., out-of-cell interference.
The selection of rd is based on a link-level quality of service objective where rd is calculated by fixing the
minimum SINR threshold γ for successful reception of transmitted signals. Additionally, considering that
interference is the main constraint that impacts mmWave networks [43], the mean interference from D2D
transmissions in neighboring cells is taken into account and rd is derived such that the received SINR at
a D2D receiver due to transmissions from a D2D transmitter is equal to γ. Small-scale fading effects are
ignored by means of temporal averaging and the expression for the D2D average received SINR is given by:
Γd =P3r−αLd Z2
3
N0 + Idd, (4.11)
where P3 is the user transmit power, Idd is the mean interference from D2D transmissions outside the target
cell, and N0 is the thermal noise power. Setting Γd to γ and solving for rd gives:
rd =[ γ
P3Z23
(Idd +N0
)]− 1αL . (4.12)
The expression for Idd under the blockage model-A and the ULA pattern is given in (4.13), where Γ(a, z) ,
38
∫∞zxa−1e−x dx is the upper incomplete Gamma function. Similarly, Idd under the blockage model-B is given
in (4.14).
Idd =2πλ3P3
4∑u=1
ξuφi,u
(F1(rnet, do, C, αL) + F2(rnet, do, C, αN )
), (4.13a)
F1(rnet, d0, C, αL) =CεLdo−αLe−
doC
[C(edoC − 1
)− do +
( 1
C
)αL−1
dαLo edoC
× Γ(
2− αL,doC
)−( 1
C
)αL−1
doαLe
doC × Γ
(2− αL,
rnetC
)], (4.13b)
F2(rnet, d0, C, αN ) =(−1)1−αN εN (−rnet)−αN(r2net − 2
(− 1
C
)αNC2(−rnet)αNΓ
(2− αN
)+(− 1
C
)αNC2(− rnet
)αNαNΓ
(2− αN
)+ 2(− 1
C
)αNC2(−rnet)αN
× αNΓ(2− αN
)+ 2(− 1
C
)αNC2(−rnet)αNΓ
(2− αN ,
rnetC
)−(− 1
C
)αNαNΓ
(2− αN ,
rnetC
))− rαNnet
(r2net − 2
( 1
C
)−2+αNrαNnetΓ(2− αN )
+( 1
C
)−2+αNrαNnetαNΓ(2− αN ) + 2
( 1
C
)αN−2
rαNnetΓ(
2− αN ,rnetC
)−( 1
C
)−2+αNrαNnetαNΓ
(2− αN ,
rnetC
)), (4.13c)
Idd =πλ3P3
4∑u=1
ξuφi,u
(F3(do, αL, RL) + F4(do, αN , rnet)
), (4.14a)
F3(do, αL, RL) =εLd−αLo R−αLL pL
(d2oR
αLL αL − 2dαLo R2
L
)(αL − 2)
, (4.14b)
F4(do, αN , rnet) =εNd
−αNo
(rnetdo
)αN(1− pL)
(d2o(dornet)
αNαN + 2do2+αN rαNnet − 2d2αN
o r2net
)(αN − 2)
. (4.14c)
Proofs of (4.13) and (4.14). See Appendix B.1
The justification for adopting the proposed distance threshold-based and interference-aware association
scheme is three-fold: First, the LOS association protocol ensures that a user receives stronger LOS signals
compared to the weaker NLOS signals. Second, the random transmitter selection relaxes the requirement
for associating to the transmitter that gives the minimum path loss and/or the maximum average received
power, allowing for the establishment of links that can support low and medium-rate applications. Third, the
calculation of the distance threshold rd accounts for path loss, blockage effects, antenna radiation pattern, and
39

interference which are constraints that can impact link quality. The proposed association scheme promises
a reduction in the likelihood of occurrence of outage events because the determination of rd is not arbitrary,
rather its determination is based on the system parameters. However, the proposed association scheme
introduces signaling overhead, including the knowledge of the transmitter density which must be retrieved
via a centralized or distributed network control mechanism. In a quasi-static network, rd only needs to be
determined during a session establishment. In contrast, a dynamic network with user mobility will require
more signaling resources because of the time and location-dependent fluctuation of the received signal quality
at a mobile user.
4.3.2 Orthogonal Resource Allocation and Performance Tradeoffs
A transmitter can access the system bandwidth W , which is divided between the cellular and D2D tiers as
noted in Section 4.3.1. Under the OFDMA scheme, orthogonal RBs are reserved for scheduled users within
a cell and the RBs are reused across the cells. A typical user associates with a unique transmitter under
the minimum path loss (Min PL)-based and maximum biased received power (Max BRP)-based association
schemes (the state of the art) because at most one transmitter in a cell will meet the requirements for
association. The probability of resource collision under the state-of-the-art schemes is low because each
scheduled user will be served by a single transmitter. On the other hand, the proposed association scheme
discussed in Section 4.3.1 will experience a higher number of resource collisions because a typical user
can associate with more than one LOS transmitter, which is unknown a priori. Hence, a high number of
potentially active transmitters would give rise to a high probability of resource collision.
The resource collision problem could be resolved by an orthogonal allocation of RBs to users in a cell.
The overhead cost of resolving the collisions in a tier of node type k (BS or D2D) depends on Lk, the load per
cell in a tier of node type k. Following the definitions in [66, 141], Lk = 1+1.28λjΨl
λk, where j = 2, k = 1, l = c
for the cellular tier and j = 2, k = 3, l = d for the D2D tier. Now, to guarantee collision-free transmissions
under the proposed association scheme, at least dLke orthogonal RBs should be reserved for the users in a
cell 2. The loss in performance of the proposed association scheme compared to the state-of-the-art schemes
is O( 1dLke ) and would impact the achievable average rate.
2dxe is the ceiling function of a real number x, defined as the smallest integer that is greater than or equal to x.
40

4.4 Coverage Probability Analysis
4.4.1 Coverage Probability under a General Network Model
Assuming that the typical user is located at the origin o, the expressions for the SINR coverage probability
in the cellular and D2D tiers are given by:
Γc(r) =P1Gohl,oPL(r)
Icc +No, (4.15a)
Γd(r) =P3Gohl,oPL(r)
Idd +No, (4.15b)
where
Icc =∑
u∈Φ1L\bs(o)
P1Gi,uhl,uPL(y) +∑
m∈Φ1N
P1Gi,uhl,uPL(y) (4.16a)
and
Idd =∑
p∈Φ2L\user(o)
P3Gi,phl,pPL(y′) +∑q∈Φ2N
P3Gi,qhn,qPL(z′). (4.16b)
P1 and P3 denote the BS transmit power and user transmit power, respectively, Icc and Idd denote the
intra-cellular tier interference (i.e., when the typical user associates to a LOS BS) and the intra-D2D tier
interference (i.e., when the typical user associates to a D2D transmitter), respectively, and the interference
powers are divided into LOS and NLOS components. Further, the notations y and z represent the link
lengths for LOS and NLOS interferers, respectively. The corresponding link lengths in the D2D association
mode are denoted by y′ and z′, respectively. The terms Go and Gi,. denote the array gains for a target and
interfering link, respectively, while hl and hn are the channel fading power gains for a LOS and NLOS link,
respectively.
The SINR coverage probability under δ- association mode (δ ∈ c = cellular, d = D2D) is the probabil-
ity that the received SINR at a typical user exceeds the threshold γ for successful reception, and is expressed
as:
Υcov,δ(γ) = Pr(
Γδ(o) > γ). (4.17)
The SINR coverage probability is derived by conditioning on the length of a target link and taking the mean
over its pdf. Starting with cellular association mode,
41

Υcov,c(γ) =
∞∫rd
Pr(
Γc(o) > γ∣∣ x)gX(x) dx
=
∞∫rd
mL−1∑j=0
1
j!
( γxαL
P1Go,c
)j j∑q=0
(j
q
)EIcc
[Iqcc
]N j−qo LIcc(s)
∣∣∣s= γxαL
P1Go,c
e− γx
αLNoP1Go,c gX(x) dx, (4.18)
where Go,c is the array gain for the target link in cellular association mode and LIcc(s), the Laplace transform
of Icc in cellular association mode, is derived using the tools of stochastic geometry as:
LIcc(s) =LIcc,L(s)× LIcc,N (s)
=(2πλ1
)2 4∏u=1
ξu exp
(−∞∫rd
ML∑j=1
(ML
j
) (sP1φi,uεLσLx
−αL)j(
sP1φi,uεLσLx−αL + 1)ML
)xPL(x) dx
×4∏
u=1
ξu exp
(−∞∫rd
MN∑j=1
(MN
j
) (sP1φi,uεNσNx
−αN)j(
sP1φi,uεNσNx−αN + 1)MN
)xPN (x) dx, (4.19)
where σL = 1ML
, σN = 1MN
, and EIcc[Icc
]qin (4.18) is the qth moment of Icc, which is calculated by:
EIcc[Icc
]q= (−1)q
dqLIcc(s)dsq
∣∣∣s=0
.
Proof of (4.18) and (4.19) . See Appendix B.2 and Appendix B.3, respectively.
Eqns. (4.18) and (4.19) represent the derivation of the coverage probability expression under a general
network setting with arbitrary fading and path loss. The coverage probability analysis under Nakagami-m
fading considering special path loss laws, a noise-limited network, and an interference limited network is
presented next.
4.4.2 Special Case I: Noise-Limited Network with Nakagami-m Fading
Assume Nakagami-m fading with LOS shape parameter ML = 3 and NLOS shape parameter MN = 2. In
addition, consider a typical path loss law with a LOS exponent αL = 2.5 and a NLOS exponent αN = 4. The
expression for the coverage probability for a noise-limited network is obtained by setting LIcc(s) in (4.18) to
unity. Further, setting ML = 3, αL = 2.5, αN = 4, and expanding the resulting expression gives:
42

Υcov,c(γ) =
rnet∫rd
exp(−K
(γ, x, SNR
))(1 +K
(γ, x, SNR
)+
1
2K2(γ, x, SNR
))gX(x) dx
≈ 1− 1
2
rnet∫rd
K2(γ, x, SNR)gX(x) dx, (4.20)
where K(γ, x, SNR
)= 3 γx2.5
Go,cSNRand SNR denotes the signal-to-noise-ratio.
Remark. The value of the integrand in (4.20) depends on K(γ, x, SNR) which is a non-decreasing function
of SNR. Thus, a high received SNR guarantees a high coverage probability for a noise-limited network.
4.4.3 Special Case II: Interference-Limited Network with Nakagami-m Fading
Consider an interference-limited network with Nakagami-m fading shape parameters ML = 3,MN = 2, and
path loss exponents αL = 2, aN = 4. To obtain the expression under an interference-limited scenario, set
No in (4.18) to zero. The resulting expression is an integral of a second order differential equation that is
parameterized by the Laplace transform of the LOS and NLOS terms. Hence,
Υcov,c(γ) =
rnet∫rd
2∑j=0
1
j!EIcc
[( γx2IccP1Go,cεL
)jexp
(− γx2IccP1Go,cεL
)]gX(x) dx
(a)=
rnet∫rd
2∑j=0
1
j!(−1)j
djLIcc(s)dsj
gX(x) dx
(b)=
rnet∫rd
(1
2L′′
Icc(s)− L′
Icc(s) + LIcc(s))gX(x) dx, (4.21)
where the result in (a) follows from applying the relation in [142]: E[xj exp(−x)
], (−1)j djLX(x)
dsj
∣∣∣s=1
and
(b) follows from expanding the result in (a). L′Icc(s) and L′′Icc(s) denote the first and second order derivatives
of the Laplace transform of the interference, respectively. Lastly, the derived coverage probability expression
in (4.21) can be computed by using numerical integration techniques.
43

4.5 Joint Optimization of Spectral Efficiency and Energy Effi-
ciency
4.5.1 Analysis of Average Rate, Spectral Efficiency, and Energy Efficiency
The per-user rate for cellular association mode, per-user rate for D2D association mode, and the per-user
average rate, denoted by Rc,Rd, and R, respectively, are given as:
Rc =Wc
Nc
(Υcov,c(γ)× log2(1 + γ)
), (4.22a)
Rd =Wd
Nd
(Υcov,d(γ)× log2(1 + γ)
), (4.22b)
R = ΨcRc + ΨdRd, (4.22c)
where Nc and Nd symbolize the number of active users in cellular and D2D association modes, respectively.
The area SE is defined as the rate per unit bandwidth per unit area in bits/s/Hz/km2. The expressions
for the cellular SE, D2D SE, and area SE are:
Sc =λ1Υcov,c(γ) log2(1 + γ), (4.23a)
Sd =λ3Υcov,d(γ) log2(1 + γ), (4.23b)
S =ΨcSc + ΨdSd, (4.23c)
where Sc is the area SE for a user that is in cellular association mode, Sd is the area SE for a user that is
in D2D association mode, and S is the network area SE.
Similarly, the EE is the amount of data bits transmitted per unit energy consumption in bits/J. The
corresponding expressions for the EE are given as:
Ec =Sc
λ1(Ω + P1), (4.24a)
Ed =Sd
λ3(Ω + P3),
E =S
λ1(Ω + P1) + λ3(Ω + P3), (4.24b)
where Ec is the EE for users in cellular association mode, Ed is the EE for users in D2D association mode, E
is the network EE, and Ω is the power consumption in the baseband and radio frequency circuitry, excluding
the power amplifier. In the following section, the network area SE and network EE are coupled into a joint
44

optimization problem. For the problem formulation, the BS and user transmit powers are assumed to be
variables and P1, P3 >> Ω.
4.5.2 Problem Formulation for Spectral Efficiency and Energy Efficiency Opti-
mization
This section considers several design issues in the problem formulation for the SE and EE, including: (i)
the determination of the optimum transmit power for a BS and a D2D transmitter under the assumption
of full network load, and (ii) the determination of the optimum bandwidth fraction to allocate to scheduled
cellular and D2D links. The rate coverage probability metric is adopted as the SE-EE coupling constraint
and is defined by Pr(R > τ) ≥ ηobj , where ηobj is a specified rate coverage probability objective. Let
Pc = P1,iNci=1 denote the set of transmit powers of the LOS BSs that are designated to transmit to
scheduled users in cellular association mode. Similarly, let Pd = P2,jNdj=1 denote the set of transmit powers
of the LOS D2D transmitters that are designated to transmit to the scheduled users in D2D association mode.
The maximum array gain Go is assumed on all desired links and an OFDMA scheme is assumed where each
active link is allocated with a single RB. In addition, the system bandwidth W is divided between the cellular
and D2D tiers such that a fraction κ is reserved for the cellular tier and (1− κ) is reserved for the D2D tier.
Thus, the network area SE can be expressed as:
S(κ,Pc,Pd) = κΨcSc + (1− κ)ΨdSd. (4.25)
Combining (4.22a)-(4.25) with the rate coverage constraint, a multi-objective optimization problem
(MOOP) is formulated as:
maxκ,Pc,Pd
S(κ,Pc,Pd), E(κ,Pc,Pd), (4.26a)
s.t. Pr(R > τ) ≥ ηobj , 0 < κ < 1, P1,min ≤ P1,i ≤ P1,max,
∀P1,i ∈ Pc, P2,min ≤ P2,j ≤ P2,max, ∀P2,j ∈ Pd, (4.26b)
where P1,min and P1,max are the minimum and maximum BS transmit powers, respectively, P2,min and
P2,max are the minimum and maximum user transmit powers, respectively, R is parameterized by the
minimum SINR coverage threshold γ expressed in (4.22a). The MOOP in (4.26a) is reformulated as a single
objective optimization problem (SOOP) using the weighted-Tchebycheff method [143] as follows:
45
maxκ,Pc,Pd
ωS(κ,Pc,Pd)− β(1− ω)E(κ,Pc,Pd), (4.27a)
s.t. Pr(R > τ) ≥ ηobj , 0 < κ < 1, P1,min ≤ P1,i ≤ P1,max,
∀P1,i ∈ Pc, P2,min ≤ P2,j ≤ P2,max, ∀P2,j ∈ Pd, (4.27b)
where ω is a specified weight objective and β is a conversion factor that is applied in (4.26a) to ensure
consistency in the units of SE and EE. Next, (4.24a) is substituted into the coupled objective function in
(4.27a) to obtain a transformed objective function ST :
ST =AcΨcSc +AdΨdSd, (4.28a)
Ac = κ(ω − β(ω − β)
PN
), (4.28b)
Ad = (1− κ)(ω − β(ω − 1)
PN
), (4.28c)
where PN =∑Nci=1 P1,i +
∑Ndj=1 P2,j is the total power consumption in the network. In addition, Ac and
Ad can be interpreted as the transformed bandwidth fraction allocations to the cellular tier and D2D tier,
respectively, constrained by the decision variables, i.e., κ,Pc,Pd. Moreover, the transformed bandwidth
constraint can be written as 0 < Ac,Ad < 1 and the power constraints can be written as NcP1,min +
NdP3,min < PN < NcP1,max +NdP3,max . The transformed problem of (4.28) is shown to be non-convex by
applying Jensen’s inequality [144] and the proof of its non-convexity is provided in Appendix B.4. A goal
attainment algorithm for solving (4.28) and the selection of ω is discussed next.
4.5.3 A Goal Attainment Algorithm for Spectral Efficiency and Energy Effi-
ciency Optimization
In design problems for systems that comprise many design variables, a targeted performance goal is set and
several possible solutions that meet the performance goal are tested within tolerance ranges. This approach
is necessary because it is impossible to satisfy multiple competing objectives simultaneously due to the finite
system resources. Hence, the goal attainment method described in [143] is adopted to solve the SE-EE
SOOP. The goal attainment method provides a linear formulation for MOOPs and aims to find the vector
of decision variables that minimizes the maximum of the scaled deviation of a set of objectives from a set of
desired goals [143].
46

Starting from (4.25), (4.27), and (4.28) and applying the goal attainment method, the SOOP becomes
minκ,Pc,Pd
( S∗ − ST (κ,Pc,Pd)
ω
), (4.29a)
s.t. Pr(R > τ) ≥ ηobj , 0 < Ac,Ad < 1,
NcP1,min +NdP3,min < PN < NcP1,max +NdP3,max, (4.29b)
where S∗ is a specified network SE goal. The selection of ω measures the relative tradeoff between the
objective performance in the cellular tier and the D2D tier [145]. For example, if ω is set to 1, (4.29b) becomes
an unscaled goal attainment problem i.e., minκ,Pc,Pd
(S∗ − ST
(κ,Pc,Pd
)), where Ac = κ
(1− β(1−β)
PN
)and
Ad = (1 − κ). In this case, Ad is independent of ω and the goal attainment is skewed towards optimizing
the performance objective in the cellular tier. An iterative algorithm for implementing (4.29) is proposed in
Algorithm 4.1.
The decision and non-decision variables of the SOOP are initialized in Lines 1 and 2 of Algorithm 4.1,
respectively. Lines 3-6 allocate the transmit powers to the active BS and D2D transmitters with %1 and %2
denoting small values for updating the BS transmit power and D2D transmit power, respectively at each
iteration index of the outer while loop. The BS and D2D transmit power allocations are stored in Line 7 and
the allocated bandwidth fraction to the cellular tier is incremented, while the value of the objective function
is computed in Lines 8 and 9. Lines 10-12 determine whether or not the rate coverage and bandwidth
constraints of the SOOP are satisfied and the computed value of the objective function is saved in Line 13.
Lines 14-20 examine the behavior of the discretized Jacobian matrix and, depending on which condition is
met, the values of the objective function, the decision, and the non-decision variables are saved in Line 23.
The algorithm terminates at Line 25.
The proposed Algorithm 4.1 has polynomial asymptotic complexity because its search space comprises
the power allocation vectors for the BS and D2D transmitters over the maximum number of iterations in
order to determine the values of a decision variable and the objective function based on the rate coverage
constraint. Thus, the complexity is O(χ ×max(Nc,Nd) ×maxITER) where χ is the number of decision
variables.
4.6 Evaluation Methodology and Discussion of Numerical Results
The performance of the main system metrics, including coverage probability, SE, and EE is discussed and
compared under the proposed association scheme and the state of the art, considering the assumed system
47

Algorithm 4.1: Proposed SE-EE Goal Attainment Algorithm
Input: P1,min, P1,max, P3,min, P3,max, Nc, Nd, S∗, β, γ, τ , ω, ηobj , maxITER.Output: SoptT , Pc,opt, Pd,opt, κopt.
1: Initialize: Pc = ones(1,Nc)× P1,min, Pd = ones(1,Nd)× P3,min.2: Initialize: O = zeros(1,maxITER), %1 = 0.1, %2 = 0.1, n= 1, κ = 0.1.3: while n < maxITER do4: for j = 1 to max(Nc,Nd) do5: Increment the BS and D2D transmit powers: P1j,n = P1j,n−1 + %1, P2j,n = P2j,n−1 + %2.6: end for7: Update the BS and D2D transmit power allocations at index n in the transmit power vectors Pc and
Pd, respectively and increment the BS bandwidth i.e., κn = κn−1 + %1.8: Compute Pcov,c(γ) and Pcov,d(γ).9: Compute Pr(R > τ), Ac, Ad, and ST (κn,P
c,Pd) using (4.28). Compute the objective functionvalue On using (4.29).
10: if Pr(R > τ) < ηobj ‖ Ac,Ad /∈ (0, 1) then11: Discard On.12: end if13: Save On in O.14: Compute the discretized Jacobian matrix J = [∆O
∆k ,∆OPcn
, ∆OPdn
].
15: if det(J) < 0 then16: Go to Line 21.17: end if18: if det(J) ≥ 0 then19: Go to Line 22.20: end if21: Increment n by 1. Repeat Lines 1 to 15.22: if n == maxITER then23: Oopt = min(O), SoptT = ST (κ,Pc,Pd), Pc,opt = Pc, Pd,opt = Pd, κopt = κ at the index of Oopt. Go
to Line 25.24: end if25: end while
48

parameters. Additionally, the joint SE-EE performance under the proposed goal attainment scheme is
compared with a baseline scheme where BSs are assumed to transmit with equal transmit power and D2D
transmitters transmit with equal transmit power different than the BS transmit power.
The values of the system performance metrics are computed based on their corresponding expressions
and using numerical algorithms in Mathematica. Besides, Algorithm 4.1 is executed by calling user-defined
functions within a MATLAB script. The assumed values of the system parameters are listed in Table 4.1.
Table 4.1: Values of System Parameters
Notations Definition Assumed Values
P1,max, P1,min,P3,max, P3,min,f,W
Maximum BS transmit power, minimum BStransmit power, maximum user transmitpower, minimum user transmit power, carrierfrequency, system bandwidth
46 dBm, 43 dBm, 20 dBm, 17dBm, 28 GHz, 1 GHz [15, 66]
κ, αL, αN , εL, εN ,C, RL, pL
Cellular bandwidth fraction, LOS path lossexponent, NLOS path loss exponent, LOSpath loss intercept, NLOS path loss intercept,LOS range under blockage model-A, LOSrange under blockage model-B, LOS probabil-ity under blockage model-B
0.5, 2.0, 4, 1102.8f2 , 1
103.24f2 , 141.4
m, 200 m, 1 [132, 43, 12, 137, 41]
Go,c, Go,d, N0
Array gain for a target link in cellular associa-tion mode, array gain for a target link in D2Dassociation mode, thermal noise power
20 dB, 0 dB, −174dBm/Hz +10 log10W [43, 15]
Figs. 4.2a and 4.2b show the plots of the cellular association probability vs. the average cell radius and
the D2D association probability vs. the average cell radius, respectively, assuming blockage model-A. The
average cell radius rcell , 1√πλ1
[12, 43] is such that a sparse network results in a large inter-site distance,
and vice-versa. In addition, the proposed association scheme is compared with the state-of-the-art Min
PL-based and Max BRP-based association schemes [15, 39, 43]. The Max BRP-based association scheme
includes a biasing factor T ∈ [0,∞) with T = 0 indicating no D2D association and T → ∞ indicating no
cellular association [15, 66]. When T = 1, the Max BRP-based scheme reduces to the Max RP-based scheme
under which a user can connect to a BS or a neighboring user that offers the strongest average received
power [42]. The cellular association probability is monotonically decreasing with rc under the proposed and
state-of-the-art association schemes because a sparse network reduces the probability that a BS is LOS with
respect to a user. Moreover, the cellular association probability under the proposed scheme matches the
Min PL-based scheme and the Max BRP-based scheme at low T (for example, T = 0.01 implies that users
are biased to associate to BSs). The close match among the schemes is because a random LOS BS will
likely incur a small path loss or provide a high received power at a receiver. In contrast, when T is set to
a high value (for example, T = 100), the D2D association probability under the Max BRP-based scheme is
the highest among the association schemes because of its strong bias towards D2D association. The D2D
49

association probability is monotonically increasing with rc because of the increased likelihood of users to
associate with neighboring users in close range compared to BSs that are more distant.
50 100 150 200
Average cell radius in m
0.3
0.4
0.5
0.6
0.7
0.8
0.9
1
Cel
lula
r A
sso
ciat
ion P
rob
abil
ity
Proposed
Min PL
Max BRP, T = 100
Max BRP, T = 0.01
(a) Cellular association probability vs. average cell radius.
50 100 150 200
Average cell radius in m
0
0.1
0.2
0.3
0.4
0.5
0.6
0.7
D2D
Ass
oci
atio
n P
rob
abil
ity
Proposed
Min PL
Max BRP, T = 100
Max BRP, T = 0.01
(b) D2D association probability vs. average cell radius.
Figure 4.2: Cellular and D2D association probabilities vs. average cell radius under blockage model-A wherernet = 1km and λ3 = 100 users/km2 (BS = base station, D2D = device-to-device, Min PL = minimum pathloss, Max BRP = maximum biased received power).
50

Figs. 5.9 and 4.4 illustrate the comparison between blockage model-A and blockage model-B where
it is observed that blockage model-A achieves a higher D2D association probability because it achieves a
higher value of the D2D distance threshold rd at each value of rc, hence, permits a wider D2D coverage
area. The converse is true for cellular association probability, which is higher under blockage model-B. The
aforementioned observations confirm the intuition that the cellular deployment environment impacts the
association mode. An urban environment with a large number of potential blockers (modeled by blockage
model-B) reduces the likelihood of D2D association, whereas a rural and suburban environment with a small
number of potential blockers (modeled by blockage model-A) favors D2D association.
The variation of the SNR coverage probability with the SNR coverage threshold is presented in Figs.
4.5a and 4.5b. There are two notable points regarding the behavior of the proposed association scheme in a
noise-limited network. First, the parameter rd is defined by the out-of-cell interference and, hence, has no
impact in a noise-limited network. Second, the lower limit of the integral term in (4.20) is zero because a
link length in cellular association mode can assume any real positive value. Fig. 4.5a shows that the SNR
coverage probability of the proposed scheme under blockage model-A (the overlapping blue and red curves)
is higher than the Min PL-based scheme and the Max BRP-based scheme at T = 0.01 when the typical user
is associated to a BS and when the SNR threshold is high (SNR > 15 dB) because of the non-existence of
a constraint on the link length. Moreover, at T = 100, the Max BRP-based scheme achieves the highest
SNR coverage probability because the number of users in cellular association mode is the least among all
the schemes. However, the proposed scheme gives the worst D2D coverage probability under the severe
blocking conditions of blockage model-B because it achieves the least received power and, consequently, the
least SNR.
In Figs. 4.6a and 4.6b, the performance of the SIR coverage probability in an interference-limited network
is illustrated for cellular and D2D association modes, respectively. The proposed association scheme under
the cellular association mode is upper bounded by the Max BRP-based scheme at T = 0.01 and lower
bounded by the Max BRP-based scheme at T = 100 because user association to BSs is favored at a low
value of T , whereas D2D association is favored at a high value of T . Moreover, the proposed scheme is
sub-optimal at a low SIR threshold (SIR < 20 dB) and the state-of-the-art schemes achieve up to 60%
higher SIR coverage probability. Fig. 4.6b shows that the proposed scheme achieves the best performance
under blockage model-A in D2D association mode, while it achieves the least performance under blockage
model-B.
The performance of the coverage probability, area SE, and EE at 25 dB SINR threshold is studied
under varying BS densities and presented in Figs. 4.7 and 4.8. The proposed scheme achieves the highest
coverage probability in both cellular and D2D association modes because it exploits the high availability
51

50 100 150 200
Average cell radius in m
0.6
0.65
0.7
0.75
0.8
0.85
0.9
0.95
1
Cel
lula
r A
sso
ciat
ion
Pro
bab
ilit
y
Proposed
Min PL
Max BRP, T = 100
Max BRP, T = 0.01
(a) Cellular association probability vs. average cell radius.
50 100 150 200
Average cell radius in m
0
0.05
0.1
0.15
0.2
0.25
0.3
0.35
0.4
D2D
Ass
oci
atio
n P
rob
abil
ity
Proposed
Min PL
Max BRP, T = 100
Max BRP, T = 0.01
(b) D2D association probability vs. average cell radius.
Figure 4.3: Cellular and D2D association probabilities vs. average cell radius under blockage model-B.
52

50 100 150 200
Average cell radius in m
0
0.1
0.2
0.3
0.4
0.5
0.6
0.7
0.8
0.9
1
Ass
oci
atio
n p
rob
abil
ity Cellular association, blockage model-A
Cellular association, blockage model-B
D2D association, blockage model-A
D2D association, blockage model-B
(a) Association probability vs. average cell radius.
50 100 150 200
Average cell radius in m
3
4
5
6
7
8
9
10
11
12
13
D2
D D
ista
nce
th
resh
old
in
m
Blockage model-A (proposed)
Blockage model-B (proposed)
(b) D2D distance threshold vs. average cell radius.
Figure 4.4: Association probability and D2D distance threshold vs. average cell radius for the proposedassociation scheme and under the blockage models.
53

0 5 10 15 20 25 30
SNR Threshold in dB
0.4
0.5
0.6
0.7
0.8
0.9
1
SN
R C
over
age
Pro
bab
ilit
y
Blockage model-A (proposed)
Blockage model-A (Min PL)
Blockage model-A (Max BRP, T = 0.01)
Blockage model-A (Max-BRP, T = 100)
Blockage model-B (proposed)
Blockage model-B (Min PL)
Blockage model-B (Max BRP, T = 0.01)
Blockage model-B (Max BRP, T = 100)
(a) Cellular association mode.
0 5 10 15 20 25 30
SNR Threshold in dB
0.1
0.2
0.3
0.4
0.5
0.6
0.7
0.8
0.9
1
SN
R C
ov
erag
e P
rob
abil
ity
Blockage model-A (proposed)
Blockage model-A (Min PL)
Blockage model-A (Max BRP, T = 0.01)
Blockage model-A (Max-BRP, T = 100)
Blockage model-B (proposed)
Blockage model-B (Min PL)
Blockage model-B (Max BRP, T = 0.01)
Blockage model-B (Max BRP, T = 100)
(b) D2D association mode.
Figure 4.5: SNR coverage probability vs. SNR threshold for BS and D2D association modes where λ3 = 100users/km2 and rcell = 200m.
54
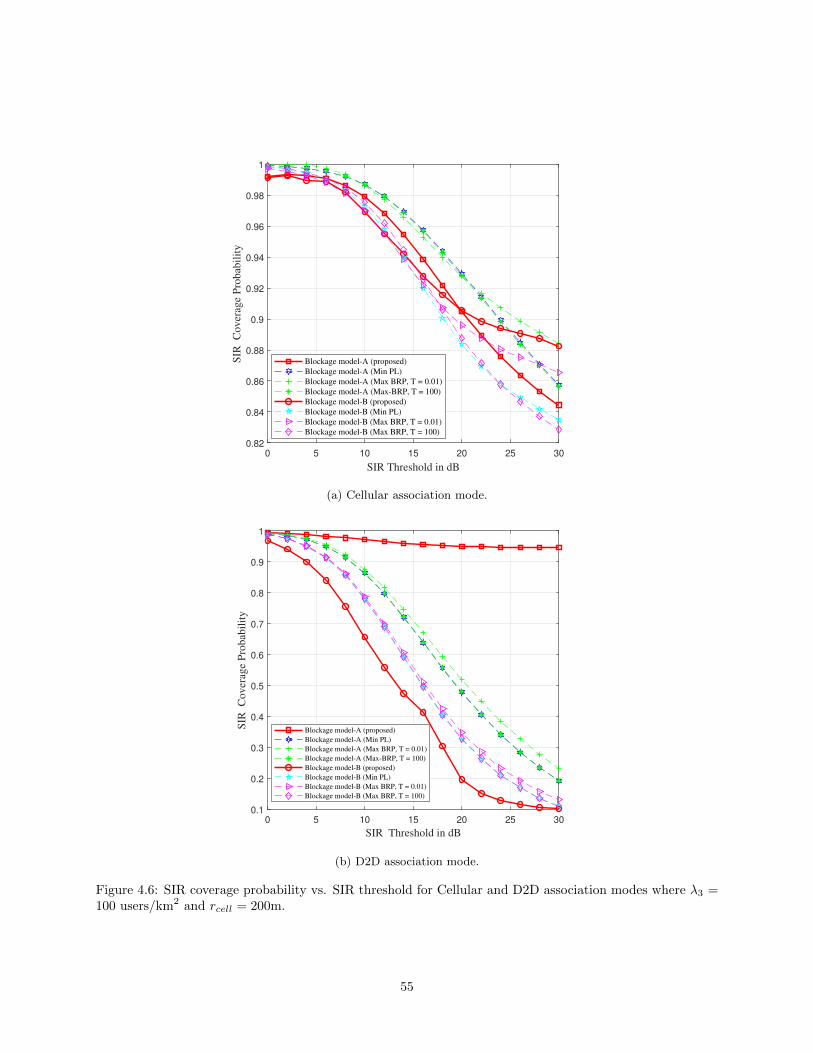
0 5 10 15 20 25 30
SIR Threshold in dB
0.82
0.84
0.86
0.88
0.9
0.92
0.94
0.96
0.98
1
SIR
C
ov
erag
e P
rob
abil
ity
Blockage model-A (proposed)
Blockage model-A (Min PL)
Blockage model-A (Max BRP, T = 0.01)
Blockage model-A (Max-BRP, T = 100)
Blockage model-B (proposed)
Blockage model-B (Min PL)
Blockage model-B (Max BRP, T = 0.01)
Blockage model-B (Max BRP, T = 100)
(a) Cellular association mode.
0 5 10 15 20 25 30
SIR Threshold in dB
0.1
0.2
0.3
0.4
0.5
0.6
0.7
0.8
0.9
1
SIR
C
over
age
Pro
bab
ilit
y
Blockage model-A (proposed)
Blockage model-A (Min PL)
Blockage model-A (Max BRP, T = 0.01)
Blockage model-A (Max-BRP, T = 100)
Blockage model-B (proposed)
Blockage model-B (Min PL)
Blockage model-B (Max BRP, T = 0.01)
Blockage model-B (Max BRP, T = 100)
(b) D2D association mode.
Figure 4.6: SIR coverage probability vs. SIR threshold for Cellular and D2D association modes where λ3 =100 users/km2 and rcell = 200m.
55

10 20 30 40 50 60 70 80 90 100
Base Station Density in km-2
0.1
0.2
0.3
0.4
0.5
0.6
0.7
0.8
0.9
SIR
C
ov
erag
e P
rob
abil
ity
Proposed
Min PL
Max BRP, T = 0.01
Max-BRP, T = 100
(a) Cellular association mode.
10 20 30 40 50 60 70 80 90 100
Base Station Density in km-2
0.1
0.2
0.3
0.4
0.5
0.6
0.7
0.8
0.9
1
SIR
C
ov
erag
e P
rob
abil
ity
Proposed
Min PL
Max BRP, T = 0.01
Max-BRP, T = 100
(b) D2D association mode.
Figure 4.7: SINR Coverage Probability vs. BS density λ1 with λ3 = 100 users/km2 and γ = 25 dB.
56

of transmitters to maximize the fraction of serviced users. The load balancing between the cellular and
D2D tiers results in a higher network area SE and EE performance under the proposed scheme as seen in
Figs. 4.8a and 4.8b, respectively. The load balancing mechanism of the proposed scheme contrasts with the
Min PL-based scheme that prioritizes BS transmissions over D2D transmissions because of the higher BS
transmit power. In addition, the Max BRP-based scheme requires a high value of T (for example, T = 100)
to match the performance of the proposed and Min PL-based schemes.
Lastly, Fig. 4.9 shows a comparison of the performance of the proposed goal attainment algorithm with
the performance under a baseline constant transmit power and bandwidth allocation scheme. The network
objective function is investigated in Fig. 4.9a and the network power consumption is investigated in Fig.
4.9b. The network objective function under the proposed goal attainment algorithm, defined as the scaled
deviation from the SE goal of 20 b/s/Hz is lower than the corresponding value obtained under the baseline
scheme. Further, the goal attainment algorithm achieves the highest EE, achieving up to 50% decrease in
the network power consumption (at λ1 = 50 BSs/km2), compared to the baseline scheme. The higher EE
that is achieved by the goal attainment algorithm results from the power control mechanism that contrasts
with the baseline scheme where all the BSs and users transmit with no power control. Moreover, the jagged
nature of Fig. 4.9b arises from the random power allocation mechanism of Algorithm 4.1. Hence, there is a
non-zero probability that the mean value of the transmit power allocation vector at a higher BS density is
less than the mean value at a lower BS density, which can result in a lower network power consumption at
a higher BS density.
4.7 Summary
This chapter analyzed the performance of the EE and SE of a mmWave cellular network comprising users that
are capable of associating with BSs for cellular communication or neighboring users for D2D communication.
A D2D distance threshold-based and interference-aware association scheme was proposed as a means of
activating cellular and D2D communication modes in a cell. In addition, the analytical expressions for
cellular and D2D association probabilities, coverage probability, SE, and EE were derived considering typical
system parameters and deployment settings. Lastly, the competing SE and EE metrics were coupled into a
joint SE-EE optimization problem and a goal attainment algorithm was proposed to solve the joint SE-EE
optimization problem. Lastly, graphical results were presented to compare the performance of the proposed
distance threshold-based and interference-aware association scheme with the state-of-the-art Min PL-based
and Max BRP-based association schemes.
The findings in this chapter indicate that the proposed association scheme is desirable for adoption in a
57

10 20 30 40 50 60 70 80 90 100
Base Station Density in km-2
0
50
100
150
200
250
300
Are
a S
pec
tral
Eff
icie
ncy
in
bit
s/s/
Hz
Proposed
Min PL
Max BRP, T = 0.01
Max-BRP, T = 100
(a) Area SE vs. BS density.
10 20 30 40 50 60 70 80 90
Base Station Density in km-2
10-1
100
101
102
103
104
105
Ener
gy E
ffic
ien
cy i
n b
its/
s/J
Proposed
Min PL
Max BRP, T = 0.01
Max-BRP, T = 100
(b) EE vs. BS density.
Figure 4.8: Area SE and EE vs. BS density λ1 with λ3 = 100 users/km2 and γ = 25 dB.
58

10 20 30 40 50 60 70 80 90 100
BS density in km-2
0
5
10
15
20
25
30
35
40
Obje
ctiv
e F
un
ctio
n
Goal attainment algorithm
Constant bandwidth, = 0.1
Constant bandwidth, = 0.5
Constant bandwidth, = 0.9
(a) Network Objective Function vs. BS density.
10 20 30 40 50 60 70 80 90 100
BS density in km-2
102
103
Net
wo
rk P
ow
er C
onsu
mp
tion
in W
atts
Goal attainment algorithm
Constant transmit power
(b) Network Power Consumption vs. BS density.
Figure 4.9: Network Objective Function and Power Consumption vs. BS density λ1 with λ3 = 100 users/km2,P1,min, P1,max = 43, 46dBm, P3,min, P3,max = 17, 20dBm, ω = β = τ = 0.5, ηobj = 5 b/s/Hz, andS∗ = 20 b/s/Hz.
59

D2D-enabled mmWave cellular network to meet high coverage and load balancing requirements. Moreover,
the efficacy of the goal attainment algorithm in optimizing the bandwidth allocation and transmit power
control of the D2D-enabled mmWave cellular system was validated by the graphical comparison with a
baseline system with no integration of the goal attainment algorithm.
60

Chapter 5
Popularity and Size-Aware Caching
with Cooperative Transmission in
Hybrid Microwave/Millimeter wave
Heterogeneous Networks 1
5.1 Introduction
This chapter proposes and analyzes the performance of a file popularity and size-aware (PSA) caching scheme
in a hybrid HetNet that comprises a file server, a macro BS tier operating in the microwave frequency bands,
a pico BS tier operating in the mmWave frequency bands, and a user tier. The main contributions of this
chapter are outlined in the following: First, the macro BSs and the pico BSs of the hybrid HetNet are
assumed to be equipped with caches that can store files whose sizes are drawn from independent Pareto
and lognormal distributions. The choice of the file size models is justified by existing studies on the file size
statistics in content servers, however, the PSA caching scheme works for any file size distribution. Second, the
problem of maximizing the average cache hit probability of the hybrid HetNet under the PSA caching scheme
is formulated as a zero-one knapsack problem (0-1 KP). Moreover, two algorithms that leverage dynamic
programming and branch and bound techniques are proposed to solve the 0-1 KP. In addition, the problem
of maximizing the network average success probability of the hybrid HetNet subject to the available cache
1The content of this chapter has generated a journal paper, currently undergoing peer review in IEEE Transactions onCommunications.
61

capacity is shown to be non-convex and the assumption of prior knowledge of the file caching strategy in the
pico BS tier is employed to resolve its non-convexity. Based on the assumption of prior knowledge of the
file caching strategy in the pico BS tier, the expressions for the optimal file caching probabilities are derived
under noise-limited and interference-limited HetNets with typical path loss exponents. Finally, the results of
the analysis under the PSA caching scheme are compared with the state-of-the-art size-weighted popularity
(SWP)-based and popularity-based caching schemes. Besides, the performance of cooperative transmission
with coded caching is studied in the pico BS tier to reveal the achievable gains over a non-cooperative
transmission scheme without coded caching.
The design of efficient caching schemes is critical because of the problem of maximizing competing
performance metrics that are subject to constrained system resources such as the cache capacity of a cache-
enabled network. Caching schemes that prioritize the caching of popular files, i.e., popularity-based caching
do so at the expense of the diversity of the cached files [146, 147]. Other caching schemes including random
caching, probabilistic caching, and coded caching have been proposed to optimize the content delivery in
multi-cellular and hybrid networks [88]. On the other hand, the inhomogeneous nature of files has prompted
studies on content-aware caching. In this regard, the performance of the PSA caching scheme that considers
the file size and file popularity distributions in enhancing the performance of a hybrid HetNet is studied in
this chapter. The design of a cooperative transmission and coded caching scheme to leverage the file storage
redundancy in the pico BS tier of the hybrid HetNet is also presented in this chapter.
5.2 System Model
5.2.1 Network Topology
A hybrid HetNet of radius R that consists of a centralized file server, a macro BS tier, a pico BS tier, and a
user tier is considered. The locations of the macro BSs, pico BSs, and users are assumed to be distributed
as points of independent homogeneous Poisson point processes (PPPs) Φ1,Φ2, and Φ3 with densities λ1, λ2,
and λ3, respectively. The hybrid nature of the HetNet is such that the pico BS tier operates in the mmWave
frequency bands to provide high data rate coverage using directional beamforming, while the macro BSs
operate in the microwave (sub 6 GHz) frequency bands to provide wide area coverage. Additionally, the
available files of the HetNet are stored in the file server, which is connected to the BSs through backhaul
links. The macro and pico BSs are equipped with caches that store files according to the file PSA caching
scheme that is discussed in Section 5.4. The topology of the hybrid HetNet is illustrated in Fig. 5.1.
62

Macro BS
Pico BS Cellular link
Backhaul
User Equipment
Cache
File Server
Figure 5.1: Hybrid HetNet architecture with macro BSs (operating in the microwave frequency bands) andpico BSs (operating in the mmWave frequency bands).
63

5.2.2 Radiation Pattern and Directional Beamforming
The antennas of the pico BSs are assumed to have a radiation pattern that is modeled according to a
uniform linear array because of the extremely small wavelength of mmWave signals [45]. Under the linear
array model, a pico BS is capable of steering the orientation of its antennas in a direction that aligns with
the orientation of the desired receiver to achieve the maximum beamforming gain G2 where the subscript ”2”
denotes a pico BS. Further, the uniform linear array pattern of the pico BSs is approximated by a sectored
antenna model for tractability of the analysis. Under the sectored antenna model, the array gain function
is a discrete random variable that is characterized by the main lobe gain Ψk and the side lobe gain ψk with
k ∈ 2, u [33, 45]. The subscript k denotes a node type with a value ”2” representing a pico BS and a value
”u” representing a user. The array gain equations for both a desired link and an interfering link are given
by [33, 45]:
G2 = Ψ2Ψu, (5.1)
G2,i =
φi,1 = Ψ2Ψu, w.p ζ1 =( θ2
2π
)( θu2π
), (5.2a)
φi,2 = Ψ2ψu, w.p ζ2 =( θ2
2π
)(2π − θu2π
), (5.2b)
φi,3 = ψ2Ψu, w.p ζ3 =(2π − θ2
2π
)( θu2π
), (5.2c)
φi,4 = ψ2ψu, w.p ζ4 =(2π − θ2
2π
)(2π − θu2π
). (5.2d)
G2,i denotes the random array gain due to the i-th interfering pico BS. Φk denotes the main lobe signal
beamwidth of node type k, φi,w denotes the sample value of G2,i at gain combination w occurring with
probability ζw and w ∈ 1, 2, 3, 4. On the other hand, the antenna gain of a macro BS is assumed to have
an omnidirectional pattern with an array gain G1 = 0 dB [49].
From a practical perspective, the sample values of G2,i, i.e., φi,w and the sample space probabilities,
i.e., ζw account for the possible orientations of the antenna of a random interfering pico BS with respect
to the orientation of the typical receiver’s antenna including i)- φi,1 with probability ζ1, corresponds to the
alignment between the main lobe of an interferer’s antenna and the main lobe of the typical receiver’s antenna,
ii)- φi,2 with probability ζ2, corresponds to the alignment between the main lobe of an interferer’s antenna
and the side lobe of the typical receiver’s antenna, iii)- φi,3 with probability ζ3, corresponds to the alignment
between the side lobe of an interferer’s antenna and the main lobe of the typical receiver’s antenna, and (iv)-
φi,4 with probability ζ4, corresponds to the alignment between the side lobe of an interferer’s antenna and
the side lobe of the typical receiver’s antenna. Additionally, the impact of the main lobe beamwidth θk on
64

G2,i is captured in the equations for ζw.
5.2.3 Path Loss, Fading, and Blockage Modeling
The path loss of the hybrid HetNet follows the slope-intercept model [148], where the expression for the path
loss experienced by a link of length y in the macro BS tier is given by:
L1(y) = C1y−α1 , (5.3)
where C1 and α1 denote the frequency-dependent intercept and path loss exponent in the macro BS tier,
respectively.
The exponential blockage model is adopted to capture the random blockage pattern experienced by
mmWave links in the pico BS tier. Under the exponential blockage model, a mmWave link may experience
one out of three states, namely LOS, NLOS, or outage [149]. Thus, the state probability equations for a
mmWave link of length y are [150]:
`outage(y) = max(0, 1− e−Ay+B), (5.4a)
`LOS(y) =(1− `outage(y)
)e−Dy, (5.4b)
`NLOS(y) = 1− `out(y)− `LOS(y), (5.4c)
where `z is the probability that a link is in state z ∈ LOS, NLOS, outage, and A, B, and D are
parameters that depend on the propagation environment [149]. The path loss equation in the pico BS tier
depends on the link state and is given by:
L2(y) = C2,ςy−ας , (5.5)
where C2,ς and ας denote the frequency-dependent intercept and path loss exponent, respectively for a link
in state ς ∈ LOS, NLOS.
Small-scale fading in the macro BS tier is assumed to be Rayleigh distributed where the channel fading
power gains of the microwave links follow independent and identically distributed (i.i.d) exponential distri-
butions with unit mean. On the other hand, Nakagami-m distribution with shape parameter m is assumed
to model the small-scale fading in the pico BS tier. Under a Nakagami-m fading model, the channel fading
power gains of the LOS mmWave links follow i.i.d Gamma distributions with parameter set ηL, 1ηL, where
65
ηL = m denotes the shape parameter [33].
5.2.4 File Request and File Size Distributions
The file request and file size distributions are described in this section and are assumed to be uncorrelated.
The probability that a typical user requests a file f out of N files that are stored in the file server is assumed
to follow the Mandelbrot-Zipf (MZipf) distribution and is given by [151]:
pf =(f + τ)−δ∑Na=1(a+ τ)−δ
, 1 ≤ f ≤ N, f ∈ 1, 2, . . . , N, (5.6)
where δ denotes the Zipf factor of the file popularity distribution and τ denotes the Mandelbrot plateau
factor. When δ is high, i.e., 1 < δ < 2, the number of requests for unique files is small, whereas when
δ is low, i.e., 0 < δ < 1, a high fraction of the requests are for unique files. In addition, the popularity
distribution becomes flattened as τ →∞ [151] and the file requests become uniform.
The Pareto and lognormal probability distributions are adopted to model the file size sf based on studies
of file size distributions in content servers [89, 90, 152]. The pdf for sf that follows a Pareto distribution is
given by [89, 152]:
εsf =β
ξ
(ξ
sf + ξ
)β+1
, ξ, sf > 0, 0 < β ≤ 2, (5.7)
where ξ denotes the Pareto scale parameter, which represents the smallest file size based on the file encoding
format, and β denotes the Pareto shape parameter, which represents the tail index of the file size. A low value
of β indicates a high variance in the file size, for example, β = 0.5 results in a range of sf ∼ O(101)−O(105)
gigabytes (GB). On the other hand, a high value of β results in a low variance in the file size, for example,
β = 1.9 generates a range of sf ∼ O(101)−O(103) GB.
The pdf of sf that follows a lognormal distribution is given by [89, 152]:
νsf =1
sf(2πσ2
)1/2 exp
[−(log sf − µ)2
2σ2
], µ, σ > 0, (5.8)
where µ denotes the lognormal location parameter, which represents the logarithmic mean of the file size
distribution, while σ denotes the lognormal scale parameter, which represents the logarithmic standard
deviation of the file size distribution.
66
5.2.5 User Association Scheme and Cooperative Transmission Design
The typical user is assumed to request the file f and can associate with either a macro BS or a LOS pico
BS that stores the file f and gives the maximum average received power [42]. The justification for adopting
the LOS criterion in the pico BS tier is to ensure that a user receives stronger LOS signals compared to
the weaker NLOS signals. Denote the probability that the typical user associates to a macro BS by %1,f .
Similarly, denote the probability that the typical user associates with an LOS pico BS by %2,f . On the
other hand, denote the probability of storing the file f in a macro BS by q1,f and denote the probability of
storing the file f in a pico BS by q2,f . According to the thinning theorem for homogeneous PPPs [27], the
density of macro BSs that store the file f is Λ1f = q1,fλ1 and the density of pico BSs that store the file f is
Λ2f = q2,fλ2. The expressions for %1,f and %2,f are given based on similar derivations in [49] as:
%1,f =Λ1fP
2α1
1
Λ1fP2α1
1 + Λ2fP2
α2,LOS
2
, %2,f =Λ2fP
2α2,LOS
2
Λ1fP2α1
1 + Λ2fP2
α2,LOS
2
. (5.9)
Remark. Observation of (5.9) confirms that users tend to associate to a tier with a higher density of BSs
and higher transmit power. Moreover, the higher density and the lower transmit power of the pico BS tier
compared to the macro BS tier ensures load balancing between the macro BS tier and the pico BS tier.
Based on the maximum average received power-based association scheme, the pdf for the link length y
when the typical requesting user associates to a macro BS or an LOS pico BS is given based on similar
derivation in [42], i.e.,
g1,f (y) =2πΛ1fy exp
(− π
(Λ1f + Λ2f
(P2G2C2,LOS
P1G1C1
) 2α2,LOS
)y
2α1α2,LOS
)%1,f
, (5.10a)
g2,f (y) =2πΛ2fy exp
(− π
(Λ2f + Λ1f
(P1G1C1
P2G2C2,LOS
) 2α1
)y
2α2,LOSα1
)%2,f
. (5.10b)
Cooperative transmission is employed in the pico BS tier to exploit its high density and the high file
storage redundancy in the caches of the pico BSs. The pico BSs that comprise the cooperative transmission
set C are selected according to the maximum average received power based-scheme which is equivalent to
the path loss-based scheme because the pico BSs transmit with equal power [39, 49]. Hence, the joint pdf
g2,f (y) of the link distance vector y = [y1, . . . , yK ] between the K pico BSs in C and the typical user is
derived based on similar derivation for the joint distribution of the nearest points in a homogeneous PPP
67

[153], i.e.,
g2,f (y) =(2πΛ2f
)Ke−πΛ2fy
2K
K∏j=1
yj . (5.11)
In order to further enhance the probability of successful transmission of files, cooperative transmission is
combined with coded caching [154] in the pico BS tier where each file is subdivided into fragments, stored in
the pico BSs belonging to the set C, and multicasted to the requesting users with the cooperative transmission
scheme. As an illustration, consider a file library comprising 3 files whose indices are i = 1, 2, 3, with sizes
5 GB, 6 GB, and 8 GB, respectively, and with popularity values 1, 3, and 2, respectively. Also, consider
K = 3 cooperating pico BSs where each pico BS is designed with a cache capacity of M2 = 20 GB and
files 1 and 3 are selected as the optimal set of files based on their aggregate popularity values and the cache
capacity of a pico BS. Under the coded caching scheme, the file server divides the files 1 and 3 into K = 3
equal fragments and each separate fragment is stored in one of the K = 3 cooperating pico BSs. In the
delivery phase, each pico BS transmits the stored file fragment in its cache to a requesting user and the user
combines the 3 separate fragments to form the entire file. The macro BSs can also employ coded caching
with non-cooperative transmission, however, the analysis assumes a non-cooperative transmission scheme
without coded caching in the macro BS tier, i.e., files 1 and 3 are stored without fragmentation in the macro
BS tier, and the files are delivered to a requesting user from a single macro BS.
5.3 Performance Analysis
5.3.1 Analysis of Cache Hit Probability
Let ckf denote the cache hit probability of a file f conditioned on a user associating to the k-th tier, which
is the probability that at least one BS in the k-th tier stores the file f . The expression for ckf is given by:
ckf = 1 − e−πΛkfR2
, k ∈ 1, 2. Moreover, ckf is a monotonically increasing and a concave function of Λkf
because∂ckf∂Λkf
> 0 and∂2ckf∂Λ2
kf< 0. The network average cache hit probability for any file f is obtained by
averaging over requests for the N files and the two tiers, given by:
c =∑
k∈1,2
N∑f=1
pf%k,fckf . (5.12)
5.3.2 Analysis of Coverage Probability
The file f is assumed to be requested by the typical user from either the macro BS tier or the pico BS tier.
Recall from Section 5.2.5 that the K cooperating pico BSs that store the file f are selected according to the
68

maximum average received power-based scheme. Assuming the K pico BSs cooperatively transmit the same
file symbol ϑ over a symbol duration, the received signal at the user is
z2,f =
K∑j=1
√P2G2L2(yj)ϕj,oϑ+
∑i∈Φ2,f\C
√P2G2L2(yi)ϕ2,iϑi +
∑i∈Φ2,f′
√P2G2L2(yi)ϕ2,iϑ
′i + no, (5.13)
where ϕj,o denotes the channel fading coefficient between the k-th pico BS that stores the file f and the
typical user, ϕ2,i denotes the channel fading coefficient between the i-th interfering pico BS and the typical
user, Φ2,f \ C denotes the set of interfering pico BSs that store the file f and transmit a file symbol ϑi, Φ2,f ′
denotes the set of interfering pico BSs that do not store the file f and transmit a different file symbol ϑ′i,
and no denotes the thermal noise voltage.
Based on (5.13), the SINR expression in the pico BS tier is given by [6]:
Γ2,f (o) =
∣∣∣∑Kj=1
√P2G2L2(yj)ϕj,o
∣∣∣2No + I2,f + I2,f ′
, (5.14)
where No is the thermal noise power at the receiver circuit of the typical user,
I2,f =∑i∈Φ2,f\C P2G2,iL2(yi)|ϕ2,i|2 denotes the interference power from the pico BSs that store the file f ,
I2,f ′ =∑i∈Φ2,f′
P2G2,iL2(yi)|ϕ2,i|2 is the interference power from the pico BSs that do not store the file f ,
and Φ2,f ∪ Φ2,f ′ = Φ2.
Similarly, when the typical user requests for the file f that is stored in the macro BS tier, the macro BS
that stores the file and gives the maximum average received power is selected by the file server to service the
user. Assuming the macro BS transmits the file symbol ϑ over a given symbol duration, the received signal
at the user is
z1,f =√P1G1L1(y)ϕ1,oϑ+
∑i∈Φ1,f\b(o)
√P1G1L1(yi)ϕ1,isi +
∑i∈Φ1,f′
√P1G1L1(yi)ϕ1,iϑ
′i + no, (5.15)
where the terms in (5.15) have the same definitions as the corresponding terms in the pico BS tier which are
defined under (5.13).
Based on (5.13), the SINR expression in the macro BS tier is given by:
Γ1,f (o) =P1G1ϕ1,o
2L1(y)
No + I1,f + I1,f ′, (5.16)
where the terms in (5.16) have similar definitions to the corresponding terms in the pico BS tier which are
defined under (5.14).
69

Let Υcov,k(γ, f) denote the SINR coverage probability which is defined as the probability that the received
SINR at the typical user that requests for a file f from the k-th tier is larger than a threshold γ for successfully
decoding the received file. Mathematically,
Υcov,k(γ, f) = P(Γk,f (o) > γ), k ∈ 1, 2, (5.17)
where Γk,f (o) is the received SINR at the typical user that requests for the file f from the k-th tier.
Theorem 5.1. The expression for the SINR coverage probability in the pico BS tier Υcov,2(γ, f) when K
pico BSs cooperatively transmit a file f is derived as
Υcov,2(γ, f) ≈∫
0<y1<···<yK<R
ρ∑n=1
(−1)n+1
(ρ
n
)exp
(− ργNoκ(y)
C2G2
)× L2,I
(κ(y), γ, n
)· L2,I′
(κ(y), γ, n
)· g2,f (y) dy1 · · · dyK , (5.18)
where ρ = KηL, ρ = η(ρ!)− 1
ρ , κ(y) = 1∑Kj=1 y
−α2j
, L2,I
(κ(y), γ, n
)and L2,I′
(κ(y), γ, n
)are the n-th
partial Laplace transform terms resulting from the interfering pico BSs in Φ2,f \ C and Φ2,f ′ , respectively,
which are given by:
L2,I
(κ(y), γ, n
)= exp
(− 2πΛ2,f
4∑a=1
ζa
∫ ∞yk
[1− 1(
1 +nφi,aργκ(y)
ρwα2
)ρ]· w ·U(RL − w) dw
), (5.19a)
L2,I′
(κ(y), γ, n
)= exp
(− 2π
(λ2 − Λ2,f
) 4∑a=1
ζa
∫ ∞0
[1− 1(
1 +nφi,aργκ(y)
ρw′α2
)ρ]
× w′ ·U(RL − w′) dw′), (5.19b)
where φi,a =φi,aG2
.
Proof. See Appendix C.1.
Theorem 5.1 shows a positive relationship between Υcov,2(γ, f) and the cardinality K of C which is
evident from observing ρ, κ(y), and the summand of (5.18). However, the additional gain in Υcov,2(γ, f)
decreases as K increases because of the higher path loss experienced by the longer link lengths.
The expression for the SINR coverage probability in the macro BS tier Υcov,1(γ, f) when the typical
user is served by a macro BS that stores a file f is derived based on existing analysis of microwave cellular
70

networks and the result in [122], i.e.,
Υcov,1(γ, f) =
∫ ∞y
exp(− γNoy
−α1
C1G1
)· L1,I(y, γ) · L1,I′(y, γ) · g1,f (y) dy, (5.20)
where L1,I(y, γ) and L1,I′(y, γ) denote the Laplace transform terms resulting from the interfering macro
BSs in Φ1,f \ bo and Φ1,f ′ , respectively, and bo denotes the transmitting macro BS. The expressions for
L1,I(y, γ) and L1,I′(y, γ) are given by:
L1,I(γ, y) = exp(− 2πΛ1,f
∫ ∞y
w
1 + 1y (wy )α1
dw), (5.21a)
L1,I′(γ, y) = exp(− 2π
(λ1 − Λ1,f
) ∫ ∞0
w
1 + 1y (w
′
y )α1dw′). (5.21b)
Corollary 1. Consider a HetNet where the interference resulting from the macro BSs in Φ1,f \ bo and
Φ1,f ′ is negligible, i.e., a noise-limited macro BS tier. The expression for Υcov,1(γ, f) under the noise-limited
scenario is given by:
Υcov,1(γ, f) =
∫ ∞0
exp(− γNoy
α1
C1G1
)· g1,f (y) dy. (5.22)
Additionally, consider the typical path loss exponent of α1 = 4 in the macro BS tier and α2,LOS = 2 in the
pico BS tier. Thus, (5.22) can be integrated to give:
Υcov,1(γ, f) =
exp[
(πq1,fλ1+πq2,fλ2P2G2C2,LOSP1G1C1
)2
4%1,f
]π
32 q1,fλ1 erfc
π(q1,fλ1+q2,fλ2
P2G2C2,LOSP1G1C1
)2√
γNoC1G1
2%1,f
√γNoC1G1
. (5.23)
The coverage probability of file f in the noise-limited macro BS tier is enhanced by having a high density
of BSs that store the files, i.e., q1,fλ1 as seen in (5.23). On the other hand, a high probability of user
association mitigates the coverage probability.
Corollary 2. Consider a HetNet where the thermal noise power is negligible compared to the interference
in the macro BS tier, i.e., an interference-limited macro BS tier. The expression for Υcov,1(γ, f) under the
interference-limited scenario is given by:
71
Υcov,1(γ, f) =
∫ ∞0
exp(− 2πq1,fλ1
∫ ∞y
w
1 + 1γ (wy )α1
dw)
× exp(− 2π
(λ1(1− q1,f )
) ∫ ∞0
w
1 + 1γ (w
′
y )α1dw′)g1,f dy. (5.24)
For a typical path loss exponent of α1 = 4 in the macro BS tier and α2,LOS = 2 in the pico BS tier, the
integrals of (5.24) can be computed in closed form and simplified as:
Υcov,1(γ, f) =4πq1,fλ1 exp
[−π((1−q1,f )λ1R)2
2
]%1,f
[4π(q1,fλ1 + q2,fλ2
(P2G2C2,LOS
P1G1C1
))+ 2π2q1,fλ1
√γ − 4πλ1 arccot(
√γ)] . (5.25)
In (5.25), the coverage probability of the file f in an interference-limited macro BS tier is observed to
increase when the density of the macro BSs that do not store the file f , i.e., (1− q1,f )λ1 decreases.
5.3.3 Analysis of File Transmission Success Probability
The probability of successfully transmitting a file f in the k-th tier is computed by multiplying the cache
hit probability in the k-th tier and the SINR coverage probability in the k-th tier, i.e.,
Sk,f (γ, f) = ckfΥcov,k(γ, f), k = 1, 2. (5.26)
Sk,f (γ, f) depends on the parameters of the file size distribution through ckf and on the SINR threshold
through Υcov,k(γ, f). The network average success probability is obtained by averaging over the requests for
the N files in the macro BS tier and pico BS tier, given by:
S =∑
k∈1,2
N∑f=1
pf%k,fSk,f (γ, f). (5.27)
The proposed file PSA caching scheme is discussed in Section 5.4. Based on the file PSA caching scheme,
the optimizations of the network average cache hit probability and the network average success probability
are discussed in Section 5.5.
72

5.4 File Popularity and Size-Aware Caching Scheme
Consider a centralized file server as shown in Fig. 5.1 that contains a file library N comprising |N | = N
files. The N files in the file server have non-uniform file sizes, which is typical of file servers that store
multiple file formats including small text files and large multimedia files. Additionally, some of the files are
requested more frequently and are more popular than the other files, which is typical of content distributed
networks where some files can experience high user demand during a particular period of the day, month, or
year. In general, the file server can estimate the file sizes and the file popularity values via learning, using
either online learning algorithms such as those proposed in [82] or via a Bayes-based learning algorithm [83].
The present study assumes that the file sizes are modeled according to independent Pareto and lognormal
distributions as described in Section 5.2.4 and the file popularity values are modeled according to an MZipf
distribution also described in Section 5.2.4
The file PSA caching scheme uses the knowledge of the file popularity and file size distributions at the file
server to optimize the storage of the files in the HetNet. The need to exploit the non-uniform file sizes and
popularity values to optimize the storage of files in caches is because of the potential for the number of files to
grow exponentially large in content-centric wireless networks that serve multiple requests. The adoption of
the non-uniform file sizes under the file PSA caching scheme is different than the state-of-the-art SWP-based
and popularity-based caching schemes which assume equal file size and hence, cannot exploit the actual
non-uniformity in the file sizes to optimize the file storage. On the other hand, the file PSA caching scheme
exhibits limitations in terms of signaling overhead and additional latency compared to the state-of-the-art
caching schemes. Notably, the feasibility of applying the proposed file PSA caching scheme to the hybrid
HetNet relies on learning the file sizes which is not required under the SWP-based and popularity-based
caching schemes. The application of the file PSA caching scheme in a hybrid HetNet is demonstrated in
Section 5.5 which discusses the optimizations of the network average cache hit probability and the network
average success probability under the models and assumptions of the proposed file PSA caching scheme.
73

5.5 Optimization Under The File PSA Caching Scheme
5.5.1 Optimization of the Network Average Cache Hit Probability
The proposed file PSA caching scheme described in Section 5.4 maximizes the network average cache hit
probability c subject to the aggregate cache capacity as follows:
Problem P1 : maxF⊆N
c =∑
j, k ∈1,2j 6=k
N∑f=1
pfqk,fλkP2αk
k
(1− e−πqk,fλkR2
)qk,fλkP
2αk
k + qj,fλjP2αj
j
, (5.28a)
subject to∑f∈N
sf ≤∑
k∈1,2
Mk, (5.28b)
0 < qk,f , qj,f < 1, (5.28c)
where c is given by (5.12) and the decision variables are the file caching probabilities qk,f , qj,f that maximize
c. Problem P1 is non-convex because deriving the optimal file caching probabilities in the macro BS tier
relies on knowledge of the file caching strategy in the pico BS tier, and vice-versa [155]. Hence, the optimal
file caching probabilities q∗k,ff=1,...,N in the k-th tier are derived under the assumption of knowledge of
the file caching probabilities qj,fj 6=k,f=1,...,N in the j-th tier. Further, consider the following inequality
derived from the objective function in Problem P1:
maxF⊆N
∑j, k ∈1,2
j 6=k
N∑f=1
pfqk,fλkP2αk
k
(1− e−πqk,fλkR2
)qk,fλkP
2αk
k + qj,fλjP2αj
j
≤ maxF⊆N
N∑f=1
pfqk,fλkP2αk
k
(1− e−πqk,fλkR2
)qk,fλkP
2αk
k + qj,fλjP2αj
j
+ maxF⊆N
N∑f=1
pfqj,fλjP2αj
j
(1− e−πqj,fλjR2
)qk,fλkP
2αk
k + qj,fλjP2αj
j
, j = pico BS tier, k = macro BS tier, (5.29)
where (5.29) follows from max(f + g) ≤ max(f) + max(g). Thus, given the existence of the optimal file
caching probabilities that independently maximize the cache hit probabilities in the macro BS tier, i.e., the
k-th tier and the pico BS tier, i.e., the j-th tier, the maximum network average cache hit probability is
upper bounded by the sum of the maximum average cache hit probabilities in the macro BS tier and the
pico BS tier. Therefore, assuming existence of q∗j,ff=1,...N, Problem P1 can be resolved by maximizing
74

the average cache hit probability in the macro BS tier, i.e,
Problem P2 : maxF⊆N
N∑f=1
pfqk,fλkP2αk
k
(1− e−πqk,fλkR2
)qk,fλkP
2αk
k + qj,fλjP2αj
j
, (5.30a)
subject to∑f∈N
sf ≤Mk, (5.30b)
0 < qk,f < 1, ∀ k = 1. (5.30c)
The optimal file caching probabilities under Problem P2 correspond to solutions of a 0-1 KP which is
described in Lemma 1.
Lemma 1. Problem P2 can be decomposed to a 0-1 KP as follows:
Problem P2 : maxF⊆N
N∑f=1
qk,f , (5.31a)
subject to∑f∈N
sf ≤Mk, (5.31b)
0 < qk,f < 1, ∀ k = 1. (5.31c)
Proof. See Appendix C.2.
The decision variables of Problem P2 are the file caching probabilities q∗k,ff=1,...,N that maximize the
aggregate popularity∑Nf=1 qk,f . Besides, the Problem P2 is a 0-1 KP which is NP-hard [46, 156], thus,
dynamic programming with backtracking [157] and a branch and bound algorithm [158] are employed to
derive local optimum values of the file caching probabilities.
5.5.2 Dynamic Programming with Backtracking
The dynamic programming with backtracking technique for solving the 0-1 KP is discussed in this section.
In order to decide whether or not to store the file f , the maximum aggregate popularity value for the (f −1)
files cached in a BS whose cache capacity is m GB, 0 ≤ m ≤Mk, is used to derive the maximum aggregate
popularity value for the f files cached by solving the Bellman recurrence equations [159]:
Opt[f,m] =
max(Opt[f − 1,m], qk,f +Opt[f − 1,m− sf ]
), sf ≤ m, (5.32a)
Opt[f − 1,m], otherwise, (5.32b)
75

where Opt[f,m] is an array variable that stores the maximum aggregate popularity of any subset of files
1, 2, . . . , f of total size at most m GB, for 1 ≤ f ≤ N , 0 ≤ m ≤Mk. The recursive equation (5.32a) is valid
provided sf ≤ m, ensuring that the file f can be stored. The maximum aggregate popularity of the already
cached files 1, 2, ..., f−1 and used cache space (m−sf ) is therefore Opt[f−1,m−sf ]. If the file cannot be
stored, (5.32b) gives the maximum aggregate popularity. Starting from the initial condition: Opt[0,m] = 0,
0 ≤ m ≤Mk, (5.32) is solved in a bottom-up manner to obtain Opt[N,Mk] which is the maximum aggregate
popularity of the files that can fit into the BS type k cache with capacity Mk. Lastly, the files that comprise
F∗ ⊆ N , which is the set of files that results in Opt[N,Mk], are determined by backtracking. Algorithm 5.1
highlights the steps in the dynamic programming technique.
Line 1 of Algorithm 5.1 initializes the array variable Opt[N,Mk] to zero and initializes the solution set
F∗ as empty. In lines 4-6, the size sf of the file f is compared to the available cache capacity m. If the file
f can be stored, i.e., sf ≤ m, the aggregate popularity values when the file is stored and when the file is
not stored are compared and the greater of the two values is selected as the maximum aggregate popularity
for the f cached files. Lines 6-8 consider the case when the file f cannot be stored because its size exceeds
the available cache capacity. Line 11 returns the last element of the array Opt[N,Mk] as the maximum
aggregate popularity of all the files that can fit into the BS of cache capacity Mk GB, an approximate
solution to Problem P2 in (5.31). However, up to this point, Algorithm 5.1 does not yet provide the set of
files that gives the optimal solution. This set is determined by the backtracking process, discussed next.
Line 12 begins the backtracking process with the necessary initializations. Lines 13-15 consider the
case when the maximum aggregate popularity does not change for each preceding file, meaning that such
a file does not constitute a member of the set F∗. Lines 17 and 18 consider the case when the maximum
aggregate popularity changes, meaning that such a file is an element of F∗. Lines 19, 20, and 21 update
the available cache capacity after adding a file to the set F∗, the file index in the backtracking procedure,
and the maximum aggregate popularity, respectively. The backtracking procedure is continued until all the
member files of the set F∗ are determined. Line 23 returns the complete set F∗.
5.5.3 Branch and Bound Algorithm
The branch and bound algorithm for the 0-1 KP is discussed in this section. First, the files are sorted in
descending order according to qk,f =qk,fsf
into a new set Q , qk,1, . . . , qk,N. Moreover, the subscripts
1, . . . , N in the sorted set Q do not necessarily correspond to the subscripts 1, . . . , N in the set F . For
example, file 1 in the set F may not be the file with the largest ratioqk,fsf
. The storage of files under the
branch and bound algorithm follows the steps in Algorithm 5.2, which are described as follows: Line 1 of
76

Algorithm 5.1: Dynamic Programming with Backtracking
Input: S, R∗, Mk.Output: F∗.1: Initialize: Opt[0,m] = 0, ∀ m = 0 to Mk, F∗ = .2: for f = 0 to N do3: for m = 0 to Mk do4: if sf ≤ m then5: Opt[f,m] = max
(Opt[f − 1,m], qk,f +Opt[f − 1,m− sf ]
).
6: else7: Opt[f,m] = Opt[f − 1,m].8: end if9: end for
10: end for11: Return Opt[N,Mk].12: T = Opt[N,Mk], f = N, Y = Mk.13: while T > 0 do14: while Opt[f, Y ] == T do15: f = f − 1.16: end while17: f = f + 1.18: Insert file f in F∗.19: Y = Y − sf .20: f = f − 1.21: T = Opt[f, Y ].22: end while23: Return F∗.
Algorithm 5.2 initializes the elements of the branch and bound algorithm, including i) an upper bound B
on the maximum aggregate popularity. B is computed by adding the popularity values of the first f files in
the set Q that can be stored in the BS cache to a positive variable κ multiplied by the popularity value of
the (f + 1)-th file which, if added as a whole, will cause BS cache overflow. The variable κ is computed by
dividing the available BS cache capacity after storing the first f files by the size of the (f + 1)-th file. The
other elements to be initialized are: ii) the maximum aggregate popularity of the cached files, denoted by A,
is initialized to zero, iii) a variable U , denoting the BS available cache capacity after each file is considered,
is initialized to Mk, iv) the file index f is initialized to zero when no file has been considered, and v) the
solution set F∗, is initialized as empty. Line 3 begins with the file whose index matches the first index in Q.
In lines 5, 6, and 7, the values of the maximum aggregate popularity, BS available cache capacity, and the
upper bound on the maximum aggregate popularity are updated, respectively, when file f is considered for
caching. Line 8 compares the current upper bound B to the current maximum aggregate popularity A when
file f is considered, adds file f to the set F∗ in line 9 if the upper bound is greater than or equal to A, and
repeats the branching procedure. Otherwise if the current upper bound is less than the current maximum
aggregate popularity A, the branch terminates at the current file index and returns the set F∗ in line 16
which provides the maximum aggregate popularity A.
Algorithm 5.2 achieves O(N) complexity by making use of a tight upper bound on the maximum aggregate
77
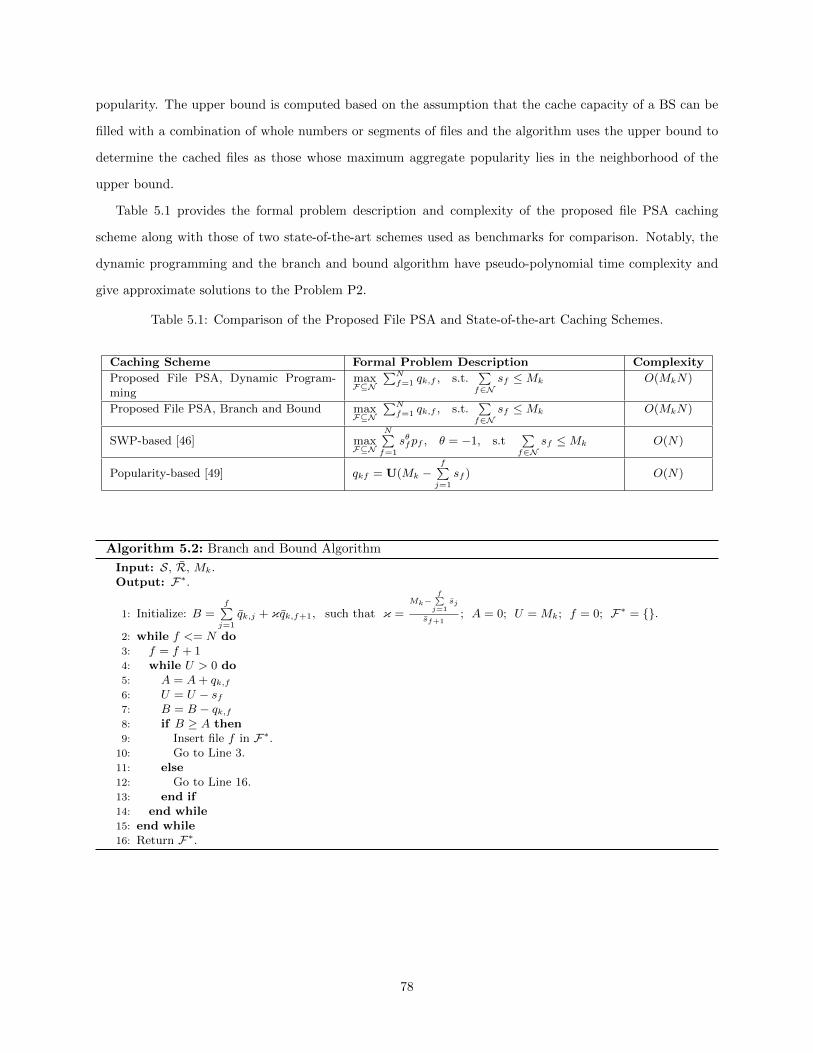
popularity. The upper bound is computed based on the assumption that the cache capacity of a BS can be
filled with a combination of whole numbers or segments of files and the algorithm uses the upper bound to
determine the cached files as those whose maximum aggregate popularity lies in the neighborhood of the
upper bound.
Table 5.1 provides the formal problem description and complexity of the proposed file PSA caching
scheme along with those of two state-of-the-art schemes used as benchmarks for comparison. Notably, the
dynamic programming and the branch and bound algorithm have pseudo-polynomial time complexity and
give approximate solutions to the Problem P2.
Table 5.1: Comparison of the Proposed File PSA and State-of-the-art Caching Schemes.
Caching Scheme Formal Problem Description Complexity
Proposed File PSA, Dynamic Program-ming
maxF⊆N
∑Nf=1 qk,f , s.t.
∑f∈N
sf ≤Mk O(MkN)
Proposed File PSA, Branch and Bound maxF⊆N
∑Nf=1 qk,f , s.t.
∑f∈N
sf ≤Mk O(MkN)
SWP-based [46] maxF⊆N
N∑f=1
sθfpf , θ = −1, s.t∑f∈N
sf ≤Mk O(N)
Popularity-based [49] qkf = U(Mk −f∑j=1
sf ) O(N)
Algorithm 5.2: Branch and Bound Algorithm
Input: S, R, Mk.Output: F∗.
1: Initialize: B =f∑j=1
qk,j + κqk,f+1, such that κ =Mk−
f∑j=1
sj
sf+1; A = 0; U = Mk; f = 0; F∗ = .
2: while f <= N do3: f = f + 14: while U > 0 do5: A = A+ qk,f6: U = U − sf7: B = B − qk,f8: if B ≥ A then9: Insert file f in F∗.
10: Go to Line 3.11: else12: Go to Line 16.13: end if14: end while15: end while16: Return F∗.
78
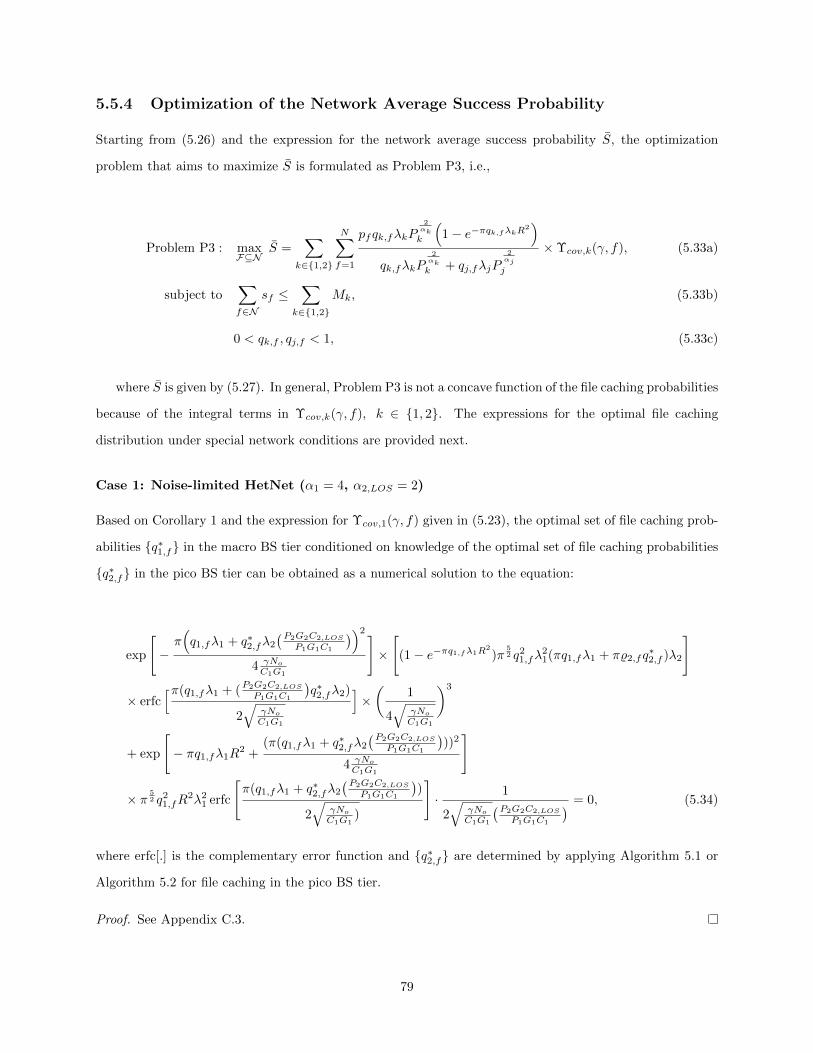
5.5.4 Optimization of the Network Average Success Probability
Starting from (5.26) and the expression for the network average success probability S, the optimization
problem that aims to maximize S is formulated as Problem P3, i.e.,
Problem P3 : maxF⊆N
S =∑
k∈1,2
N∑f=1
pfqk,fλkP2αk
k
(1− e−πqk,fλkR2
)qk,fλkP
2αk
k + qj,fλjP2αj
j
×Υcov,k(γ, f), (5.33a)
subject to∑f∈N
sf ≤∑
k∈1,2
Mk, (5.33b)
0 < qk,f , qj,f < 1, (5.33c)
where S is given by (5.27). In general, Problem P3 is not a concave function of the file caching probabilities
because of the integral terms in Υcov,k(γ, f), k ∈ 1, 2. The expressions for the optimal file caching
distribution under special network conditions are provided next.
Case 1: Noise-limited HetNet (α1 = 4, α2,LOS = 2)
Based on Corollary 1 and the expression for Υcov,1(γ, f) given in (5.23), the optimal set of file caching prob-
abilities q∗1,f in the macro BS tier conditioned on knowledge of the optimal set of file caching probabilities
q∗2,f in the pico BS tier can be obtained as a numerical solution to the equation:
exp
[−π(q1,fλ1 + q∗2,fλ2
(P2G2C2,LOS
P1G1C1
))2
4 γNoC1G1
]×
[(1− e−πq1,fλ1R
2
)π52 q2
1,fλ21(πq1,fλ1 + π%2,fq
∗2,f )λ2
]
× erfc[π(q1,fλ1 + (
P2G2C2,LOS
P1G1C1
)q∗2,fλ2)
2√
γNoC1G1
]×(
1
4√
γNoC1G1
)3
+ exp
[− πq1,fλ1R
2 +(π(q1,fλ1 + q∗2,fλ2
(P2G2C2,LOS
P1G1C1
)))2
4 γNoC1G1
]
× π 52 q2
1,fR2λ2
1 erfc
[π(q1,fλ1 + q∗2,fλ2
(P2G2C2,LOS
P1G1C1
))
2√
γNoC1G1
)
]· 1
2√
γNoC1G1
(P2G2C2,LOS
P1G1C1
) = 0, (5.34)
where erfc[.] is the complementary error function and q∗2,f are determined by applying Algorithm 5.1 or
Algorithm 5.2 for file caching in the pico BS tier.
Proof. See Appendix C.3.
79

Remark. (5.34) reveals that q∗1,f depends on q∗2,f, the thermal noise power No, and the system design
parameters (λ1, λ2, P1, P2, G1, G2, γ, R). Moreover, for a given q∗2,f, a numerical algorithm that executes
(5.34) will require an input memory of O(N) to store (q∗2,f, No, λ1, λ2, P1, P2, G1, G2, γ, R) and this presents
a memory overhead compared to the SWP-based and popularity-based caching schemes which do not require
the system design parameters to compute the optimal file caching probabilities.
Case 2: Interference-limited HetNet (α1 = 4, α2,LOS = 2)
Based on Corollary 2 and the expression for Υcov,1(γ, f) given in (5.24), the optimal set of caching probabil-
ities q∗1,f in the macro BS tier conditioned on knowledge of the optimal set of caching probabilities q∗2,f
in the pico BS tier can be obtained as a numerical solution to the equation:
4 exp[− πq1,fλ1
(π − 2 arctan( 1√
γ ))](
1− exp(−πq1,fλ1R2))πq1,fλ1
%2,f
(2πq1,fλ1 + 2πq∗2,fλ2
(P2G2C2,LOS
P1G1C1
))
+2 exp
[− πq1,fλ1R
2 − πq1,fλ1
(π − 2 arctan( 1√
γ ))]π2q2
1,fλ21R
2
%2,f
(2πq1,fλ1 + 2πq∗2,fλ2
(P2G2C2,LOS
P1G1C1
))
−4 exp
[− πq1,fλ1
(π − 2 arctan( 1√
γ ))](
1− exp(−πq1,fλ1R2))(π − 2 arctan( 1√
γ ))π2q2
1,fλ21
%2,f
(2πq1,fλ1 + 2πq∗2,fλ2
(P2G2C2,LOS
P1G1C1
))2
−2 exp
[− πq1,fλ1
(π − 2 arctan( 1√
γ ))](
1− exp(−πq1,fλ1R2))(π − 2 arctan( 1√
γ ))π2q2
1,fλ21
%2,f
(2πq1,fλ1 + 2πq∗2,fλ2
(P2G2C2,LOS
P1G1C1
)) = 0. (5.35)
where erfc[.] is the complementary error function and q∗2,f are determined by applying Algorithm 5.1 or
Algorithm 5.2 to the pico BS tier.
Proof. Similar proof for the noise-limited case in Appendix C.3 is applicable to the interference-limited case
by starting from (5.24).
Remark. Similar to the noise-limited case, (5.35) reveals that q∗1,f depends on q∗2,f, the thermal noise
power No, and the system design parameters (λ1, λ2, P1, P2, G1, G2, R). Thus, a numerical algorithm that
executes (5.35) will also incur an O(N) memory overhead compared to the SWP-based and popularity-based
caching schemes.
80

5.6 Evaluation Methodology and Discussion of Numerical Results
The impact of the parameters of the file size distribution and the SINR threshold on the performance metrics
under the file PSA caching scheme and the state-of-the-art caching schemes is investigated in this section.
5.6.1 Evaluation Methodology
The values of the optimized file caching probabilities q∗1,f and q∗2,f are generated using Monte-Carlo
simulations in MATLAB and numerical algorithms in Mathematica as follows:
• Declare the network parameter values, i.e., λ1, λ2, P1, P2, α1, α2, N, . . . .
• Specify the number of simulation runs nsim = O(104).
• Generate PPP realizations of the macro BS tier and pico BS tier of the hybrid HetNet based on the
network topology in Section 5.2.1.
• Compute the file caching probabilities q∗2,f in the pico BS tier based on the dynamic programming
with backtracking and branch and bound algorithm by following the steps for Algorithm 5.1 and
Algorithm 5.2, respectively.
• Compute the file caching probabilities q∗1,f in the macro BS tier using numerical algorithms in Math-
ematica and based on the expressions for q∗1,f in (5.34) and (5.35) for noise-limited and interference-
limited HetNets, respectively.
• Compute the value of the performance metric, e.g., the network average cache hit probability of (5.12)
as a function of q∗1,f and q∗2,f. Save the result for the realization.
• Compute the average of the performance metric over the nsim realizations of the hybrid HetNet and
return the result.
The assumed values of the network parameters are listed in Table 5.2 and are borrowed from existing
literature [33, 46, 49, 156, 160, 161, 162, 163]. Notably, a macro BS antenna is assumed to have an omnidi-
rectional radiation pattern with a gain G1 = 0 dB, while a desired pico BS performs directional beamforming
and can align its signal transmission in the direction of the typical receiver to achieve the maximum array
gain G2 = φi,1 = 10 dB.
81

Table 5.2: Values of System Parameters.
Notations Parameter Definition Assumed ValuesP1, P2 Macro BS transmit power,
pico BS transmit power40 dBm, 30 dBm [49]
λ1, λ2, λu Macro BS density, pico BSdensity, user density
1/(2502π)m2, 20/(2502π)m2, 30/(2502π)m2
[49]f1, f2 microwave carrier fre-
quency, mmWave carrierfrequency
2 GHz, 70 GHz [162]
α1, α2,LOS , c, C1, C2,LOS , ηL Path loss exponent inmacro BS tier, LOS pathloss exponent in pico BStier, speed of light, pathloss intercept in macro BStier, LOS path loss inter-cept in pico BS tier, LOSNakagami shape parame-ter
4, 2, 3 × 10⁸m s−1, ( c4πf1
)α1 , C2 =
( c4πf2
)α2,LOS , 3 [33, 49]
G1, G2, R Array gain of a macro BS,maximum array gain of apico BS, network radius
0 dB, 10 dB, 1000 m [49, 162]
M1, M2, N, δ, τ Cache capacity of a macroBS, cache capacity of apico BS, number of filesin file library, Zipf factor,Mandelbrot plateau factor
[2, 4] GB, [1, 2] GB, 100, 0.8, 0 [46, 160,163]
ξ, β, σ, µ Scale parameter of Paretofile size distribution,shape parameter ofPareto file size distri-bution, scale parameterof lognormal file sizedistribution, locationparameter of lognormalfile size distribution
[0.01, 0.1] GB, [0.1, 2], [log 0.01, log 0.1]GB, [log 0.01, log 0.1] GB [160]
5.6.2 Impact of the File Size Distribution on the Network Average Cache Hit
Probability
In Fig. 5.2a and Fig. 5.2b, the network average cache hit probabilities are plotted versus the aggregate
cache capacity (= M1+M2) under the Pareto and lognormal file size distributions, respectively. The network
average cache hit probability increases with the aggregate cache capacity in all the schemes because more files
can be stored when the available cache capacity is increased. The proposed file PSA caching scheme branch
and bound algorithm achieves the best performance and the proposed file PSA caching scheme dynamic
programming algorithm achieves the next best performance under the Pareto file size distribution. On the
other hand, the proposed file PSA caching schemes branch and bound algorithm, dynamic programming
82

algorithm, and SWP-based scheme exhibit identical performance under the lognormal file size distribution.
The explanation of the behavior of the proposed and state-of-the-art schemes depends on the choice of the
heuristic and the parameters of the file size distribution. The proposed file PSA caching scheme branch
and bound algorithm sorts the files in descending order according to the popularity-per-size metric and
computes the upper bound on the aggregate popularity to serve as a target in determining the set of cached
files. In contrast, the proposed scheme dynamic programming algorithm does not rely on an upper bound in
determining the set of cached files. The SWP-based scheme sorts the files in a greedy manner according to a
size-weighted popularity metric without considering whether or not the aggregate popularity of the cached
files approaches a feasible upper bound. Moreover, when the variance in the file sizes is large, as captured by
β = 2.0 under the Pareto file size distribution, a few files dominate the cache memory and the branch and
bound algorithm exploits the large file size variance in its branching procedure to achieve up to 10% gain
compared to the dynamic programming algorithm. On the other hand, the smaller variance in the lognormal
file size distribution with σ = log 0.1 GB results in a more uniform distribution of file size compared to the
Pareto file size distribution. Thus, the proposed file PSA and SWP-based caching schemes achieve similar
performance in the network average cache hit probability, as observed in Fig. 5.2b. The popularity-based
scheme achieves the least network average cache hit probability performance because it does not consider
the impact of the different file sizes, but only caches the files in descending order of popularity.
In Fig. 5.3a and Fig. 5.3b, the network average cache hit probability is plotted versus the Pareto shape
parameter and Pareto scale parameter, respectively with a Mandelbrot plateau factor τ = 0. The network
average cache hit probability increases monotonically with the Pareto shape parameter because the variance
of the Pareto file size distribution decreases with an increase in the Pareto shape parameter, as explained
in Section 5.2.4. Thus, more files whose sizes fall within a small range are cached when the Pareto shape
parameter is high (e.g. β = 2.0) compared to a low Pareto shape parameter (e.g. β = 0.5). In contrast,
the network average cache hit probability decreases monotonically with the Pareto scale parameter because
a high Pareto scale parameter results in a distribution of files that is skewed towards a few files that fill up
the cache memory. Similar behavior is observed under the lognormal file size distribution in Fig. 5.4 where
the network average cache hit probability decreases with the lognormal location parameter and the proposed
file PSA and SWP-based caching schemes exhibit similar performance because of the low variance of the
lognormal file size distribution.
83
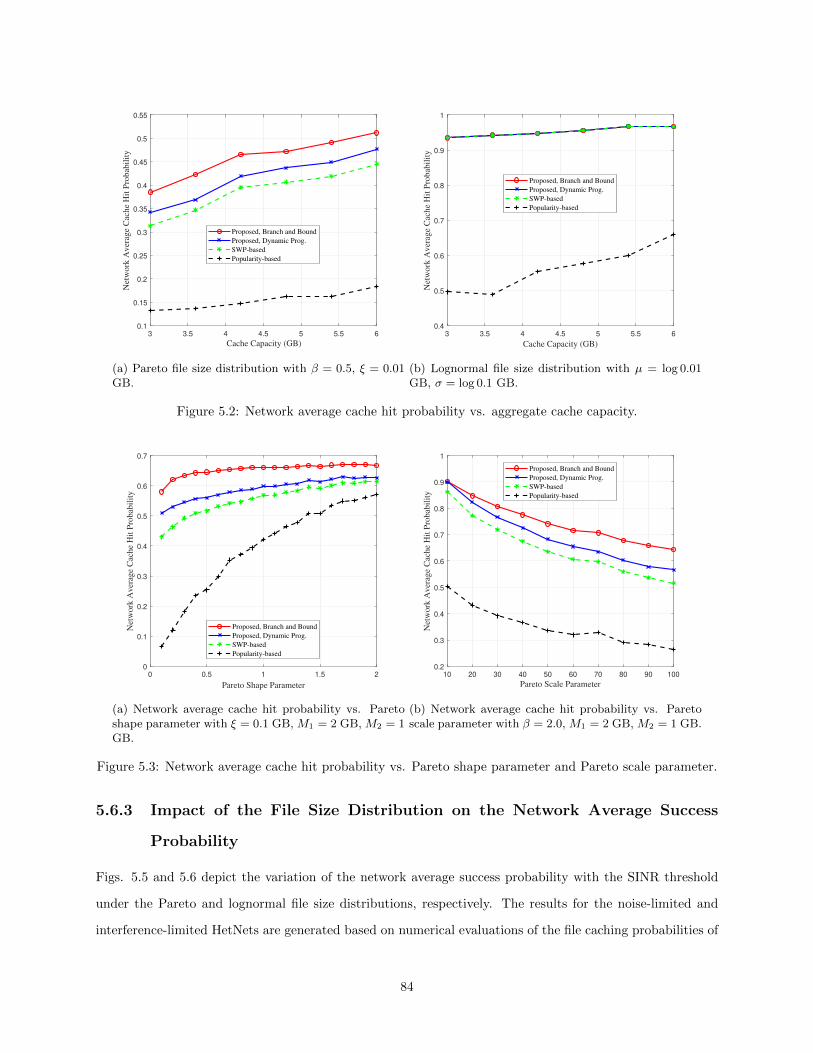
3 3.5 4 4.5 5 5.5 6
Cache Capacity (GB)
0.1
0.15
0.2
0.25
0.3
0.35
0.4
0.45
0.5
0.55
Net
work
Aver
age
Cac
he
Hit
Pro
bab
ilit
y
Proposed, Branch and Bound
Proposed, Dynamic Prog.
SWP-based
Popularity-based
(a) Pareto file size distribution with β = 0.5, ξ = 0.01GB.
3 3.5 4 4.5 5 5.5 6
Cache Capacity (GB)
0.4
0.5
0.6
0.7
0.8
0.9
1
Net
work
Aver
age
Cac
he
Hit
Pro
bab
ilit
y
Proposed, Branch and Bound
Proposed, Dynamic Prog.
SWP-based
Popularity-based
(b) Lognormal file size distribution with µ = log 0.01GB, σ = log 0.1 GB.
Figure 5.2: Network average cache hit probability vs. aggregate cache capacity.
0 0.5 1 1.5 2
Pareto Shape Parameter
0
0.1
0.2
0.3
0.4
0.5
0.6
0.7
Net
work
Aver
age
Cac
he
Hit
Pro
bab
ilit
y
Proposed, Branch and Bound
Proposed, Dynamic Prog.
SWP-based
Popularity-based
(a) Network average cache hit probability vs. Paretoshape parameter with ξ = 0.1 GB, M1 = 2 GB, M2 = 1GB.
10 20 30 40 50 60 70 80 90 100
Pareto Scale Parameter
0.2
0.3
0.4
0.5
0.6
0.7
0.8
0.9
1
Net
work
Aver
age
Cac
he
Hit
Pro
bab
ilit
y
Proposed, Branch and Bound
Proposed, Dynamic Prog.
SWP-based
Popularity-based
(b) Network average cache hit probability vs. Paretoscale parameter with β = 2.0, M1 = 2 GB, M2 = 1 GB.
Figure 5.3: Network average cache hit probability vs. Pareto shape parameter and Pareto scale parameter.
5.6.3 Impact of the File Size Distribution on the Network Average Success
Probability
Figs. 5.5 and 5.6 depict the variation of the network average success probability with the SINR threshold
under the Pareto and lognormal file size distributions, respectively. The results for the noise-limited and
interference-limited HetNets are generated based on numerical evaluations of the file caching probabilities of
84

2 2.5 3 3.5 4 4.5 5
Lognormal Location Parameter (GB) 10-3
0.4
0.5
0.6
0.7
0.8
0.9
1
Net
work
Aver
age
Cac
he
Hit
Pro
bab
ilit
y
Proposed, Branch and Bound
Proposed, Dynamic Prog.
SWP-based
Popularity-based
Figure 5.4: Network average cache hit probability vs. lognormal location parameter with σ = log 0.01 GB,M1 = 2 GB, and M2 = 1 GB.
-10 -5 0 5 10 15 20 25 30
SINR Threshold in dB
0.1
0.2
0.3
0.4
0.5
0.6
0.7
0.8
Net
work
Aver
age
Succ
ess
Pro
bab
ilit
y
Noise-Limited HetNet, Proposed
Noise-Limited HetNet, SWP-based
Noise-Limited HetNet, Popularity-based
(a) Noise-limited HetNet.
-10 -5 0 5 10 15 20 25 30
SINR Threshold in dB
0
0.1
0.2
0.3
0.4
0.5
0.6
0.7
Net
work
Aver
age
Succ
ess
Pro
bab
ilit
y
Interference-Limited HetNet, Proposed
Interference-Limited HetNet, SWP-based
Interference-Limited HetNet, Popularity-based
(b) Interference-limited HetNet.
Figure 5.5: Network average success probability vs. SINR threshold under Pareto file size distribution withξ = 0.1 GB, β = 2.0, M1 = 2 GB, and M2 = 1 GB.
(5.34) and (5.35) in Mathematica. The proposed file PSA and SWP-based caching schemes achieve similar
performance under the noise-limited HetNet, whereas the proposed file PSA scheme achieves up to 7% gain
in the network average success probability over that of the SWP-based scheme. Thus, it can be concluded
that optimizing the caching of files is useful when other transmitting BSs interfere with file transmissions
from a desired BS.
85

-10 -5 0 5 10 15 20 25 30
SINR Threshold in dB
0
0.1
0.2
0.3
0.4
0.5
0.6
0.7
0.8
Net
work
Aver
age
Succ
ess
Pro
bab
ilit
y
Noise-Limited HetNet, Proposed
Noise-Limited HetNet, SWP-based
Noise-Limited HetNet, Popularity-based
(a) Noise-limited HetNet.
-10 -5 0 5 10 15 20 25 30
SINR Threshold in dB
0
0.1
0.2
0.3
0.4
0.5
0.6
0.7
Net
work
Aver
age
Succ
ess
Pro
bab
ilit
y
Interference-Limited HetNet, Proposed
Interference-Limited HetNet, SWP-based
Interference-Limited HetNet, Popularity-based
(b) Interference-limited HetNet.
Figure 5.6: Network average success probability vs. SINR threshold under lognormal file size distributionwith µ = log 0.01 GB, σ = log 0.1 GB, M1 = 2 GB, and M2 = 1 GB.
20 40 60 80 100 120 140 160
Pico BS Density (km-2
)
0.3
0.35
0.4
0.45
0.5
0.55
0.6
0.65
Net
work
Aver
age
Succ
ess
Pro
bab
ilit
y
Interference-Limited HetNet, Proposed
Interference-Limited HetNet, SWP-based
Interference-Limited HetNet, Popularity-based
(a) Pareto file size distribution.
20 40 60 80 100 120 140 160
Pico BS Density (km-2
)
0.3
0.35
0.4
0.45
0.5
0.55
0.6
0.65
0.7
Net
work
Aver
age
Succ
ess
Pro
bab
ilit
y
Interference-Limited HetNet, Proposed
Interference-Limited HetNet, SWP-based
Interference-Limited HetNet, Popularity-based
(b) Lognormal file size distribution.
Figure 5.7: Network average success probability vs. pico BS density with ξ = 0.1 GB, β = 2.0, µ = log 0.01GB, σ = log 0.1 GB, M1 = 2 GB, and M2 = 1 GB.
5.6.4 Impact of Dense Pico BS Deployment and Cooperative Transmissions
With Coded Caching
The impact of a dense pico BS deployment is illustrated in Fig. 5.7 where the network average success
probability decreases by approximately 20% as the pico BS density doubles. On the other hand, Fig. 5.8
shows that cooperative transmission with coded caching can be employed in the dense pico BS tier to enhance
the gain in the network average success probability. Up to 40% gain is achieved with 2 cooperating pico
86

-10 -5 0 5 10 15 20 25 30
SINR Threshold in dB
0.1
0.2
0.3
0.4
0.5
0.6
0.7
0.8
0.9
1
Net
work
Aver
age
Succ
ess
Pro
bab
ilit
y
K = 5, Coded Caching
K = 4, Coded Caching
K = 3, Coded Caching
K = 2, Coded Caching
Non-cooperative
(a) Pareto file size distribution.
-10 -5 0 5 10 15 20 25 30
SINR Threshold in dB
0.1
0.2
0.3
0.4
0.5
0.6
0.7
0.8
0.9
1
Net
work
Aver
age
Succ
ess
Pro
bab
ilit
y
K = 5, Coded Caching
K = 4, Coded Caching
K = 3, Coded Caching
K = 2, Coded Caching
Non-cooperative
(b) Lognormal file size distribution.
Figure 5.8: Comparison between cooperative transmission with coded caching and non-cooperative trans-mission without coded caching.
BSs with coded caching compared to non-cooperative transmission without coded caching, however, the gain
diminishes as the cooperative set increases with only 14% gain achieved between 4 and 5 cooperating pico
BSs.
5.7 Summary
This chapter presented and analyzed the performance of a file popularity and size-aware caching scheme in a
hybrid HetNet comprising a macro BS tier that operates in the microwave frequency bands and a pico BS tier
that operates in the mmWave frequency bands. The set of files that are stored in a macro BS and a pico BS
to maximize the HetNet average cache hit probability were obtained as a solution to a 0-1 KP. In addition,
the 0-1 KP was solved using dynamic programming and branch and bound algorithms, whereas numerical
evaluation techniques were used to efficiently determine the optimal set of files that maximize the HetNet
average success probability. Cooperative transmission with coded caching was integrated into the pico BS
tier to enhance the performance of the file popularity and size-aware caching scheme in a dense pico BS tier.
Lastly, the performance gains achieved by the file popularity and size-aware caching scheme with cooperative
transmission and coded caching when compared to the state-of-the-art SWP and popularity-based caching
schemes were illustrated using graphical results.
The findings in this chapter show that the file popularity and size-aware caching scheme provides signif-
icant gains in a hybrid microwave/mmWave HetNet with sufficient cache capacity and a sparse deployment
of BSs. Moreover, the successful transmission of files in the hybrid HetNet can be enhanced by adopting
87

cooperative transmission and coded caching techniques that leverage file storage redundancy.
88

Chapter 6
Popularity and Size-Aware Caching in
Millimeter Wave Networks with
Device-to-Device Communication and
Large-Scale Antenna Arrays 1
6.1 Introduction
This chapter studies the performance of the PSA caching scheme in a cache-enabled mmWave cellular network
with D2D communication and large-scale antenna arrays. The mmWave network comprises a centralized file
server, BSs, and users whose locations form independent and finite homogeneous Poisson point processes.
The main contribution of this chapter is the downlink performance analysis of the mmWave network under
the PSA caching scheme and the linear precoding technique of maximum-ratio-transmission. Mathematical
expressions are derived for the cache hit probability, average achievable rate, and successful content delivery
probability, and the analytical results are validated with the aid of Monte-Carlo simulations. The impact of
the large-scale antenna arrays on the system performance is also investigated.
1The content of this chapter is being finalized for submission to the IEEE Transactions on Communications.
89

6.2 System Model
6.2.1 Network Architecture
Consider a mmWave network of radius R and area B , b(o, R) where b(o, R) denotes a ball of radius R
that is centered at the origin o . The locations of the BSs and users within B are assumed to be distributed
according to independent finite homogeneous Poisson point processes (FHPPPs) Φb and Φu, respectively.
Similar to the definition of a binomial Poisson point process given in [30], the FHPPP that represents the
locations of the BSs, i.e., Φb , Υb ∩ B where Υb is an HPPP with density λb [164]. Similarly, the FHPPP
that represents the locations of the users, i.e., Φu , Υu ∩ B where Υu is an HPPP with density λu.
Fig. 6.1 illustrates the architecture of the mmWave network. A typical user that requests for a file can
be serviced by a BS that stores the requested file or by another user that stores the requested file via D2D
transmission. Moreover, a fraction µ of the users are assumed to participate in servicing user requests for
cached files within a D2D communication range rd and the remaining fraction (1−µ) are cellular users whose
requests for cached files are serviced by the BSs. Based on the thinning theorem [122], the locations of the
D2D transmitters and cellular receivers follow FHPPPs Φd,u and Φb,u, respectively, with densities µλu and
(1− µ)λu, respectively. The BS (cellular) and D2D transmissions are assumed to occur in mmWave bands
and the allocation of frequencies to the BSs and D2D transmitters are assumed to be orthogonal to suppress
inter-tier interference.
Table 6.1: Summary of Major Notations
Notation Description
Φb,Φu, λb, λu, µ,Nb, NuFHPPP for BSs, FHPPP for users, density of BSs, density of users,D2D partition factor, number of BS antenna elements, number ofuser antenna elements.
Gb(ςx, ςy), Gu(ς), L(r), α, CArray gain of a BS, array gain of a user, path loss function for ammWave link of length r, path loss exponent, path loss intercept.
β, ξ,$,κ, δ, τ, ωfPareto file size shape parameter, Pareto file size scale parameter,Gamma file size shape parameter, Gamma file size scale parame-ter, Zipf factor, Mandelbrot plateau factor, size of a file f .
R,RL, rd, N,Mb,Mu
Radius of the mmWave network, LOS radius, D2D communicationrange, number of available files in the file server, cache memorycapacity of a BS in GB, cache memory capacity of a user in GB.
dx, dy, dHorizontal spacing between BS antenna elements, vertical spac-ing between BS antenna elements, uniform spacing between userantenna elements.
qb,f , qu,f , ζb,f , ζd,f , cb,f , cd,fCaching probability of file f in a BS, caching probability of file fin a user, BS association probability, D2D association probability,cellular cache hit probability, D2D cache hit probability.
ψ, Ai,f , A,Ri(ψ, f),H(ψ)Rate threshold for successful decoding of file f , average achievablerate per unit bandwidth of file f , average achievable rate per unitbandwidth, rate coverage probability of file f , successful contentdelivery probability.
90

BS Cellular linkUser device D2D linkFile server Fronthaul link
Figure 6.1: Millimeter wave network with cellular communications and device-to-device communications.
91

6.2.2 Antenna Design and Radiation Pattern
The transceivers of a BS and a user are assumed to be equipped with antenna arrays comprising Nb and Nu
antenna elements, respectively. The Nb antenna elements of the BS are mounted in a rectangular array of
dimension Q horizontal elements and M vertical elements where Nb = Q ×M . Additionally, dx m is the
uniform element spacing in the horizontal direction and dy m is the uniform element spacing in the vertical
direction [165, 166]. On the other hand, the Nu antenna elements of the user are mounted in a linear array
pattern with a uniform element spacing of d m. [49, 167].
Based on the described antenna structure, the array gain function of a BS is given by [168]:
Gb(ςx, ςy) =
[sin2(Qπςx)
Q2 sin2(πςx)
](sin2(Mπςy)
M2 sin2(πςy)
], (6.1)
where ςx and ςy are uniformly distributed random variables in the range [−dxν ,dxν ] and [−dyν ,
dyν ], respec-
tively, and ν is the wavelength of the mmWave signals. Similarly, the array gain function of a user is given
by [49, 169]:
Gu(ς) =sin2(πNuς)
N2u sin2(πς)
, (6.2)
where ς is a uniformly distributed random variable in the range [− dν ,
dν ].
6.2.3 Path Loss, Fading, and Blockage Modeling
The path loss experienced by the mmWave signals is modeled using the slope-intercept model [170]. Con-
sidering the small wavelength of mmWave and the severe blockage that is experienced by NLOS signals, a
link of length r has a path loss function which is given by:
L(r) = Cr−αU(RL − r), (6.3)
where α and C denote the path loss exponent and intercept, respectively, U(.) is the unit step function,
and RL is the LOS radius. The small-scale fading experienced by the mmWave signals is modeled using
independent Nakagami-m distributions with shape parameter η [33]. Additionally, the channel fading power
gains of the mmWave links follow independent and identically distributed (i.i.d) Gamma distributions with
parameter set η, 1η.
92

6.2.4 File Request and File Size Distributions
A typical user can request for a random file out of the N available files in the centralized file server. The
probability pf that the typical user requests for a file f = 1, 2, . . . , N is assumed to follow a Mandelbrot-Zipf
(MZipf) distribution [151] given by:
pf =(f + τ)−δ∑Na=1(a+ τ)−δ
, 1 ≤ f ≤ N, f ∈ 1, 2, . . . , N, (6.4)
where τ denotes the Mandelbrot plateau factor and δ denotes the Zipf factor of the file popularity distribution.
The Mandelbrot plateau factor τ controls the tail of the distribution which becomes flattened as τ → ∞
and the Zipf factor δ controls the skewness of the distribution. When δ is high, i.e., 1 < δ < 2, the fraction
of requests for unique files is small and when δ is low, i.e., 0 < δ < 1, a high fraction of the requests is for
unique files.
The size of the file f ωf is modeled according to Pareto and lognormal probability distributions based on
experimental studies of file sizes in content distribution networks [89, 152, 90]. Under the Pareto distribution,
the pdf of ωf is given by [89, 152]:
εωf (uf ) =β
ξ
(ξ
uf + ξ
)β+1
, ξ, uf > 0, 0 < β ≤ 2, (6.5)
where β denotes the Pareto shape parameter which represents the tail index of the file size and ξ denotes
the Pareto scale parameter which represents the smallest file size that is determined by the file encoding
format. A low value of β indicates a high variance in the file size, for example, β = 0.5 generates a range of
ωf ∼ O(101)−O(105) GB. On the other hand, a high value of β results in a low variance in the file size, for
example, β = 1.9 generates a range of ωf ∼ O(101)−O(103) GB.
Similarly, the pdf of a Gamma file size distribution is expressed as [171]:
υωf (uf ) =u$−1f e−
ufκ
Γ($)κ$, $,κ > 0, uf ≥ κ, (6.6)
where Γ(.) denotes the complete Gamma function and $, κ are the shape parameter and the scale parameter
of the Gamma file size distribution, respectively.
6.2.5 Association Scheme and Signal Transmission Model
Assume that the typical user is located at the origin and requests for a file f . Denote a node type i where
i = b indicates a BS that stores the file f and i = u indicates a user that stores the file f . The typical user is
93

assumed to associate to the node type i that is in LOS and guarantees the maximum average received power
to enhance the received signal strength [49]. Let the BS and D2D association probabilities conditioned on
requesting for the file f be denoted as ζb,f and ζd,f , respectively. Denote the probability of caching the file
f in a BS as qb,f and the probability of caching the file f in a user as qu,f . Following similar derivations in
[49] and the thinning theorem for HPPPs [27], the expressions for ζb,f and ζd,f are given by:
ζb,f ≈qb,fλbP
2α
b
qb,fλbP2α
b + µqu,fλuP2αu
, (6.7a)
ζd,f ≈µqu,fλuP
2/αu
qb,fλbP2α
b + µqu,fλuP2αu
. (6.7b)
Based on the maximum received power-based association scheme [42], the pdfs of the link lengths in BS
and D2D association modes are given by:
gb,f (r) =2πqb,fλbr exp
(− π
(qb,fλb + µqu,fλu
(PuNuPbNb
) 2α
)r2)
1− exp(− πλbqb,fR2
L
) ×U(RL − r), (6.8a)
gu,f (r) =2πµqu,fλur ×U(rd − r)exp
(− π
(µqu,fλu + qb,fλb
(PbNbPuNu
) 2α
)r2)
(1− exp(−πµλuqu,fr2
d)) . (6.8b)
Remark. Observation of (6.7a) and (6.7b) validates the intuition that the fraction of users that request for
the file f and associate in BS mode decreases when the density of D2D transmitters that store the file f , i.e.,
µqu,fλu increases, and vice-versa. On the other hand, the fraction of users that request for the file f and
associate in D2D mode increases when the density of the D2D transmitters that store the file f increases,
and vice-versa.
After the association phase for the typical user, the next phase is the file symbol transmission phase.
The desired node type i is assumed to employ the linear precoding technique of maximum-ratio-transmission
(MRT) to service the typical user’s request. The feasibility of the MRT technique relies on the knowledge
of the channel state information at the desired BS or D2D transmitter, permitting the construction of the
channel precoder matrix that maximizes the transmitted symbol power. Based on the MRT technique with
equal power allocation to the transmitting antenna elements [172], the received baseband symbol vector for
the file f due to the node type i is given by:
94

yi,f =√PiH0W0ρ0xi,f +
∑j∈Φ
′i,f
√PiHjWjρjxj,f + n0, (6.9)
where xi,f is the Nu×1 symbol vector due to the desired node type i, yi,f is the Nu×1 symbol vector received
at the typical user, H0 is the Nu ×Nb channel matrix between the desired node type i and the typical user
and comprises i.i.d Nakagami random elements ho with shape parameter m, Wo = Ho† represents the
Nb ×Nu channel precoder matrix between the desired node type i and the typical user with ” † ” denoting
the conjugate transpose operator, ρ0 = Gb(ςx, ςy)Gu(ς)L(r0), where r0 is the link length between the desired
node type i and the typical user, and Pi is the transmit power of the desired node type i. On the other
hand, xj,f is the Nu × 1 symbol vector due to an interfering node j ∈ Φ′
i,f , where Φ′
i,f is the FHPPP of
nodes of type i which store the file f and interfere with the signal transmission. Hj is the Nu ×Nb channel
matrix between an interfering node type i and the typical user and comprises independent Nakagami random
elements hj, Wj = H†j represents the Nb ×Nu channel precoder matrix between the interfering node j of
type i and the typical user, ρj = Gj(ςx, ςy)Gu(ς)L(rj), where rj is the link length between the interfering
node j of type i and the typical user, and n0 is the Nu× 1 vector of thermal noise elements which comprises
i.i.d Gaussian random elements with variance equal to σ20 .
6.3 File Popularity and Size-aware Caching scheme
The discussion of the PSA caching scheme and its associated algorithms is provided in Chapter 5 of this
thesis and is omitted in this chapter. The dynamic programming with backtracking algorithm is adopted
for the file popularity and size-aware caching scheme in the subsequent analysis.
6.4 Performance Analysis
6.4.1 Analysis of Cache Hit Probability
The cache hit probability of a random file f out of the N available files is the probability that at least one
node type i within the network area B stores the file f . The expressions for the cache hit probability under
BS and D2D communication modes are respectively given by:
cb,f =1− e−πλbqb,fR2l , (6.10a)
cd,f =1− e−πµλuqu,fR2d , (6.10b)
95

where cb,f denotes the cellular (BS) cache hit probability for the file f and cd,f denotes the D2D cache
hit probability for the file f . Additionally, the average cache hit probability in BS or D2D association modes
is obtained by averaging over the requests for the N available files, i.e., ci =∑Nf=1 pfci,f .
6.4.2 Analysis of Average Achievable Rate Per Unit Bandwidth
The expression for the signal-to-interference-plus-noise ratio (SINR) κi,f at the typical user due to a node
type i that transmits the file f using MRT is given based on the signal transmission model of (6.9):
κi,f =Pi||H0W0||2ρ0∑
j∈Φ′i,fPi||HjWj ||2ρj + σ2
0
. (6.11)
The average achievable rate per unit bandwidth Ai,f for receiving the file f from the node type i is given
by:
Ai,f = E[
log2(1 + κi,f )], (6.12)
where the expectation operator E(.) is applied over the distributions of the desired and interfering channel
fading signals.
Theorem 6.1. The expression for the average achievable rate per unit bandwidth Ab,f when the typical user
receives the file f from the desired BS is:
Ab,f =1
ln(2)
∫ RL
0
∫ ∞0
(1−
(1 + zPbr−α
η
)−Nuη)Ω(z, r)e−zσ
20gb,f (r) dz dr, (6.13)
where Ω(z, r) is the Laplace transform term due to the interfering BSs which is given by:
Ω(z, r) = e
−πqb,fλbν
3
4dxdyd
dxν∫−dxν
dyν∫−dyν
dν∫−dν
[ ∫RLr
(1−(
1+zrαGb(ςx,ςy)Gu(ς)
ηxα
)−Nuη)x dx
]dςdςxdςy
. (6.14)
Similar expression in (6.13) applies to the average achievable rate per unit bandwidth for D2D communication
mode with the subscripts for the node type i = b being replaced by i = u.
Proof. See Appendix D.1.
Remark. Ω(z, r) decreases with increasing Nu, i.e., the number of user antenna elements as seen in (6.14),
96

which results in an increase in Ab,f as observed in (6.13). Also, increasing the BS density λb decreases
Ω(z, r) which negatively impacts Ab,f .
The average achievable rate per unit bandwidth for both BS and D2D communication modes is obtained
by considering the conditional probabilities for BS and D2D association and averaging over the requests for
files. Thus,
A =∑
i∈b,d
N∑f=1
pfci,fζi,f Ai,f . (6.15)
6.4.3 Analysis of Rate Coverage Probability and Successful Content Delivery
Probability
The rate coverage probability due to transmissions of the file f from a node type i is defined as the probability
that the rate per unit bandwidth Ai,f = log2(1 + κi,f ) is greater than a predefined rate threshold ψ for
decoding the file f [12], i.e,
Ri(ψ, f) = P(Ai,f > ψ) (6.16)
Theorem 6.2. The expression for the rate coverage probability for BS communication mode Rb(ψ, f) when
the typical user receives the file f from the desired BS is:
Rb(ψ, f) ≈ηNu∑n=1
(−1)n+1
∫ RL
0
(ηNun
)Lb(n%rα, γ
)exp
(− n%γσ2
0rα)gb,f (r) dr, (6.17)
where % = η(η!)−1η , γ = 2ψ − 1, and Lb
(n%rα, γ
)is the Laplace transform term due to the interference from
other BSs that transmit the file f which is expressed as:
Lb(s, γ)
= e
−πqb,fλbν
3
4dxdyd
dxν∫−dxν
dyν∫−dyν
dν∫−dν
[ ∫RLr
(1−(
1+nsγGb(ςx,ςy)Gu(ς)
ηxα
)−Nuη)x dx
]dςdςxdςy
, (6.18)
where s = n%rα. Similar expression in (6.17) applies to the rate coverage probability for D2D communication
mode with the subscripts for the node type i = b being replaced by i = u.
Proof. See Appendix D.2.
Remark. Similar to Ab,f , Rb(ψ, f) is enhanced by increasing Nu at a fixed value of the rate coverage
threshold, ψ because the Laplace transform term, Lb(s, γ)
decreases with increasing Nu.
97

The successful content delivery probability for both BS and D2D communication modes is obtained by
considering the conditional probabilities for BS and D2D association and averaging over the file requests.
Thus,
H(ψ) =∑
i∈b,d
N∑f=1
pfci,fζi,fRi(ψ, f) (6.19)
6.5 Evaluation Methodology and Discussion of Numerical Results
6.5.1 Evaluation Methodology
In this section, the numerical results are computed in Mathematica and are presented to evaluate the
performance of the PSA caching scheme and the impact of the device communication mode, device density,
and the large-scale antenna design on the network performance metrics. Moreover, the numerical results are
validated with the aid of Monte-Carlo simulations and benchmarked with the state-of-the-art probabilistic,
SWP-based, and MPC caching schemes. The assumed parameter values which are valid for realistic outdoor
mmWave networks are referenced from the existing works. The assumed values are listed in Table 6.2 and
are used unless otherwise stated.
Table 6.2: Values of System Parameters.
Notations Definition Assumed ValuesPb, Pu BS transmit power, user transmit
power30 dBm, 20 dBm [49]
λb, λu BS density, user density 1/(0.252π) km2, 20/(0.252π)km2, [49]fc, c, ν carrier frequency, speed of light, car-
rier wavelength28 GHz, 3× 10⁸ms−1, c
fcm [162]
α, η Path loss exponent, Nakagami shapeparameter
2.75, 3 [33, 49]
dx, dy, d, Nb, Nu Rectangular array horizontal antennaspacing, rectangular array verticalspacing, uniform linear array spacing,number of BS antenna elements, num-ber of user antenna elements
ν3 , ν
6 , 256 (= 8× 32), 16 [49, 169]
R, RL, rd Network radius, LOS range, D2D com-munication range
1000 m, 200 m, 75 m [47]
Mb, Mu, N, δ, τ Cache capacity of a BS, cache capacityof a user, number of files in file library,Zipf factor, Mandelbrot plateau factor
4 GB, 1 GB, 100, 0.4, 0 [46, 160, 163]
ξ, β, κ, $ Scale parameter of Pareto file size dis-tribution, shape parameter of Paretofile size distribution, scale parameter ofGamma file size distribution, shape pa-rameter of Gamma file size distribution
0.01 GB, 2.0, 0.01 GB, 2.0 [160]
98
6.5.2 Impact of the Device Density and Communication Mode on the Cache
Hit Probability
In Figs. 6.2a and 6.2b, the cellular cache hit probability is plotted versus the BS density under the Pareto
and Gamma file size distributions, respectively. As observed in the figures, the close match between the
analytical results and the simulations validates the accuracy of the numerical analysis. Further, going by
(6.10a), the cellular cache hit probability increases with the BS density for all the caching schemes because
more BSs are available to store the files and the PSA caching scheme achieves the highest cellular cache
hit probability under the Pareto file size distribution. On the other hand, the PSA scheme and the SWP-
based scheme exhibit similar performance in the cellular cache hit probability under the Gamma file size
distribution. The explanation of the behavior of the proposed and state-of-the-art schemes stems from the
choice of the algorithms and the parameters of the file size distribution. The PSA scheme makes use of the
dynamic programming with backtracking algorithm to determine the optimum aggregate popularity value
that corresponds to the largest combination of files that can be stored in a BS. The SWP-based scheme
uses the size-weighted-popularity metric as its objective function and relies on a greedy approach to store
the files without considering whether or not the aggregate popularity of the stored files gives the optimum
value. Moreover, when the variance in the file size distribution is large, as captured by β = 2.0 under the
Pareto file size distribution, a few files dominate the aggregate file size and the dynamic programming with
backtracking algorithm can exploit the wide variance to achieve a gain over the SWP-based scheme. On the
other hand, the Gamma file size distribution gives a smaller variance in the file size. Thus, the PSA and
SWP-based schemes achieve similar performance under the Gamma file size distribution. The probabilistic
and MPC caching schemes give sub-optimal performance because both schemes do not jointly consider the
impact of file size and file popularity in determining the set of stored files.
In Figs. 6.3a and 6.3b, the D2D cache hit probability is plotted versus the D2D partition factor under
the Pareto file size distribution and Gamma file size distribution, respectively. Similar to Figs. 6.2a and
6.2b, the D2D cache hit probability is monotonic with the D2D partition factor µ because increasing the
fraction of users that are potential D2D transmitters increases the number of users that can store a file.
The PSA scheme also leverages the wide variance of the Pareto file size distribution to achieve up to 20%
gain in the D2D cache hit probability compared to the probabilistic caching scheme which achieves the next
best performance. On the other hand, the achievable gain under the Gamma file size distribution is minimal
because of similar reasons explained under Fig. 6.2b.
99

0 10 20 30 40 50 60
Density of BSs (km-2
)
0
0.1
0.2
0.3
0.4
0.5
0.6
0.7
0.8
0.9
Cel
lula
r C
ach
e H
it P
rob
abil
ity
PSA
SWP
Probabilistic
MPC
Simulations
(a) Pareto file size distribution.
0 10 20 30 40 50 60
Density of BSs (km-2
)
0
0.1
0.2
0.3
0.4
0.5
0.6
0.7
0.8
0.9
1
Cel
lula
r C
ach
e H
it P
rob
abil
ity
PSA
SWP
Probabilistic
MPC
Simulations
(b) Gamma file size distribution.
Figure 6.2: Cellular cache hit probability vs. density of BSs.
0.1 0.2 0.3 0.4 0.5 0.6 0.7 0.8 0.9 1
D2D Partition Factor,
0.3
0.4
0.5
0.6
0.7
0.8
0.9
1
D2
D C
ach
e H
it P
rob
abil
ity
PSA
SWP
Probabilistic
MPC
Simulations
(a) Pareto file size distribution.
0.1 0.2 0.3 0.4 0.5 0.6 0.7 0.8 0.9 1
D2D Partition Factor,
0.3
0.4
0.5
0.6
0.7
0.8
0.9
1
D2
D C
ach
e H
it P
rob
abil
ity
PSA
SWP
Probabilistic
MPC
Simulations
(b) Gamma file size distribution.
Figure 6.3: D2D cache hit probability vs. D2D partition factor.
100

6.5.3 Impact of the BS Transmit Power and Number of BS Antenna Elements
on the Average Achievable Rate Per Unit Bandwidth
The impact of the BS transmit power and the number of BS antenna elements on the average achievable
rate per unit bandwidth of the mmWave cellular network is studied in this section. Figs. 6.4a and 6.4b
depict a linear monotonic behavior of the average achievable rate with the BS transmit power under the
Pareto and Gamma file size distributions, respectively. The equal power allocation scheme and the MRT
precoding technique ensures that the signals are coherently combined to maximize the transmitted symbol
power. Thus, the received SINR and average achievable rate per unit bandwidth are enhanced. On the other
hand, Figs. 6.5a and 6.5b show that the achievable rate per unit bandwidth increases logarithmically with
the number of antenna elements. The logarithmic behavior stems from the fact that the BS transmit power
is divided equally among the number of antenna elements, hence, the transmit power of each symbol stream
reduces as the number of BS antenna elements increases.
10 15 20 25 30 35 40 45 50
BS Transmit Power (dBm)
0.8
1
1.2
1.4
1.6
1.8
2
2.2
Av
erag
e A
chie
vab
le R
ate
(b/s
/Hz)
PSA
SWP
Probabilistic
MPC
Simulations
(a) Pareto file size distribution.
10 15 20 25 30 35 40 45 50
BS Transmit Power (dBm)
1
1.5
2
2.5
3
3.5
Av
erag
e A
chie
vab
le R
ate
(b/s
/Hz)
PSA
SWP
Probabilistic
MPC
Simulations
(b) Gamma file size distribution.
Figure 6.4: Average achievable rate per unit bandwidth vs. BS transmit power.
6.5.4 Impact of the Rate Threshold and BS Density on the Successful Content
Delivery Probability
In Figs. 6.6a and 6.6b, the successful content delivery probability is plotted versus the rate threshold for
the Pareto and Gamma file size distributions, respectively. The successful content delivery probability is
controlled by the rate coverage probability as seen in (6.16). The fraction of users whose received rate is
101

0 500 1000 1500 2000 2500
Number of BS Antenna Elements
1.5
1.55
1.6
1.65
1.7
1.75
1.8A
ver
age
Ach
iev
able
Rat
e p
er u
nit
Ban
dw
idth
(b
/s/H
z) PSA
SWP
Probabilistic
MPC
Simulations
(a) Pareto file size distribution.
0 500 1000 1500 2000 2500
Number of BS Antenna Elements
1
1.2
1.4
1.6
1.8
2
2.2
2.4
Av
erag
e A
chie
vab
le R
ate
per
un
it B
and
wid
th (
b/s
/Hz)
PSA
SWP
Probabilistic
MPC
Simulations
(b) Gamma file size distribution.
Figure 6.5: Average achievable rate per unit bandwidth vs. number of BS antenna elements for Pb = 30dBm
greater than the rate threshold decreases as the rate threshold increases which also decreases the successful
content delivery probability. On the other hand, Figs. 6.7a and 6.7b depict a concave behavior of the
successful content delivery probability with the BS density. When the BS density is low (< 25/km2), the
availability of more BSs gives rise to a higher cache hit probability, thus, positively impacting the performance
of the successful content delivery probability. In contrast, in the high BS density regime (> 25/km2), the
network becomes interference limited and the successful content delivery probability becomes negatively
impacted.
6.6 Summary
This chapter presented the performance analysis of the file popularity and size-aware caching scheme in a
cache-enabled mmWave cellular network with D2D communications and large-scale antenna arrays. The
impacts of the system design parameters including file size distribution, transmit power, antenna design,
and device communication modes on the system performance were studied. The findings in this chapter
prove that a significant gain in the successful content delivery probability can be realized provided there is
a wide variance in the file size distribution and a sparse distribution of transmitting nodes. In addition,
linear precoding schemes such as MRT can exploit transmit diversity to achieve linear gains in the average
achievable rate of a cache-enabled mmWave cellular network with D2D communication provided the number
of transmit antenna elements is on the order of several hundreds.
102

1 2 3 4 5 6 7 8 9 10
Rate Threshold (b/s/Hz)
0.2
0.3
0.4
0.5
0.6
0.7
0.8
0.9
1
1.1
Su
cces
sfu
l C
on
ten
t D
eliv
ery
Pro
bab
ilit
y
PSA
SWP
Probabilistic
MPC
Simulations
(a) Pareto file size distribution.
1 2 3 4 5 6 7 8 9 10
Rate Threshold (b/s/Hz)
0.1
0.2
0.3
0.4
0.5
0.6
0.7
0.8
Su
cces
sfu
l C
on
ten
t D
eliv
ery
Pro
bab
ilit
y
PSA
SWP
Probabilistic
MPC
Simulations
(b) Gamma file size distribution.
Figure 6.6: Successful content delivery probability vs. rate threshold.
5 10 15 20 25 30 35 40 45 50
Density of BSs (km-2
)
0.38
0.4
0.42
0.44
0.46
0.48
0.5
0.52
0.54
Su
cces
sfu
l C
on
ten
t D
eliv
ery
Pro
bab
ilit
y
PSA
SWP
Probabilistic
MPC
Simulations
(a) Pareto file size distribution.
5 10 15 20 25 30 35 40 45 50
Density of BSs (km-2
)
0.78
0.8
0.82
0.84
0.86
0.88
0.9
0.92
Su
cces
sfu
l C
on
ten
t D
eliv
ery
Pro
bab
ilit
y
PSA
SWP
Probabilistic
MPC
Simulations
(b) Gamma file size distribution.
Figure 6.7: Successful content delivery probability vs. density of BSs.
103

Chapter 7
Conclusions
This chapter highlights the main conclusions that are derived from the findings in this thesis. In addition,
the engineering significance of the findings and suggestions for future work are provided.
7.1 Major Research Findings
The primary objective of this thesis is the proposal of an association scheme and a caching scheme in a
HetNet where file requests can be serviced by multiple BSs or neighboring users. The numerical results
and simulations demonstrate the efficacy of the proposed schemes in enhancing the SE, EE, and successful
delivery of files in a HetNet where users can request random files.
Specifically, the objectives of this thesis are realized by proposing an interference-aware, D2D distance
threshold-based association scheme and a goal attainment algorithm. The numerical results show that the
interference-aware, D2D distance threshold-based association scheme achieves up to 67% increase in area
SE and EE of a D2D-enabled mmWave cellular network when compared to the state-of-the-art minimum
path loss-based and maximum average received power-based association schemes. Further, in a HetNet with
device clustering, employing a mixed FD/HD D2D strategy achieves up to 60% gain in the cluster average
SE compared to FD-only and HD-only strategies.
Lastly, a PSA caching scheme is proposed and analyzed under a hybrid HetNet operating in the microwave
and millimeter wave bands. By employing dynamic programming and branch and bound-based algorithms,
the proposed PSA caching scheme achieves up to 17% gain in the average success probability compared
to the state-of-the-art SWP-based, probabilistic, and MPC caching schemes. A cooperative transmission
design with coded caching can realize up to 20% increase in the average success probability compared to a
cooperative transmission design without coded caching. Besides, a deployment of BSs with several hundreds
104

of transmit antenna elements assures a linear gain in the average achievable rate of a HetNet with cellular
and D2D transmissions.
Chapter 3 presents an analytical framework for studying the performance of a HetNet with D2D com-
munications where user devices in a cluster are capable of caching popular content. Assuming spatially
randomly distributed D2D users in the cluster where the users request for content according to the Zipf dis-
tribution, analytical expressions are derived for the device communication probability, coverage probability,
cluster average SE, and content average download latency of the system. The system performance metrics
are derived for the three user device operating modes of FD-only mode, HD-only mode, and mixed FD/HD
mode. The numerical results show that the mixed FD/HD mode is the most appropriate communication
mode for cache-enabled D2D networks to achieve the highest cluster average SE and low content average
download latency.
In Chapter 4, the SE and EE performance of a mmWave HetNet is studied where a user device can
associate with a BS or another user for D2D communication based on an interference-aware, D2D distance
threshold. Using the tools of stochastic geometry, the mean interference, coverage probability, area SE, and
network EE are derived under the proposed association scheme. Moreover, the performance of the pro-
posed association scheme is compared with the performance of the minimum path loss-based and maximum
received power-based association schemes. The proposed association scheme is shown to give the best cover-
age probability performance in noise-limited networks, while the three schemes converge in performance in
interference-limited networks in the high coverage threshold regime. Further, the proposed scheme achieves
up to 67% increase in the area SE and EE compared to the minimum path loss-based scheme that gives the
next best performance. Besides, a goal attainment algorithm is proposed that achieves up to a seven-fold
decrease in the mean deviation from a preset SE objective and 50% savings in EE, compared to the achievable
performance under a constant transmit power and bandwidth allocation scheme.
Chapter 5 proposes and analyzes the performance of a PSA caching scheme in a hybrid HetNet. The
HetNet comprises a microwave-based macro BS tier, a mmWave-based pico BS tier, and a user tier whose
locations form independent HPPPs. Additionally, files available at a file server have sizes that are assumed
to follow Pareto and lognormal distributions based on studies on the file size statistics in servers. During a
caching session, the set of files that are stored in a BS is found as a solution to a 0-1 KP problem such that
the largest set of popular files whose combined size does not exceed the BS cache capacity is stored. Dynamic
programming and branch and bound-based algorithms are proposed to solve the 0-1 KP and the numerical
results achieve up to 17% gain in the average success probability compared to the state-of-the-art SWP-
based and popularity-based caching schemes. Also, cooperative transmission with coded caching is shown
to provide up to 20% gain in the success probability of the pico BS tier when compared to a cooperative
105

transmission scheme without coded caching.
Chapter 6 investigates the performance of the PSA caching scheme in a cache-enabled mmWave cellu-
lar HetNet with D2D communication and large scale antenna arrays. The mmWave HetNet comprises a
centralized file server, BSs, and users whose locations form independent FHPPPs. Moreover, the Gamma
distribution is adopted as an additional file size distribution according to recent studies. The analytical
expressions for the cache hit probability and successful content delivery probability are derived using the
tools of stochastic geometry and verified with the aid of simulations. The results show that the PSA caching
scheme can achieve up to 20% gain in the cache hit probability compared to the state-of-the-art schemes.
By employing maximum-ratio-transmission, the numerical results display a significant gain in the successful
content delivery probability when the density of BSs is small. Chapter 6 concludes with a study of the
impact of the large scale antenna arrays on the average achievable rate of the HetNet.
7.2 Engineering Significance of Findings
The research topics of this thesis address the various design issues that pertain to the coordination of caching
and delivery mechanisms in a HetNet with limited backhaul and storage capability. In this regard, the
proposed research presents a holistic understanding of the impact of the physical layer parameters including
path loss, fading, channel propagation, and directional beamforming in conjunction with the file request and
file size distributions.
The co-existence between cellular and D2D communications is vital to leverage the wide bandwidth
and highly directional characteristics of mmWave bands. Moreover, the densification of cells via small
cells and device clustering in wireless hotspots require short-range D2D communication. Thus, the D2D
communication mode, cluster size, and the number of cached files are important parameters to consider
when maximizing the average SE and minimizing the delivery latency of user requests.
D2D communications that occur between proximate devices will be adversely affected if the interference
between concurrent transmissions is not carefully managed. Thus, the selection of the maximum D2D range
and the extent to which the physical propagation characteristics affect the D2D range is non-trivial in
enhancing the SE and EE of a D2D-enabled HetNet. Besides, to cope with the system design variables
that are changing and not within the control of the network designer, e.g., wireless channel, blockage, user
mobility, etc., joint optimization of SE and EE via an algorithm that adapts the bandwidth fraction and
transmit power to the system conditions is a necessity.
The exponential growth in the demand of content which is unmatched by the storage capability of HetNets
requires the employment of caching schemes that are content-aware. Specifically, the problem of which files
106

to cache to maximize the average successful content delivery requires algorithms that jointly account for the
file size and file popularity statistics. Moreover, joint transmission of files from multiple BSs can exploit
the redundancy in cached content to improve the average achievable rate. Large scale antenna arrays can
activate transmit diversity gains which can result in substantial performance gains of a HetNet.
The application of the proposed techniques and protocols in this thesis requires the reuse of existing
protocols and enhancements to the LTE radio access network (RAN) and core network infrastructure. First,
the coexistence between cellular and D2D communications is defined under LTE ProSe [173, 174]. LTE
ProSe provides network-assisted discovery of users in close proximity and direct communication between
users without network assistance. However, the adoption of ProSe among mobile phone manufacturers
is not widespread because of the requirement to upgrade existing phone chipsets which comes at a cost,
coupled with the high reliability of existing LTE cellular infrastructure which serves existing customer needs.
Notwithstanding, LTE ProSe is a good candidate to leverage the availability of cheap device memory and to
address the growth in ultra-low latency applications.
Second, the file PSA caching scheme of this thesis requires significant signaling overhead which is not
feasible with the conventional LTE RAN and core network architectures. LTE employs a distributed control
mechanism over the X2 interface between LTE eNodeBs, whereas the feasibility of the file PSA caching
scheme requires knowledge of the global network parameters at a centralized server. Thus, the present LTE
network will require an enhanced core network infrastructure that can support the processing of large-scale
signaling data. Besides, ultra-high bandwidth links are necessary to facilitate high-speed data exchange over
the S1 interface between the LTE RAN and core network elements.
7.3 Suggestions for Future Work
The present thesis has considered several physical layer and caching layer design variables that affect the SE
and EE performance of a cache-enabled HetNet with D2D communications. However, some open problems
and future research directions are suggested in the following:
• The current research assumes prior knowledge of the file size and file popularity distributions for the
available files in a HetNet. The proposal of learning algorithms for HetNets without prior knowledge
of the file size and file popularity is a proposed future research direction.
• The PSA caching scheme of this thesis determines the optimal set of files and stores the same set of files
in all the BS caches. In this regard, the extension of the PSA caching scheme to allow the storage of
non-overlapping sets of files to realize caching diversity gains is suggested as a future research direction.
107

• Lastly, the combination of coded caching with cooperative transmission design to exploit multicasting
opportunities under a PSA scheme with non-overlapping file storage has not been addressed and is
suggested as a future research direction.
108

Bibliography
[1] G. M. D. T. Forecast, “Cisco visual networking index: global mobile data traffic forecast update,2017–2022,” Update, vol. 2017, p. 2022, 2019.
[2] R. Li, K. Matsuzono, H. Asaeda, and X. Fu, “Achieving High Throughput for Heterogeneous Net-works with Consecutive Caching and Adaptive Retrieval,” IEEE Transactions on Network Scienceand Engineering, 2020.
[3] Q. Fan and N. Ansari, “Towards throughput aware and energy aware traffic load balancing in het-erogeneous networks with hybrid power supplies,” IEEE Transactions on Green Communications andNetworking, vol. 2, no. 4, pp. 890–898, 2018.
[4] K. Zhang, Y. Mao, S. Leng, Q. Zhao, L. Li, X. Peng, L. Pan, S. Maharjan, and Y. Zhang, “Energy-efficient offloading for mobile edge computing in 5G heterogeneous networks,” IEEE access, vol. 4, pp.5896–5907, 2016.
[5] A. Damnjanovic, J. Montojo, Y. Wei, T. Ji, T. Luo, M. Vajapeyam, T. Yoo, O. Song, and D. Malladi,“A survey on 3GPP heterogeneous networks,” IEEE Wireless communications, vol. 18, no. 3, pp.10–21, 2011.
[6] G. Nigam, P. Minero, and M. Haenggi, “Coordinated multipoint joint transmission in heterogeneousnetworks,” IEEE Transactions on Communications, vol. 62, no. 11, pp. 4134–4146, 2014.
[7] W. Nie, F.-C. Zheng, X. Wang, W. Zhang, and S. Jin, “User-centric cross-tier base station clusteringand cooperation in heterogeneous networks: Rate improvement and energy saving,” IEEE Journal onSelected Areas in Communications, vol. 34, no. 5, pp. 1192–1206, 2016.
[8] G. R. A. N. W. Group et al., “Study on channel model for frequencies from 0.5 to 100 GHz (release15),” 3GPP TR 38.901, Tech. Rep., 2018.
[9] S. Rangan, T. S. Rappaport, and E. Erkip, “Millimeter wave cellular wireless networks: Potentials andchallenges,” Proceedings of the IEEE, vol. 102, pp. 366–385, 2014.
[10] S. Sun, T. S. Rappaport, M. Shafi, P. Tang, J. Zhang, and P. J. Smith, “Propagation models andperformance evaluation for 5G millimeter-wave bands,” IEEE Transactions on Vehicular Technology,vol. 67, no. 9, pp. 8422–8439, 2018.
[11] T. Bai, R. Vaze, and R. W. Heath, “Analysis of blockage effects on urban cellular networks,” IEEETransactions on Wireless Communications, vol. 13, no. 9, pp. 5070–5083, 2014.
[12] J. G. Andrews, T. Bai, M. N. Kulkarni, A. Alkhateeb, A. K. Gupta, and R. W. Heath, “Modeling andanalyzing millimeter wave cellular systems,” IEEE Transactions on Communications, vol. 65, no. 1,pp. 403–430, 2016.
[13] A. Asadi, Q. Wang, and V. Mancuso, “A survey on device-to-device communication in cellular net-works,” IEEE Communications Surveys & Tutorials, vol. 16, no. 4, pp. 1801–1819, 2014.
109

[14] Z. Guizani and N. Hamdi, “mmwave E-Band D2D communications for 5G-underlay networks: Effectof power allocation on D2D and cellular users throughputs,” in 2016 IEEE Symposium on Computersand Communication (ISCC). IEEE, 2016, pp. 114–118.
[15] E. Turgut and M. C. Gursoy, “Uplink performance analysis in D2D-enabled mmwave cellular networks,”in 2017 IEEE 86th Vehicular Technology Conference (VTC-Fall). IEEE, 2017, pp. 1–5.
[16] M. A. Abana, M. Peng, Z. Zhao, and L. A. Olawoyin, “Coverage and rate analysis in heterogeneouscloud radio access networks with device-to-device communication,” IEEE Access, vol. 4, pp. 2357–2370,2016.
[17] D. Malak, M. Al-Shalash, and J. G. Andrews, “Spatially correlated content caching for device-to-devicecommunications,” IEEE Transactions on Wireless Communications, vol. 17, no. 1, pp. 56–70, 2017.
[18] M. Afshang, H. S. Dhillon, and P. H. J. Chong, “Modeling and performance analysis of clustered device-to-device networks,” IEEE Transactions on Wireless Communications, vol. 15, no. 7, pp. 4957–4972,2016.
[19] ——, “Fundamentals of cluster-centric content placement in cache-enabled device-to-device networks,”IEEE Transactions on Communications, vol. 64, no. 6, pp. 2511–2526, 2016.
[20] X. Song, Y. Geng, X. Meng, J. Liu, W. Lei, and Y. Wen, “Cache-enabled device to device networkswith contention-based multimedia delivery,” IEEE Access, vol. 5, pp. 3228–3239, 2017.
[21] C. Yang, Y. Yao, Z. Chen, and B. Xia, “Analysis on cache-enabled wireless heterogeneous networks,”IEEE Transactions on Wireless Communications, vol. 15, no. 1, pp. 131–145, 2015.
[22] N. Golrezaei, A. G. Dimakis, and A. F. Molisch, “Scaling behavior for device-to-device communicationswith distributed caching,” IEEE Transactions on information Theory, vol. 60, no. 7, pp. 4286–4298,2014.
[23] A. Papazafeiropoulos and T. Ratnarajah, “Modeling and performance of uplink cache-enabled massiveMIMO heterogeneous networks,” IEEE Transactions on Wireless Communications, vol. 17, no. 12, pp.8136–8149, 2018.
[24] X. Wei, L. Xiang, L. Cottatellucci, T. Jiang, and R. Schober, “Cache-Aided Massive MIMO: LinearPrecoding Design and Performance Analysis,” in ICC 2019-2019 IEEE International Conference onCommunications (ICC). IEEE, 2019, pp. 1–7.
[25] J. G. Andrews, A. K. Gupta, and H. S. Dhillon, “A primer on cellular network analysis using stochasticgeometry,” arXiv preprint arXiv:1604.03183, 2016.
[26] M. Haenggi, Stochastic geometry for wireless networks. Cambridge University Press, 2012.
[27] M. Haenggi, J. G. Andrews, F. Baccelli, O. Dousse, and M. Franceschetti, “Stochastic geometry andrandom graphs for the analysis and design of wireless networks,” IEEE Journal on Selected Areas inCommunications, vol. 27, no. 7, pp. 1029–1046, 2009.
[28] N. Deng, W. Zhou, and M. Haenggi, “The ginibre point process as a model for wireless networks withrepulsion,” IEEE Transactions on Wireless Communications, vol. 14, no. 1, pp. 107–121, 2014.
[29] M. Afshang, C. Saha, and H. S. Dhillon, “Nearest-neighbor and contact distance distributions forthomas cluster process,” IEEE Wireless Communications Letters, vol. 6, no. 1, pp. 130–133, 2016.
[30] M. Afshang and H. S. Dhillon, “Fundamentals of modeling finite wireless networks using binomialpoint process,” IEEE Transactions on Wireless Communications, vol. 16, no. 5, pp. 3355–3370, 2017.
[31] ——, “Spatial modeling of device-to-device networks: Poisson cluster process meets poisson hole pro-cess,” in 2015 49th Asilomar Conference on Signals, Systems and Computers. IEEE, 2015, pp.317–321.
110
[32] T. Bai and R. W. Heath, “Coverage in dense millimeter wave cellular networks,” in 2013 AsilomarConference on Signals, Systems and Computers. IEEE, 2013, pp. 2062–2066.
[33] ——, “Coverage and rate analysis for millimeter-wave cellular networks,” IEEE Transactions on Wire-less Communications, vol. 14, no. 2, pp. 1100–1114, 2015.
[34] S. Niknam, B. Natarajan, and R. Barazideh, “Interference analysis for finite-area 5g mmwave networksconsidering blockage effect,” IEEE Access, vol. 6, pp. 23 470–23 479, 2018.
[35] S. Niknam, R. Barazideh, and B. Natarajan, “Cross-layer interference modeling for 5g mmwave net-works in the presence of blockage,” in 2018 IEEE 88th Vehicular Technology Conference (VTC-Fall).IEEE, 2018, pp. 1–5.
[36] M. Naslcheraghi, S. A. Ghorashi, and M. Shikh-Bahaei, “FD device-to-device communication for wire-less video distribution,” Iet Communications, vol. 11, no. 7, pp. 1074–1081, 2017.
[37] ——, “Full-duplex device-to-device collaboration for low-latency wireless video distribution,” in 201724th International conference on telecommunications (ICT). IEEE, 2017, pp. 1–5.
[38] ——, “Performance analysis of inband FD-D2D communications with imperfect si cancellation forwireless video distribution,” in 2017 8th international conference on the network of the future (NOF).IEEE, 2017, pp. 176–181.
[39] E. Turgut and M. C. Gursoy, “Coverage in heterogeneous downlink millimeter wave cellular networks,”IEEE Transactions on Communications, vol. 65, no. 10, pp. 4463–4477, 2017.
[40] S. Kusaladharma and C. Tellambura, “Interference and outage in random d2d networks under mil-limeter wave channels,” in 2017 IEEE International Conference on Communications (ICC). IEEE,2017, pp. 1–7.
[41] S. Kusaladharma, Z. Zhang, and C. Tellambura, “Interference and outage analysis of random D2Dnetworks underlaying millimeter-wave cellular networks,” IEEE Transactions on Communications,vol. 67, no. 1, pp. 778–790, 2018.
[42] H.-S. Jo, Y. J. Sang, P. Xia, and J. G. Andrews, “Heterogeneous cellular networks with flexible cellassociation: A comprehensive downlink SINR analysis,” IEEE Transactions on Wireless Communica-tions, vol. 11, no. 10, pp. 3484–3495, 2012.
[43] T. Bai and R. W. Heath, “Coverage and rate analysis for millimeter-wave cellular networks,” IEEETransactions on Wireless Communications, vol. 14, no. 2, pp. 1100–1114, 2014.
[44] S. Singh, M. N. Kulkarni, A. Ghosh, and J. G. Andrews, “Tractable model for rate in self-backhauledmillimeter wave cellular networks,” IEEE Journal on Selected Areas in Communications, vol. 33, no. 10,pp. 2196–2211, 2015.
[45] J. G. Andrews, T. Bai, M. N. Kulkarni, A. Alkhateeb, A. K. Gupta, and R. W. Heath, “Modeling andanalyzing millimeter wave cellular systems,” IEEE Transactions on Communications, vol. 65, no. 1,pp. 403–430, 2017.
[46] Q. Li, W. Shi, Y. Xiao, X. Ge, and A. Pandharipande, “Content size-aware edge caching: A size-weighted popularity-based approach,” in 2018 IEEE Global Communications Conference (GLOBE-COM). IEEE, 2018, pp. 206–212.
[47] Z. Chen, N. Pappas, and M. Kountouris, “Probabilistic caching in wireless D2D networks: Cache hitoptimal versus throughput optimal,” IEEE Communications Letters, vol. 21, no. 3, pp. 584–587, 2016.
[48] B. Blaszczyszyn and A. Giovanidis, “Optimal geographic caching in cellular networks,” in 2015 IEEEinternational conference on communications (ICC). IEEE, 2015, pp. 3358–3363.
111

[49] W. Yi, Y. Liu, and A. Nallanathan, “Cache-enabled hetnets with millimeter wave small cells,” IEEETransactions on Communications, vol. 66, no. 11, pp. 5497–5511, 2018.
[50] K. T. Hemachandra, O. Ochia, and A. O. Fapojuwo, “Performance study on cache enabled full-duplex device-to-device networks,” in 2018 IEEE Wireless Communications and Networking Con-ference (WCNC). IEEE, 2018, pp. 1–6.
[51] O. E. Ochia and A. O. Fapojuwo, “Energy and spectral efficiency analysis for a device-to-device-enabledmillimeter-wave OFDMA cellular network,” IEEE Transactions on Communications, vol. 67, no. 11,pp. 8097–8111, 2019.
[52] S. Antipolis, “3rd generation partnership project; Technical specification group SA; Feasibility studyfor Proximity Services (ProSe)(Release 12),” 3GPP TR 22.803 V1. 0.0, 2012.
[53] Z. Liu, T. Peng, H. Chen, and W. Wang, “Optimal D2D user allocation over multi-bands underheterogeneous networks,” in 2012 IEEE global communications conference (GLOBECOM). IEEE,2012, pp. 1339–1344.
[54] X. Lin, J. G. Andrews, and A. Ghosh, “A comprehensive framework for device-to-device communica-tions in cellular networks,” CoRR, vol. abs/1305.4219, 2013.
[55] Y. Chen, B. Ai, Y. Niu, R. He, Z. Zhong, and Z. Han, “Resource allocation for device-to-device commu-nications in multi-cell multi-band heterogeneous cellular networks,” IEEE Transactions on VehicularTechnology, vol. 68, no. 5, pp. 4760–4773, 2019.
[56] J. Bukhari and W. Yoon, “Simulated view of SDN based multicasting over D2D enabled heterogeneouscellular networks,” in 2019 16th International Bhurban Conference on Applied Sciences and Technology(IBCAST). IEEE, 2019, pp. 926–929.
[57] M. Chen, L. Wang, J. Chen, Y. Liu, and L. Zhou, “Analysis and scheduling for cooperative contentdelivery in 5G heterogeneous networks,” in 2018 IEEE International Conference on CommunicationsWorkshops (ICC Workshops). IEEE, 2018, pp. 1–6.
[58] S. Zeng, C. Wang, C. Qin, and W. Wang, “Interference alignment assisted by D2D communication forthe downlink of MIMO heterogeneous networks,” IEEE Access, vol. 6, pp. 24 757–24 766, 2018.
[59] F. Jiang, Y. Liu, B. Wang, and X. Wang, “A relay-aided device-to-device-based load balancing schemefor multitier heterogeneous networks,” IEEE Internet of Things Journal, vol. 4, no. 5, pp. 1537–1551,2017.
[60] J. Liu, G. Wu, S. Xiao, X. Zhou, G. Y. Li, S. Guo, and S. Li, “Joint power allocation and userscheduling for device-to-device-enabled heterogeneous networks with non-orthogonal multiple access,”IEEE Access, vol. 7, pp. 62 657–62 671, 2019.
[61] X. Wu and Z. Ma, “Modeling and performance analysis of cellular and device-to-device heterogeneousnetworks,” in 2017 IEEE Globecom Workshops (GC Wkshps). IEEE, 2017, pp. 1–6.
[62] I. O. Sanusi, K. M. Nasr, and K. Moessner, “Channel assignment and power control for D2D-enabledcellular networks,” in 2019 International Conference on Computing, Electronics & CommunicationsEngineering (iCCECE). IEEE, 2019, pp. 225–228.
[63] M. Kamruzzaman, N. I. Sarkar, J. Gutierrez, and S. K. Ray, “A mode selection algorithm for mitigatinginterference in D2D enabled next-generation heterogeneous cellular networks,” in 2019 InternationalConference on Information Networking (ICOIN). IEEE, 2019, pp. 131–135.
[64] A. Galanopoulos, F. Foukalas, and T. Khattab, “Energy efficient spectrum allocation and mode selec-tion for D2D communications in heterogeneous networks,” IEEE Transactions on Signal and Informa-tion Processing over Networks, vol. 6, pp. 382–393, 2020.
112
[65] Y. Niu, L. Yu, Y. Li, Z. Zhong, and B. Ai, “Device-to-device communications enabled multicastscheduling for mmwave small cells using multi-level codebooks,” IEEE Transactions on VehicularTechnology, vol. 68, no. 3, pp. 2724–2738, 2018.
[66] H. Elshaer, M. N. Kulkarni, F. Boccardi, J. G. Andrews, and M. Dohler, “Downlink and uplinkcell association with traditional macrocells and millimeter wave small cells,” IEEE Transactions onWireless Communications, vol. 15, no. 9, pp. 6244–6258, 2016.
[67] E. Bastug, M. Bennis, and M. Debbah, “Living on the edge: The role of proactive caching in 5Gwireless networks,” IEEE Communications Magazine, vol. 52, no. 8, pp. 82–89, 2014.
[68] D. Liu and C. Yang, “Cache-enabled heterogeneous cellular networks: Comparison and tradeoffs,” in2016 IEEE International Conference on Communications (ICC). IEEE, 2016, pp. 1–6.
[69] G. Quer, I. Pappalardo, B. D. Rao, and M. Zorzi, “Proactive caching strategies in heterogeneousnetworks with device-to-device communications,” IEEE Transactions on Wireless Communications,vol. 17, no. 8, pp. 5270–5281, 2018.
[70] J. Elias and B. B laszczyszyn, “Optimal geographic caching in cellular networks with linear contentcoding,” in 2017 15th International Symposium on Modeling and Optimization in Mobile, Ad Hoc, andWireless Networks (WiOpt). IEEE, 2017, pp. 1–6.
[71] G. Shan and Q. Zhu, “Sociality and mobility-based caching strategy for device-to-device communica-tions underlying heterogeneous networks,” IEEE Access, vol. 7, pp. 53 777–53 791, 2019.
[72] P. Xu, S. Cai, and H. Zhu, “Collaborative hierarchical caching strategy in D2D-enabled heterogeneousnetworks,” in 2018 IEEE/CIC International Conference on Communications in China (ICCC). IEEE,2018, pp. 578–582.
[73] M. S. H. Abad, E. Ozfatura, O. Ercetin, and D. Gunduz, “Dynamic content updates in heterogeneouswireless networks,” in 2019 15th Annual Conference on Wireless On-demand Network Systems andServices (WONS). IEEE, 2019, pp. 107–110.
[74] X. Zhang, T. Lv, Y. Ren, W. Ni, N. C. Beaulieu, and Y. J. Guo, “Economical caching for scalablevideos in cache-enabled heterogeneous networks,” IEEE Journal on Selected Areas in Communications,vol. 37, no. 7, pp. 1608–1621, 2019.
[75] C. Fan, T. Zhang, Y. Liu, and Z. Zeng, “Backhaul aware analysis of cache-enabled heterogeneousnetworks,” in 2019 IEEE 30th Annual International Symposium on Personal, Indoor and Mobile RadioCommunications (PIMRC). IEEE, 2019, pp. 1–7.
[76] J. Yang, C. Ma, B. Jiang, G. Ding, G. Zheng, and H. Wang, “Joint optimization in cached-enabledheterogeneous network for efficient industrial iot,” IEEE Journal on Selected Areas in Communications,vol. 38, no. 5, pp. 831–844, 2020.
[77] S. Krishnendu, B. Bharath, and V. Bhatia, “Cache enabled cellular network: Algorithm for cacheplacement and guarantees,” IEEE Wireless Communications Letters, vol. 8, no. 6, pp. 1550–1554,2019.
[78] R. Chai, Y. Li, and Q. Chen, “Joint cache partitioning, content placement, and user association forD2D-enabled heterogeneous cellular networks,” IEEE Access, vol. 7, pp. 56 642–56 655, 2019.
[79] M. Liu, Y. Teng, K. Cheng, Y. Man, and B. Zhang, “Joint content caching and delivery policy forheterogeneous cellular networks,” in 2018 IEEE 29th Annual International Symposium on Personal,Indoor and Mobile Radio Communications (PIMRC). IEEE, 2018, pp. 1–5.
[80] F. Chiu, T.-Y. Kuo, F.-T. Chien, W.-J. Huang, and M.-K. Chang, “Joint user clustering and contentcaching with heterogeneous user content preferences,” in 2019 53rd Asilomar Conference on Signals,Systems, and Computers. IEEE, 2019, pp. 1314–1317.
113

[81] E. Ozfatura and D. Gunduz, “Mobility and popularity-aware coded small-cell caching,” IEEE Com-munications Letters, vol. 22, no. 2, pp. 288–291, 2017.
[82] B. Hu, Y. Chen, Z. Huang, N. A. Mehta, and J. Pan, “Intelligent caching algorithms in heteroge-neous wireless networks with uncertainty,” in 2019 IEEE 39th International Conference on DistributedComputing Systems (ICDCS). IEEE, 2019, pp. 1549–1558.
[83] T. Nie, J. Luo, L. Gao, F.-C. Zheng, and L. Yu, “Cooperative edge caching in small cell networks withheterogeneous channel qualities,” in 2020 IEEE 91st Vehicular Technology Conference (VTC2020-Spring). IEEE, 2020, pp. 1–6.
[84] M. Ma and V. W. Wong, “Age of information driven cache content update scheduling for dynamiccontents in heterogeneous networks,” IEEE Transactions on Wireless Communications, 2020.
[85] D. Liu, B. Chen, C. Yang, and A. F. Molisch, “Caching at the wireless edge: design aspects, challenges,and future directions,” IEEE Communications Magazine, vol. 54, no. 9, pp. 22–28, 2016.
[86] D. Liu and C. Yang, “Caching policy toward maximal success probability and area spectral efficiencyof cache-enabled hetnets,” IEEE Transactions on Communications, vol. 65, no. 6, pp. 2699–2714, 2017.
[87] Y. Zhu, G. Zheng, L. Wang, K.-K. Wong, and L. Zhao, “Content placement in cache-enabled sub-6GHz and millimeter-wave multi-antenna dense small cell networks,” IEEE Transactions on WirelessCommunications, vol. 17, no. 5, pp. 2843–2856, 2018.
[88] Y. Zhu, G. Zheng, K.-K. Wong, S. Jin, and S. Lambotharan, “Performance analysis of cache-enabledmillimeter wave small cell networks,” IEEE Transactions on Vehicular Technology, vol. 67, no. 7, pp.6695–6699, 2018.
[89] D. G. Feitelson, Workload modeling for computer systems performance evaluation. Cambridge Uni-versity Press, 2015.
[90] C. Gros, G. Kaczor, and D. Markovic, “Neuropsychological constraints to human data production ona global scale,” The European Physical Journal B, vol. 85, no. 1, p. 28, 2012.
[91] Q. Cui, H. Wang, P. Hu, X. Tao, P. Zhang, J. Hamalainen, and L. Xia, “Evolution of limited-feedbackCoMP systems from 4G to 5G: CoMP features and limited-feedback approaches,” IEEE vehiculartechnology magazine, vol. 9, no. 3, pp. 94–103, 2014.
[92] R. Tanbourgi, S. Singh, J. G. Andrews, and F. K. Jondral, “A tractable model for noncoherent joint-transmission base station cooperation,” IEEE Transactions on Wireless Communications, vol. 13,no. 9, pp. 4959–4973, 2014.
[93] N. Lee, D. Morales-Jimenez, A. Lozano, and R. W. Heath, “Spectral efficiency of dynamic coordinatedbeamforming: A stochastic geometry approach,” IEEE Transactions on Wireless Communications,vol. 14, no. 1, pp. 230–241, 2014.
[94] N. Lee, R. W. Heath, D. Morales-Jimenez, and A. Lozano, “Coordinated beamforming with dynamicclustering: A stochastic geometry approach,” in 2014 IEEE International Conference on Communica-tions (ICC). IEEE, 2014, pp. 2165–2170.
[95] W. Wen, Y. Cui, F. Zheng, S. Jin, and Y. Jiang, “Random caching based cooperative transmission inheterogeneous wireless networks,” IEEE Transactions on Communications, vol. 66, no. 7, pp. 2809–2825, 2018.
[96] W. Wen, Y. Cui, F.-C. Zheng, S. Jin, and Y. Jiang, “Random caching based cooperative transmissionin heterogeneous wireless networks,” IEEE Transactions on Communications, vol. 66, no. 7, pp. 2809–2825, 2018.
114

[97] L. Hu, F.-C. Zheng, J. Luo, and L. Yang, “Random caching based cooperative transmission in hetnetsin the presence of popularity prediction errors,” in 2019 IEEE 89th Vehicular Technology Conference(VTC2019-Spring). IEEE, 2019, pp. 1–6.
[98] S. Kuang and N. Liu, “Cache-enabled base station cooperation for heterogeneous cellular network withdependence,” in 2017 IEEE Wireless Communications and Networking Conference (WCNC). IEEE,2017, pp. 1–6.
[99] Z. Chen, J. Lee, T. Q. Quek, and M. Kountouris, “Cooperative caching and transmission design incluster-centric small cell networks,” IEEE Transactions on Wireless Communications, vol. 16, no. 5,pp. 3401–3415, 2017.
[100] H. Wu, N. Zhang, Z. Wei, S. Zhang, X. Tao, X. Shen, and P. Zhang, “Content-aware cooperativetransmission in hetnets with consideration of base station height,” IEEE Transactions on VehicularTechnology, vol. 67, no. 7, pp. 6048–6062, 2018.
[101] W. Jiang, G. Feng, and S. Qin, “Optimal cooperative content caching and delivery policy for hetero-geneous cellular networks,” IEEE Transactions on Mobile Computing, vol. 16, no. 5, pp. 1382–1393,2016.
[102] H. Gao, S. Zhang, Y. Su, and M. Diao, “Joint resource allocation and power control algorithm forcooperative D2D heterogeneous networks,” IEEE Access, vol. 7, pp. 20 632–20 643, 2019.
[103] S. Yang, K.-H. Ngo, and M. Kobayashi, “Content delivery with coded caching and massive MIMOin 5G,” in 2016 9th International Symposium on Turbo Codes and Iterative Information Processing(ISTC). IEEE, 2016, pp. 370–374.
[104] L. Wang, K.-K. Wong, S. Lambotharan, A. Nallanathan, and M. Elkashlan, “Edge caching in dense het-erogeneous cellular networks with massive MIMO-aided self-backhaul,” IEEE Transactions on WirelessCommunications, vol. 17, no. 9, pp. 6360–6372, 2018.
[105] H. Mei, Q. Zhao, and L. Peng, “Energy-efficiency in cache-enabled mmwave cellular networks,” in2019 International Conference on Networking and Network Applications (NaNA). IEEE, 2019, pp.107–112.
[106] T. Zhang, S. Biswas, and T. Ratnarajah, “Performance analysis of cache aided hybrid mmwave & sub-6 GHz massive MIMO networks,” in 2020 IEEE 21st International Workshop on Signal ProcessingAdvances in Wireless Communications (SPAWC). IEEE, 2020, pp. 1–5.
[107] J. Guo, J. Yuan, and J. Zhang, “An achievable throughput scaling law of wireless device-to-devicecaching networks with distributed MIMO and hierarchical cooperations,” IEEE Transactions on Wire-less Communications, vol. 17, no. 1, pp. 492–505, 2017.
[108] J. Guo, J. Yuan, and J. A. Zhang, “Wireless device-to-device caching networks with distributed MIMOand hierarchical cooperations,” in GLOBECOM 2017-2017 IEEE Global Communications Conference.IEEE, 2017, pp. 1–6.
[109] Y. Pan, C. Pan, Z. Yang, M. Chen, and J. Wang, “A caching strategy towards maximal D2D assistedoffloading gain,” IEEE Transactions on Mobile Computing, 2019.
[110] N. Giatsoglou, K. Ntontin, E. Kartsakli, A. Antonopoulos, and C. Verikoukis, “D2D-aware devicecaching in mmwave-cellular networks,” IEEE Journal on Selected Areas in Communications, vol. 35,no. 9, pp. 2025–2037, 2017.
[111] Y. Cao, F. Xu, K. Liu, and M. Tao, “A storage-latency tradeoff study for cache-aided MIMO interfer-ence networks,” in 2016 IEEE Global Communications Conference (GLOBECOM). IEEE, 2016, pp.1–6.
115

[112] Y. Cao, M. Tao, F. Xu, and K. Liu, “Fundamental storage-latency tradeoff in cache-aided MIMOinterference networks,” IEEE Transactions on Wireless Communications, vol. 16, no. 8, pp. 5061–5076, 2017.
[113] K.-H. Ngo, S. Yang, and M. Kobayashi, “Scalable content delivery with coded caching in multi-antennafading channels,” IEEE Transactions on Wireless Communications, vol. 17, no. 1, pp. 548–562, 2017.
[114] S. A. R. Naqvi, H. Pervaiz, S. A. Hassan, L. Musavian, Q. Ni, M. A. Imran, X. Ge, and R. Tafazolli,“Energy-aware radio resource management in d2d-enabled multi-tier hetnets,” IEEE Access, vol. 6,pp. 16 610–16 622, 2018.
[115] N. Golrezaei, A. F. Molisch, A. G. Dimakis, and G. Caire, “Femtocaching and device-to-device collab-oration: A new architecture for wireless video distribution,” IEEE Communications Magazine, vol. 51,no. 4, pp. 142–149, 2013.
[116] H. Gao, M. Wang, and T. Lv, “Energy efficiency and spectrum efficiency tradeoff in the D2D-enabledhetnet,” IEEE Transactions on Vehicular Technology, vol. 66, no. 11, pp. 10 583–10 587, 2017.
[117] A. Bhardwaj and S. Agnihotri, “Energy-and spectral-efficiency trade-off for D2D-multicasts in underlaycellular networks,” IEEE Wireless Communications Letters, vol. 7, no. 4, pp. 546–549, 2018.
[118] X. Lin, J. G. Andrews, and A. Ghosh, “Spectrum sharing for device-to-device communication in cellularnetworks,” IEEE Transactions on Wireless Communications, vol. 13, no. 12, pp. 6727–6740, 2014.
[119] G. D. Swetha and G. R. Murthy, “Selective overlay mode operation for D2D communication in dense5G cellular networks,” in 2017 IEEE Symposium on Computers and Communications (ISCC). IEEE,2017, pp. 704–709.
[120] D. J. Daley and D. V. Jones, An Introduction to the Theory of Point Processes: Elementary Theoryof Point Processes. Springer, 2003.
[121] N. Golrezaei, P. Mansourifard, A. F. Molisch, and A. G. Dimakis, “Base-station assisted device-to-device communications for high-throughput wireless video networks,” IEEE Transactions on WirelessCommunications, vol. 13, no. 7, pp. 3665–3676, 2014.
[122] J. G. Andrews, F. Baccelli, and R. K. Ganti, “A tractable approach to coverage and rate in cellularnetworks,” IEEE Transactions on communications, vol. 59, no. 11, pp. 3122–3134, 2011.
[123] K. S. Ali, H. ElSawy, and M.-S. Alouini, “Modeling cellular networks with full-duplex D2D communi-cation: A stochastic geometry approach,” IEEE Transactions on Communications, vol. 64, no. 10, pp.4409–4424, 2016.
[124] M. Cha, H. Kwak, P. Rodriguez, Y.-Y. Ahn, and S. Moon, “I tube, you tube, everybody tubes:analyzing the world’s largest user generated content video system,” in Proceedings of the 7th ACMSIGCOMM conference on Internet measurement, 2007, pp. 1–14.
[125] L. Zhang, M. Xiao, G. Wu, and S. Li, “Efficient scheduling and power allocation for D2D-assistedwireless caching networks,” IEEE Transactions on Communications, vol. 64, no. 6, pp. 2438–2452,2016.
[126] P. D. Mankar, G. Das, and S. S. Pathak, “Modeling and coverage analysis of BS-centric clustered usersin a random wireless network,” IEEE Wireless Communications Letters, vol. 5, no. 2, pp. 208–211,2016.
[127] M. Ahmed, H. Shi, X. Chen, Y. Li, M. Waqas, and D. Jin, “Socially aware secrecy-ensured resourceallocation in d2d underlay communication: An overlapping coalitional game scheme,” IEEE Transac-tions on Wireless Communications, vol. 17, no. 6, pp. 4118–4133, 2018.
[128] R. Fellers, “Millimeter waves and their applications,” Electrical Engineering, vol. 75, no. 10, pp. 914–917, 1956.
116

[129] W. Roh, J.-Y. Seol, J. Park, B. Lee, J. Lee, Y. Kim, J. Cho, K. Cheun, and F. Aryanfar, “Millimeter-wave beamforming as an enabling technology for 5G cellular communications: Theoretical feasibilityand prototype results,” IEEE communications magazine, vol. 52, no. 2, pp. 106–113, 2014.
[130] R. Chevillon, G. Andrieux, R. Negrier, and J.-F. Diouris, “Spectral and energy efficiency analysis ofmmwave communications with channel inversion in outband D2D network,” IEEE Access, vol. 6, pp.72 104–72 116, 2018.
[131] Z. Guizani and N. Hamdi, “Spectrum resource management and interference mitigation for D2D com-munications with awareness of BER constraint in mmwave 5G underlay network,” in 2016 IEEESymposium on Computers and Communication (ISCC). IEEE, 2016, pp. 855–860.
[132] G. T. 38.901, “Study on channel model for frequencies from 0.5 to 100 GHz,” 2017.
[133] M. K. Simon and M.-S. Alouini, Digital communication over fading channels. John Wiley & Sons,2005, vol. 95.
[134] E. Access, “Further advancements for E-UTRA physical layer aspects,” 3GPP Technical SpecificationTR, vol. 36, p. V2, 2010.
[135] G. R. MacCartney and T. S. Rappaport, “Study on 3GPP rural macrocell path loss models for mil-limeter wave wireless communications,” in 2017 IEEE International Conference on Communications(ICC). IEEE, 2017, pp. 1–7.
[136] T. S. Rappaport, Y. Xing, G. R. MacCartney, A. F. Molisch, E. Mellios, and J. Zhang, “Overviewof millimeter wave communications for fifth-generation (5G) wireless networks—with a focus on prop-agation models,” IEEE Transactions on Antennas and Propagation, vol. 65, no. 12, pp. 6213–6230,2017.
[137] N. Deng, M. Haenggi, and Y. Sun, “Millimeter-wave device-to-device networks with heterogeneousantenna arrays,” IEEE Transactions on Communications, vol. 66, no. 9, pp. 4271–4285, 2018.
[138] A. Thornburg, T. Bai, and R. W. Heath, “Performance analysis of outdoor mmwave ad hoc networks,”IEEE Transactions on Signal Processing, vol. 64, no. 15, pp. 4065–4079, 2016.
[139] J. Wildman, P. H. J. Nardelli, M. Latva-aho, and S. Weber, “On the joint impact of beamwidthand orientation error on throughput in directional wireless poisson networks,” IEEE Transactions onWireless Communications, vol. 13, no. 12, pp. 7072–7085, 2014.
[140] A. M. Mathai, An introduction to geometrical probability: distributional aspects with applications. CRCPress, 1999, vol. 1.
[141] S. Singh and J. G. Andrews, “Joint resource partitioning and offloading in heterogeneous cellularnetworks,” IEEE Transactions on Wireless Communications, vol. 13, no. 2, pp. 888–901, 2013.
[142] R. K. Ganti and M. Haenggi, “Interference and outage in clustered wireless ad hoc networks,” IEEETransactions on Information Theory, vol. 55, no. 9, pp. 4067–4086, 2009.
[143] R. T. Marler and J. S. Arora, “Survey of multi-objective optimization methods for engineering,”Structural and multidisciplinary optimization, vol. 26, no. 6, pp. 369–395, 2004.
[144] J. Jensen, “On the convex functions and inequalities between mean values,” Acta Math, vol. 30, pp.175–193, 1906.
[145] P. J. Fleming and A. Pashkevich, “Application of multi-objective optimisation to compensator designfor SISO control systems,” Electronics Letters, vol. 22, no. 5, pp. 258–259, 1986.
[146] M. Tao, D. Gunduz, F. Xu, and J. S. P. Roig, “Content caching and delivery in wireless radio accessnetworks,” IEEE Transactions on Communications, 2019.
117

[147] S. Tamoor-ul Hassan, M. Bennis, P. H. Nardelli, and M. Latva-Aho, “Caching in wireless small cellnetworks: A storage-bandwidth tradeoff,” IEEE Communications Letters, vol. 20, no. 6, pp. 1175–1178,2016.
[148] J. G. Andrews, S. Buzzi, W. Choi, S. V. Hanly, A. Lozano, A. C. Soong, and J. C. Zhang, “What will5G be?” IEEE Journal on selected areas in communications, vol. 32, no. 6, pp. 1065–1082, 2014.
[149] T. S. Rappaport, S. Sun, R. Mayzus, H. Zhao, Y. Azar, K. Wang, G. N. Wong, J. K. Schulz, M. Samimi,and F. Gutierrez, “Millimeter wave mobile communications for 5G cellular: It will work!” IEEE access,vol. 1, pp. 335–349, 2013.
[150] Y.-H. Chiang and W. Liao, “mw-hierback: A cost-effective and robust millimeter wave hierarchicalbackhaul solution for hetnets,” IEEE Transactions on Mobile Computing, vol. 16, no. 12, pp. 3445–3458, 2017.
[151] M.-C. Lee, M. Ji, A. F. Molisch, and N. Sastry, “Throughput–outage analysis and evaluation of cache-aided D2D networks with measured popularity distributions,” IEEE Transactions on Wireless Com-munications, vol. 18, no. 11, pp. 5316–5332, 2019.
[152] D. G. Feitelson, “Workload modeling for performance evaluation,” in IFIP International Symposiumon Computer Performance Modeling, Measurement and Evaluation. Springer, 2002, pp. 114–141.
[153] D. Moltchanov, “Distance distributions in random networks,” Ad Hoc Networks, vol. 10, no. 6, pp.1146–1166, 2012.
[154] M. A. Maddah-Ali and U. Niesen, “Fundamental limits of caching,” IEEE Transactions on InformationTheory, vol. 60, no. 5, pp. 2856–2867, 2014.
[155] B. Serbetci and J. Goseling, “On optimal geographical caching in heterogeneous cellular networks,” in2017 IEEE Wireless Communications and Networking Conference (WCNC). IEEE, 2017, pp. 1–6.
[156] T. M. Ayenew, D. Xenakis, N. Passas, and L. Merakos, “Dynamic programming based content place-ment strategy for 5G and beyond cellular networks,” in 2018 IEEE 23rd International Workshop onComputer Aided Modeling and Design of Communication Links and Networks (CAMAD). IEEE,2018, pp. 1–6.
[157] G. L. Nemhauser and L. A. Wolsey, “Integer and combinatorial optimization john wiley & sons,” NewYork, vol. 118, 1988.
[158] K. Fukunaga and P. M. Narendra, “A branch and bound algorithm for computing k-nearest neighbors,”IEEE transactions on computers, vol. 100, no. 7, pp. 750–753, 1975.
[159] D. E. Kirk, Optimal control theory: an introduction. Courier Corporation, 2004.
[160] M. Mitzenmacher, “Dynamic models for file sizes and double Pareto distributions,” Internet Mathe-matics, vol. 1, no. 3, pp. 305–333, 2004.
[161] M. Cha, H. Kwak, P. Rodriguez, Y.-Y. Ahn, and S. Moon, “Analyzing the video popularity character-istics of large-scale user generated content systems,” IEEE/ACM Transactions On Networking (Ton),vol. 17, no. 5, pp. 1357–1370, 2009.
[162] W. Yi, Y. Liu, and A. Nallanathan, “Modeling and analysis of mmwave communications in cache-enabled HetNets,” arXiv preprint arXiv:1801.08801, 2018.
[163] J. Paakkonen, P. Dharmawansa, R. Freij-Hollanti, C. Hollanti, and O. Tirkkonen, “File size distri-butions and caching for offloading,” in 2019 IEEE 20th International Workshop on Signal ProcessingAdvances in Wireless Communications (SPAWC). IEEE, 2019, pp. 1–5.
[164] S. M. Azimi-Abarghouyi, B. Makki, M. Haenggi, M. Nasiri-Kenari, and T. Svensson, “Coverage analysisof finite cellular networks: A stochastic geometry approach,” in 2018 Iran Workshop on Communicationand Information Theory (IWCIT). IEEE, 2018, pp. 1–5.
118

[165] E. G. Larsson, O. Edfors, F. Tufvesson, and T. L. Marzetta, “Massive MIMO for next generationwireless systems,” IEEE communications magazine, vol. 52, no. 2, pp. 186–195, 2014.
[166] K. Yamazaki, K. Izui, K. Nakayasu, T. Okuyama, J. Mashino, S. Suyama, T. Sato, and Y. Okumura,“Field experimental DL MU-MIMO evaluations of low-SHF-band C-RAN Massive MIMO system withover 100 antenna elements for 5G,” in 2018 IEEE 88th Vehicular Technology Conference (VTC-Fall).IEEE, 2018, pp. 1–5.
[167] T. A. Bressner, A. Farsaei, M. Fozooni, U. Johannsen, M. N. Johansson, and A. B. Smolders, “MIMOperformance evaluation of isotropic, directional and highly-directional antenna systems for mm-wavecommunications,” in 2019 13th European Conference on Antennas and Propagation (EuCAP). IEEE,2019, pp. 1–5.
[168] C. A. Balanis, Antenna theory: analysis and design. John wiley & sons, 2016.
[169] X. Yu, J. Zhang, M. Haenggi, and K. B. Letaief, “Coverage analysis for millimeter wave networks: Theimpact of directional antenna arrays,” IEEE Journal on Selected Areas in Communications, vol. 35,no. 7, pp. 1498–1512, 2017.
[170] G. R. MacCartney, J. Zhang, S. Nie, and T. S. Rappaport, “Path loss models for 5G millimeterwave propagation channels in urban microcells,” in 2013 IEEE Global Communications Conference(GLOBECOM). IEEE, 2013, pp. 3948–3953.
[171] S. Atapattu, C. Tellambura, and H. Jiang, “A mixture gamma distribution to model the SNR ofwireless channels,” IEEE transactions on wireless communications, vol. 10, no. 12, pp. 4193–4203,2011.
[172] S. Bazzi, G. Dietl, and W. Utschick, “Maximum ratio transmission for massive MIMO: non-asymptoticanalysis with limited csir,” in SCC 2015; 10th International ITG Conference on Systems, Communi-cations and Coding. VDE, 2015, pp. 1–6.
[173] A. Prasad, A. Kunz, G. Velev, K. Samdanis, and J. Song, “Energy-efficient d2d discovery for proximityservices in 3gpp lte-advanced networks: Prose discovery mechanisms,” IEEE vehicular technologymagazine, vol. 9, no. 4, pp. 40–50, 2014.
[174] X. Lin, J. G. Andrews, A. Ghosh, and R. Ratasuk, “An overview of 3gpp device-to-device proximityservices,” IEEE Communications Magazine, vol. 52, no. 4, pp. 40–48, 2014.
[175] K. A. Hamdi, “Capacity of MRC on correlated rician fading channels,” IEEE Transactions on Com-munications, vol. 56, no. 5, pp. 708–711, 2008.
119
Appendix A
A.1 Proof of Ψrx,d2d in Eqn. (3.3)
Let the random variables Ru and Rf denote the labels for the requesting user and requested file, respectively.
Assume a deterministic caching strategy such that the user device ui caches the i-th most popular file
fj . Define event A as ui receives file fj from another user in the cluster. Event A represents a D2D
communication event between ui and the user that stores fj in its cache since fj is not stored in the cache
of ui. The probability of event A conditioned on the events Ru = ui and Rf = fj is given by
PrA|Ru = ui, Rf = fj =
Nc∑k=1
Ψfk −Ψfj , (A.1)
where the termNc∑k=1
Ψfk is the probability that the requested file is in the cluster and Ψfj is subtracted
fromNc∑k=1
Ψfk to exclude the self-request of ui. Assume that fj is equally likely to be requested among the
|Fc| = Nc cached files in the cluster, such that PrRf = fj = 1Nc
. Similarly, assume that the requesting
user ui is equally likely among the |Nc| = Nc users in the cluster, such that PrRu = ui = 1Nc
. By averaging
over the files fj in the cluster and averaging over all the users ui in the cluster, (A.1) becomes
PrA = Ψrx,d2d =∑∀ui∈Nc
( ∑∀fj∈Fc
( Nc∑k=1
Ψfk −Ψfj
)× 1
Nc
))× 1
Nc, (A.2)
where Ψrx,d2d is the probability that any user in the set Nc, i.e, any user inside the cluster receives a file fj
from another user in the cluster. The proof is complete.
A.2 Proof of Lintra(s) in Eqn. (3.16)
Starting from (3.11), the Laplace transform of Iintra is given by
120
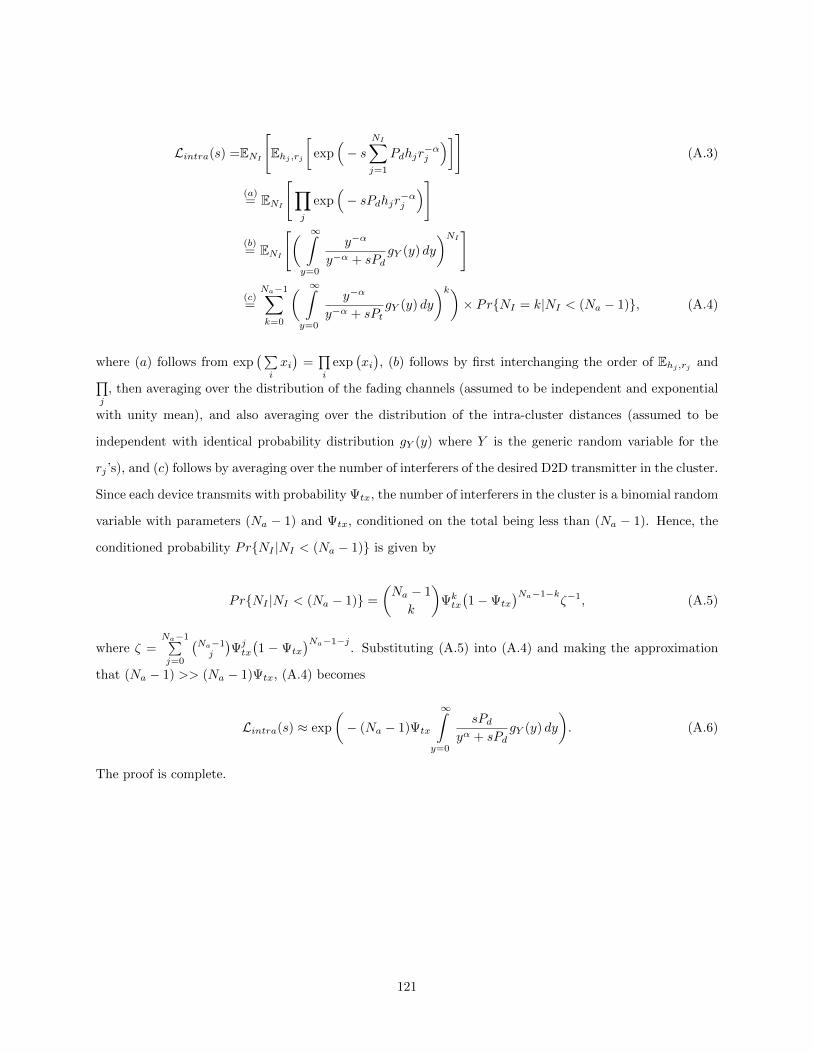
Lintra(s) =ENI
[Ehj ,rj
[exp
(− s
NI∑j=1
Pdhjr−αj
)]](A.3)
(a)= ENI
[∏j
exp(− sPdhjr−αj
)]
(b)= ENI
[( ∞∫y=0
y−α
y−α + sPdgY (y) dy
)NI]
(c)=
Na−1∑k=0
( ∞∫y=0
y−α
y−α + sPtgY (y) dy
)k)× PrNI = k|NI < (Na − 1), (A.4)
where (a) follows from exp(∑i
xi)
=∏i
exp(xi), (b) follows by first interchanging the order of Ehj ,rj and∏
j
, then averaging over the distribution of the fading channels (assumed to be independent and exponential
with unity mean), and also averaging over the distribution of the intra-cluster distances (assumed to be
independent with identical probability distribution gY (y) where Y is the generic random variable for the
rj ’s), and (c) follows by averaging over the number of interferers of the desired D2D transmitter in the cluster.
Since each device transmits with probability Ψtx, the number of interferers in the cluster is a binomial random
variable with parameters (Na − 1) and Ψtx, conditioned on the total being less than (Na − 1). Hence, the
conditioned probability PrNI |NI < (Na − 1) is given by
PrNI |NI < (Na − 1) =
(Na − 1
k
)Ψktx
(1−Ψtx
)Na−1−kζ−1, (A.5)
where ζ =Na−1∑j=0
(Na−1j
)Ψjtx
(1 − Ψtx
)Na−1−j. Substituting (A.5) into (A.4) and making the approximation
that (Na − 1) >> (Na − 1)Ψtx, (A.4) becomes
Lintra(s) ≈ exp
(− (Na − 1)Ψtx
∞∫y=0
sPdyα + sPd
gY (y) dy
). (A.6)
The proof is complete.
121

Appendix B
B.1 Proof of the Mean Interference Terms in Eqns. (4.13) and
(4.14)
The mean interference under the blockage model-A and the ULA pattern is derived as follows:
Idd(a)= E
∑x∈Φ2L
εLP2Gihx maxdo, x−αL + E∑
x′∈Φ2N
εNP2Gih′x maxdo, x′−αN
(b)=P2
(EG,h,Φ
∑x∈Φ2L
εLGihx maxdo, x−αL + EG,h,Φ∑
x′∈Φ2N
εNGih′x maxdo, x′−αN
)(c)=2πλ2P2
4∑u=1
ξuφi,u
(∫ rnet
0
εL maxdo, x−αLx · e−xC dx
+
∫ rnet
0
εN maxdo, x′−αNx′ ·(1− e− x
′C
)dx′), (B.1)
where (a) follows from substitution, (b) follows from the independence of the random channel fading power
gains, antenna gains, and the locations of the LOS and NLOS interferers. The label (c) follows from applying
Campbell’s theorem for the expectation of a sum over a PPP and applying the LOS probability function to
the density of the baseline PPP. Lastly, (4.13) follows from integrating the two integral terms on the right
hand side of (c). The proof of (4.14) follows a similar approach to (4.13) and is omitted.
122

B.2 Proof of SINR coverage probability in Eqn. (4.18)
Υcov,c(γ)(a)=
∫ rnet
rd
EIccPr(hl,o >
γxαL(Icc +N0)
P1Gc,oεL
)gX(x) dx
(b)=
∫ rnet
rd
EIccmL−1∑j=0
1
j!
(γxαL(Icc +N0)
P1Gc,oεL
)je− γx
αL (Icc+N0)P1Gc,oεL gX(x) dx
(c)=
∫ rnet
rd
mL−1∑j=0
1
j!
( γxαL
P1Gc,oεL
)j j∑q=0
(j
q
)EIcc
[Iqcc]N j−q
0
LIcc(s)∣∣∣s=
γxαL
P1Gc,oεL
(e− γxαLN0P1Gc,oεL
)gX(x) dx, (B.2)
where (a) follows from substituting and rearranging terms, (b) follows from taking the expectation of the
Gamma distributed channel power gain hc,o, and (c) follows from the Binomial expansion of the sum of the
noise and interference terms and using the Laplace transform equation: LX(s) = E[e−sX ], while EIcc[Iqcc]
=
(−1)q dqLIcc (s)
dsq
∣∣∣s=0
is the qth moment of Icc.
B.3 Proof of the Laplace Transforms in Eqn. (4.19)
LIcc(s)(a)= E
[e−sIcc,l
]· E[e−s
′Icc,n]
(b)= EhEG
[e−
∫∞rd
2πλ1
(1−e−sP1GεLhx
−αL)x dx]· EhEG
[e−
∫∞rd
2πλ1
(1−e−sP1GεNhx
−αN)x dx]
(c)=
4∏u=1
e−2πλ1ξu
∫∞rd
∑MLj=1 (MLj )(sP1φi,uεLσLx
−αL )j
(sP1φi,uεLσLx−αL+1)ML
×xPL(x) dx×
4∏u=1
e−2πλ1ξu
∫∞rd
∑MNj=1 (MNj )(sP1φi,uεNσNx
−αN )j
(sP1φi,uεNσNx−αN +1)MN
×xPN (x) dx
(B.3)
where the Laplace transform parameters are s = γrαl
P1Go,cεLand s′ = γrαn
P1Go,cεNfor LOS and NLOS terms,
respectively. In addition, (a) and (b) follow from the independence of the LOS and NLOS PPPs of the
interferer locations, and (c) stems from applying the probability generating functional theorem to the LOS
and NLOS PPPs with h andG as dummy variables, taking the expectation of the discrete random interference
link directivity gain Gi, the gamma distributed channel power gains hj , hm, and simplifying using the
Binomial theorem.
123

B.4 Proof of the Non-Convexity of Eqn. (4.28)
The proof of the non-convexity of (4.28) follows from Jensen’s inequality, i.e, if 0 < Ξ1, · · · ,Ξn such that∑nk=1 Ξk = 1, n ≥ 2, and f(x) is a real continuous function that is convex, then
f( n∑k=1
Ξkxk)≤
n∑k=1
Ξkf(xk), (B.4)
otherwise, the inequality sign is reversed if f(x) is non-convex (concave). It is sufficient to prove that either
Ac or Ad in (4.28) is non-convex because both terms are functions of the same set of decision variables.
Setting n = 2 and extending over the decision set, the LHS of Ac in (4.28) becomes:
Ac( 2∑k=1
Ξk)
=(Ξ1κ1 + Ξ2κ2)
(ω − β(ω − β)
Ξ1
(∑Nci=1 P1,1j +
∑Ndj=1 P2,1j
)+ Ξ2
(∑Nci=1 P1,2i +
∑Ndj=1 P2,2j
)) (B.5a)
= (Ξ1κ1 + Ξ2κ2)ω − β(ω − β)
(Ξ1κ1 + Ξ2κ2
Ξ1
(∑Nci=1 P1,1j +
∑Ndj=1 P2,1j
)+ Ξ2
(∑Nci=1 P1,2i +
∑Ndj=1 P2,2j
)).(B.5b)
Similarly, the RHS of Ac in (4.28) becomes:
2∑k=1
ΞkAc =Ξ1κ1
(ω − β(ω − β)
Ξ1
(∑Nci=1 P1,1i +
∑Ndj=1 P2,1j
))+ Ξ2κ2
(ω − β(ω − β)
Ξ2
(∑Nci=1 P1,2i +
∑Ndj=1 P2,2j
))(B.6a)
=(Ξ1κ1 + Ξ2κ2)ω − β(ω − β)
(Ξ1κ1
Ξ1
(∑Nci=1 P1,1i +
∑Ndj=1 P2,1j
) +Ξ2κ2
Ξ2
(∑Nci=1 P1,2i +
∑Ndj=1 P2,2j
)).(B.6b)
A comparison between (B.5b) and (B.6b) reveals that (B.5b) > (B.6b) because 0 < Ξ1,Ξ2, κ1, κ2 < 1,
therefore, Ξ1κ1+Ξ2κ2
Ξ1
(∑Nci=1 P1,1j+
∑Ndj=1 P2,1j
)+Ξ2
(∑Nci=1 P1,2i+
∑Ndj=1 P2,2j
) < Ξ1κ1
Ξ1
(∑Nci=1 P1,1i+
∑Ndj=1 P2,1j
)+ Ξ2κ2
Ξ2
(∑Nci=1 P1,2i+
∑Ndj=1 P2,2j
) .
The proof is complete.
124

Appendix C
C.1 Proof of the SINR Coverage Probability Expression in the
Pico BS Tier — Theorem 5.1
Starting from (5.14) and applying the Cauchy-Schwarz inequality to the numerator, an upper bound expres-
sion for Pcov,2(γ, f) can be derived as follows:
Pcov,2(γ, f)(a)
≤ Ey
P( K∑j=1
|hj,o|2 >γ(No +
∑i∈Φ2,f
P2G2,iy−α2i |h2,i|2 +
∑i∈Φ2,f′
P2G2,iy−α2i |h2,i|2
)P2G2
∑Kj=1 y
−α2j
),
(C.1a)
(b)≈
Kηl∑n=1
(−1)n+1
(Kηln
)exp
(− nηlγNo
P2G2
∑Kj=1 y
−α2j
)×EΦ2
[exp
(−nηl∑i∈Φ2,f
P2G2,iy−α2i |h2,i|2
P2G2
)]× EΦ2
[exp
(−nηl∑i∈Φ2,f′
P2G2,iy−α2i |h2,i|2
P2G2
)], (C.1b)
(c)≈
∫0<y1<···<yK<R
ρ∑n=1
(−1)n+1
(Kηln
)exp
(− ηl((Kηl)!)
− 1Kηl γNo
C2G2
∑Kj=1 y
−α2j
)
× exp
−(
2πΛ2f
4∑a=1
ζa
∫ ∞yk
[1− 1(
1 +nφi,a(Kηl)!((Kηl)!)
− 1Kηl γ
Kηlwα2∑Kj=1 y
−α2j
)Kηl]· wU(Rl − w) dw
)
× exp
−(
2π(λ2 − Λ2f
)4∑a=1
ζa
∫ ∞0
[1− 1(
1 +nφi,a(Kηl)!((Kηl)!)
− 1Kηl γ
Kηlw′α2∑Kj=1 y
−α2j
)Kηl]· w′U(Rl − w′) dw′
)
× g2,f (y) dy1 · · · dyK , (C.1c)
125

where (a) follows from substitution and rearrangement of terms in (5.17), (b) follows from the com-
plementary cumulative distribution function of the sum of the K independent gamma random variables∑Kj=1 |hk,o|2 with scaled parameter Kηl and applying Alzer’s lemma [33], while (c) follows from applying
the sum-product rule for exponential functions, the probability generating functional theorem for a PPP,
and integrating over the joint pdf of y.
C.2 Proof of Lemma 1
Starting from (5.30a),
maxF⊆N
N∑f=1
pfqk,fλkP2αk
k
(1− e−πqk,fλkR2
)qk,fλkP
2αk
k + qj,fλjP2αj
j
(a)
≤ maxF⊆N
N∑f=1
(1− e−πqk,fλkR
2)
(b)≡ − max
F⊆N
N∑f=1
e−πqk,fλkR2
(c)≡ minF⊆N
N∑f=1
e−πqk,fλkR2 (d)≡ maxF⊆N
N∑f=1
qk,f , (C.2)
where (a) is valid because the k-th tier association probability, conditioned on requesting for the file f ,
i.e.,pfqk,fλkP
2αkk
qk,fλkP
2αkk +qj,fλjP
2αjj
∈ (0, 1). Further, (b) results from expanding (a), (c) results from the max-min
relationship, and (d) follows from the fact that for a constant F , e−Fx → 0 as x→∞.
C.3 Proof of (5.35)
Substituting the expression for Υcov,1(γ, f) in (5.23) into (5.33a), the objective function can be expanded as:
S2(%2,f , q∗2,f ) +
N∑f=1
pfq1,fλ1P2α1
1 (1− e−πq1,fλ1R2
) · exp
[(πq1,fλ1(
P2G2C2,LOS
P1G1C1)q2,fλ2
)2
4 γNoC1G1
]
× π 32
q1,fλ1 erfc[π(q1,fλ1+q2,fλ2
P2G2C2,LOSP1C1G1
)
2√
γNoC1G1
]2%2,f
√γNoC1G1
, (C.3)
where S2(%2,f , q∗2,f ) denotes the average success probability in the pico BS tier which is obtained by substi-
tuting %2,f and q∗2,f into (5.33a). (5.34) is obtained by differentiating (C.3) with respect to q1,f and setting
the result to zero.
126

Appendix D
D.1 Proof of Average Achievable Rate Per Unit Bandwidth —
Theorem 6.1
Starting from (6.12), the expression for the average achievable rate per unit bandwidth is expanded as
follows:
Ab,f(a)=E
[1
ln(2)
∫ ∞0
1
z(1− e−zκb,f )e−zdz
], (D.1a)
(b)=
1
ln(2)E
[∫ ∞0
1
z(1− e−zPb||H0W0||2ρ0)e−z(Pb||HjWj ||2ρj+σ2
0)dz
], (D.1b)
(c)=
1
ln(2)
∫ ∞0
1
z(1− E||H0||2W0
e−zPb||H0W0||2ρ0)E||Hj ||2Wj ,G
[e−z(Pb||HjWj ||2ρj)
]e−zσ
20dz
]. (D.1c)
where (a) follows from applying the transformation in Lemma 1 of [175], (b) follows from substitution of the
desired signal and interference terms, and (c) follows from the linearity of the expectation operator, resulting
in the Laplace transform of the desired signal and interfering terms. Finally, (6.16) results from taking the
expectation with respect to the distributions of theNuη-dimensional multivariate Gamma distributed random
variables, the link length, and the array gain functions.
127

D.2 Proof of Rate Coverage Probability — Theorem 6.2
Starting from (6.16), substituting the expression for Ai,f , and re-arranging terms, the expression for the rate
coverage probability is expanded as follows:
Rb(Ψ, f) = P(κi,f > 2Ψ − 1) (D.2a)
(a)=P
(Pb||H0W0||2ρ0∑
j∈Φ′b,fPb||HjWj ||2ρj + σ2
0
> 2Ψ − 1
), (D.2b)
(b)=P
(Nu∑k=1
Λ2k >
∑j∈Φ
′b,fPb∑Nuk=1 Ψ
2kρj + σ2
0
ρ0×(2Ψ − 1
Pb
)), (D.2c)
(c)≈Er
1− EΦb,f
(1− exp
( (2Ψ − 1)(∑
j∈Φ′i,fPb∑Nuk=1 Ψ
2kGj(ςx, ςy)Gu(ς)r−αj + σ2
0
)Gb(ςx, ςy)Gu(ς)r−α0
))Nuη, (D.2d)
(d)=Er
Nuη∑n=1
(−1)n+1
(Nuη
n
)exp
(− nη(2Ψ − 1)σ2
0rα0
)× EΦb,f
[exp
(−nη∑j∈Φb,f
PbGj(ςx, ςy)Gu(ς)r−αj∑Nuk=1 Ψ
2k
PbGb(ςx, ςy)Gu(ς)
)]∫ Rl
0
Nuη∑n=1
(−1)n+1
(Nuη
n
)exp
(− nη(2Ψ − 1)σ2
0rα)
× exp
(− 2πλbqb,f
∫ Rl
r
1−(1 + nη(η!)−
1ηEGGj(ςx, ςy)Gu(ς)
ηxα
)−Nuηx dx
)gb,f (r)dr, (D.2e)
where (a) and (b) result from substitution and rearrangement of terms. Moreover, ΛkNuk=1 denote the Nu
eigenvalues of H0W0 and Ψ2k
Nuk=1 denote the Nu eigenvalues of HjWj . (c) follows from the complementary
cumulative distribution function of the sum of the Nu eigenvalues with scaled parameter Nuη and (c) follows
from Alzer’s lemma [33]. Lastly, (d) follows from applying the sum-product rule for exponential functions, the
probability generating functional theorem for a PPP, and integrating over the random array gain functions
and the pdf of r to get the result in (6.17).
128