On the Relationship Between Gf/Gc Theory and Jensen's …€¦ · · 2011-12-30On the...
14
Journal of Educational Psychology 1980, Vol. 72, No. 6,796-809 On the Relationship Between Gf/Gc Theory and Jensen's Level I/Level II Theory Lazar Stankov University of Sydney Sydney, Australia John L. Horn University of Denver Trevor Roy Ban Ban Station Darwin, Australia A sample of 201 high school students was given a battery of 27 ability tests strategically chosen to provide composite measures of 12 primary mental abili- ties selected to indicate second-order abilities known as fluid intelligence (Gf), crystallized intelligence (Gc), and short-term acquisition retrieval (SAR). Factor analysis of the 12 primaries provided evidence of the Gf, Gc, and SAR dimensions. The SAR dimension is similar to a Level I form of intelligence (LI) and the Gf and/or Gc factors relate to a Level II intelligence (LII) in a theory sponsored by Jensen. Analyses of social class differences in respect to SAR (LI) in contrast to Gf and Gc (LII) did not provide convincing evidence in support of a hypothesis that the social classes differ primarily in respect to LII (Gf and Gc) rather than in respect to LI (SAR). Those who have followed recent work on Jensen's (1973b, 1974) theory of Level I (LI) and Level II (LII) forms of intelligence and developments of the theory of fluid (Gf) and crystallized (Gc) intelligence (Cattell, 1971; Horn, 1968; 1974,1976,1978a; 1979; in press; Stankov & Horn, 1980) might have noticed that memory has come to play a rather sim- ilar role in the two theories. In both for- mulations memory has been relegated to the status of a precursor or a servant of the ca- pacities that are the sine qua non of human intelligence. In the work on Gf/Gc theory, several This research was supported in part by Grant 5 R01 AG00583-02 from the National Institute of Aging (to Horn) and a University of Sydney research grant (to Stankov). We are grateful to J. R. Radcliffe and participants of the individual differences seminar at the University of Sydney for many useful comments regarding an earlier draft of this article. We are also grateful to D. Shaw from the Australian Commonwealth Scientific and Research Organization, Department of Mathematics and Statistics, for statistical advice. Test statistics, as well as results from other analyses mentioned in this report, can be obtained from the first author. Requests for reprints should be sent to John L. Horn, Department of Psychology, University of Denver, University Park, Denver, Colorado 80208. studies of the factorial structure in a wide variety of ability performances have indi- cated a broad unity among short-term ac- quisition and retrieval (SAR) functions (Horn, 1976, 1978a, 1978b; 1980; Horn & Bramble, 1967; Huridal & Horn, 1977; Rossman & Horn, 1972; Shucard & Horn, 1972). It is suggested that this SAR factor represents organization among memory processes that is analogous in some respects to organizations among visualization (Gv) and auditory (Ga) processes. The SAR, Gv, and Ga organizations represent ways in which information is prepared, as it were, for the induction, eduction, and deduction processes of Gf and Gc (Horn, 1978a, 1978b; Horn & Donaldson, 1980). In particular, SAR indicates functions involved in holding information in awareness long enough for it to be processed by the capacities of Gf and Gc. Jensen (1973b) has performed several factor analyses in which three factors were extracted to suggest that the memory func- tion he had formerly designated as LI intel- ligence stands apart from factors repre- senting Gf and Gc. Both Gf and Gc are re- garded as indicating LII in Jensen's work. The memory, function is regarded as pro- Copyright 1980 by the American Psychological Association, Inc. 0022-0663/80/7206-0796$00.75 796
Transcript of On the Relationship Between Gf/Gc Theory and Jensen's …€¦ · · 2011-12-30On the...

Journal of Educational Psychology1980, Vol. 72, No. 6,796-809
On the Relationship Between Gf/Gc Theoryand Jensen's Level I/Level II Theory
Lazar StankovUniversity of Sydney
Sydney, Australia
John L. HornUniversity of Denver
Trevor RoyBan Ban StationDarwin, Australia
A sample of 201 high school students was given a battery of 27 ability testsstrategically chosen to provide composite measures of 12 primary mental abili-ties selected to indicate second-order abilities known as fluid intelligence (Gf),crystallized intelligence (Gc), and short-term acquisition retrieval (SAR).Factor analysis of the 12 primaries provided evidence of the Gf, Gc, and SARdimensions. The SAR dimension is similar to a Level I form of intelligence(LI) and the Gf and/or Gc factors relate to a Level II intelligence (LII) in atheory sponsored by Jensen. Analyses of social class differences in respect toSAR (LI) in contrast to Gf and Gc (LII) did not provide convincing evidencein support of a hypothesis that the social classes differ primarily in respect toLII (Gf and Gc) rather than in respect to LI (SAR).
Those who have followed recent work onJensen's (1973b, 1974) theory of Level I (LI)and Level II (LII) forms of intelligence anddevelopments of the theory of fluid (Gf) andcrystallized (Gc) intelligence (Cattell, 1971;Horn, 1968; 1974,1976,1978a; 1979; in press;Stankov & Horn, 1980) might have noticedthat memory has come to play a rather sim-ilar role in the two theories. In both for-mulations memory has been relegated to thestatus of a precursor or a servant of the ca-pacities that are the sine qua non of humanintelligence.
In the work on Gf/Gc theory, several
This research was supported in part by Grant 5 R01AG00583-02 from the National Institute of Aging (toHorn) and a University of Sydney research grant (toStankov).
We are grateful to J. R. Radcliffe and participants ofthe individual differences seminar at the University ofSydney for many useful comments regarding an earlierdraft of this article. We are also grateful to D. Shawfrom the Australian Commonwealth Scientific andResearch Organization, Department of Mathematicsand Statistics, for statistical advice. Test statistics, aswell as results from other analyses mentioned in thisreport, can be obtained from the first author.
Requests for reprints should be sent to John L. Horn,Department of Psychology, University of Denver,University Park, Denver, Colorado 80208.
studies of the factorial structure in a widevariety of ability performances have indi-cated a broad unity among short-term ac-quisition and retrieval (SAR) functions(Horn, 1976, 1978a, 1978b; 1980; Horn &Bramble, 1967; Huridal & Horn, 1977;Rossman & Horn, 1972; Shucard & Horn,1972). It is suggested that this SAR factorrepresents organization among memoryprocesses that is analogous in some respectsto organizations among visualization (Gv)and auditory (Ga) processes. The SAR, Gv,and Ga organizations represent ways inwhich information is prepared, as it were, forthe induction, eduction, and deductionprocesses of Gf and Gc (Horn, 1978a, 1978b;Horn & Donaldson, 1980). In particular,SAR indicates functions involved in holdinginformation in awareness long enough for itto be processed by the capacities of Gfand Gc.
Jensen (1973b) has performed severalfactor analyses in which three factors wereextracted to suggest that the memory func-tion he had formerly designated as LI intel-ligence stands apart from factors repre-senting Gf and Gc. Both Gf and Gc are re-garded as indicating LII in Jensen's work.The memory, function is regarded as pro-
Copyright 1980 by the American Psychological Association, Inc. 0022-0663/80/7206-0796$00.75
796
Gf/Gc AND LEVEL I/LEVEL II THEORY 797
viding a precondition for expressions of LII,rather in the manner that SAR provides abasis for expressions of Gf and Gc.
Thus it seems that with respect to memoryas it relates to major factors of intelligence,there is a similarity between Gf/Gc theoryand LI/LII theory. However, the SAR fac-tor of Horn's (1978a) study is considerablybroader than the memory factor of the Jen-sen (1973b) study, and the former is based ona rather different line of research than thelatter.
An important feature of the Cattell andHorn developments of a structural theory ofintelligence is the aim to build broad con-cepts on narrower concepts for which thereis empirical evidence of unity among differ-ent aspects of a function. In particular theaim has been to define Gf, Gc, and otherbroad dimensions in terms of the primarymental ability factors found among tests (assummarized by Ekstrom, French, & Har-man, 1979; French, Ekstrom, & Price, 1963;Guilford, 1967; and Horn, 1972, among oth-ers). From this research the SAR factoremerged as a broad dimension involvingperformances as diverse as those of spanmemory, serial rote learning, and paired-associates recognition (Horn, 1978a). Incontrast the memory factor of Jensen's em-pirical studies is hardly any broader than theprimary mental ability known as memoryspan (Ms). In applications and discussionsof his theory, however, Jensen has said thatLI involves paired-associates memory andserial recall, as: well as span memory. Instudies that involved no analyses of struc-ture, Jensen used memory tasks of each ofthese various kinds to identify LI (Jensen,1971; 1972). Thus it seems that LI repre-sents the same concept as SAR even as it hasbeen defined more narrowly in Jensen's(1973b) studies of structure.
In response to these indications of rap-prochement between two theories, thepresent study was designed to examine thesecond-order structure among primaryabilities in an area in which Gf, Gc, andSAR—that is, LI—might be distinguished.In particular, the aim was to sample primarymental abilities that are indicative of distinctmemory processes and examine the structureamong these in the context of a sample of the
primaries that are indicative of Gf and Gc.This will provide a replication of a basis forregarding SAR (LI) as distinct from Gf andGc, and will permit examination of someimportant implications of LI/LII theory.
One important implication derives fromJensen's hypotheses that movement fromlow to high social/economic status (SES)within an open society is mainly determinedby, and racial differences occur mainly inrespect to, LII rather than LI. Jensen ar-gued that support for these hypotheseswould be indicated by two kinds of findings,namely, (a) large differences between SESor racial groups for LII abilities, small dif-ferences for LI abilities; (b) large slope forthe regression of LI on LII in samples of highSES or majority-group people, small slopefor this regression in samples of low SES orminority-group individuals.
There are many problems with the logic ofthese hypotheses as well as with obtainingdata that can be properly interpreted in ac-cordance with the hypotheses and proposedtests. Several of these difficulties werepointed out by Hall and Kaye (in press),Horn (1976), Humphreys and Dachler(1969), and Humphreys and Fleishman(1974). An exhaustive review of these dif-ficulties will not be attempted here. In-stead, the logic of Test (b) above will be ac-cepted (even though it can be questioned),and some of the difficulties in testing thishypothesis will be illustrated.
A major difficulty in providing convincingevidence for the regression-slope hypothesisis associated with problems of obtaininggood operational definitions of LI and LII.As noted previously, Jensen has defined LIfrom one study to the next in terms of ratherdifferent memory tests—different in thesense that the tests measure different pri-mary factors, the Ms primary in one case, theassociative memory primary (Ma) in anothercase, and so on. It might be reasonable touse the different tests to represent the sameconcept, such as SAR, if indeed there is ad-equate evidence to support a hypothesis thatall of the tests measure the same factor.Jensen has not supplied such evidence,however.
More important, although it might bereasonable to use separate marker tests to
798 L. STANKOV, J. HORN, AND T. ROY
define a factor to use to seek support forJensen's hypotheses, it is not necessarilyreasonable to do this. Variables of a givenfactor can have different relationships withoutside variables. Given the fact that sev-eral variables all define the same factor, itdoes not follow that each of these will havethe same relation to SES. Also, the relationof one of these variables to SES can be nearlythe same as the SES relation for a variableof an entirely different factor. Many vari-ables, not just memory variables, can relateto SES with regression slope, mi, that isdifferent from an m% slope representing therelationship for a measure of LII. Thus,little support for Jensen's theory is providedby results showing that one arbitrary indi-cant of LI relates to SES in a different waythan an arbitrary indicant of LII relates toSES.
Support for Jensen's second hypothesismight be obtained by showing that each in-dicant of LI has the same relation to SES aseach other indicant, and this relationship isdifferent from the relationship for each in-dicant of LII and each indicant of a host ofother factors. Alternatively, evidence mightbe adduced by first showing that differentindicants of LI and LII do indeed defineseparate factors and then showing that thetwo factors have different relations to SES.Jensen has not attended to either of thesekinds of approaches in his studies designedto produce support for his hypotheses. Thisis a major weakness.
In accordance with these concerns aboutLI/LII theory, the present study was de-signed to provide evidence of the structuraldistinction between SAR, Gf, and Gc as abasis for then examining the hypothesis thatSAR (i.e., LI) has a different relation to SESthan either Gf or Gc (i.e., two possible rep-resentatives of Jensen's LII concept).
A second problem in examining the Jen-sen hypothesis pertains to the sampling ofsubjects at different points along the rangeof the scales that are used to provide opera-tional definition of the principal variables.As Horn (1976) pointed out, the slope of re-gression is a function of the correlation andthe standard deviations of the variables, 6xy= rxy(Sy/Sx), so if there is selection of onegroup relative to another that affects the
ratio of standard deviations, the slope will bechanged in consequence of the selection(Humphreys & Dachler, 1969). Such se-lection can occur when there is samplingfrom the upper part of a distribution in onegroup and in the midrange of the variable inanother group (see Darlington, 1971;Schmidt & Hunter, 1974; and Thorndike,1971, for a discussion of issues associatedwith such selection). There is no certainway to escape these kinds of difficulties shortof using representative sampling and ratio-level scales (in which a unit of measure at theextremes is the same as a unit of measure inthe middle of a scale). But a somewhatbetter picture of the plausibility of slopecomparison hypotheses can be indicated bysampling from both sides of the midpointsof scales. The present study was designedto provide this more plausible picture.
Method
Subjects and Their SES
The subjects were high school students, 14-16 yearsof age, drawn from six private Catholic schools in theSydney (Australia) metropolitan area. A total of 201subjects (109 girls and 92 boys) was obtained.
Schools were used as units of selection to provide abroad and representative range of the SES classeswithin the city. Only those schools in which studentscame from within a local area were selected. Theschool-sampling units were chosen in a way to cover thefull range of economic classes from the most affluent tothe poorest.
This selection was aided by an extensive study(Congalton, 1969) on status and prestige in Australia.The results from the Congalton study were also used toprovide estimates of a subject's SES on the basis of fa-ther's occupation. Congalton's 7-point scale of SES wascollapsed to provide enough subjects in each of threeSES categories to ensure a stable basis for estimatingstatistics. There were 45 subjects in the high SESgroup, 75 in the middle SES group, and 91 in the lowSES group.
Each principal of the different schools was asked tocompare the SES distribution in the subsample drawnfrom his/her school with the distribution of SES withinthe school as a whole. Each suggested that the sub-sample distribution did not differ in any notable degreefronrthe school distribution. In this respect, therefore,the sample would seem to be representative of thepopulation represented by the schools. The privateschool system in Australia is completely decentralized,however, so it is difficult to estimate how the presentsample of private schools differs from the populationof all private schools or the population of schools ingeneral. Thus we would not claim that our sample is
Gf/Gc AND LEVEL I/LEVEL II THEORY 799
Table 1Primary Abilities and Tests Used to Measure Them
Symbol Primary ability Tests to measure primary abilities
I
la
CFR
N
V
CMR
Ms
Ma
Mm
Fa
Fi
Fw
Induction (visual)
Induction (auditory)
Cognition of figuralrelations
Number facility
Verbal comprehension
Cognition of semanticrelations
Memory span
Associative memory
Meaningful memory
Associational fluency
Ideational Fluency
Word fluency
Letter Series8
Letter Setsb
Tonal Series0
Chord Seriesc
Raven's Progressive Matrices
Addition11
Division1"Subtraction & Multiplication15
Vocabulary1*Incomplete Sentences0
Common Verbal Analogies3
Esoteric Verbal Analogies8
Auditory Number Spanb
Visual Number Spanb
Auditory Letter Spanb
Low Associated Word Pairs6
Word-Number Pairs8
Low Associated Serial Recall(free recall of uncategorizedlists)f
High Associated Word Pairs6
Emphasized Word Recall0
High Associated Serial Recall(free recall of categorizedlists)f
Similar Wordsb
Word Associations'1
Topics'1
Things Categoriesb
Word Endingsb
Word Beginnings'1
a Horn (in press). b French, Ekstrom, and Price (1963). ° Stankov and Horn (1980). d Adapted from Frenchetal. (1963). e Kelley (1964). f Jensen and Frederiksen (1973).
representative of any population that can be well cir-cumscribed in other studies. In this respect the sampleis no different from the samples of almost all studies inthe psychological literature. However, an importantfeature of the sample is that it contains subsamples allalong the SES scale, from high to low.
Measured Variables
Twenty-seven tests were chosen to measure 12 pri-mary factors. The latter were selected to representmarkers for Gf, Gc, and SAR. The tests came fromFrench, Ekstrom, and Price (1963), Jensen andFrederiksen (1973), Kelley (1964), or our previous re-search (Horn, in press; Stankov & Horn, 1980). Table
^1 shows the 12 primary abilities, and the tests used tomeasure each.
A question at issue is how these 27 tests can indicatethe factors of interest, Gf, Gc, and SAR. This is a.question that pertains both to measurement of variablesand to design for analysis.
One reasonable way to provide evidence for Gf, Gc
and SAR is to first factor among tests at the primaryability level and then factor among the primary factorsto produce a second-order solution. A problem withthis approach for the present analysis is that with only27 tests it is not realistic to expect to define the 12 pri-mary factors that are needed to define the second-orderdimensions; that is, this is not realistic if one rejects useof Procrustean methods. We have provided good rea-sons why a researcher should reject use of such methodsin applications similar to this one (Horn, 1967; Horn &Knapp, 1973,1974; Horn & McArdle, 1980).1
Recent evidence suggests that several of the primaryabilities listed above are most related to a long-termmemory factor identified as tertiary storage and re-trieval (TSR), which ia distinct from SAR, so the col-
1 It should be realized that the cautions representedin these studies are only cautions, not blanket rejectionsof Procrustean methods. As pointed out in the ref-erenced articles, there are several situations in whichProcrustean methods are desirable.

800 L. STANKOV, J. HORN, AND T. ROY
lection of primary abilities really represents four sec-ond-order factors, not three. This makes the problemof overdetermining the needed primary structure veryunrealistic indeed.
In general, there are simply not enough variables todefine an objectively rotated structure involving thenumber of first-order and second-order factors impliedby the sampling of variables. If objectively rotatedmethods of factoring are to be employed, the approachof factoring at the first order and then at the secondorder is precluded.
It might be possible to provide dependable resultswith this approach by using maximum likelihood con-firmatory methods (Joreskog, 1973). These are es-sentially Procrustes solutions (Horn, 1967) with theadded strength, however, that they contain statisticaltests of how well the forced fit does indeed fit. How-ever, there are several problems with using thesemethods that need to be understood much better beforeone can be confident that results are indeed dependable(Horn & McArdle, 1980).
For these reasons, then, the approach of factoring atthe primary level was rejected for the present study, anda third reasonable approach was adopted. In this ap-proach, the evidence of previous research is used as abasis for defining the primary factors as linear com-posite variables. It is recognized that factors indicateconcepts, the operational definition of which can varysomewhat from one study to another. The verbalcomprehension primary factor, for example, has beendefined in no fewer than 34 studies in the last decadeand by a somewhat different configuration of variablesin each study. Thus, several different sets of variablescould be selected to measure the factor. The listing ofvariables given above to measure the 12 primary abili-ties of the present study is only one among many waysin which the concepts represented by these factors canbe made operational. No doubt this operational defi-nition is far from ideal, but it does represent one ac-ceptable way of achieving objective indication of thevariables of principal interest (Wackwitz & Horn,1971).
This particular set of primary factors was chosen tooverdetermine both Gf and Gc, as well as SAR. Fluidintelligence was expected to be indicated by Induction(visual), Induction (auditory), and Cognition of FiguralRelations (CFR) with lesser loadings from NumberFacility (N) and some of the memory variables. Crys-tallized intelligence was expected to be defined byNumber Facility (N), Verbal Comprehension (V), andCognition of Semantic Relations (CMR), with lowerloadings coming from Associational Fluency (Fa),Ideational Fluency (Fa), and Word Fluency (Fw), andagain, some of the memory variables.
The sampling of memory abilities designed to indi-cate SAR (i.e., LI) was derived largely from the work ofKelley (1964), McKenna (Note 1), and Jensen (1973b).This work indicated three distinct primary factorsamong a wide variety of memory tasks, namely, Ms, Ma,and meaningful memory (Mm). These three factorswere also found in the work of Guilford and his asso-ciates and in a comprehensive study by Hakstian andCattell (1974).
The work of McKenna (Note 1) was particularlyimportant for purposes of the present study because it
indicated a factor of memory for emphasis that may beequivalent to the meaningful memory factor found inKelley's study. A memory for emphasis test (empha-sized word recall) was used in the present study as amarker for Mm.
It should be noted, however, that Mm is generallyregarded by researchers on primary abilities as less wellestablished than either of the other two memory pri-maries. For example, Ekstrom et al. (1979) noted thatthe evidence in this area is probably best interpreted asindicative of a factor of rote memory of related material.As will be described in the section on procedures,analyses were conducted to examine the premise thatMm represents a form of memory that is distinct fromMs and Ma. It will be noted that this issue is importantfor considerations of whether SAR (LI) is separate fromGfandGc.
Recent evidence on structure (e.g., Horn, 1978a)suggests that TSR might be indicated in the data of thisstudy by Fa and Fi, and possibly Fw (although Horn,1970, has suggested that Fw may not be a part of thefactor). It is pushing at the limits of overdetermination,however, to expect to get four factors out of 12 primaryability variables. The TSR factor is underdeterminedrelative to the constraints originally specified byThurstone (1947) and recently emphasized in thestudies of Horn (1967), Horn and Knapp (1973,1974),and Humphreys, Ilgen, McGrath, and Montanelli(1969). It would not be surprising, therefore, to find athree-factor solution in which TSR is not defined.
Test Administration and Scoring
All tests were group administered. Each testingsession lasted two school periods (80 minutes). Foreach group the sessions occured on 2 days, 1 week apart.The instructions were prerecorded on a SONY TC-133cassette tape recorder. An overhead projector was usedfor Test 14. Classroom sizes and seating varied de-pending on the resources of the school, but each subjectsat at the same desk for the two sessions. All Frenchet al. (1963) tests were scored as described in themanual.
As noted previously, questions have been raised inprevious research about whether Mm is indeed a sepa-rate primary ability, distinct from Ma and Ms. Becausethe status of Mm was somewhat in doubt and becausethe marker variables selected to indicate the factor inthis study had not been well confirmed by previous re-search, preliminary analyses were carried out for thepurpose of indicating the structure among the nineshort-term memory variables.
The intercorrelations among the nine memory vari-ables were factored in accordance with orthogonalProcrustes procedures suggested by Lawley and Max-well (1964). Three factors were estimated (in accor-dance with hypotheses of Ms, Ma, and Mm). TheLawley-Maxwell procedures differ from similar proce-dures embodied in the well-known LISREL program(Joreskog & Sprbom, 1978) in that the zeros of the targetneed not remain fixed but can take on small nonzerovalues in the estimated solution. The zero and nonzerovalues of the target were specified as shown in Table 2.The solution obtained on the total sample of subjects
Gf/Gc AND LEVEL I/LEVEL II THEORY 801
Table 2Factor Patterns for Nine Memory Tests
Testno. Variable
Subsamples
Target matrix
Ms Ma Mm
Procrustes(young subjects)
Ms Ma Mm
Solutions(old subjects)
Ms Ma Mm
Total sampleProcrustes
Ms Ma Mm
13
14
15
16
17
18
19
20
21
Auditory numberspan
Visual numberspan
Auditory letterspan
Low associatedword pairs
Word-Numberpairs
Low associatedserial recall
High associatedword pairs
Emphasized wordrecall
High associatedserial recall
1
1
1
0
0
0
0
0
0
0
0
0
1
1
1
0
0
0
0
0
0
0
0
0
11
1
83
92
82
04
-07
-14
38
03
19
-07
-07
-10
82
79
92
49
02
58
-02
-03
09
-19
28
-11
30
93
15
90
72
82
02
11
-04
-09
07
-01
04
28
-20
67
73
84
47
-08
82
-06
-17
26
28
-25
09
56
85
01
88
82
84
-01
-03
-04
07
00
09
-02
02
-09
81
68
88
59
-03
65
-08
07
-03
06
24
-14
19
98
18
Note. Decimals have been omitted; salients are underlined. Ms = memory span; Ma = associative memory;Mm = meaningful memory.
is shown near the far right in Table 2, under "Pro-crustes."
It will be noted that the Procrustes solution on thetotal sample indicates Ms and Ma factors, but the Mmfactor is not well defined in terms of requirements suchas have been specified by Horn and Knapp (1974) andHumphreys et al. (1969): The Procrustes algorithmtends to direct most of the variance of the factor toemphasized word recall. In this test the subject listensto a paragraph in which 10 of the words have been em-phasized by being spoken more loudly than the otherwords. The hypothesis (McKenna, Note 1) is that theparagraphs provide a meaningful basis for associatingthe target words in the context of other words, and forthis reason the variable should relate to the Mmfactor.
One could define the Mm factor using the single test,emphasized word recall. This would be a rather leanfactor. It seemed, however, that the factor might beindicated more adequately if particular features of thesampling of subjects were taken into account. In par-ticular, it was noted that high associated word pairs andcategorized serial recall would have different relationsto meaningful memory in young as compared to olderchildren: A child would need to have acquired aknowledge base of the words before the tests could beexpected to represent meaningful word association. Onthe basis of this reasoning, the total sample was splitinto subsamples of younger and older children. Thesample of younger children was made up of students inForm 3 (average age was 14), and the sample of olderchildren was comprised of students in Form 5 (average
age was 16). The factoring was done in the mannerdescribed above for both subsamples. The results areshown near the left in Table 2.
The results from these analyses provide some supportfor using high associated word pairs and emphasizedword recall to measure a meaningful memory factor thatis independent of Ms and Ma. The factor is not welloverdetermined in accordance with the guidelinessuggested by Horn (1967), Horn and Knapp (1974), andHumphreys et al. (1969), but it does meet minimumcritiera for reasonable definition of a common factor.On this basis meaningful memory was defined as thesum of standard scores on the variables numbered 19and 20.
Contrary to the claim of Jensen and Frederiksen(1973) that high associated serial recall and low asso-ciated serial recall separately define Level II and LevelI abilities (respectively), the results of Table 2 indicatethat the two variables go together in the one Ma factor.This was true in each of the three separate factor solu-tions.2
Each of the 11 primary abilities, as well as the Mm
2 It is of some interest to notice that the high associ-ated word pairs variable has a high loading on the Msfactor in the subsample of younger children but not inthe subsample of older children. This suggests thatsome of the associations among the words were often notknown to the younger children and that therefore thesechildren were forced, as it were, to use simple spanmemory to retain the words.
802 L. STANKOV, J. HORN, AND T. ROY
factor, was obtained by simple summation of the z-scores for the tests that in previous research had beenshown to define the factors (as indicated previously inthis section). Structural analyses were carried out onthe resulting 12 primary ability measures.
Results
Analyses
Two kinds of analyses were conducted:(a) factor analyses among measures of pri-mary abilities to provide evidence of Gf, Gc,and SAR and (b) regression analysis andanalysis of variance to examine hypothesespertaining to SES differences. These twokinds of analyses will be described in thisorder of listing.
Factor analyses. Several methods ofextracting factors were tried includingtruncated principal components, principalaxes (communality estimation), maximumlikelihood, and image analyses procedures.In all cases, three factors were estimated, thisbeing the number indicated by the root-onecriterion. In the image analysis solutionorthoblique rotation was employed, whereasrotation in the other solutions was by vari-max followed by promax, with power set at5. The solutions in all cases were similar.There are several theoretical reasons forprefering the image-analysis estimation ofLittle Jiffy, Mark IV (Kaiser & Rice, 1974),and so the results from application of this
program are included along with results fromthe better known varimax and promaxanalyses.
There are several problems with theorthoblique subroutine of Little Jiffy, how-ever, the principal one being that it yieldscorrelations among factors that are unreal-istically large. Experience in working withthese methods indicates that the orthobliquecorrelations are about .25 higher than thecorrelations obtained with promax based onvarimax (Stankov, 1979) and that promaxcorrelations, in turn, are good estimates ofthe correlations for the best estimates ofpopulation factor scores (Wackwitz & Horn,1971). This prior experience is verified bythe results of the present study.
The intercorrelations among the primaryabilities are shown in Table 3. Two factorsolutions obtained with Little Jiffy areshown in Table 4. One of these solutionsincludes the Mm primary factor; the otherdoes not. As mentioned earlier, doubts canbe raised about whether Mm is distinct fromMa and Ms. It was of some interest, there-fore, to determine how the second-order so-lution might be altered by eliminating theMm primary. In both solutions the root-onecriterion for the number of factors wasadopted.
The first factor is a clearly defined fluidintelligence. The second factor- containshigh loadings on V, CMR, Fa, Fi, and Fw,
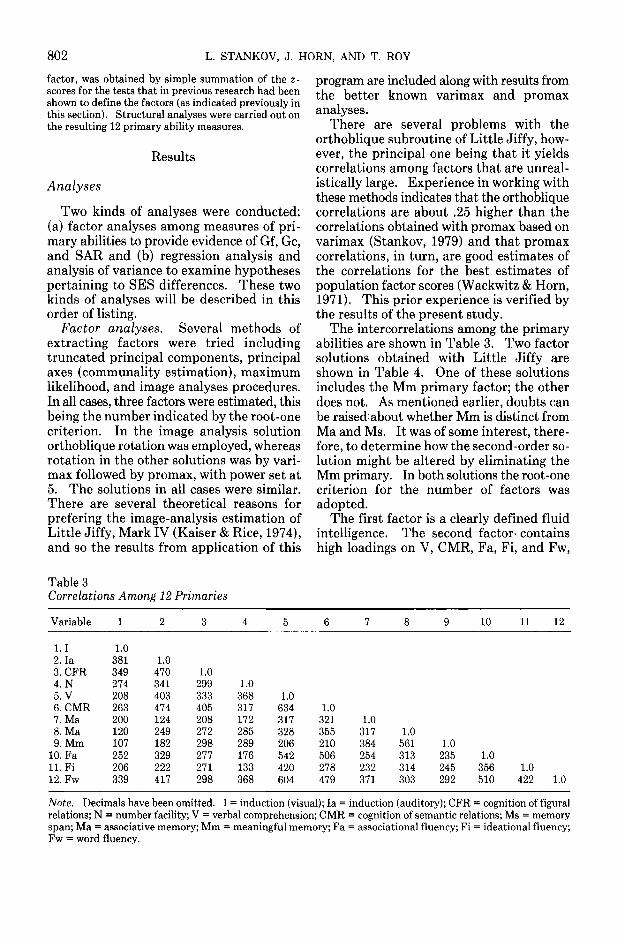
Table 3Correlations Among 12 Primaries
Variable 10 11 12
I.I2. la3. CFR4. N5. V6. CMR7. Ms8. Ma9. Mm10. Fa11. Fi12. Fw
1.0381349274208263200120107252206339
1.0470341403474124249182329222417
1.0299333405208272298277271298
1.0368317172285289176133368
1.0634317328206542420604
1.0321355210506278479
1.0317384254232371
1.0561313314303
1.0235245292
1.0356510
1.0422 1.0
Note. Decimals have been omitted. I = induction (visual); la = induction (auditory); CFR = cognition of figuralrelations; N = number facility; V = verbal comprehension; CMR = cognition of semantic relations; Ms = memoryspan; Ma = associative memory; Mm = meaningful memory; Fa = associational fluency; Fi = ideational fluency;Fw = word fluency.
Gf/Gc AND LEVEL I/LEVEL II THEORY 803
Table 4Factor Pattern Matrices Based on Three Methods of Factoring and Two Sets of Variables
12 primaries
Variable
IlaCFR-02NV75CMRMsMaMm*FaFiFw
VAR
6873
6025
38031522140330
Gf
PRO
747468
6203
23-13
0113
-07-17
12
ORT
505870
36-02
18-12-04
04-06-11
04
VAR
123353
1180
67332404755970
Gc
PRO
-061919
-0885
662811
-16826470
ORT
-080800
0079
572608
-14674662
VAR
05-02-07
2612
11587585122721
SAR
PRO
-04-16
20
20-04
-04567589
-021806
11 primaries
ORT
020811
14-06
-05355666001505
Gf
615911
30
18-07
05—
-07-09
04
Gc
-080155
08-03
524740—675665
GfGcSAR
Gf
.85
.68
Gc.52
.71
Factor intercorrelations"
SAR.33.39
Gf Gc
.87
Note. Loadings of .30 or larger have been underlined to indicate saliency. VAR = varimax; PRO = promax;ORT = orthoblique; Gf = fluid intelligence; Gc = crystallized intelligence; SAR = short-term acquisition retrieval;I = induction (visual); la = induction (auditory); CFR = cognition of figural relations; N = number facility; V= verbal comprehension; CMR = semantic relations; Ms = memory span; Ma = associative memory; Mm =meaningful memory; Fa = asaociational fluency; Fi = ideational fluency; Fw = word fluency.* Mm dropped out; see text.a Promax is afeove diagonal; orthoblique is below.
and thus may be seen as reflecting the ac-culturation processes that scholastic successdemands. This factor is interpreted ascrystallized intelligence.. The third factoris a distinct memory factor defined by Ms,Ma, and Mm. It is broader than the mem-ory factor found in Jensen's (1973b) studybut corresponds rather closely to the SARdimension specified by Horn. As antici-pated, a TSR factor was not found. Thefluency measures that might have definedthis factor are here correlated with Gc, as inprevious studies (e.g., Horn, 1978a; Horn &Cattell, 1966). LI/LII theory makes nocommitments regarding a TSR factor or thefluency measures. It seems likely, however,that these abilities would be regarded as in-dicative of LII.
As mentioned earlier, it is of some interestto ask if the SAR dimension is indicated if
Mm is not included in the analyses at thesecond order. The second set of results inTable 4 indicates that, indeed, SAR is notsufficiently overdetermined by only Ma andMs and such other memory variance as maybe contained in the other primary abilitiesof this study. Thus it seems that the mini-mum conditions for determining SAR arethree primary-level memory factors. Suchresults are consistent with the arguments ofHorn and Knapp (1974) and Humphreys etal. (1969). In Jensen's structural analysesonly the Ms factor was determined.
If one were not to accept our previousarguments about orthoblique factor corre-lations being unrealistically high, then seri-ous questions about the independence offactors are raised by the Little Jiffy solu-tions. Results of relevance for addressingthese issues are provided in Table 5. Here
804 L. STANKOV, J. HORN, AND T. ROY
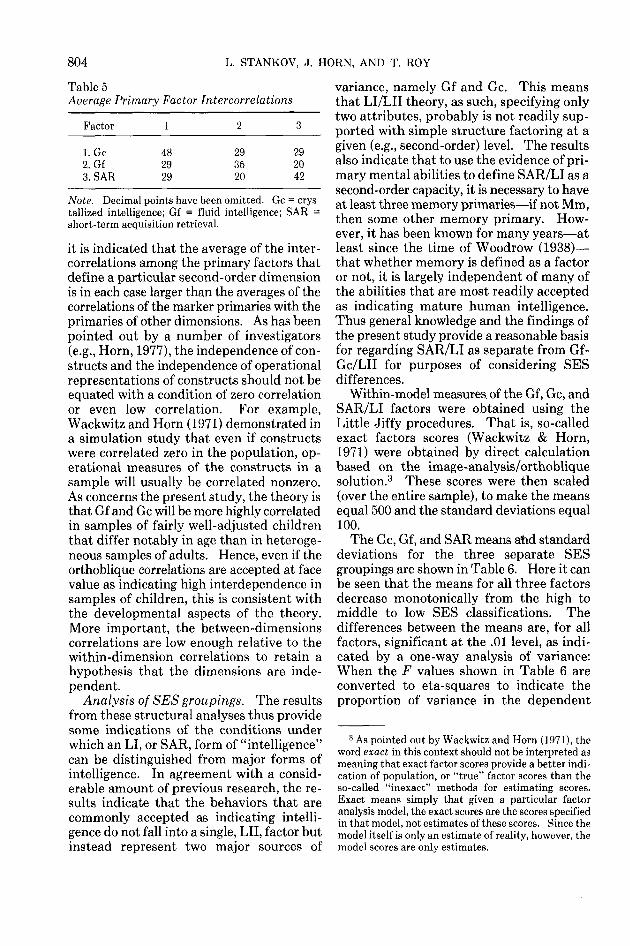
Table 5Average Primary Factor Intercorrelations
Factor 1
1. Gc2. Gf3. SAR
482929
293520
292042
Note. Decimal points have been omitted. Gc = crys-tallized intelligence; Gf = fluid intelligence; SAR =short-term acquisition retrieval.
it is indicated that the average of the inter-correlations among the primary factors thatdefine a particular second-order dimensionis in each case larger than the averages of thecorrelations of the marker primaries with theprimaries of other dimensions. As has beenpointed out by a number of investigators(e.g., Horn, 1977), the independence of con-structs and the independence of operationalrepresentations of constructs should not beequated with a condition of zero correlationor even low correlation. For example,Wackwitz and Horn (1971) demonstrated ina simulation study that even if constructswere correlated zero in the population, op-erational measures of the constructs in asample will usually be correlated nonzero.As concerns the present study, the theory isthat Gf and Gc will be more highly correlatedin samples of fairly well-adjusted childrenthat differ notably in age than in heteroge-neous samples of adults. Hence, even if theorthoblique correlations are accepted at facevalue as indicating high interdependence insamples of children, this is consistent withthe developmental aspects of the theory.More important, the between-dimensionscorrelations are low enough relative to thewithin-dimension correlations to retain ahypothesis that the dimensions are inde-pendent.
Analysis of SES groupings. The resultsfrom these structural analyses thus providesome indications of the conditions underwhich an LI, or SAR, form of "intelligence"can be distinguished from major forms ofintelligence. In agreement with a consid-erable amount of previous research, the re-sults indicate that the behaviors that arecommonly accepted as indicating intelli-gence do not fall into a single, LII, factor butinstead represent two major sources of
variance, namely Gf and Gc. This meansthat LI/LII theory, as such, specifying onlytwo attributes, probably is not readily sup-ported with simple structure factoring at agiven (e.g., second-order) level. The resultsalso indicate that to use the evidence of pri-mary mental abilities to define SAR/LI as asecond-order capacity, it is necessary to haveat least three memory primaries—if not Mm,then some other memory primary. How-ever, it has been known for many years—atleast since the time of Woodrow (1938)—that whether memory is defined as a factoror not, it is largely independent of many ofthe abilities that are most readily acceptedas indicating mature human intelligence.Thus general knowledge and the findings ofthe present study provide a reasonable basisfor regarding SAR/LI as separate from Gf-Gc/LII for purposes of considering SESdifferences.
Within-model measures of the Gf, Gc, andSAR/LI factors were obtained using theLittle Jiffy procedures. That is, so-calledexact factors scores (Wackwitz & Horn,1971) were obtained by direct calculationbased on the image-analysis/orthobliquesolution.3 These scores were then scaled(over the entire sample), to make the meansequal 500 and the standard deviations equal100.
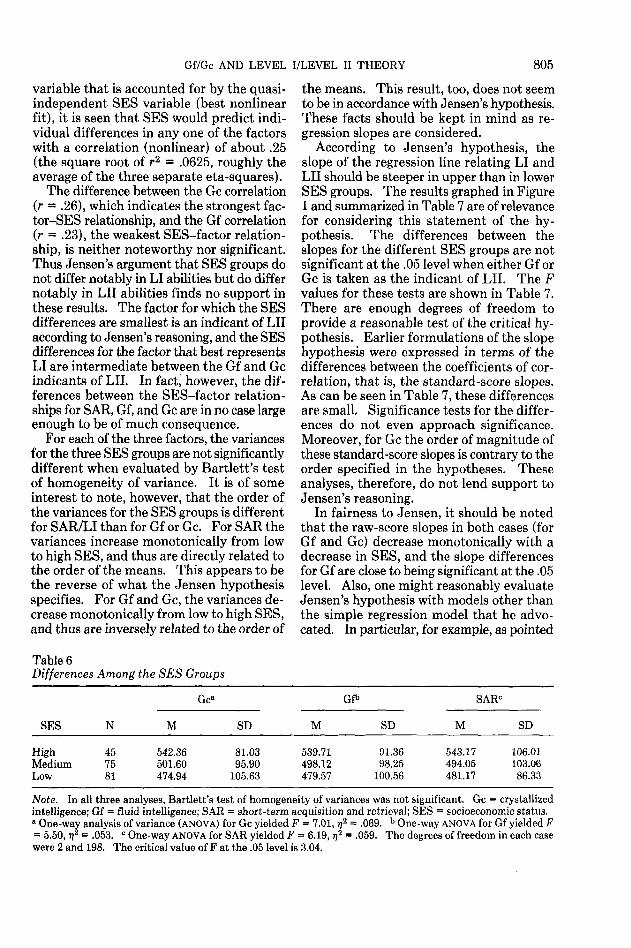
The Gc, Gf, and SAR means ahd standarddeviations for the three separate SESgroupings are shown in Table 6. Here it canbe seen that the means for all three factorsdecrease monotonically from the high tomiddle to low SES classifications. Thedifferences between the means are, for allfactors, significant at the .01 level, as indi-cated by a one-way analysis of variance:When the F values shown in Table 6 areconverted to eta-squares to indicate theproportion of variance in the dependent
3 As pointed out by Wackwitz and Horn (1971), theword exact in this context should not be interpreted asmeaning that exact factor scores provide a better indi-cation of population, or "true" factor scores than theso-called "inexact" methods for estimating scores.Exact means simply that given a particular factoranalysis model, the exact scores are the scores specifiedin that model, not estimates of these scores. Since themodel itself is only an estimate of reality, however, themodel scores are only estimates.
Gf/Gc AND LEVEL I/LEVEL II THEORY 805
variable that is accounted for by the quasi-independent SES variable (best nonlinearfit), it is seen that SES would predict indi-vidual differences in any one of the factorswith a correlation (nonlinear) of about .25(the square root of r2 = .0625, roughly theaverage of the three separate eta-squares).
The difference between the Gc correlation(r = .26), which indicates the strongest fac-tor-SES relationship, and the Gf correlation(r = .23), the weakest SES-factor relation-ship, is neither noteworthy nor significant.Thus Jensen's argument that SES groups donot differ notably in LI abilities but do differnotably in LII abilities finds no support inthese results. The factor for which the SESdifferences are smallest is an indicant of LIIaccording to Jensen's reasoning, and the SESdifferences for the factor that best representsLI are intermediate between the Gf and Gcindicants of LII. In fact, however, the dif-ferences between the SES-factor relation-ships for SAR, Gf, and Gc are in no case largeenough to be of much consequence.
For each of the three factors, the variancesfor the three SES groups are not significantlydifferent when evaluated by Bartlett's testof homogeneity of variance. It is of someinterest to note, however, that the order ofthe variances for the SES groups is differentfor SAR/LI than for Gf or Gc. For SAR thevariances increase monotonically from lowto high SES, and thus are directly related tothe order of the means. This appears to bethe reverse of what the Jensen hypothesisspecifies. For Gf and Gc, the variances de-crease monotonically from low to high SES,and thus are inversely related to the order of
Table 6Differences Among the SES Groups
the means. This result, too, does not seemto be in accordance with Jensen's hypothesis.These facts should be kept in mind as re-gression slopes are considered.
According to Jensen's hypothesis, theslope of the regression line relating LI andLII should be steeper in upper than in lowerSES groups. The results graphed in Figure1 and summarized in Table 7 are of relevancefor considering this statement of the hy-pothesis. The differences between theslopes for the different SES groups are notsignificant at the .05 level when either Gf orGc is taken as the indicant of LII. The Fvalues for these tests are shown in Table 7.There are enough degrees of freedom toprovide a reasonable test of the critical hy-pothesis. Earlier formulations of the slopehypothesis were expressed in terms of thedifferences between the coefficients of cor-relation, that is, the standard-score slopes.As can be seen in Table 7, these differencesare small. Significance tests for the differ-ences do not even approach significance.Moreover, for Gc the order of magnitude ofthese standard-score slopes is contrary to theorder specified in the hypotheses. Theseanalyses, therefore, do not lend support toJensen's reasoning.
In fairness to Jensen, it should be notedthat the raw-score slopes in both cases (forGf and Gc) decrease monotonically with adecrease in SES, and the slope differencesfor Gf are close to being significant at the .05level. Also, one might reasonably evaluateJensen's hypothesis with models other thanthe simple regression model that he advo-cated. In particular, for example, as pointed
Gca SARC
SES N M SD M SD M SD
HighMediumLow
457581
542.36501.60474.94
81.0395.90
105.63
539.71498.12479.57
91.3698.25
100.56
543.17494.05481.17
106.01103.0686.33
Note. In all three analyses, Bartlett's test of homogeneity of variances was not significant. Gc = crystallizedintelligence; Gf = fluid intelligence; SAR = short-term acquisition and retrieval; SES = socioeconomic status.a One-way analysis of variance (ANOVA) for Gc yielded F = 7.01,7j2 = .069. b One-way ANOVA for Gf yielded F= 5.50,7j2 = .053. c One-way ANOVA for SAR yielded F = 6.19, tf = .059. The degrees of freedom in each casewere 2 and 198. The critical value of F at the .05 level is 3.04.
806
742
L. STANKOV, J. HORN, AND T. ROY
742
160 280 400 520 640CRYSTALLIZED INTELLIGENCE
760 324 427 530 633
FLUID INTELLIGENCE736
Figure 1. Regression lines of Level I abilities (Short-term acquisition and retrieval [SAR], memory)on Level II abilities (fluid and crystallized intelligence). (SES = socioeconomic status.)
out by a reviewer of an earlier draft of thisarticle, Jensen's hypothesis can be regardedas making a directional prediction in regardto the slopes, so one could make pairwisetests with directional alternate hypothesesusing the overall error rate. This testsuggests significance for Gf.
The following multiple regression modelalso might be regarded as a reasonable basisfor evaluating Jensen's hypothesis:
M = b0 + b^ + b2S + b3(g X S), (1)
where M represents a measure of LI, g rep-resents a measure of LII, and S representsSES. In this formulation, a test of the sig-
Table 7Differences Among Slopes
SES
SAR on Gf
Slope
SAR on Gcb
Slope
HighMediumLow
.713
.708
.603
.827
.743
.518
.665
.729
.712
.870
.784
.582
Note. SES = socioeconomic class; SAR = short-termacquisition and retrieval; Gf = fluid intelligence; Gc =crystallized intelligence.a F (2,195) = 3.03. bF(2, 195) = 2.66.
nificance of the 63 regression weight for theinteraction between g and S might be in-terpreted as indicating that the level of SES(low to high) needs to be taken into accountin predicting LI from LII and S. This isstretching a bit to find a test of the hypoth-eses (because of its post hoc nature), and itis a very sensitive test indeed (not recom-mended by Jensen), but with such stretchingand given that high sensitivity might bedeemed desirable, one can find significance(at the .05 level) for 63 when Gf is taken as anindicant of LII but not when Gc is used torepresent LII (F = 3.20).
These results might thus be interpreted aslending mild support for Jensen's hypothe-sis. To keep this idea of support in per-spective, the reader should note that it de-rives from only one of the two factors thatJensen regards as indicative of LII, and pri-marily reflects a finding that the order ofvariances in relation to the order of themeans for SES groups is different for SARthan for Gf and Gc.
Discussion
These results thus provide limited evi-dence in support of a hypothesis of a short-
Gf/Gc AND LEVEL I/LEVEL II THEORY 807
term acquisition and retrieval function thatis independent of Gf and Gc. SAR is de-fined if one accepts that Mm is adequatelymeasured as a primary mental ability in thisstudy and thus can be included as a markerfor SAR, along with Ma and Ms, but the di-mension is not sufficiently overdeterminedby only the latter two markers. Fortunately,the evidence for SAR is not limited to thepresent study. As noted earlier, 40 years agoWoodrow (1938) made a good case for thedistinction between memory and intelli-gence. The recent work of Horn (1978a,1978b, in press), Horn and Bramble (1967),and Hundal and Horn (1977) indicates thestructural distinction and also points to de-velopmental differences between SAR incontrast to Gf and Gc. The present workcan thus be seen as indicating some of thelimiting conditions for identifying SAR indistinction from Gf and Gc.
The results provide new perspectives forevaluating Jensen's (1973a, 1973b) state-ments regarding socioeconomic groups anddifferent levels of intelligence. They indi-cate that when sampling does not produce acontrast between only one extreme groupand a midgroup with respect to the abilitiesof interest, the differences between SESgroups are significant for LI (i.e., SAR) aswell as for LII (i.e., Gf or Gc), and the dif-ferences between the differences are neithernoteworthy nor significant. Similarly, theregression slopes for LI and LII in differentSES groups are not notably different. If onegoes beyond Jensen's suggestions to find amore sensitive test of what might be impliedby his hypothesis, weak support might beclaimed. Viewed concretely, this supportrepresents a finding (in these data at least)that the variance on SAR is decreased inlower SES groups compared to higher ones,whereas the variance increases with decreasein SES for both Gf and Gc. This findingmay be consistent with Jensen's hypothesis,but it must be evaluated within a frame ofreference that includes recognition that thevariances are not significantly different whenevaluated by Bartlett's rather sensitive test.Overall, therefore, these results do not lendstrong support to Jensen's theorizing.
Humphreys and Dachler (1969) andHumphreys and Fleishman (1974) pointed
out that the correlations between indicantsof LII and various other ability measuresvary considerably and not necessarily (i.e.,it has yet to be demonstrated) in accordancewith an LI versus LII conception of theseabilities. Horn (1976) reiterated this pointand noted, too, that the slope of regressionlines in different subsamples will depend onthe variances of the different measures, andthese in turn will be a function of direct andindirect selection with respect to one or morefactors (Campbell & Stanley, 1963). Whenthere is selection at the extremes along onefactor, there tends to be reduction in vari-ance of that factor and shift in slope as afunction of this fact. Horn pointed out thatthis is a parsimonious interpretation ofJensen's findings pertaining to slope. In theHumphreys-Dachler and Humphreys-Fleishman studies it was pointed out that thesame kind of interpretation is reasonable forthe interactions that Jensen had interpretedas providing support for his theory. Asnoted, these investigators stressed the factthat precisely the same kinds of findings canbe expected for variables that are not re-garded as aspects of LI relative to LII.
The present analyses and results differfrom those of Jensen in one notable respect:Groups were selected at both extremes andin the middle with respect to each of thethree major factors. This means that se-lection at one extreme has not occurred.The conditions that Horn and Humphreyscited as parsimonious bases for interpreta-tions of slope differences or interactions donot obtain, at least not to a noteworthy de-gree, and the between-groups differencesturn out to be close to what they pre-dicted.
Similarly, the measurement of SAR (LI)in the present study differs from the mea-surement of LI in Jensen's work, and this,too, sheds new light on the matter of differ-ences between SES groups. The broad SARdimension no doubt comes closer to what isregarded as intelligence in most theoriesthan does the narrow Ms factor that hadbeen the operational definition of LI inJensen's study. It is not unlikely that theSAR of the present study is more reliable (aswell as more valid as an indicant of intelli-gence) than the usual measures of Ms, for
808 L. STANKOV, J. HORN, AND T. ROY
there are many extraneous influences thataffect memory measurements (see Horn,1970,1976, for review). For these reasons,as well as for reasons pertaining to the vari-ances of the measures, substantial be-tween-SES differences for SAR can be ex-pected (as in the present study) when small,perhaps insignificant, differences in Ms werefound in Jensen's previous work.
These results suggest that several of theconnotations of Level I/Level II theory maybe misleading. Interpretations of Level I asa kind of intelligence need to be regardedwith particular caution. As Horn (1976)pointed out, many ability factors can be re-garded as a kind of intelligence. But littleadvance in understanding is gained by thisassumption if the claim is not closely linkedwith theory that separates a "form of intel-ligence" from the forms of primary abilitiesand second-order functions.
Reference Note
1. McKenna, V. V. Stylistic factors in learning andretention (ETS RB-68-28). Princeton, N.J.: Ed-ucational Testing Service, 1968.
References
Campbell, R. B., & Stanley, J. C. Experimental andquasi-experimental designs for research on teaching.In N. L. Gage (Ed.), Gage handbook for research onteaching. Chicago, 111.: Rand-McNally, 1963.
Cattell, R. B. Abilities: Their structure, growth andaction. Boston, Mass.: Houghton Mifflin, 1971.
Congalton, A. A. Status and prestige in Australia.Melbourne, Australia: Chesine, 1969.
Darlington, R. B. Another look at "cultural fairness."Journal of Educational Measurement, 1971, 8,71-82.
Ekstrom, R. B., French, J. W., & Harman, H. H. Cog-nitive factors: Their identification and replication.Multivariate Behavioral Research Monographs,1979,2.
French, J. W., Ekstrom, R. B., & Price, L. A. Manualof reference tests for cognitive factors. Princeton,N.J.: Educational Testing Service, 1963.
Guilford, J. P. The nature of human intelligence.New York: McGraw-Hill, 1967.
Hakstian, A. R., & Cattell, R. B. The checking of pri-mary ability structure on a broader basis of perfor-mances. British Journal of Educational Psychology,1974, 44, 140-154.
Hall, V. C., & Kaye, D. B. Early patterns of cognitivedevelopment, Monographs of the Society for Re-
search in Child Development, in press.Horn, J. L. On subjectivity in factor analysis. Edu-
cational and Psychological Measurement, 1967,27,811-820.
Horn, J. L. Organization of abilities and the develop-ment of intelligence. Psychological Review, 1968,75, 242-259.
Horn, J. L. Organization of data on life-span devel-opment of human abilities. In R. L. Goulet & P. B.Baltes (Eds.), Life-span developmental psychology:Theory and research. New York: Academic Press,1970.
Horn, J. L. The structure of intellect: Primary abili-ties. In R. H. Dreger (Ed.), Multivariate personalityresearch. Baton Rouge, La.: Claitor, 1972.
Horn, J. L. The prima facia case for the heritability ofintelligence and associates. A review of A. R. Jen-sen's "Educability and group differences." Amer-ican Journal of Psychology, 1974,87, 546-551.
Horn, J. L. Human abilities: A review of research andtheory in the early 1970's. Annual Review of Psy-chology, 1976, 27, 437-485.
Horn, J. L. Personality and ability theory. In R. B.Cattell & R. M. Dreger (Eds.), Handbook of modernpersonality theory. London: Hemisphere, 1977.
Horn, J. L. Human ability systems. In P. B. Baltes(Ed.), Life-span development and behavior. NewYork: Academic Press, 1978. (a)
Horn, J. L. The nature and development of intellectualabilities. In R. T. Osborne, C. E. Noble, & N. Weyl(Eds.), Human variation: The biopsychology of age,race and sex. New York: Academic Press,1978. (b)
Horn, J. L. The rise and fall of human abilities.Journal of Research and Development in Education,1979,12, 59-78.
Horn, J. L. Concepts of intellect in relation to learningand adult development. Intelligence, in press.
Horn, J. L., & Bramble, W. J. Second-order abilitystructure revealed in rights and wrongs scores.Journal of Educational Psychology, 1967, 58,115-122.
Horn, J. L., & Cattell, R. B. Refinement and test of thetheory of fluid and crystallized intelligence. Journalof Educational Psychology, 1966,57, 253-270.
Horn, J. L. & Donaldson, G. Cognitive development.II: Adulthood development of human abilities. In0. G. Brim & J. Kagan (Eds.), Constancy and changein human development: A volume of review essays.Cambridge, Mass.: Harvard University Press,1980.
Horn, J. L., & Knapp, J. R. On the subjective characterof the emprical base of Guilford's structure-of-in-tellect model. Psychological Bulletin, 1973, 80,33-43.
Horn, J. L., & Knapp, J. R. Thirty wrongs do not makea right: A reply to Guilford. Psychological Bulletin,1974,81, 502-504.
Horn, J. L. & McArdle, J. J. Perspectives on mathe-matical/statistical model building (MASMOB) in re-search on aging. In L. F. Poon (Ed.), Aging in the1980's: Selected contemporary issues in the psy-chology of aging. Washington, D.C.: AmericanPsychological Association, 1980.
Humphreys, L. G., & Dachler, P. Jensen's theory of

Gf/Gc AND LEVEL I/LEVEL II THEORY 809
intelligence. Journal of Educational Psychology,1969,50, 419-426.
Humphreys, L. G., & Fleishman, A. Pseudo-orthogonaland other analysis of variance designs involving in-dividual differences variables. Journal of Educa-tional Psychology, 1974,66, 464-472.
Humphreys, L. G., Ilgen, D., McGrath, D., & Monta-nelli, R. Capitalization on chance in rotation offactors. Educational and Psychological Measure-ment, 1969,29, 259-271.
Hundal, P. S., & Horn, J. L. On the relationships be-tween short-term learning and fluid and crystallizedintelligence. Applied Psychological Measurement,1977,7,11-21.
Jensen, A. R. A two-factor theory of familial mentalretardation. Proceedings of the 4th InternationalConference on Human Genetics. Amsterdam,Holland: Excerpta Medica, 1971.
Jensen, A. R. Genetics and education. London:Methuen, 1972.
Jensen, A. R. Educability and group differences.New York: Harper & Row, 1973. (a)
Jensen, A. R. Level I and Level II abilities in threeethnic groups. American Educational ResearchJournal, 1973,10, 263-276. (b)
Jensen, A. R. Interaction of Level I and Level II abili-ties with race and socioeconomic status. Journal ofEducational Psychology, 1974,66, 99-111.
Jensen, A. R., & Prederiksen, J. Free recall of catego-rized and uncategorized lists: A test of Jensen's hy-pothesis. Journal of Educational Psychology, 1973,65, 304-312.
Joreskog, K. G. A general method for estimating alinear structural equation system. In A. S. Gold-berger & 0. D. Duncan (Eds.), Structural equationsmodels in the social sciences. New York: SeminarPress, 1973.
Joreskog, K. G., & Sorbom, D. LISREL IV: Analysisof linear structural relationships by the method of
maximum likelihood. Chicago, 111.: National Ed-ucational Resources, 1978.
Kaiser, H. F., & Rice, J. Little Jiffy Mark IV. Edu-cational and Psychological Measurement, 1974,34,111-117.
Kelley, H. P. Memory abilities: A factor analysis.Psychometric Monographs, 1964,11, 1-53.
Lawley, D. N., & Maxwell, A. E. Factor transformationmethods. British Journal of Statistical Psychology,1964,77, 97-103.
Rossman, B. B., & Horn, J. L. Cognitive, motivational,and temperamental indicants of creativity and in-telligence. Journal of Educational Measurement,1972, 9, 256-266.
Schmidt, F. L., & Hunter, J. E. Racial and ethnic biasin psychological tests. American Psychologist, 1974,29, 1-8.
Shucard, D. W., & Horn, J. L. Cortical evoked poten-tials and measurement of human abilities. Journalof Comparative and Physiological Psychology, 1972,78, 59-68.
Stankov, L. Hierarchical factoring based on imageanalysis and orthoblique rotations. MultivariateBehavioral Research, 1979,14, 330-353.
Stankov, L., & Horn, J. L. Human abilities revealedthrough auditory tests. Journal of EducationalPsychology, 1980, 72, 21-44.
Thorndike, R. L. Concepts of culture fairness. Jour-nal of Educational Measurement, 1971,8, 63-70.
Thurstone, L. L. Multiple factor analysis. Chicago,111.: University of Chicago Press, 1947.
Wackwitz, J., & Horn, J. L. On obtaining the best es-timates of factor scores. Multivariate BehavioralResearch, 1971,6, 389-408.
Woodrow, H. The relation between abilities and im-provement with practice. Journal of EducationalPsychology, 1938,29, 215-230.
Received December 27,1979 •