On The Prediction Of Financial Distress For Greek firms ... distress_greek... · On The Prediction...
36
On The Prediction Of Financial Distress For Greek firms: Accounting or Market information? Evangelos C. Charalambakis ∗ ∗ Corresponding author. Bank of Greece, Special Studies Division, 21 E.Venizelos Avenue, Athens, Greece, 102 50; email: [email protected];Tel: +30210-320 2644; Fax: +30210-320 2432. The views expressed are the author’s own and do not constitute policy of the Bank of Greece. 1
Transcript of On The Prediction Of Financial Distress For Greek firms ... distress_greek... · On The Prediction...

On The Prediction Of Financial Distress For Greekfirms: Accounting or Market information?
Evangelos C. Charalambakis∗
∗Corresponding author. Bank of Greece, Special Studies Division, 21 E.Venizelos Avenue, Athens,Greece, 102 50; email: [email protected];Tel: +30210-320 2644; Fax: +30210-320 2432.The views expressed are the author’s own and do not constitute policy of the Bank of Greece.
1
On The Prediction Of Financial Distress For Greek firms:Accounting or Market information?
Abstract
We evaluate the impact of accounting and market-driven information on the predic-tion of bankruptcy for Greek firms using a discrete hazard model suggested by Shumway(2001). We show that a hazard model that incorporates three accounting ratio compo-nents of Z-score and three market-driven variables is the most appropriate model for theprediction of corporate financial distress in Greece. This model outperforms a univariatemodel that uses the expected default frequency (EDF) derived from the Merton distance todefault model and a multivariate model that is exclusively based on accounting variables.Forecast accuracy tests confirm the main findings.
2

1 Introduction
Interest in the prediction of financial distress is widespread.1 Since Beaver (1966) and
Altman (1968) a significant body of research uses accounting ratios to predict corporate
bankruptcy.2 More recent studies take advantage of market information derived from the
Merton (1974) structural model for pricing corporate debt to forecast bankruptcy; see
for example Vassalou and Xing (2004), Duffie, Saita, and Wang (2007) and Bharath and
Shumway (2008) and Agarwal and Taffler (2008).3 Shumway (2001) applies a unique
discrete hazard model to predict bankruptcy combining both accounting and market infor-
mation. Shumway (2001) develops a hazard model that considers all the available observa-
tions for bankrupt and non-bankrupt firms addressing efficiently problems associated with
biased parameter estimates and statistical inference. He shows that using the hazard model
delivers efficient and consistent parameter estimates. In addition, he documents that when
using a hazard model, half of the accounting ratios incorporated in Altman’s (1968) and
Zmijewski’s (1984) accounting-based models are not statistically significant for predicting
bankruptcy. Campbell, Hilscher, and Szilagyi (2008) use a similar model to explore how
distress risk is priced in the equity market.
While there is extensive evidence on the performance of hazard models for developed
countries, such as US and UK, we know little about the ability of hazard models to fore-
cast corporate bankruptcy for developing markets. In this paper I assess the performance
1For the remainder of the paper, unless otherwise indicated, we use the terms bankruptcy and financialdistress interchangeably.
2See, among many others, Ohlson (1980), Taffler (1983), Zmijewski (1984) Beaver, McNichols, andRhie (1980) and Agarwal and Taffler (2007)
3I refer to models that measure the distance to default applying Merton’s (1974) bond pricing model asMerton distance to default models, or Merton DD, models. The implied probability of default estimatedfrom the Merton DD model is widely known as the expected default frequency (EDF).
3

of hazard models to predict financial distress for Greek firms using accounting and market
information. To the best of my knowledge, there are no other studies that evaluate the per-
formance of bankruptcy prediction models for Greek firms using the hazard approach of
Shumway (2001). We compare the hazard models with a hazard model EDF derived from
Merton DD model, providing insight into their ability to forecast corporate financial dis-
tress. The paper also makes a contribution to the literature by focusing on the performance
of these models before and after the financial market turmoil in 2007.
The existing literature uses various methods to estimate the probability of financial
distress. Altman (1968) uses discriminant analysis to estimate Z-scores, while Ohlson
(1980) and Zmijewski (1984) use logit and probit models to predict the probability of
financial distress . These multivariate statistical techniques have been applied to the pre-
diction of financial distress for Greek firms; see, for example, Gloubos and Grammaticos
(1988), Theodossiou and Papoulias (1988), Papoulias and Theodossiou (1992).However,
some important methodological issues arise when using these models. Shumway (2001)
shows that well-established bankruptcy prediction models, such as Altman’s (1968) Z-
score and Ohlson’s (1980) conditional logit model are misspecified as they do not take
into account all the available firm-year observations. This induces a bias on the estimated
coefficients of the variables used to forecast bankruptcy, resulting to incorrect statistical
inferences. Non-parametric statistical approaches have also been used to predict corporate
financial distress. For example, artificial neural networks approach; e.g., Altman, Marco,
and Varetto (1994), rough set approach; e.g., Dimitras, Slowinski, Sumaga, and Zopouni-
dis (1999) multicriteria decision aid approach; e.g., Zopounidis and Dimitras (1998) and
multi-group hierarchical discrimination approach; e.g., Doumpos, Kosmidou, Baourakis,
4

and Zopounidis (2002).
The empirical design of the paper is based on a discrete hazard model in the spirit
of Shumway (2001). First, I examine the ability of accounting information to predict
financial distress. In particular, I focus on the individual accounting ratio components of
the popular Z-score measure to explore whether and to what extent they are associated
with the probability of financial distress. The accounting ratio components of Z-score are
based on Altman’s (Altman (1968)) and Taffler’s model (Taffler (1983).4 I then examine
the ability of market information to predict bankruptcy for Greek firms. In particular, I test
whether the EDF, derived from the Merton DD model, is related to the forecast of financial
distress. Following Shumway (2001), I evaluate the performance of a hazard model that
contains three market-based variables, i.e. market capitalization, past excess returns and
stock return volatility.Finally, similar to Shumway (2001), I assess the performance of a
hazard model that contains both accounting and market-driven variables with respect to
financial distress forecast.
The results show that three accounting ratio components of Z-score, contribute sig-
nificantly to the prediction of corporate financial distress in Greece. In particular, sales
to total assets and profitability are negatively associated with the probability of financial
distress whereas financial risk is positively related to the probability of financial distress.
However, liquidity cannot explain the likelihood of bankruptcy. I document that EDF has
a positive impact on the probability of financial distress using a univariate hazard model.
When EDF is combined with accounting ratios in a multivariate hazard model, EDF is
not related to bankruptcy prediction. Using a hazard model that exclusively is based on
4The use of retained earnings divided by total assets as an accounting ratio component of Altman’s Z-score was infeasible due to lack of data for retained earnings.
5
market information I show that market size and excess past stock returns have a negative
effect on the probability of bankruptcy and stock return volatility has a positive effect on
the likelihood of Greek firms to go bankrupt. Incorporating accounting ratios with market
information I show that while profitability financial risk, excess returns and stock return
volatility enter with the expected signs, market size fails to remain a significant predictor
of financial distress.
To evaluate the performance of the models relative to each, I use Vuong’s (1989) test
to compare the log-likelihood ratios of the hazard models. I provide evidence that the
combination of sales scaled by total assets, profitability and financial risk with market
size, excess returns and stock return volatility best captures the variation in the actual
probability of bankruptcy. Forecast accuracy tests also show that the model that uses three
accounting ratios along with three market-based variables yields the highest predictive
ability. Also, I show that a hazard model that contains only three market-driven variables
and a multivariate model that uses the accounting ratios of Z-score perform better than a
univariate model that contains EDF.
Further to the main findings of the paper, I segregate the sample period into pre-
financial crisis period (2002-2006) and post-financial crisis period (2007-2010) to explore
the performance of the hazard models across these two subperiods. I find that the impact
of accounting ratios and market-based variables on the probability of financial distress for
the two subperiods weakens. For the period 2002-2006, sales to total assets, profitability
and excess returns are strongly associated with the prediction of bankruptcy. During the
financial crisis (2007-2010) only financial risk has a significant impact on the probabil-
ity of financial distress. Despite the smaller effect of accounting and market-variables on
6

the likelihood of a Greek firm to go bankrupt pre and post crisis, the forecast accuracy
test shows that the hazard model that combines accounting and market-driven variables
exhibits the highest predictive ability.
The rest of the paper is organized as follows. Section 2 provides a methodological
background on modeling the probability of financial distress using the discrete hazard
approach. Section 3 describes the Greek dataset. Section 4 presents the main results from
the various discrete hazard models and the respective forecast accuracy tests along with
the results that correspond to pre and post-financial crisis.
2 Empirical Design
The empirical analysis of the study is based on a discrete hazard model introduced by
Shumway (2001) and is of the following form:
ln[
hi(t)1−hi(t)
]= α(t)+β ′xit (1)
where hi(t) represents the hazard of bankruptcy at time t for company i, conditional on
survival to t; α(t) is the baseline hazard; β is a vector of coefficients and xit a k×1 vector
of observations on the ith covariate at time t. The innovative feature of this approach,
as Shumway (2001) shows, is that the discrete-time hazard model can be estimated as a
dynamic multi-period logit model where each period that a firm survives is included as a
non-failing firm-year observation. Therefore, we estimate the probability of bankruptcy as
Pt−1(Yit = 1) =1
1+ exp(−α −β ′xit−1)(2)
7

where Yit is a variable that equals one if firm i enters financial distress in year t, zero
otherwise. β and x are as before. Notice that we use data dated t − 1 in estimating the
probability of bankruptcy. This is to ensure that we only use data that is actually available
prior to the occurrence of bankruptcy.
Prior to Shumway (2001), several econometric techniques have been used to predict
corporate financial distress. Altman (1968) employs multivariate discriminant analysis
to determine Z-score, which ia a widely used measure for predicting bankruptcy for US
firms; Taffler (1983) employs the same technique for UK firms. Altman, Haldeman, and
P.Narayanan (1977) use quadratic discriminant analysis to identify firms in danger of going
bankrupt. Ohlson (1980) estimates a conditional logit model to generate the probability
that a firm will enter bankruptcy (known as the “O-score”) while Zmijewski (1984) es-
timates a probit model. Lau (1987) uses a multinomial logit model that allows for more
than two states of financial distress. Most of these estimation methods have been applied
to the Greek context; see, for example, Gloubos and Grammaticos (1988), Theodossiou
and Papoulias (1988), Papoulias and Theodossiou (1992). However, Shumway (2001) ar-
gues that these bankruptcy forecasting models are misspecified as they do not properly
address the length of time that a healthy firm has survived. In particular, such models are
static because they use only one firm-year observation for a non-failed firm. This induces
a selection bias. Shumway (2001) documents that ignoring firm-year observations with
respect to the length of time a healthy firm has survived produces biased and inconsistent
estimates of the parameters of the model. Shumway (2001) shows that this caveat is prop-
erly addressed by using a discrete time hazard model. In the hazard model, the hazard rate
is the probability of the firm going bankrupt at time t conditional upon having survived
8

until time t. Therefore, the probability of bankruptcy changes through time.
The competitive advantage of the hazard approach is twofold. First, it allows re-
searchers to take advantage of all the available firm-year observations. Second it enables
the probability of bankruptcy to change over time as a function of a vector of explana-
tory variables that also change over time. While previous studies were merely based on
accounting ratios, Shumway (2001) uses a combination of accounting and market infor-
mation that vary over time to estimate the probability of financial distress following the
hazard approach. I evaluate the contribution of accounting and market-driven variables to
the prediction of corporate financial distress in Greece employing a discrete hazard model.
The hazard model proposed by Shumway (2001) is estimated as a dynamic logit model
using maximum likelihood estimation method.
3 Sample and Data
The sample consists of Greek firms that operate in Greece and are listed in the Athens
Stock Exchange (ASE). We obtain the accounting data and the market data from Thomson
Financial Datastream. We exclude financial firms and utilities from the sample. We ex-
clude firm-year observations for which we do not have available data. The initial sample
consists of 303 alive and dead Greek listed firms with 2,710 firm-year observations over
the period 2002–2010. In particular, the sample includes 228 alive and 75 dead firms. The
hazard approach requires the identification of bankrupt firms. I consider a firm to be dead
when it is delisted from ASE. I gather this specific information from the Athens Stock
Exchange and the Hellenic Capital Market Commission. I define a firm as bankrupt if a
9

firm is delisted from the Athens Stock Exchange due to bankruptcy or if the firm is sus-
pended according to the Hellenic Capital Market Commission. I identify 36 bankrupt firms
whereas the remaining firms (39) were delisted from ASE for other reasons that are beyond
the scope of the paper, such as mergers and acquisitions. The sample contains 303 Greek
firms with 2,710 firm-year observations. There are 36 bankrupt firms with 324 firm-year
observations and 267 non-bankrupt firms providing 2,386 firm-year observations. Table 1
provides detailed information on the definition of all variables used in the study.
With respect to accounting information the analysis of the paper is focused on the
accounting ratios of Z-score based on Altman (1968) and Taffler (1983) model. In particu-
lar, we use net sales divided by total assets (SALES TA), profitability defined as earnings
before interest, taxes, depreciation and amortization to total assets (EBITDA TA), finan-
cial risk measured as current liabilities to total assets (FRISK) and liquidity defined as
current assets minus current liabilities scaled by total assets (LIQUID) . To consider the
role of market information in the bankruptcy prediction for Greek firms, we use the ex-
pected default frequency (EDF) estimated from the Merton DD Model. I also use the
three market-based variables that have been included in the model of Shumway (2001),
i.e. relative size (REL SIZE), which expresses the equity market capitalization of the firm
relative to total equity market capitalization, excess stock returns (EXRET) and idiosyn-
cratic stock return volatility (SIGMA). Table 1 describes the variables in more detail. I
winsorize the independent variables at the 0.5th and 99.5th percentiles of the distribution
to deal properly with outliers. Descriptive statistics for the explanatory variables are pro-
vided in Table 2. Note that EDF cannot be meaningful in a logit model as it is expressed
in the form of a probability, which is inconsistent with the assumptions of a logit model.
10

Therefore, based on Hillegeist, Keating, Cram, and Lundstedt (2004), in the next section
we transform EDF into a “score”, namely EDF-SCORE, using the inverse logistic function
EDF −Score=ln(EDF/(1−EDF)) when performing logit regressions.
According to Table 2, the distribution of SALE TA is positively skewed while the dis-
tribution of EBITDA TA is symmetrical. We also observe that the market-based variables,
REL SIZE, EXRET, SIGMA and EDF are the most volatile variables. The average ex-
pected default frequency (EDF) for our sample is 10%, which is close to the bankruptcy
rate of our sample (12%). The bankruptcy rate is defined as bankrupt firms (36) divided
by the total number of firms (303). The minimum value of EDF is 0.00 and the maximum
value of EDF is 0.51. This is because the descriptive statistics in Table 2 are expressed to
two decimal places. The average and the median of REL SIZE is negative as it is defined
as the logarithm of a generally small number; see, Table 1.
4 Results
4.1 Predictive ability of discrete hazard models
I estimate the probability of financial distress for Greek firms using a series of multi-period
logit models each of which contains different information. The results are presented in
Panel A of Table 3. The first column provides evidence on the ability of accounting infor-
mation to predict financial distress. The column named ACCR is a model that incorporates
accounting ratios that are used to calculate the widely known Z-score. The motivation is
to explore which, if any, of the ratios that make up the Z-score individually contribute to
the prediction of financial distress. The results show that sales scaled by total assets and
11

profitability are negatively related to the probability of bankruptcy whereas financial risk
is positively associated with the probability of bankruptcy. However, liquidity is not a sig-
nificant predictor of bankruptcy. Overall, three out of four accounting ratio components
of Z-SCORE are relevant to the forecast of financial distress. EDF presents the results
from a univariate model that uses an equivalent measure of the expected default frequency
(EDF-score), derived from a Merton DD model, as a predictor of financial distress. As
expected, I find that there is a positive association between EDF-score and the probability
of financial distress. The next column, ACCREDF, presents the results of a model that
combines the accounting ratios of the first column with EDF-score to forecast financial
distress. While the signs of the coefficients of sales to total assets, profitability and fi-
nancial risk remain unaltered and in line with the findings presented in the first column
EDF-score is no longer related to the prediction of financial distress.
The model in the MV column predicts the probability of financial distress using Shumway’s
three market-driven variables, i.e., relative size, excess returns and stock return volatility
(SIGMA). The results show that relative size and excess returns have a negative and sig-
nificant impact on the probability of bankruptcy, where as stock return volatility has a
positive and significant effect on the probability of bankruptcy for Greek firms. This is
consistent with prior evidence; see, Shumway (2001) and Campbell, Hilscher, and Szi-
lagyi (2008). MVACCR column reports the results from a model that combines the three
market-based predictors with the accounting ratios of Z-score. Unlike ACCREDF column,
there is clear evidence that both accounting and market information play an important role
in the prediction of financial distress for Greek firms. I show that sales to total assets,
profitability and excess stock returns are negatively associated with the prediction of fi-
12
nancial distress. Financial risk and SIGMA are positively associated with the prediction
of financial distress.
Apart from the choice of variables that contribute to the prediction of financial dis-
tress, the evidence on which of the above models best captures the probability of financial
distress for Greek firms is considerably appealing. This will lead to the most accurate
bankruptcy prediction model. To this end, we follow Hillegeist, Keating, Cram, and Lund-
stedt (2004) and use the comparison test of Vuong (1989) model. Vuong (1989) develops
a test for choosing between two models, i and j. Under the null hypothesis that there is no
difference between the two models, the log of the ratio of the likelihood for model i to that
for model j should be zero. If the difference is significantly positive, i is preferred to j and
vice versa. Vuong (1989) derives a statistic that allows us to test this hypothesis. Under the
null hypothesis that there is no difference between the competing models, the test statistic
has a standard normal distribution. Panel B of Table 3 contains results of the Vuong test
for the models shown in Panel A of Table 3. First, I investigate how the MVACCR model
performs versus the ACCR model. The z-statistic derived from the Vuong test is positive
and significant at 10% showing that the MVACCR outperforms ACCR model. Therefore,
the accounting information is not sufficient to estimate an accurate probability of corpo-
rate financial distress. Instead, the combination of accounting and market information is
needed to explain the probability of financial distress for Greek firms. I also document that
MVACCR model yields a more efficient estimate of the probability of bankruptcy than the
model that is exclusively based on expected default frequency (EDF). MVACCR model
captures more effectively the probability of financial distress than a model that combines
the accounting ratios with EDF (ACCREDF). MVACCR model is better than a model that
13
is based only on market-based variables (MV model). Therefore market information alone
cannot predict financial distress adequately. I also find that there is no difference between
MV model and the ACCR model. Finally, I report that both the MV and the ACCR model
outperform the univariate EDF model.
To provide a better understanding on the predictive ability , I sort firms into six deciles
in descending order based on the probability of bankruptcy estimated by each of the hazard
model described in Table 3. In particular, Deciles one to three contain firms that are
more likely to go bankrupt. Decile one consists of firms that exhibit the highest estimated
probability of bankruptcy, while Deciles four to six contain those firms that are less likely
to enter financial distress. Decile 6 contains firms with the lowest predicted probability of
bankruptcy. To investigate the predictive ability of a hazard model I define the percentage
of bankrupt firms that are allocated to the various deciles by the estimated probability of
financial distress derived from each model. This can be thought of as a means by which we
can assess the ability of the models to correctly classify those firms that went bankrupt as
likely to go bankrupt. In particular, for each model, we report the percentage of bankrupt
firms classified in firms with high probability of financial distress (deciles 1-3). Also,
for each model, we show the percentage of bankrupt firms classified in firms with low
probability of financial distress (deciles 4-6). This represents the misclassification rate of
each model. The ideal case would be all the bankrupt firms to be allocated in Deciles one
till three implying that the model does not suffer from misclassification. However, this
is very rare. Therefore, the main objective is to minimize the classification error when
assessing a bankruptcy forecast model. Table 4 presents the results.
At first glance we observe that each of the hazard model identifies a large number of
14

bankrupt firms in Deciles 1-3, i.e., firms that are more likely to go bankrupt than less.
Looking at the Table 4 more thoroughly we observe that the ACCR model classifies more
than 60% of the bankrupt firms (63.32%) in Decile 1 and 89.98 % in Deciles 1-3. As
we move from Decile 4 to 6, which include firms with the lowest probability of financial
distress derived from ACCR model (Deciles 4-6), one would anticipate a lower number
of bankrupt firms to be identified. However, Decile four, five and six incorporate the
same percentage of bankrupt firms, i.e., 3.34% of bankrupt firm. In total ACCR model
wrongly classifies 10.04% of bankrupt firms in Deciles 4-6, which is not a negligible
misclassification rate. EDF model exhibits the worst performance of all hazard models. It
correctly places 64% of firms that go bankrupt in Deciles 1 through 3 and has the highest
misclassification rate. In particular, EDF model classifies 46% of bankrupt firms in the
deciles with the lowest probability of financial distress. It is striking that 24% of the
bankrupt firms are allocated in the last decile, i.e, the decile with the lowest probability of
bankruptcy. ACCREDF model classifies the highest number of bankrupt firms ( 95.45%)
in Deciles one two and three. It also exhibits the lowest misclassification rate (4.55%);
see, Deciles 4-6. However, it only identifies 22 bankrupt firms. The model that includes
only market-driven variables, described in the column headed MV of Table 3, correctly
predicts that 82.36% of those firms that actually go bankrupt as more likely than not to
go bankrupt; see, Deciles 1-3. However, we would expect a higher number of firms to be
identified in Decile 2 than in Decile 3. Instead, only 5.88% of bankrupt firms are identified
in Decile 2 whereas 17.65% of bankrupt firms are identified in Decile 3. Also, it has a high
misclassification rate, 17.64%; see, Deciles 4-6. The MVACCR model, which combines
accounting with market-driven variables yields the greatest predictive ability, identifying
15

30 bankrupt firms. It correctly classifies the highest number of bankrupt firms in Decile
1, i.e., 76.66% and 93.33% in Deciles 1-3.It also exhibits a low misclassification rate, i.e.,
6.67% in Deciles 4-6. Hence the probability of financial distress estimated by MVACCR
model allocates most effectively the number of bankrupt firms.
Taken together the results in Tables 3 and 4, I provide insights into forecasting the prob-
ability of financial distress for Greek firms. We show that MVACCR model, i.e., a model
that includes three accounting ratios and three market-driven variables best describes the
probability of bankruptcy. Therefore we can forecast financial distress more accurately by
combining accounting and equity market-driven variables. However, the findings strongly
suggest that the choice of accounting and market information matters when evaluating a
financial distress prediction model. I provide evidence that a model that uses EDF esti-
mated by the Merton DD model has considerably lower predictive ability than a model
that uses three market-based variables suggested by Shumway (2001). The results also
show that neither accounting ratios (net sales scaled by total assets, profitability and finan-
cial risk) alone or market-driven variables (market capitalization, excess past stock returns
and stock return volatility) alone are sufficient enough to predict corporate bankruptcy in
Greece.
Table 5 shows the time-series variation of the average probability of financial distress
for Greek firms derived from the MVACCR model. We observe that the year 2003 ex-
hibits the lowest average probability of financial distress (0.72%). There is a considerable
increase in the probability of financial distress across 2004-2005, which amounts to 2.33%
in 2005. The average probability of financial distress slightly decreases in 2006. Despite
the burst of the global financial crisis in 2007-2008, Greek economy has not initially been
16
affected. In particular, there is a decrease in the probability of corporate bankruptcy in
Greece at that period (1.10% and 1.16%, respectively ). Since 2008 the credit crunch has
a significant effect on the estimated probability of financial distress. Looking at Table
5, the probability of financial distress increases to 1.48% in 2009 and augmented more
than 0.85% in 2010 reaching the maximum, i.e., 2.76%. Table 6 presents the variation
of the average probability of financial distress across industries Personal goods, media,
food producers, health care equipment, construction-materials, software-computer ser-
vices, pharmaceuticals-biotechnology, general retailers and beverages are the sectors that
exhibit the highest estimated probability of financial distress. The average probability of
financial distress of each of these sectors is more than 1.50%. Oil- Gas producers, mobile
telecommunications, leisure goods, electronic-electrical equipment, mining, software ser-
vices, industrial transportation and industrial engineering are the sectors that are less likely
to go bankrupt. The time-series variation of industries with the highest average probability
of financial distress is presented in Table 7. The probability of bankruptcy for the personal
goods sector considerably increased from 0.89% in 2003 to 4.89% and 5.55% in 2005 and
2006, respectively. There is an increase in the probability of bankruptcy for the media
industry for the period 2004 to 2006 and in particular from 1.37% to 2.86% The effect
of the global financial crisis on the sector of media is strong. The probability of financial
distress for this specific industry amounts to 2.57% in 2009 and jumps to 6.23% in 2010.
There is more than 142% increase in its probability of financial distress in one year. The
food producers sector exhibits high probabilities of default in 2004-2006 period. Due to
the credit crunch effect, the probability of bankruptcy of this industry highly increases
from 2.24% in 2009 to 5.00% in 2010. The probability of financial distress of health care
17
equipment industry augments highly between 2004-2006 and specifically from 1.83% to
4.73%. Construction-materials industry exhibits high probability of financial distress for
the periods 2004-2005 and 2008-2010. Software-Computer services is affected by the debt
crisis as its probability of financial distress reaches the optimum of 3.76% in 2009. The
probability of bankruptcy pharmaceuticals-biotechnology industry significantly increases
over the 2004-2006 period rocketing to 7.45% in 2006. The highest increase in the prob-
ability of bankruptcy for the General retailers industry occurs in 2010. In particular, it
increases from 0.35% in 2009 to 6.55% in 2010.
4.2 Estimation of probability of financial distress across different hori-
zons
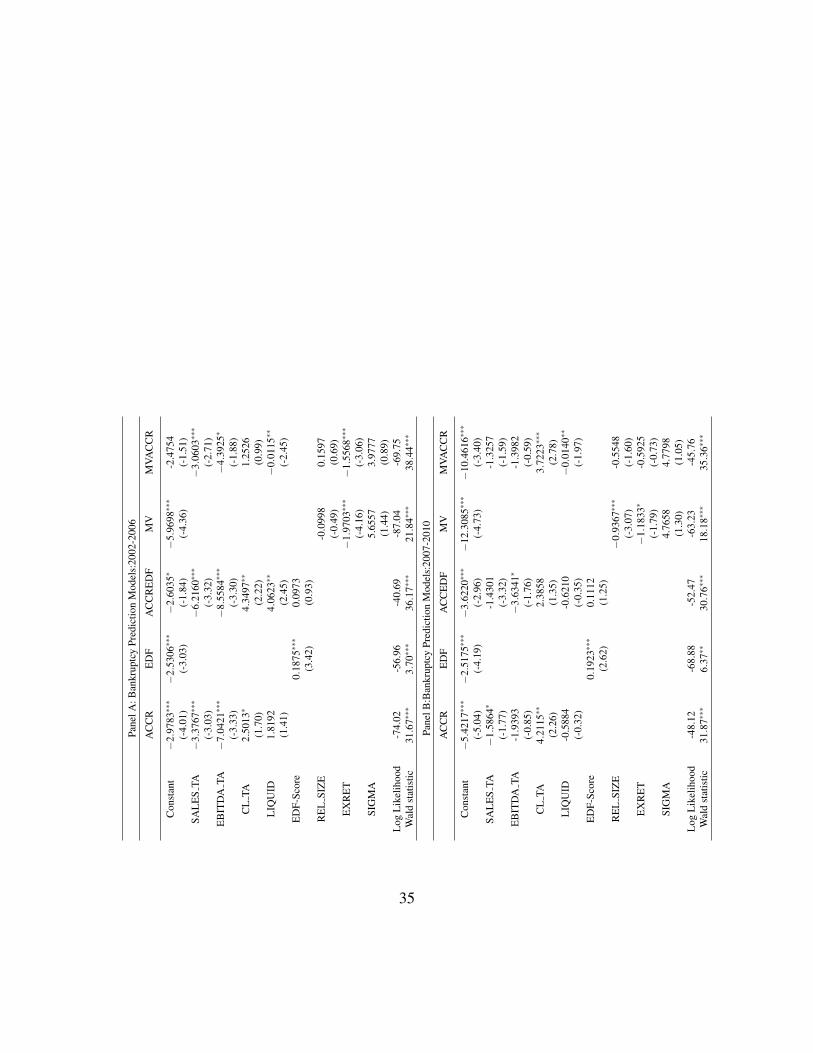
To explore the predictive accuracy of the hazard models in different time periods I split
the sample into two subperiods, i.e., 2002-2006 and 2007-2010. The two subperiods are
not randomly chosen. I explore the performance of the discrete hazard models before
the global financial crisis (2002-2006) and after the global financial crisis (2007-2010).
Panel A of Table 8 presents the results for the multi-period logit models for the period
2002-2006. ACCR column shows that sales to total assets and profitability are negatively
associated with the probability of financial distress whereas financial risk is positively as-
sociated with the probability of financial distress at 10%.As with Table 3 EDF column
documents a positive relation between the EDF-score and the probability of financial dis-
tress. However, when EDF is combined with the accounting ratios EDF cannot explain the
firm’s probability to go bankrupt. The sign of sales to total assets and financial risk remain
negative and positive, respectively. Unlike the core findings, liquidity has a positive impact
18

on the probability of financial distress. This is possibly attributed to the high percentage of
observations with negative values of liquidity, i.e., 46%, for the period 2002-2006. With
respect to MV model, excess past stock returns have a negative and significant impact
on the probability of default. However, market capitalization and stock return volatility
cannot explain the probability of financial distress for 2002-2006. MVACCR model doc-
uments that only sales to total assets, profitability and excess past stock returns play a
significant role in the financial distress prediction prior to the global financial crisis.
Panel B of Table 8 presents the results for the multi-period logit models for the finan-
cial crisis period, i.e., 2007-2010. According to ACCR model I document that apart from
the negative impact of sales to total assets on the probability of financial distress, there
is clearly a positive a association between financial risk and probability of financial dis-
tress. EDF-score is positively related to the probability of bankruptcy; see, EDF column.
The results from ACCREDF model show that only profitability is marginally significant
predictor of corporate bankruptcy. With respect to the MV model market capitalization
and excess stock returns are negatively associated with the likelihood of financial dis-
tress during the period of financial crisis. Finally, when combining accounting ratios with
market-driven variables, only financial risk can explain the probability of financial distress
for Greek firms for the period 2007-2010.
Similar to Table 4, I explore the predictive ability of the hazard models for the two
subperiods, i.e., 2002-2006 and 2007-2010. I sort the sample into six deciles based on
the rankings of probability of financial distress. Deciles 1-3 contain firms that are more
likely to go bankrupt and Deciles 4-6 include firms that are less likely to enter financial
distress. Panel A of Table 9 presents the results for the 2002-2006 subperiod. ACCR
19
model classifies 66.66% of bankrupt firms in the first Decile and 77.77% in Deciles 1-3.
However, the misclassification rate is very high as 22.23% of firms are allocated in Deciles
4-6, which are included firms with the lowest probability of financial distress. EDF model
exhibits the worst performance as it identifies only 45.46% of bankrupt firms in Deciles 1-
3 and has the highest misclassification rate (54.54%); see, Deciles 4-6. ACCREDF model
has the highest classification rate, as it incorporates all the bankrupt firms in Deciles 1 and
2. However, the model identifies only ten bankrupt firms. MV model classifies 80% of the
bankrupt firms in the first three deciles. However, the entire misclassification rate 20% is
allocated in the last decile, Decile 6. The MVACCR model is the best model in terms of
its predictive ability. Given the availability of data it identifies 18 bankrupt firms for the
period 2002-2006. It yields a very high classification rate, close to 90%, in Deciles 1-3.
Panel B of Table 9 documents the results for the subperiod 2007-2010. We observe
that the predictive ability of the hazard model has improved during the financial crisis in
contrast with the predictive ability of the models in 2002-2006 period. ACCR model has a
high classification rate in Deciles 1-3 and in particular 91.67%. The misclassification rate
is also very low, 8,33% incorporated in Decile 4. EDF model has the worst performance as
it classifies the lowest number of bankrupt firms in the deciles with the highest probability
of financial distress; see, Deciles 1-3. ACCREDF model exhibits the same classification
rate with ACCR model.However, ACCREDF model misclassifies 8.33% of the bankrupt
firms in Decile 5. Further to these models, MV model yields a high classification rate
(85.72%). MVACCR model has the best predictive ability as it classifies 100% of bankrupt
firms in Deciles 1-3 and hence there is no misclassification rate.
20

5 Concluding remarks
This paper evaluates the contribution of accounting and market information to the pre-
diction of financial distress for Greek firms using the discrete hazard approach following
Shumway (2001). In particular, I investigate whether and to what extent the accounting
ratio components of Z-score can forecast bankruptcy for Greek firms. I explore the effect
of EDF estimated from the Merton model on the likelihood of bankruptcy. I also test the
predictive ability of a model that combines the accounting ratios with EDF. I also assess
the ability of three market-based variables, i.e., market size, excess returns and sigma to
predict financial distress. Finally, I examine the ability of three accounting ratios and three
market-driven variables to forecast bankruptcy more accurately.
The results show that the model that combines sales to total assets profitability and
financial risk with market capitalization, excess returns and stock return volatility best
depicts the probability of financial distress for Greek firms. With respect to market infor-
mation, the predictive ability of a model that contains market capitalization, excess returns
and stock return volatility is clearly higher than of a model that includes EDF. Evidence is
inconclusive on whether accounting ratios contain more significant information about the
prediction of financial distress than market-based variables. Forecast accuracy tests are in
line with the main findings. I also compare the performance of the hazard models across
two different time horizons and specifically pre and post financial crisis. I document that he
impact of accounting and market variables on the probability of financial distress weakens
for the two subperiods. However, in line with the main findings, the model that combines
accounting ratios with market-based variables exhibits the highest forecast accuracy.
Overall, this paper provides useful insights on the prediction of corporate bankruptcy
21

for Greek firms, which is of major concern to both academics and practitioners. I find that
a model that incorporates three accounting ratios and three market-based variables leads to
the most powerful prediction of corporate bankruptcy. I also show that the hazard model
based on market capitalization, excess returns and sigma provides considerably better in-
formation on the probability of a Greek firm to go bankrupt than a hazard model that is
exclusively based on EDF. Finally, we show that accounting information is not superior or
inferior to market information with respect to the prediction of financial distress. In line
with Shumway (2001), this study strongly recommends the use of both accounting and
market-driven variables to forecast bankruptcy for Greek firms more accurately.
22

References
Agarwal, V., and R.J. Taffler, 2007, Twenty-five years of the taffler z-score model: does it
really have predictive ability?, Accounting and Business Research 37, 285–300.
, 2008, Comparing the performance of market-based and accounting-based
bankruptcy prediction models, Journal of Banking and Finance 32, 1541–1551.
Altman, E., 1968, Financial ratios, discriminant analysis and the prediction of corporate
bankruptcy, Journal of Finance 23, 589–609.
, R.G. Haldeman, and P.Narayanan, 1977, Zeta analysis: a new model to identify
bankruptcy risk of corporations, Journal of Banking and Finance 1, 29–54.
Altman, E.I., G. Marco, and F. Varetto, 1994, Corporate distress diagnosis: Comparisons
using linear discriminant analysis and neural networks (the italian experience), Journal
of Banking and Finance 18, 505–529.
Beaver, W.H., 1966, Financial ratios as predictors of failure, Journal of Accounting Re-
search 4, 71–111.
, M.F. McNichols, and J. Rhie, 1980, Have financial statements become less in-
formative? evidence from the ability of financial ratios to predict bankruptcy, Review of
Accounting Studies 10, 93–122.
Bharath, S.T., and T. Shumway, 2008, Forecasting default with the merton distance to
default model, Review of Financial Studies 21, 2899–2939.
23

Campbell, J.Y., T. Hilscher, and Y. Szilagyi, 2008, In search of distress risk, Journal of
Finance 63, 2899–2939.
Dimitras, A.I., R. Slowinski, R. Sumaga, and C. Zopounidis, 1999, Business failure pre-
diction using rough sets, European Journal of Operational Research 114, 263–280.
Doumpos, M., K. Kosmidou, G. Baourakis, and C. Zopounidis, 2002, Credit risk assess-
ment using a multicriteria hierarchical discrimination approach: A comparative analy-
sis, Journal of Operational Research 138, 392–412.
Duffie, D., L. Saita, and K. Wang, 2007, Multi-period corporate failure prediction with
stochastic covariates, Journal of Financial Economics 83, 635–665.
Gloubos, G., and T. Grammaticos, 1988, The success of bankruptcy prediction models in
greece, Journal of Banking and Finance 7, 37–46 Supplement.
Hillegeist, S.A., E.K. Keating, D.P. Cram, and K.G. Lundstedt, 2004, Assessing the prob-
ability of bankruptcy, Review of Accounting Studies 9, 53–85.
Lau, A.H., 1987, A five-state financial distress prediction model, Journal of Accounting
Research 25, 127–138.
Merton, R.C., 1974, On the pricing of corporate debt: The risk structure of interest rates,
Journal of Finance 29, 449–470.
Ohlson, J., 1980, Financial ratios and the probabilistic prediction of bankruptcy, Journal
of Accounting Research 18, 109–131.
24
Papoulias, C., and P. Theodossiou, 1992, Analysis and modeling of recent business failures
in greece, Managerial and Decision Economics 13, 163–169.
Shumway, T., 2001, Forecasting bankruptcy more accurately: A simple hazard model,
Journal of Business 74, 101–124.
Taffler, R.J., 1983, The assessment of company solvency and performance using a statisti-
cal model, Accounting and Business Research 13, 295–307.
Theodossiou, P., and C. Papoulias, 1988, Problematic firms in greece: An evaluation using
corporate failure prediction models, Journal of Banking and Finance 7, 47–55 Supple-
ment.
Vassalou, M., and Y. Xing, 2004, Default risk in equity returns, Journal of Finance 59,
831–868.
Vuong, Q.H., 1989, Likelihood ratio tests for model selection and non-nested hypotheses,
Econometrica 57, 307–333.
Zmijewski, M., 1984, Methodological issues related to the estimation of financial distress
prediction models, Journal of Accounting Research 22, 59–82.
Zopounidis, C., and A. Dimitras, 1998, Multicriteria Decision Aid Methods for the Pre-
diction of Business Failure (Kluwer Academic Publishers: Dordrecht).
25

Table 1: Definition of VariablesThis table defines the variables used in the study. The accounting and market data is fromThomson Finanancial Datastream. Numbers in parentheses correspond to the Datastreamcode.
Variable Name Variable definition
SALES TANet Sales (101)
Total assets
EBITDA TAEarnings before interest, tax and depreciation (154+153+696)
Total assets
Total liabilities Total assets (392)−Equity capital & reserves (305)
CA TLCurrent assets (376)
Total liabilities
CL TACurrent liabilities (389)
Total assetsLIQUID
Quick assets − current liabilities (389)Total assets
EDF Expected default frequency derived from a Merton DD model
REL SIZE ln(
Market value of equityMarket value of the FTSE/ASE-20 index
)ri,t stock return for firm i at time t ()
rASE20,t return on the ASE20 at time t
EXRET ri,t−1 − rFT SE/ASE−20,t−1 (LSPD)
SIGMA standard deviation of εi,t in the regression : ri,t=α +β rFT SE/ASE−20,t + εi,t
26

Table 2: Summary StatisticsThis table presents descriptive statistics for the variables used in this study. The initialsample consists of 303 firms for the period 2002-2010. We identify 36 financially dis-tressed firms and 267 non-financially distressed firms. The variables are winsorized at the0.5% fractile in either tail of distribution. PROF is measured as profit before tax dividedby current liabilities; CA TL is the ratio of current assets to total liabilities; FRISK ismeasured as current liabilities to total assets; LIQUID is defined as quick assets dividedby current liabilities. EDF is the expected default frequency derived from a Merton DDmodel. EBITDA TA is the ratio of EBITDA to total assets. REL SIZE is the natural log-arithm of the firm’s annual market capitalization relative to the market capitalization ofthe FTSE/ASE-20 index. EXRET is the firm’s annual returns in excess of the return onthe FTSE/ASE-20 index. SIGMA is idiosyncratic return volatility. It is estimated as thestandard deviation of the residuals from a regression of each stock’s monthly return on themonthly return on the FTSE/ASE-20 index.
Variable Mean Median Std.dev Min Max
SALES TA 0.80 0.66 0.64 0.02 5.35EBITDA TA 0.08 0.08 0.10 -0.50 0.48CL TA 0.39 0.36 0.20 0.03 1.18LIQUID 0.15 0.16 0.22 -0.70 0.75EDF 0.01 0.00 0.03 0.00 0.51REL SIZE -6.82 -6.94 1.54 -9.98 -1.95EXRET -0.05 -0.06 0.49 -1.42 1.56SIGMA 0.10 0.09 0.07 0.00 0.44
27

Tabl
e3:
Res
ults
For
Haz
ard
Mod
elsP
redi
ctin
gth
ePr
obab
ility
ofFi
nanc
ialD
istr
ess
Thi
sta
ble
cont
ains
resu
ltsde
rived
from
the
haza
rdm
odel
s.T
hede
pend
entv
aria
ble
isan
indi
cato
rva
riab
leth
ateq
uals
zero
ifth
efir
mis
notfi
nanc
ially
dist
ress
ed.
Ifth
efir
mis
finan
cial
lydi
stre
ssed
,the
nth
ede
pend
entv
aria
ble
equa
lson
eon
lyfo
rits
last
firm
-yea
rob
serv
atio
n.T
hein
depe
nden
tvar
iabl
esar
ela
gged
toen
sure
that
the
data
are
obse
rvab
lepr
iort
oth
eev
ento
ffina
ncia
ldis
tres
s.Pa
nelA
cont
ains
para
met
eres
timat
esan
dte
stof
thei
rsig
nific
ance
for
each
haza
rdm
odel
.T
heco
lum
nhe
aded
AC
CR
cont
ains
resu
ltsfo
ra
mod
elth
atus
esth
eac
coun
ting
ratio
sof
Z-s
core
.T
heE
DF
colu
mn
pres
ents
the
resu
ltsfr
oma
univ
aria
tem
odel
that
uses
ED
Fde
rived
from
aM
erto
nD
Dm
odel
.E
DF
isco
nver
ted
toa
Scor
ela
bele
das
ED
F-sc
ore.
The
AC
CR
ED
Fco
lum
nsh
ows
the
resu
ltsfr
oma
mod
elth
atco
mbi
nes
the
acco
untin
gra
tios
ofZ
-sco
rew
ithE
DF.
The
MV
colu
mn
cont
ains
resu
ltsfr
oma
haza
rdm
odel
that
uses
mar
ket-
base
dva
riab
les
(RE
LSI
ZE
,EX
RE
Tan
dSI
GM
A)
topr
edic
tfina
ncia
ldis
tres
s.T
heM
VAC
CR
colu
mn
cont
ains
resu
ltsfr
oma
haza
rdm
odel
that
com
bine
sm
arke
t-ba
sed
vari
able
sw
ithE
BIT
DA
TA,L
IQU
IDan
dFR
ISK
.T
hero
wla
bele
dW
ald
Stat
istic
cont
ains
the
Wal
dte
stte
stin
gth
ehy
poth
esis
that
the
coef
ficie
nts
are
join
tlyze
ro.
Itis
dist
ribu
ted
asχ2 (
k),w
here
kis
the
num
bero
fpar
amet
ers
(exc
ludi
ngth
eco
nsta
nt.)
We
scal
eth
eW
ald-
Chi
Squa
rest
atis
ticby
the
aver
age
num
bero
fobs
erva
tions
perfi
rm.F
igur
esin
pare
nthe
ses
are
scal
edW
ald
stat
istic
ste
stin
gth
ehy
poth
esis
that
the
indi
vidu
alco
effic
ient
isze
ro.T
hese
have
aχ2 (
1)di
stri
butio
n.Pa
nelB
cont
ains
the
resu
ltsfr
omV
uong
test
sfo
rm
odel
com
pari
son.
Und
erth
enu
llhy
poth
esis
that
ther
eis
nodi
ffer
ence
betw
een
the
two
mod
els,
the
log
ofth
era
tioof
the
likel
ihoo
dfo
rm
odel
ito
that
for
mod
eljs
houl
dbe
zero
.If
the
diff
eren
ceis
sign
ifica
ntly
posi
tive,
iis
pref
erre
dto
jan
dvi
ceve
rsa.
∗∗∗,
∗∗an
d∗
deno
tesi
gnifi
canc
eat
the
1,5
and
10pe
rcen
tle
vels
resp
ectiv
ely.
28

Pane
lA:B
ankr
uptc
yPr
edic
tion
Mod
els
ForG
reek
Firm
s
AC
CR
ED
FA
CC
RE
DF
MV
MVA
CC
R
Con
stan
t−
3.99
42∗∗
∗−
2.52
59∗∗
∗−
3.30
42∗∗
∗−
8.05
85∗∗
∗−
5.20
22∗∗
∗
(-6.
55)
(-5.
21)
(-3.
69)
(-6.
94)
(-3.
84)
SAL
ES
TA−
2.63
56∗∗
∗−
3.07
53∗∗
∗−
2.29
96∗∗
∗
(-3.
54)
(-3.
49)
(-3.
09)
EB
ITD
ATA
−4.
6458
∗∗∗
−5.
8068
∗∗∗
−2.
6251
∗
(-3.
01)
(-3.
63)
(-1.
68)
CL
TA3.
3295
∗∗∗
3.22
17∗∗
∗2.
1774
∗∗∗
(2.9
5)(2
.59)
(2.5
9)L
IQU
ID1.
2170
1.96
87(1
.12)
(1.6
0)E
DF-
Scor
e0.
1897
∗∗∗
0.09
65(3
.42)
(1.4
8)R
EL
SIZ
E−
0.41
45∗∗
∗-0
.077
8(-
2.74
)(-
0.46
)E
XR
ET
−1.
6009
∗∗∗
−1.
2409
∗∗∗
(-4.
61)
(-3.
21)
SIG
MA
5.80
63∗∗
6.04
60∗∗
(2.2
1)(2
.11)
Log
Lik
elih
ood
-127
.69
-125
.85
-98.
67-1
53.9
7-1
21.8
9W
ald
stat
istic
53.3
3∗∗∗
10.3
1∗∗∗
56.0
0∗∗∗
33.2
1∗∗∗
61.9
1∗∗∗
Pane
lB:V
uong
Test
s
Mod
eliv
ersu
sM
odel
jz
stat
istic
MVA
CC
Rve
rsus
AC
CR
1.80
∗
MVA
CC
Rve
rsus
ED
F4.
13∗∗
∗
MVA
CC
Rve
rsus
AC
CR
ED
F2.
53∗∗
MVA
CC
Rve
rsus
MV
2.01
∗∗
AC
CR
vers
usM
V0.
76M
Vve
rsus
ED
F3.
53∗∗
∗
AC
CR
vers
usE
DF
3.05
∗∗∗
29

Table 4: Forecast Accuracy TestsThis table examines the forecast accuracy of five hazard models we estimate. Firms aresorted in six deciles based on their estimated probability of financial distress. Decile 1contains those firms with the highest probability while decile 6 contains those with thelowest. We then calculate the percentage (to two decimal places) of firms that subsequentlywent bankrupt the models place in to each decile. The column headed ACCR containsresults for a model that uses the accounting ratios of Z-score. The EDF column presentsthe results from a univariate model that uses EDF derived from a Merton DD model.EDF is converted to a Score labeled as EDF-score. The ACCREDF column shows theresults from a model that combines the accounting ratios of Z-score with EDF. The MVcolumn contains results from a hazard model that uses market-based variables (REL SIZE,EXRET and SIGMA) to predict financial distress.The MVACCR column contains resultsfrom a hazard model that combines market-based variables with EBITDA TA, LIQUIDand FRISK.
Decile ACCCR EDF ACCREDF MV MVACCR
1 63.32 44.00 68.18 58.83 76.662 13.33 8.00 22.72 5.88 10.003 13.33 12.00 4.55 17.65 6.674 3.34 6.00 4.55 5.88 0.005 3.34 6.00 0.00 8.82 6.676 3.34 24.00 0.00 2.94 0.00
No. of Bankrupt Firms 30 25 22 34 30
30

Table 5: Time-Series Variation of the Probability of Financial DistressThis table presents the time-series variation of the probability of financial distress derivedfrom the best bankruptcy forecast model, i.e., MVACCR model. This model combinesREL SIZE, EXRET and SIGMA with EBITDA TA, LIQUID and FRISK.
Year PROBFD (%)2003 0.722004 1.472005 2.332006 2.212007 1.102008 1.162009 1.482010 2.76
31
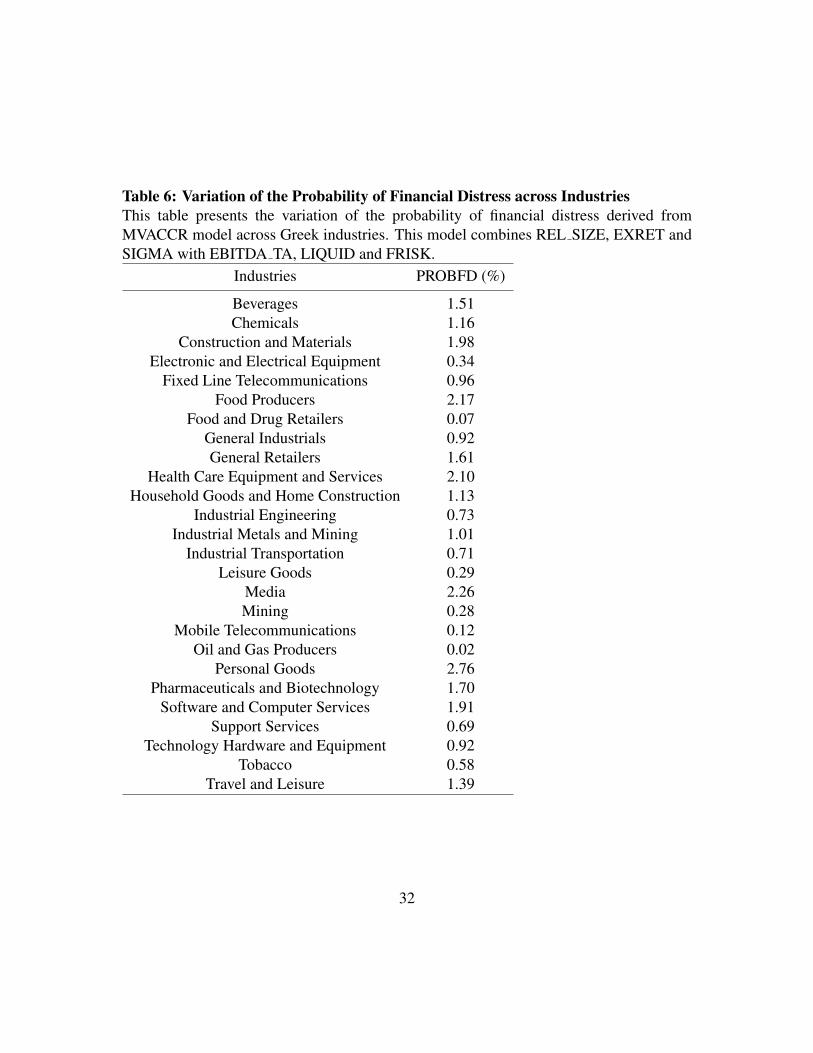
Table 6: Variation of the Probability of Financial Distress across IndustriesThis table presents the variation of the probability of financial distress derived fromMVACCR model across Greek industries. This model combines REL SIZE, EXRET andSIGMA with EBITDA TA, LIQUID and FRISK.
Industries PROBFD (%)
Beverages 1.51Chemicals 1.16
Construction and Materials 1.98Electronic and Electrical Equipment 0.34
Fixed Line Telecommunications 0.96Food Producers 2.17
Food and Drug Retailers 0.07General Industrials 0.92General Retailers 1.61
Health Care Equipment and Services 2.10Household Goods and Home Construction 1.13
Industrial Engineering 0.73Industrial Metals and Mining 1.01
Industrial Transportation 0.71Leisure Goods 0.29
Media 2.26Mining 0.28
Mobile Telecommunications 0.12Oil and Gas Producers 0.02
Personal Goods 2.76Pharmaceuticals and Biotechnology 1.70
Software and Computer Services 1.91Support Services 0.69
Technology Hardware and Equipment 0.92Tobacco 0.58
Travel and Leisure 1.39
32

Table 7: Time-series variation across industries with the highest PROBFDThis table presents the time-series variation of the probability of financial distress de-rived from MVACCR model across Greek industries that are most likely to go bankrupt..This model combines REL SIZE, EXRET and SIGMA with EBITDA TA, LIQUID andFRISK. The probability of financial distress is expressed as a percentage.
2003 2004 2005 2006 2007 2008 2009 2010
Personal Goods 0.89 1.95 4.89 5.55 1.67 1.42 2.16 2.93Media 0.71 1.37 1.79 2.86 1.95 1.28 2.57 6.23
Food producers 0.73 2.85 2.02 1.96 0.93 1.70 2.24 5.01Health care equipment 1.09 1.83 2.25 4.73 1.56 1.73 1.30 1.70
Construction and Materials 0.91 1.15 3.73 2.17 1.99 1.58 2.11 2.47Software and Computer Services 0.77 2.55 2.06 1.88 1.00 0.61 3.76 2.51
Pharmaceuticals and Biotechnology 0.68 0.55 2.06 7.45 0.34 0.57 0.46 1.47General Retailers 0.82 1.74 2.08 0.91 0.33 0.24 0.35 6.55
Beverages 0.65 1.02 2.54 2.30 1.13 1.42 1.42 1.62
33

Tabl
e8:
Ban
krup
tcy
Fore
cast
Pred
ictio
nM
odel
spre
and
post
cris
isPa
nel
Apr
esen
tsth
ere
sults
from
the
haza
rdm
odel
sfo
rth
epe
riod
befo
reth
ecr
isis
,i.e
.,20
02-2
006.
Pane
lB
repo
rts
the
resu
ltsfr
omth
eha
zard
mod
els
for
the
peri
odaf
ter
the
cris
is,i
.e.,
2007
-201
0.T
hede
pend
entv
aria
ble
isan
indi
cato
rvar
iabl
eth
ateq
uals
zero
ifth
efir
mis
notfi
nanc
ially
dist
ress
ed.I
fthe
firm
isfin
anci
ally
dist
ress
ed,t
hen
the
depe
nden
tvar
iabl
eeq
uals
one
only
for
itsla
stfir
m-y
ear
obse
rvat
ion.
The
inde
pend
entv
aria
bles
are
lagg
edto
ensu
reth
atth
eda
taar
eob
serv
able
prio
rto
the
even
toffi
nanc
iald
istr
ess.
Pane
lAco
ntai
nspa
ram
eter
estim
ates
and
test
ofth
eirs
igni
fican
cefo
reac
hha
zard
mod
el.T
heco
lum
nhe
aded
AC
CR
cont
ains
resu
ltsfo
ram
odel
that
uses
the
acco
untin
gra
tios
ofZ
-sco
re.
The
ED
Fco
lum
npr
esen
tsth
ere
sults
from
aun
ivar
iate
mod
elth
atus
esE
DF
deriv
edfr
oma
Mer
ton
DD
mod
el.
ED
Fis
conv
erte
dto
aSc
ore
labe
led
asE
DF-
scor
e.T
heA
CC
RE
DF
colu
mn
show
sth
ere
sults
from
am
odel
that
com
bine
sth
eac
coun
ting
ratio
sof
Z-s
core
with
ED
F.T
heM
Vco
lum
nco
ntai
nsre
sults
from
aha
zard
mod
elth
atus
esm
arke
t-ba
sed
vari
able
s(R
EL
SIZ
E,E
XR
ET
and
SIG
MA
)to
pred
ictfi
nanc
iald
istr
ess.
The
MVA
CC
Rco
lum
nco
ntai
nsre
sults
from
aha
zard
mod
elth
atco
mbi
nes
mar
ket-
base
dva
riab
les
with
EB
ITD
ATA
,L
IQU
IDan
dFR
ISK
.The
row
labe
led
Wal
dSt
atis
ticco
ntai
nsth
eW
ald
test
test
ing
the
hypo
thes
isth
atth
eco
effic
ient
sar
ejo
intly
zero
.It
isdi
stri
bute
das
χ2 (k)
,whe
rek
isth
enu
mbe
rof
para
met
ers
(exc
ludi
ngth
eco
nsta
nt.)
We
scal
eth
eW
ald-
Chi
Squa
rest
atis
ticby
the
aver
age
num
ber
ofob
serv
atio
nspe
rfir
m.
Figu
res
inpa
rent
hese
sar
esc
aled
Wal
dst
atis
tics
test
ing
the
hypo
thes
isth
atth
ein
divi
dual
coef
ficie
ntis
zero
.T
hese
have
aχ2 (
1)di
stri
butio
n.Pa
nel
Bco
ntai
nsth
ere
sults
from
Vuo
ngte
sts
form
odel
com
pari
son.
Und
erth
enu
llhy
poth
esis
that
ther
eis
nodi
ffer
ence
betw
een
the
two
mod
els,
the
log
ofth
era
tioof
the
likel
ihoo
dfo
rm
odel
ito
that
for
mod
eljs
houl
dbe
zero
.If
the
diff
eren
ceis
sign
ifica
ntly
posi
tive,
iis
pref
erre
dto
jan
dvi
ceve
rsa.
∗∗∗,
∗∗an
d∗
deno
tesi
gnifi
canc
eat
the
1,5
and
10pe
rcen
tlev
els
resp
ectiv
ely.
34
Pane
lA:B
ankr
uptc
yPr
edic
tion
Mod
els:
2002
-200
6
AC
CR
ED
FA
CC
RE
DF
MV
MVA
CC
R
Con
stan
t−
2.97
83∗∗
∗−
2.53
06∗∗
∗−
2.60
35∗
−5.
9698
∗∗∗
-2.4
754
(-4.
01)
(-3.
03)
(-1.
84)
(-4.
36)
(-1.
51)
SAL
ES
TA−
3.37
67∗∗
∗−
6.21
60∗∗
∗−
3.06
03∗∗
∗
(-3.
03)
(-3.
32)
(-2.
71)
EB
ITD
ATA
−7.
0421
∗∗∗
−8.
5584
∗∗∗
−4.
3925
∗
(-3.
33)
(-3.
30)
(-1.
88)
CL
TA2.
5013
∗4.
3497
∗∗1.
2526
(1.7
0)(2
.22)
(0.9
9)L
IQU
ID1.
8192
4.06
23∗∗
−0.
0115
∗∗
(1.4
1)(2
.45)
(-2.
45)
ED
F-Sc
ore
0.18
75∗∗
∗0.
0973
(3.4
2)(0
.93)
RE
LSI
ZE
-0.0
998
0.15
97(-
0.49
)(0
.69)
EX
RE
T−
1.97
03∗∗
∗−
1.55
68∗∗
∗
(-4.
16)
(-3.
06)
SIG
MA
5.65
573.
9777
(1.4
4)(0
.89)
Log
Lik
elih
ood
-74.
02-5
6.96
-40.
69-8
7.04
-69.
75W
ald
stat
istic
31.6
7∗∗∗
3.70
∗∗∗
36.1
7∗∗∗
21.8
4∗∗∗
38.4
4∗∗∗
Pane
lB:B
ankr
uptc
yPr
edic
tion
Mod
els:
2007
-201
0
AC
CR
ED
FA
CC
ED
FM
VM
VAC
CR
Con
stan
t−
5.42
17∗∗
∗−
2.51
75∗∗
∗−
3.62
20∗∗
∗−
12.3
085∗
∗∗−
10.4
616∗
∗∗
(-5.
04)
(-4.
19)
(-2.
96)
(-4.
73)
(-3.
40)
SAL
ES
TA−
1.58
64∗
-1.4
301
-1.3
257
(-1.
77)
(-3.
32)
(-1.
59)
EB
ITD
ATA
-1.9
393
−3.
6341
∗-1
.398
2(-
0.85
)(-
1.76
)(-
0.59
)C
LTA
4.21
15∗∗
2.38
583.
7223
∗∗∗
(2.2
6)(1
.35)
(2.7
8)L
IQU
ID-0
.588
4-0
.621
0−
0.01
40∗∗
(-0.
32)
(-0.
35)
(-1.
97)
ED
F-Sc
ore
0.19
23∗∗
∗0.
1112
(2.6
2)(1
.25)
RE
LSI
ZE
−0.
9367
∗∗∗
-0.5
548
(-3.
07)
(-1.
60)
EX
RE
T−
1.18
33∗
-0.5
925
(-1.
79)
(-0.
73)
SIG
MA
4.76
584.
7798
(1.3
0)(1
.05)
Log
Lik
elih
ood
-48.
12-6
8.88
-52.
47-6
3.23
-45.
76W
ald
stat
istic
31.8
7∗∗∗
6.37
∗∗30.7
6∗∗∗
18.1
8∗∗∗
35.3
6∗∗∗
35

Table 9: Forecast Accuracy Test of the hazard models: pre and post crisisPanel A presents the results from a forecast accuracy test of the five hazard models forthe period before the crisis, i.e., 2002-2006. Panel B reports the results from a forecastaccuracy test of the five hazard models for the period after the crisis, i.e., 2007-2010.Firms are sorted in six deciles based on their estimated probability of financial distress.Decile 1 contains those firms with the highest probability while decile 10 contains thosewith the lowest. We then calculate the percentage (to two decimal places) of firms thatsubsequently went bankrupt the models place in to each decile. The column headed ACCRcontains results for a model that uses the accounting ratios of Z-score. The EDF columnpresents the results from a univariate model that uses EDF derived from a Merton DDmodel. EDF is converted to a Score labeled as EDF-score. The ACCREDF column showsthe results from a model that combines the accounting ratios of Z-score with EDF. The MVcolumn contains results from a hazard model that uses market-based variables (REL SIZE,EXRET and SIGMA) to predict financial distress.The MVACCR column contains resultsfrom a hazard model that combines market-based variables with EBITDA TA, LIQUIDand FRISK.
Panel A:2002-2006Decile ACCCR EDF ACCREDF MV MVACCR
1 66.66 45.46 80.00 55.00 66.662 11.11 0.00 20.00 20.00 16.673 0.00 0.00 0.00 5.00 5.564 11.11 27.27 0.00 0.00 0.005 5.56 9.09 0.00 0.00 5.566 5.56 18.18 0.00 20.00 5.56
No. of Bankrupt Firms 18 11 10 20 18
Panel B:2007-2010Decile ACCCR EDF ACCREDF MV MVACCR
1 66.67 42.86 66.67 57.15 75.002 16.67 14.28 16.67 21.43 8.333 8.33 0.00 8.33 7.14 16.674 8.33 7.14 0.00 14.28 0.005 0.00 7.14 8.33 0.00 0.006 0.00 28.58 0.00 0.00 0.00
No. of Bankrupt Firms 12 14 12 14 12
36