On the Graph Edit Distance cost: Properties and Applications-properties-and...On the Graph Edit...
24
On the Graph Edit Distance cost: Properties and Applications 1 Albert Solé-Ribalta 2 , Francesc Serratosa and Alberto Sanfeliu Department of Computer Science and Mathematics Universitat Rovira i Virgili (URV), Avda. Països Catalans, 26, 43007 Tarragona. {[email protected]},{[email protected]} Institut de Robòotica i Informàtica Industrial CSIC-UPC Barcelona, Spain {[email protected]} Abstract We model the edit distance as a function in a labelling space. A labelling space is an Euclidean space where coordinates are the edit costs. Through this model, we define a class of cost. A class of cost is a region in the labelling space that all the edit costs have the same optimal labelling. Moreover, we characterise the distance value through the labelling space. This new point of view of the edit distance gives as the opportunity of defining some interesting properties that are useful for a better understanding of the edit distance. Finally, we show the usefulness of these properties through some applications. Keywords: Graph Edit Distance, Graph Edit Costs, graph similarity, graph distance, error- correcting graph isomorphism. 1. Introduction Graphs are of crucial importance in pattern recognition. Graph structures are used to model several kinds of problems in several pattern recognition fields [1] such as general 2D/3D object recognition [2-7], object and scene view alignment [8-11], SLAM [12, 13], and graph prototyping [14-17]. One of the most essential researched problems in the field of pattern recognition in relation to graph structures is the definition of a similarity measure between graphs. This is an important part of the error tolerant graph matching [18] problem. Error tolerant graph matching aims to compute a bijection between nodes of two graphs that minimizes some kind of objective function. The general case of this problem is known to be NP-complete [19]. Generally, the objective function is related to a graph distance. In the ideal case, graph 1 This research is supported by “Consolider Ingenio 2010”: project CSD2007-00018, by the CICYT project DPI2010- 17112 and by the Universitat Rovira i Virgili through a PhD research grant. 2 Corresponding author.
Transcript of On the Graph Edit Distance cost: Properties and Applications-properties-and...On the Graph Edit...

On the Graph Edit Distance cost: Properties and Applications1
Albert Solé-Ribalta2, Francesc Serratosa and Alberto Sanfeliu
Department of Computer Science and Mathematics
Universitat Rovira i Virgili (URV), Avda. Països Catalans, 26, 43007 Tarragona.
{[email protected]},{[email protected]}
Institut de Robòotica i Informàtica Industrial CSIC-UPC
Barcelona, Spain
Abstract We model the edit distance as a function in a labelling space. A labelling space is an Euclidean
space where coordinates are the edit costs. Through this model, we define a class of cost. A
class of cost is a region in the labelling space that all the edit costs have the same optimal
labelling. Moreover, we characterise the distance value through the labelling space. This new
point of view of the edit distance gives as the opportunity of defining some interesting
properties that are useful for a better understanding of the edit distance. Finally, we show the
usefulness of these properties through some applications.
Keywords: Graph Edit Distance, Graph Edit Costs, graph similarity, graph distance, error-
correcting graph isomorphism.
1. Introduction
Graphs are of crucial importance in pattern recognition. Graph structures are used to model
several kinds of problems in several pattern recognition fields [1] such as general 2D/3D object
recognition [2-7], object and scene view alignment [8-11], SLAM [12, 13], and graph
prototyping [14-17].
One of the most essential researched problems in the field of pattern recognition in
relation to graph structures is the definition of a similarity measure between graphs. This is an
important part of the error tolerant graph matching [18] problem. Error tolerant graph
matching aims to compute a bijection between nodes of two graphs that minimizes some kind
of objective function. The general case of this problem is known to be NP-complete [19].
Generally, the objective function is related to a graph distance. In the ideal case, graph
1 This research is supported by “Consolider Ingenio 2010”: project CSD2007-00018, by the CICYT project DPI2010-
17112 and by the Universitat Rovira i Virgili through a PhD research grant. 2 Corresponding author.

distances should be a metric and thus fulfil the four metric properties: (1) non-negativity, (2)
identity of indiscernible, (3) symmetry, and (4) triangle inequality. Some graph distances
appear in the literature [20-22], but probably the most well known distance is the Graph Edit
Distance [23]. The application of graph edit distance is extensive [24] and therefore numerous
algorithms to compute the Graph Edit Distance can be found in the literature, such as [25-29].
Moreover, some theoretical papers describe properties of a particular definition of the Graph
Edit Distance [30, 31] and [32].
The use of the Graph Edit Distance tailored to a particular problem requires some
application-dependent functions to be defined. The optimal definition and specification of
these functions is no trivially undertaken, and several works have addressed to this task. The
most relevant of these are [5, 33, 34] and [35]. The main contribution of these works has been
to prove that String Edit Distance and Graph Edit Distance contain several classes of cost. In
this article, we define some un-described properties of the Graph Edit Distance. Our specific
definition and interpretation of the Graph Edit Distance allows each class of cost to be
described using a plane equation and allows the shape of each class of cost to be described as
well. The use of these new properties is twofold. On the one hand they can be used to improve
performance of existing algorithms and, on the other hand, they can be used to develop more
efficient graph algorithms.
An interesting survey summarizing the most important contributions on Graph Edit
Distance has recently been published [24].
The aim of this paper is to go a step further about the findings related about edit costs
presented by professor Horst Bunke and his colleagues. They presented some new ideas about
the existence of classes of edit costs in strings [32] and graphs [30]. They show that the edit
costs can be clustered in some classes, in which the edit distance behaves in a similar manner.
We present here a new methodology to represent these classes of cost and some properties.
We also show the usefulness of this methodology and properties through some applications.

This article is structured as follows. Section 2 introduces the required definitions for the
rest of the article. Section 3 describes several new properties of the Graph Edit Distance and
gives some insights into the labellings that the distance can optimize. Section 4 describes some
possible uses and applications of the previously described properties. Finally, section 5
highlights the main contributions of the article and draws some conclusions.
2. Basic definitions and Graph Edit Distance
Attributed Graph
Let and denote the domains of possible values for attributed vertices and arcs,
respectively. An attributed graph AG (over and ) is defined by a tuple ,
where is the set of vertices (or nodes), { |
is the set of undirected arcs (or edges), assigns attribute values to vertices and
assigns attribute values to arcs.
Error correcting graph isomorphism between graphs
Let
and
be two attributed graphs of order and
. To allow maximum flexibility in the matching process, graphs can be extended with null
nodes [36] to be of order . We will refer to null nodes of and by
and
respectively. Let be a set of all possible bijections between two vertex sets
and
. Bijection
, assigns every vertex of to only one vertex of . The bijection
between arcs, denoted by
, is defined accordingly to the bijection of their terminal nodes.
In other words:
(
)
( )
(
)
and
(1)
We define non-existent or null edges by
and
.
Graph Edit Distance between two graphs
One of the most widely used methods to evaluate an error correcting graph isomorphism is
the Graph Edit Distance [23]. The basic idea behind the Graph Edit Distance is to define a
dissimilarity measure between two graphs. This dissimilarity is defined as the minimum
amount of distortion required to transform one graph into the other. To this end, a number of
distortion or edit operations, consisting of insertion, deletion and substitution of both nodes
and edges are defined. Then, for every pair of graphs ( and ), there is a sequence of edit
operations, or an edit path (where each denotes an edit
operation) that transforms one graph into the other. In general, several edit paths may exist
between two given graphs. This set of edit paths is denoted by . To quantitatively evaluate
which edit path is the best, edit cost functions are introduced. The basic idea is to assign a
penalty cost to each edit operation according to the amount of distortion that it introduces in
the transformation.
Each can be related to a univocal graph isomorphism
between the involved graphs. In this way, each edit operation assigns a node of the first graph
to a node of the second graph. Deletion and insertion operations are transformed to
assignations of a non-null node of the first or second graph to a null node of the second and
first graph. Substitutions simply indicate node-to-node assignations. Using this transformation,
given two graphs, and and a bijection between their nodes, , the Graph Edit cost is
given by (Definition 7 of [30]):

∑ (
)
∑ (
)
∑ (
)
∑ (
)
∑ (
)
∑ (
)
( )
and
( )
(2)
where is the cost of substituting node
of the for node ( ) of , is the
cost of deleting node
of and is the cost of inserting node
of . And for edges:
is the cost of substituting edge
of graph for edge
(
) of , is the cost of
assigning edge
of to a non-existing edge of and is the cost of assigning edge
of to a non-existing edge of .
Finally, the Graph Edit Distance is defined as the minimum cost under any bijection in :
(3)
Using this definition, Graph Edit Distance depends essentially on and
functions. Several definitions of these functions exist. We focus first on the definition of
the functions and . The most common approaches are the following. The first and
simplest approach considers cost where
if
(
) otherwise , is defined as a distance function over
the domain of the attributes. A specific example of this cost can be found in fingerprint
verification [37] where or in [30, 31]. The second and most frequently used
approach corresponds to the case in which (
) , and node substitution cost
depends on the attributes of the nodes and possibly on some other parameters , as shown
in [34],[26] and [8], among others. Similar approaches can be used to define . With regard
to and , these functions usually simply assign a constant cost. However, they
can also depend on node or edge attributes [36] [38, 39].

Nodes and edges can be mapped, by functions
and
, to several types of data: nominal,
ordinal or modulo. Depending on the data type a particular distance function is required (see
section 3 of [40]).
Several specific joint definitions for and functions have been
theoretically studied. We highlight [31] and [30] which are described in Table 1.
Reference
[31], [30]
[30]
Table 1: graph edit cost defined in [31] and [30].
The specific cases studied in [30] and [31] yield to several interesting properties. The costs
of first row of Table 1 relate the Graph Edit Distance with the maximal common sub-graph. In
this way computing the graph edit distance with this specific costs leads to the computation of
the maximal common sub-graph. The cost given in the second row has been studied in [30].
Note that the cost of inserting and deleting an edge is always zero. In the definition of [30]
authors assume that the graphs are complete graphs and a non-existing edge is an edge with
“null” label. In this case the cost of deleting and inserting and edge can be encoded in the edge
substitution cost. With this definition authors describe several classes of costs that optimize at
the same final labelling. In this article, we aim to follow the same direction and give a deepest
characterization of these classes of costs. To this aim we slightly modify the graph edit
definition of Table 1 second row. This new definition is given in Table 2.
Table 2: particularization of Graph Edit Distance.
Note that we are able to codify the same information, however edge insertion and edge
deletions are considered in a separate cost function. Besides, we impose the requirement that
and . This requirement is necessary for

our development and moreover for the Graph Edit Distance to fulfil the symmetric property of
a metric.
3. Class of Costs and Edit Surface
A Labelling Space is an Euclidean space where the coordinates are the edit costs. Given a pair
of graphs, we can select some regions in this space such that all points in the labelling space
obtain the same optimal labelling (the labelling that obtains the edit distance). We call each
region as Class of Costs. Moreover, given the labelling space and two graphs, we can define a
function defined over all the labelling space that its value in each point is the distance value
between both graphs and given some specific edit costs. We call this function Edit Surface.
In this section, we first give some basic definitions and then we present two properties of the
Class of Costs and one property of the Edit Surface. From now to the rest of the paper, we use
the particular specification of the Graph Edit Distance given in Table 2. Therefore, the labelling
space is a bi-dimensional space with the axis kn and ke.
3.1 Basic Definitions Definition 1: Edit Cost
Given two graphs, and , an isomorphism between them and two constant values
, the graph edit cost is given by:
(4)
refers to the number of inserted and deleted nodes and can be computed as:
∑ ∑ (
)
{
}{
}
∑ ∑ (
)
{
}{
}
(5)
refers to the number of inserted and deleted edges and can be computed as:
∑ ∑ (
)
{
}{
}
∑ ∑ (
)
{
}{
}
(6)
refers to the cost of substituting nodes and edges, this last cost can be computed as:

∑ ∑ (
)
{
}{
}
∑ ∑ (
)
{
}{
}
(7)
and
are computed as:
(
) {
( )
, (
) {
(
)
(8)
Using this particular definition, the Graph Edit Cost function can be represented in a 3-
dimensional space where x-axis corresponds to , y-axis corresponds to and z-axis
corresponds to . Note that depends linearly on and .
Definition 2: Edit Distance
Given two graphs and and two constant values , the graph edit distance
is defined as:
{
}
{ }
(9)
In other words, the Graph Edit Distance is the minimum cost that can be obtained for concrete
values of and .
Definition 3: Class of Cost
Given two graphs, and , and an isomorphism between them, a class of cost
is the sub-set of values in in which is the isomorphism whereby the minimum
graph edit cost is obtained,
{ | { }} (10)
We write instead of when no confusion is possible. We denominate the set of all
classes of cost given to graphs and by .

Definition 4: Edit Surface
Given two graphs, and , and a bi-dimensional space composed of values in ,
we define the Edit Surface as,
,
{ }
(11)
3.2 Properties of the Class of Costs Property 1. Given two graphs, and , any class of cost is either empty or its values
form a convex polygon in the bi-dimensional space composed of .
Demonstration
Given two graphs, and and the labelling . We see that for to yield the Graph Edit
Distance at a concrete point its cost must be less than or equal to the cost which can
be obtained with any other labelling . That is, the following system of inequalities must
hold:
(12)
Each of the above inequalities (each ) divides into two parts by means of a linear
equation. It is known that the intersection of any set of linear inequalities is a convex polygon
[41]. Consequently, each optimal labelling appears only in a single convex polygon □
Property 2. Given two graphs, and , and a class of cost , any class of cost
where , , and is optimal at the same set of
points as .
Demonstration
This property is easily deduced through equation (12) □

Discussion of property 1 and 2
Using Property 1, we see that , divides into convex polygons, where
each polygon defines a class of cost . A class forms a convex polygon with finite area if its
values of and are finite. Otherwise, the area is infinite.
Figure 1.a: two graphs. Figure 1.b: example of a
finite area.
Figure 1.c: example of
infinite area.
Fig. 1.b and 1.c show an example of Property 1. Fig. 1.a shows two graphs of the well known
graph dataset [42]. Examples correspond to graph 35 and 72 of class A. Fig. 1.b and 1.c show
how two labellings are described by the intersection of a set of inequalities, each line
corresponding to a concrete inequality of (12). Fig. 1.b shows a finite polygon and Fig. 1.c
shows an infinite area of a class.
Note that the above formulation allows dividing into convex polygons, each of which
corresponds to an optimal labelling. Note also that it is possible for (12) to produce an empty
intersection, in which case the tested labelling is never optimal at any .
Knowing that the labelling space is tessellated with labellings it is interesting to see how these
labellings tend to be distributed and their relation to the values and meaning of and ,
specially for the extreme values of .

Figure 2.a: diagram of classes of cost. Figure 2.b: labellings related to of classes of cost.
Consider, as an example, graphs and of letter dataset [42] of class A. Fig. 2.a
presents the classes of cost in the range of [ ] for these graphs. The vertical axis
corresponds to values and values are shown in the horizontal axis. In addition, Fig. 2.b
shows the labellings that each class of cost produces.
We first analyze the labellings computed at . At this special point every
node insertion has a cost of zero, therefore, from the node point of view, the less costly
assignation is to delete all nodes of the first graph and insert all nodes of the second graph.
From the edge point of view, note that, if we assign all nodes to null the cost of edges will be
eider substituted if the edge was not initially in the graph or deleted if the edge was initially on
the graph; in both cases the edges cost will be zeros. Consequently, we can ensure that at
point , either because all nodes from both graphs will be assigned to null
nodes of the other graph or because both graphs are isomorphic.
Analyzing Labellings attached to the vertical axis, that is , it is clear
that from high to low values of labellings associated with each class (Fig. 2.b) go from
substituting all nodes ( ) to only performing insertions and deletions (
). However, an
interesting fact is that not all node substitutions are sub-contained in the adjacent label with
lower . We see that this happens in some classes

but not in others . Note that even the insertion and deletion of edges is not considered,
edge substitution it is.
In the considered special case where , notice that if edges do not have attributes,
, the problem of computing the graph edit distance turns from the quadratic
assignment problem to the linear assignment problem.
An interesting special value when moving over the axis is the value of .
The labelling computed using this value maximizes assignation from nodes of the first graph to
nodes of the second graph considering the minimum number of null assignations required
which is .
We now consider the labellings we obtain when moving over the axis. That is, we
consider values . It is obvious that different values of force the result
to be more structurally correct. However, forcing in addition , it does not necessarily
mean that the node attributes are not considered. In fact they are, due to node substitution
cost is considered. In the example of Fig. 2 see that as we move towards the classes
change to force the labellings to be more structurally consistent. Note again how node
substitutions are sometimes not sub-contained adjacent labels, e.g.
.
In the extreme case , we can affirm that the resulting optimal
isomorphism, if enough null nodes are provided and edges do not have attributes, corresponds
to the maximal common sub-graph as demonstrated in [30]. If we aim to obtain the maximal
common sub-graph when attributes are present in edges, the edge substitution cost must
restrict edges to have the same attribute and so the edge substitution cost must be defined as
Table 1 row 1.
The final extreme value to analyze corresponds to . In most of the cases
while using these costs, the resulting labelling maximizes the node substitutions and edge
substitutions at the same time. However, this double maximization can be troublesome in
several cases. Considering this issue, we differentiate between two types of (Def. 3) sets.
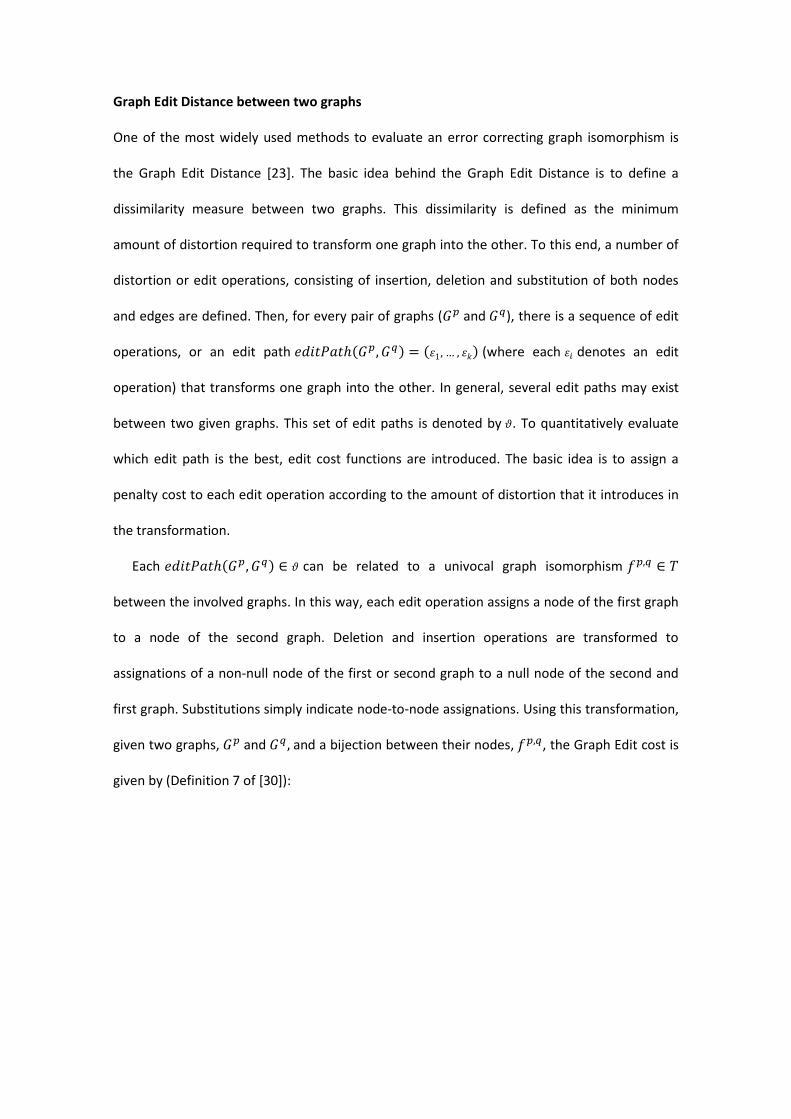
The first corresponds to graphs where for values of the optimal labelling is
equivalent to the optimal labelling for values of . That is, the structurally
optimal and the semantically optimal labellings are equivalent. This is shown in Fig. 2.a. We
consider this situation to be the desired case when applying graph matching to pattern
recognition, because two optimally labelled similar objects should maximize structural and
syntactical relations in the same labelling. The second type of labelling spaces corresponds to
functions in which the optimal semantic labelling differs from optimal structural labelling. An
example is shown in Fig. 3.a and 3.b which show graphs and of the letter dataset [42]
of class A. See that optimal labellings when and differ.
When this situation occurs in the application at hand, we must decide which labellings we
prefer to optimize, structural or semantic.
Figure 3.a: diagram of classes of cost. Figure 3.b: labellings related to of classes of cost.
Note that property 2 implies that the graph edit cost is not an injective function due to several
labelling can give the same optimal cost.
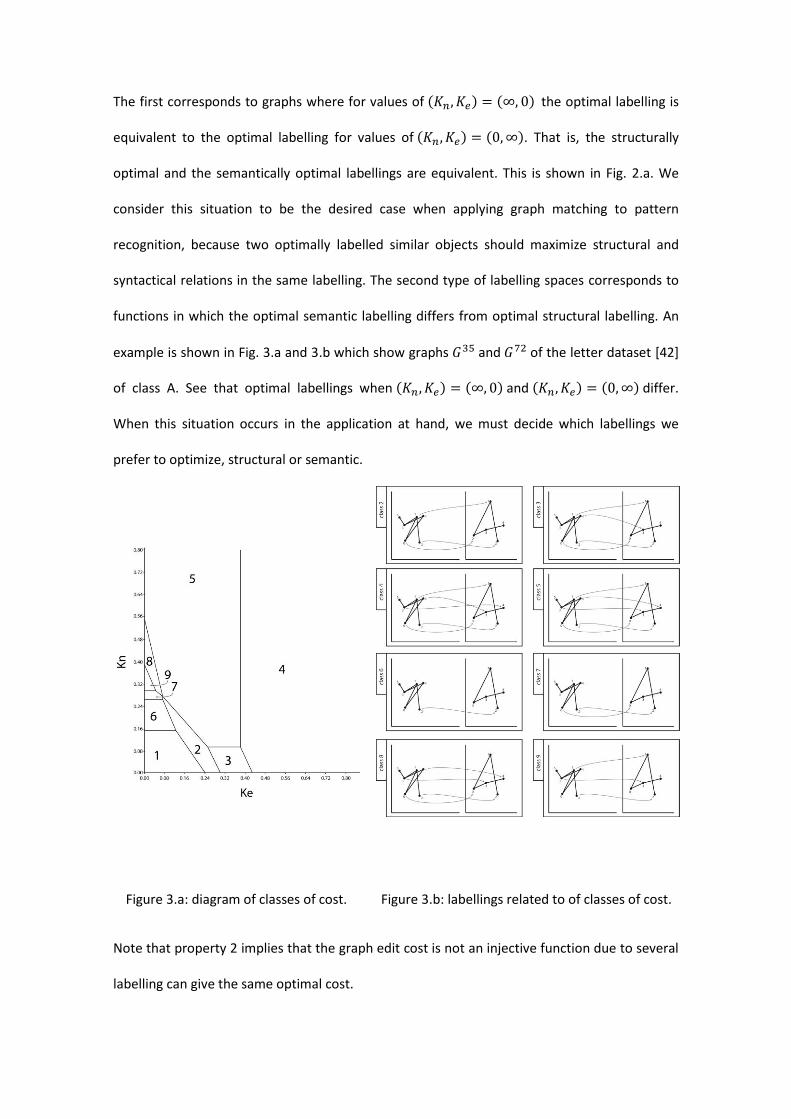
3.3 Property of the Edit Surface Property 3. Given two graphs, and , the function monotonically
increases. In other words, where
,
,
and
.
Demonstration
We know from Property 1 that the bi-dimensional space can be divided into several
classes of cost, . Each class of cost is represented by its plane equation (10). We
know from Definition 1 that values
and are positive. Thus, we can conclude that
within each class of cost , costs monotonically increase.
It is important to demonstrate that where two classes of cost intersect, costs do not decrease
but remain equal or increase. Two labellings change their optimality when costs for both
classes are equal, that is, when the equation (12) for two different labellings, and is equal.
Using this operator ( ), cost cannot decrease and so when two classes intersect, costs
keep increasing □
Figure 4.a: two graphs. Figure 4.b: example of Edit Surface.
4. Applications of the Class of Costs and Edit Surface
In this section we illustrate how the given properties can aid some graph matching problems
and describe three applications where the described properties can be used.

4.1 Interactive and Adaptive Graph Recognition
The aim of the application we present is to learn a model that represents a set of graphs such
that the labelling obtained by the graph matching algorithm is as similar as possible to the
labelling between graph nodes imposed by a human expert. Part of the definitions, methods
and algorithms commented here have been published in [43, 44].
In most of the applications, the labelling between nodes is only partially considered. This is
because it is considered in the first stages of the pattern recognition process, in which it is
desired to find a similarity measure between graphs. But, when this similarity value is obtained
(the final distance value between graphs given the labelling), the knowledge of the labelling is
not considered any more. Nevertheless, we consider that although the graph is properly
classified or identified, the result of the comparison (the final distance value) has not sense if
the labelling between their local parts is far from the labelling proposed by the human
specialist.
We defined in [43] an interactive and adaptive graph recognition model with the aim of
increasing the quality of the labelling between the graph to be identified and the reference
graphs of the database. To that aim, we have extended the graph recognition model to
consider the labelling between nodes proposed by a human specialist. This new knowledge is
incorporated into the system and used to modify the weights of the model (such as and )
that tune the similarity function between graphs.
Figure 5. Scheme of the Interactive and Adaptive Graph Recognition Model.
The batch training process of our application, shown in Fig. 5, generates the first knowledge of
the system that forms the model given a set of pairs (graph, class) and other parameters, such

as and . The Interactive Recognition process generates a first hypothesis
given an input graph and using the model. This hypothesis is composed by a
class , a graph with the minimum distance and a labelling f between both graphs. When
the human proposes a new labelling , the interactive process generates the final hypothesis
using the model and also the human interaction . Note that, can be completely different
from . Not only the graph and labelling can be different but also the class. Finally, the
Adaptive Learning process updates the parameters in the model. Specifically, two of these
parameters are and . Computing the new values of these parameters is a process related
to the aim of this paper since the new values are obtained through the labelling space.
Moreover, the following algorithm needs property 1 to perform properly.
The inputs of the algorithm used to update and are the input graph , the labelling
imposed by the user and the final output graph . The outputs of the algorithm are the
new values of and which maximize the labellings proposed by the expert. The main idea
of the algorithm is to build a histogram of the classes of costs that appeared while using the
general model. That is, each time the algorithm receives a new input, the class of costs is
obtained,
, and added to the histogram. Thus, the peak of the histogram (there
could be several peaks) represents the values of and that maximize the similarity of the
human labellings with the labellings proposed by the system.
Figure 6 (reprinted from [43]) shows the evolution of values of Kn and Ke when new graphs are
added into the system. The system has been initialised by four different values of Kn and Ke.
The initial values are the most external points. We see that when the algorithm converges, the
four experiments converge to the same final value of Kn and Ke.

Figure 6. Evolution of Kn and Ke in four different initialisations.
4.2 Analysis of the behaviour of human similarity measures
Given a pair of images that represent objects (pictures, handwritten characters...), humans can
decide if they are similar or not or even they can decide certain degree of similarity. This is
because we have an inherent similarity function (difficult to be mathematically defined) that
may be application dependent. When we aim to solve the problem of automatically describing
this similarity through automatic structural pattern recognition, it is usual to convert these
images to graphs and apply a distance measure between graphs.
Graph edit distance has some application dependent weights that can be manually tuned.
Some research has been done to automatically obtain these weights such that the overall
recognition ratio is maximised given a database [33,34] or the difference between the node
bijection between both graphs imposed by the specialist and the node bijection obtained by
the machine is reduced [43]. If we have enough theoretical information to understand the
behaviour about the graph distance at hand, it is possible to go a step further. It is possible to
investigate if the inherent distance measure between nodes or between arcs that the user has,
given an application, approaches the one that the method defines. Property 2 says that there
could be two different labellings between nodes that are optimal at the same class of costs.
These two labellings can be seen as different interpretation of the representation.
Suppose we want to compare pictures and we have extracted a region adjacency graph from
each image. A region adjacency graph is a graph in which nodes represent important regions of
the images. The attribute of the regions may be the average colour, the area, the circularity of

the region and so on. There is a graph arc if regions are adjacent. There could be some
attributes on the arcs such as the length of the border between regions.
Suppose we compute the cost class given the labelling imposed by a human specialist for all
the graph comparisons.
Then, some different situations can happen.
- The average value of of all the cost class is low given all the graph comparisons. In
this case, the specialist believes the semantic information on the nodes is very important.
Therefore, the specialist considers two images are similar if they have similar regions but
independently of the position of these regions.
- The average value of of all the cost class is low given all the graph comparisons. This
case is the opposite of the last one. The user believes the most important aspect while
comparing two images is the relation between regions (i.e. their relative position) although
these regions seem to be very different (i.e. different area or colour)
- The area of the union of the cost classes of all the comparisons is big although the
intersection is small. This means that the specialist has different perceptions of the importance
of the relations (arcs) respect the semantic information (nodes) depending on the images. This
situation appears when the representation of the images does not include the feeling of the
specialist.
- An opposite case appears when the area of the union of the cost classes of all the
comparisons is small. This case appears when the node bijections between both graphs that
the user proposes are never the optimal ones or are only optimal in a small domain of and
. In the case that the general cost class is elongated through the axis, the inherent
distance between image regions of the user performs in a different way than the distance
between graph nodes of the system. On the contrary, in the case that the general cost class is
elongated through the axis, the system captures in a different way the relations between
these regions.

In this way, by analyzing the application at hand and how the Graph Edit Distance behave over
the graph representation and the data itself, we are able to adapt, change or replace the
distance measure we are using.
4.3 Reducing the distance error of sub-optimal graph matching algorithms
Property 3 defines that the edit surface must increase when and increases. This
certainly occurs when using optimal algorithms to compute the labellings given the values of
and . However, we cannot assume these properties hold true if we compute the labelling
space using suboptimal algorithms. Two examples are shown in Fig. 7.a and 7.b, which show
obtained by the Graduated Assignment [45] using the graphs in Fig. 2.b and 3.b. We see that
most of the regions computed by the Graduated Assignment are not convex. A good approach
for improving sub-optimal algorithms that minimize Graph Edit Distance would be to modify
them to hold for Property 1 while predicting the labelling given some certain point in the
labelling space.
Figure 7.a: example of class of cost
computation using a suboptimal algorithm.
Graphs used are shown in Fig. 2.b.
Figure 7.b: example of class of cost
computation using a suboptimal algorithm.
Graphs used are shown in Fig. 3.b.
Moreover, the application of Property 3 could help suboptimal algorithms to achieve better
performance in graph distance computations. Fig. 8.a and 8.b show the EditSuface for a range
of and values. Fig. 8.a is computed using the graphs of Fig. 2.b and Fig. 8.b using the

graphs of Fig. 3.b. Both figures show two surfaces. The first, printed in solid gray scale, is
computed using an optimal A* algorithm. The second, printed using transparency is computed
using the Graduated Assignment [45] algorithm. We see how the Graduated Assignment does
not provide a good approximation for high and relatively low values. This means that
the graduated assignment is able to compute very good edge labellings but fail in computing
node assignments. We see that Property 3 does not hold true for surfaces computed by the
Graduated Assignment algorithm. A simple way of improving graph distance computations
could be to compute several costs for different and values and average the results to
force Property 3 to hold. We assume that the computational cost of computing few sub-
optimal algorithms is lower than one optimal algorithm.
Figure 8.a: edit surfaces given by an optimal
and a sub-optimal graph matching
algorithm. Used graphs are shown in Fig 2.b.
Figure 8.b: edit surfaces given by an optimal
and a sub-optimal graph matching algorithm.
Used graphs are shown in Fig 3.b.
5. Conclusions
Most of the applications based on graphs algorithms rely mainly on a precise definition of a
distance between two graphs. There are several definitions in use. However, the most used is
probably the Graph Edit Distance or some variations of it. In this sense, a well known
theoretical study of the distance is required. In this article, we presented some advances on
the theoretical study of the Graph Edit Distance. We characterized the shape of the classes of

costs presented previously in [30]. In addition, we described the shape of the Graph Edit
Distance for the use of every possible graph edit constant. These advances are summarized in
form of 3 properties which are adequately proven. To demonstrate the practical utility of the
properties, we have presented three applications where these properties are used.
From the presented work, we can summarize several conclusions. We see by means of two
examples that the number of labellings in the labelling space is relatively low with respect all
possible labellings we should be able to obtain between two graphs. We see that variations of
and constants do not give enough flexibility to learn a great amount of distinct
isomorphism between two graphs. Different values of define how much we trust a possible
assignation. However, this value is not locally tested but globally and so resignations of nodes
are possible in consecutive labellings in the axis. define how structurally correct we
desire the solution to be. The combination of these two constants allows computing some
different labellings but the modification of node-to-node and edge-to-edge distances are
required to provide to the Graph Edit Distance flexibility in learning every possible node-to-
node bijection. Besides, the shape of the edit surface is clearly determined. This knowledge is
important to evaluate the quality of suboptimal algorithms and in addition to aid in improving
its results.

References
1. Conte, D., et al., Thirty Years Of Graph Matching In Pattern Recognition. International Journal of Pattern Recognition and Artificial Intelligence, 2004. 18(3): p. 265-299.
2. Xia, S. and E. Hancock, 3D Object Recognition Using Hyper-Graphs and Ranked Local Invariant Features, in Structural, Syntactic, and Statistical Pattern Recognition. 2008. p. 117-126.
3. He, L., C. Han, and W. Wee, Object recognition and recovery by skeleton graph matching, in International Conference on Multimedia & Expo. 2006.
4. He, L., et al., Graph matching for object recognition and recovery. Pattern Recognition Letters, 2004. 37(7).
5. Neuhaus, M. and H. Bunke, Self-organizing maps for learning the edit costs in graph matching. Transactions on Systems, Man, and Cybernetics, 2005. 35(3): p. 305-314.
6. Riesen, K. and H. Bunke, Graph Classification Based on Vector Space Embedding. International Journal of Pattern Recognition and Artificial Intelligence, 2009. 23(6): p. 1053-1081.
7. Emms, D., R. Wilson, and E. Hancock, Graph matching using the interference of discrete-time quantum walks. Image and Vision Computing, 2009. 27(7): p. 985-1002.
8. Caetano, T., et al., Learning Graph Matching. Transaction on Pattern Analysis and Machine Intelligence, 2009. 31(6): p. 1048-1058.
9. Williams, M., R. Wilson, and E. Hancock, Multiple Graph Matching with Bayesian Inference. Pattern Recognition Letters, 1997. 18: p. 1275-1281.
10. Konc, J. and D. Janežič, A Branch and Bound Algorithm for Matching Protein Structures, in Adaptive and Natural Computing Algorithms. 2007. p. 399-406.
11. Sanromà, G., R. Alquézar, and F. Serratosa, Smooth Simultaneous Structural Graph Matching and Point-Set Registration, in Workshop on Graph-based Representations in Pattern Recognition. 2011. p. 142-151.
12. Romero, A. and M. Cazorla, Topological SLAM Using Omnidirectional Images: Merging Feature Detectors and Graph-Matching, in Advanced Concepts for Intelligent Vision Systems. 2010.
13. Thrun, S. and M. Montemerlo, The Graph SLAM Algorithm with Applications to Large-Scale Mapping of Urban Structures. International Journal of Robotics Research, 2006. 25(5-6): p. 403-429.
14. Ferrer, M., et al., Generalized median graph computation by means of graph embedding in vector spaces. Pattern Recognition Letters, 2010. 43(4): p. 1642-1615.
15. Xia, S. and E. Hancock, Learning Class Specific Graph Prototypes, in Image Analysis and Processing. 2009. p. 269-277.
16. Lozano, M.A. and F. Escolano, ACM attributed graph clustering for learning classes of images, in International conference on Graph based representations in pattern recognition. 2003.
17. Mukherjee, L., et al., Generalized median graphs and applications. JOURNAL OF COMBINATORIAL OPTIMIZATION, 2009. 17(1): p. 21-44.
18. Messmer, B. and H. Bunke, Fast error-correcting graph isomorphism based on model precompilation, in Image Analysis and Processing. 1997, Lecture Notes in Computer Science. p. 693-700.
19. Garey, M. and D. Johnson, Computers and Intractability: A Guide to the Theory of NP-Completeness. 1979.
20. Bunke, H. and K. Shearer, A graph distance metric based on the maximal common subgraph. Pattern Recognition Letters, 1998. 19(3-4): p. 255-259.

21. Shapiro, L. and R. Haralick, A Metric for Comparing Relational Descriptions. Transactions on Pattern Analysis and Machine Intelligence, 1985. 7(1): p. 90-94.
22. Raveaux, R., J.-C. Burie, and J.-M. Ogier, A graph matching method and a graph matching distance based on subgraph assignments. Pattern Recognition Letters, 2010. 31(5): p. 394-406.
23. Sanfeliu, A. and K.-S. Fu, A Distance measure between attributed relational graphs for pattern recognition. IEEE transactions on systems, man, and cybernetics, 1983. 13(3): p. 353-362.
24. Gao, X., et al., A survey of graph edit distance. Pattern Analysis and applications, 2010. 13(1): p. 113-129.
25. Bunke, H. and G. Allermann, Inexact graph matching for structural pattern recognition Pattern Recognition Letters, 1983. 1(4): p. 245-253
26. Lladós, J., E. Martí, and J. Villanueva, Symbol Recognition by Error-Tolerant Subgraph Matching between Region Adjacency Graphs. TRANSACTIONS ON PATTERN ANALYSIS AND MACHINE INTELLIGENCE, 2001. 23(10): p. 1137-1143.
27. Justice, D. and A. Hero, A binary linear programming formulation of the graph edit distance. Transactions on Pattern Analysis and Machine Intelligence, 2006. 28(8): p. 1200-1214.
28. Riesen, K. and H. Bunke, Approximate graph edit distance computation by means of bipartite graph matching. Image and Vision Computing, 2009. 27(4): p. 950-959.
29. Riesen, K., M. Neuhaus, and H. Bunke, Bipartite Graph Matching for Computing the Edit Distance of Graphs, in GRAPH-BASED REPRESENTATIONS IN PATTERN RECOGNITION. 2007.
30. Bunke, H., Error Correcting Graph Matching: On the Influence of the Underlying Cost Function. Transactions on Pattern Analysis and Machine Intelligence, 1999. 21(9): p. 917-922.
31. Bunke, H., On a relation between graph edit distance and maximum common subgraph. Pattern Recognition Letters, 1998. 18(8): p. 689-694.
32. Rice, S., H. Bunke, and T. Nartker, Classes of cost functions for string edit distance. ALGORITHMICA, 1997. 18(2): p. 271-280.
33. Neuhaus, M. and H. Bunke, A Probabilistic Approach to Learning Costs for Graph Edit Distance, in International Conference on Pattern Recognition. 2007.
34. Neuhaus, M. and H. Bunke, Automatic learning of cost functions for graph edit distance. Information Sciences, 2006. 177(1): p. 239-247.
35. Kapsabelis, K., P. Dickinson, and K. Dogancay, Investigation of graph edit distance cost functions for detection of network anomalies, in Australian & New Zealand Industrial and Applied Mathematics Journal. 2007.
36. Wong, A. and M. You, Entropy and Distance of Random Graphs with Application to Structural Pattern Recognition. Transaction on Pattern Analysis and Machine Intelligence, 1985. PAMI-7(5): p. 599-609.
37. Jain, A.K. and D. Maltoni, Handbook of Fingerprint Recognition. 2003, Springer-Verlag New York.
38. Serratosa, F., R. Alquézar, and A. Sanfeliu, Function-Described Graphs for modelling objects represented by attributed graphs. Pattern Recognition, 2003. 36(3): p. 781-798.
39. Sanfeliu, A., F. Serratosa, and R. Alquézar, Second-Order Random Graphs for modelling sets of Attributed Graphs and their application to object learning and recognition. International Journal of Pattern Recognition and Artificial Intelligence, 2004. 18(3): p. 375-396.
40. Serratosa, F. and A. Sanfeliu, Signatures versus histograms: Definitions, distances and algorithms. Pattern Recognition Letters, 2006. 39(5): p. 921-934.
41. Grunbaum, B., Convex Polytopes. 2003.
42. Riesen, K. and H. Bunke, IAM Graph Database Repository for Graph Based Pattern Recognition and Machine Learning, in Structural, Syntactic, and Statistical Pattern Recognition. 2008, Lecture Notes in Computer Science. p. 287-297.
43. Serratosa, F., A. Solé-Ribalta, and X. Cortés, Automatic Learning of Edit Costs Based on Interactive and Adaptive Graph Recognition, in Graph-Based Representations in Pattern Recognition. 2011, Lecture Notes in Computer Science. p. 152-162.
44. Solé-Ribalta, A. and F. Serratosa, Exploration of the Labelling Space Given Graph Edit Distance Costs in Graph-Based Representations in Pattern Recognition. 2011, Lecture Notes in Computer Science. p. 164-174.
45. Gold, S. and A. Rangarajan, A Graduated Assignment Algorithm for Graph Matching. Transaction on Pattern Analysis and Machine Intelligence, 1996. 18(4): p. 377-388.
VITAE
Albert Solé-Ribalta received the Computer Science Engineering degree and
Master in Artificial Intelligence degree, from the Univeristat Rovira i Virgili
(URV), in 2007. From 2005 to 2008 he was employed at URV as a collaborator
professor. From 2006 to 2008, he worked at ITAKA where he was doing
research in web based interfaces for multi-agent systems. On 2008, he
received a pre-doctoral research grand from Universitat Rovira i Virgili. Since
then, he is doing research in structural and syntactical pattern recognition based on graphs, at
URV with collaboration with Univeristat Politècnica de Catalunya (UPC).
Francesc Serratosa was born in Barcelona, 24 may 1967. He received his
Computer Science Engineering degree from the Universitat Politècnica de
Catalunya (Barcelona) in 1993. Since then, he has been active in research in
the areas of computer vision, robotics, structural pattern recognition and
biometrics. He received his Ph.D. from the same university in 2000. He is
currently associate professor of computer science at the Universitat Rovira i
Virgili (Tarragona, Catalonia, Spain). He has published more than 50 papers and he is an active
reviewer in some congresses and journals. He is the coordinator of the PhD course on
Computer Science and Security at the Universitat Rovira i Virgili.
Alberto Sanfeliu received the B.S.E.E. and Ph.D. degrees from the Universitat Politéctica de Catalunya (UPC), Barcelona, Spain, in 1978 and 1982, respectively. In 1981, he joined the faculty of UPC and is currently a Full Professor of computational sciences and artificial intelligence. He is also the Director of the Institut de Robòtica i Informàtica Industrial, CSIC-UPC, Barcelona. He was the Coordinator of the European-Union-funded URUS Project. He has authored books in pattern recognition and SLAM, and
published more than 200 papers in international journals and conference proceedings. He is the holder of several patents on quality control based on computer vision. He works on various theoretical aspects on pattern recognition, computer vision, and robotics and on applications on vision defect detection, tracking, object recognition, robot vision, and SLAM.