On the generation mechanisms of fluid-driven …...- Fluid decompression tests in triaxially...
25
This article has been accepted for publication and undergone full peer review but has not been through the copyediting, typesetting, pagination and proofreading process which may lead to differences between this version and the Version of Record. Please cite this article as doi: 10.1002/2016GL070919 © 2016 American Geophysical Union. All rights reserved. On the generation mechanisms of fluid-driven seismic signals related to volcano tectonics Marco Fazio 1 , Philip M. Benson 1 and Sergio Vinciguerra 2 1) Rock Mechanics Laboratory, University of Portsmouth, Portsmouth, PO1 3QL, UK. 2) Department of Earth Sciences, University of Turin, 10125 Italy Corresponding author: Marco Fazio, University of Portsmouth, Burnaby Building, Burnaby Road, Portsmouth, PO1 3QL, UK. ([email protected] ) Key points - Fluid decompression tests in triaxially deformed Etna basalt test. - Use of Acoustic Emission sensors to monitor fluid-induced micro-seismicity. - Characteristic spectra of fluid driven seismic activity controlled by the number of phase sand pore pressure evolution.
Transcript of On the generation mechanisms of fluid-driven …...- Fluid decompression tests in triaxially...
This article has been accepted for publication and undergone full peer review but has not been through the copyediting, typesetting, pagination and proofreading process which may lead to differences between this version and the Version of Record. Please cite this article as doi: 10.1002/2016GL070919
© 2016 American Geophysical Union. All rights reserved.
On the generation mechanisms of fluid-driven seismic signals related to volcano
tectonics
Marco Fazio1, Philip M. Benson
1 and Sergio Vinciguerra
2
1) Rock Mechanics Laboratory, University of Portsmouth, Portsmouth, PO1 3QL, UK.
2) Department of Earth Sciences, University of Turin, 10125 Italy
Corresponding author: Marco Fazio, University of Portsmouth, Burnaby Building, Burnaby
Road, Portsmouth, PO1 3QL, UK. ([email protected])
Key points
- Fluid decompression tests in triaxially deformed Etna basalt test.
- Use of Acoustic Emission sensors to monitor fluid-induced micro-seismicity.
- Characteristic spectra of fluid driven seismic activity controlled by the number of
phase sand pore pressure evolution.
© 2016 American Geophysical Union. All rights reserved.
Abstract
The generation mechanics of fluid-driven volcano seismic signals, and their evolution with
time, remains poorly understood. We present a laboratory study aiming to better constrain the
time evolution of such signals across temperature conditions 25 to 175°C in order to simulate
a “bubbly liquid”. Simulations used pressures equivalent to volcanic edifices up to 1.6 km in
depth using a triaxial deformation apparatus equipped with an array of Acoustic Emission
(AE) sensors. We investigate the origin of fluid driven seismic signals by rapidly venting the
pore pressure through a characterized damage zone. During the release of water at 25°C
broadband signals were generated, with frequencies ranging from 50 to 160 kHz. However
the decompression of a water/steam phase at 175°C generated a bi-modal spectrum of
different signals, in the range 100 kHz and 160 kHz. These new results are consistent with
natural signals from active volcanoes, such as Mt. Etna, and highlight the role of fluid and
gas phases (such as “bubbly liquids”) in generating different types of volcano-tectonic
seismicity.
Index terms
7280 Volcano seismology (4302, 8419)
8488 Volcanic hazards and risks (4302, 4328, 4333)
8419 Volcano monitoring (4302, 7280)
Keywords
Acoustic Emissions, Triaxial experiments, Decompression experiments, Fluid-induced
seismicity, Fluid phases, Tremor
© 2016 American Geophysical Union. All rights reserved.
Introduction
Seismicity is the short-term precursory phenomenon most frequently detected before volcanic
unrest, occurring as the Earth's crust is fractured as magma moves its way to the surface, and
as fluids move within the faulted rock. Although different local terminologies have been
widely used in the past [e.g. McNutt, 1996; Chouet, 1996; Neuberg, 2000; McNutt, 2005],
according to Chouet [1996] volcano seismicity is defined in general terms of signal frequency
or period.
Low frequency (LF), also known as long period (LP), events are characterized by a low
harmonic frequency (0.5 – 5 Hz, Alparone et al., 2010) waveform lasting several seconds and
a highly emergent onset that is difficult to identify. In contrast, high frequency events
generated by deformation/failure mechanisms within the volcanic edifice are generally
recorded in the frequency range of up to 15 Hz, termed volcano-tectonic (VT) events and
feature an impulsive onset, a short broadband coda and higher energies. Between these two
end-members, so-called hybrid events share features from both VT and LF activity: an
impulsive onset followed by a lower frequency coda. Volcanic tremor show similar
frequency content with respect to LP, but in a quasi-continuous signal that can last from
minutes to months. Finally, very-low frequency (VLF, 0.3-0.01 Hz), also known as Very-
Long Period (VLP), events have also been recorded since the deployment of broadband
instruments in the 1990s [McNutt, 2005]. These signals share the harmonic behaviour of LPs
and tremor, but at lower frequency.
© 2016 American Geophysical Union. All rights reserved.
The similarities between VLF, LF and tremor suggest a common source process. For this
reason, seismic signals may be grouped into (1) VLF, LF and tremor likely generated as the
result of fluid movement in fluid-filled cracks, and (2) VT events originated from
shear/tensile mechanisms occurring in the solid rock. Crucially from a hazard and risk
perspective, the interplay between VLF, LF, tremor and VT signals is diagnostic for
understanding the fundamental magmatic processes within the volcanic structure, and in
particular to the pressurisation of the volcanic plumbing system [e.g. Chouet & Matoza,
2013]. However, whilst great progress linking the underpinning geophysics to the families of
seismic activity have been made over the past 20 years [e.g. Chouet 1996; 2003; McNutt,
2005, Chouet & Matoza, 2013], the physical source of tremor, LF and VLF events remains
controversial. In particular, our knowledge of fluid/gas flow (decompression) rates needed to
generate such signals and the coupling between different phases with respect to two-phases
fluids such as “bubbly liquids” [e.g. Kumagai & Chouet, 2001], is lacking.
A key link is the causal relationship between LF events and tremor [Neuberg, 2000;
Saccorotti et al., 2007]. Neuberg [2000] found that individual LF events at Soufrière Hills
volcano (Montserrat) were linked to small-size, repetitive, non-destructive source areas which
then merged into tremor before lava dome collapses. Later work by Saccorotti et al. [2007]
distinguished two different seismic signals (LP and VLP) at Mt Etna volcano (Italy) during
non-eruptive periods and interpreted the shallow plumbing system in terms of the resonance
of a fluid-filled buried cavity. However, as these processes cannot be directly observed
numerous models have been developed, often considering a fluid moving through a
crack/damage network. In such an approach, the rapid fluid flow generates resonance within
the crack [Julian, 1994], that is detected as a seismic event [e.g. Chouet, 1996, 2003]. Other
generation mechanisms for the measured seismicity includes brittle failure of magma at its

© 2016 American Geophysical Union. All rights reserved.
glass transition point [Tuffen & Dingwell, 2005; Neuberg et al., 2006] and „stick-slip‟ during
the extrusion of solidifying lava [Iverson et al., 2006; Kendrick et al., 2014]. Of these, the
fluid-filled crack model is the most common [Chouet & Matoza, 2013], where LF events are
generally viewed as the response of the system to a sudden transitory pressure or fluid flow
event, whilst tremor is generated by supported pressure fluctuations [Chouet, 1996].
Assuming the fluid is actively involved, the occurrence of low-frequency seismicity is
considered to be a sign of pressurization in a magmatic/hydrothermal system, generating LF
seismic activity that is, in turn, related to the rate and magnitude of pressurisation and to the
intensity of explosive activity [Chouet, 1996].
In this study we investigate the change in micro-seismic signal frequency as it evolves from
tremor to LF by releasing high pressure, high temperature fluid (water) from a pre-faulted
sample of basalt from Mt Etna, recording the induced seismicity via Acoustic Emission (AE)
analysis [e.g. Burlini et al., 2007]. This is the laboratory analogue for field scale seismicity
and is widely used in rock physics experiments [e.g. Benson et al., 2007, 2010]. While the
vast majority of AE studies have focused on the nucleation and propagation of shear faulting
analogous to VT and due to rupture processes that precede and accompany the formation of a
major damage zone in a centimetres-scale rock specimen [e.g. Ohnaka and Mogi, 1982; Read
et al., 1995; Benson et al., 2007], a more limited dataset is available for the fluid-induced
seismicity [e.g. Burlini et al., 2007; Benson et al., 2008; 2010; 2014]. In particular these early
studies of fluid (water) induced AE have concentrated to date on water at ambient
temperature conditions. Here we report new data taken from a more systematic study in order
to better understand the subtle links between fluid phase on the character (frequency) of
generated AE, linking these data to the statistics of the events in time and space. This is
© 2016 American Geophysical Union. All rights reserved.
important, as the laboratory calibrations of these subtle effects are crucial for quantitative
interpretation of field scale data.
The key advantage of performing laboratory experiments is that conditions of pressure and
temperature at which AE events occur are known and well controlled. Although real volcanic
conditions act on different time and space scales and are different in terms of heterogeneity,
the use of laboratory rock physics as a proxy for the microseismic source has shown to be a
useful tool in reproducing the fundamental processes and the corresponding geophysical
signatures at controlled stress conditions [e.g. Read et al., 1995; Sammonds, 1999; Burlini et
al., 2007; Benson et al., 2008]. It is also well established that the physical processes
generating the laboratory AEs and those responsible for the volcanic earthquake are similar
and scalable [e.g. Aki & Richards, 1980; Burlini et al., 2007; Benson et al., 2010].
Appropriate scaling approaches for centimetre–scale rock samples to a kilometre-scale
volcanic edifice continue to be debated, however, basic qualitative interpretations can be
made by considering similarities between laboratory and field waveforms/spectra, and
quantitatively by taking the size – frequency relationship [Burlini et al., 2007; Benson et al.,
2010]. We hereafter report a suite of new experiments where we generated and analysed
seismic signals during the decompression of single- and dual-phase fluids under controlled
temperature and confining pressure conditions.
© 2016 American Geophysical Union. All rights reserved.
Material investigated and Experimental procedures
The sample material was an alkali, porphyritic basalt from Mt Etna (Italy) with density 2870
± 10 kg/m3 and porosity 2.02 ± 0.12%. Cylindrical samples of 100 mm (length) by 40 mm
(diameter) were drilled using a standard diamond tipped coring drill. In addition, a conduit of
3 mm is drilled through the centre of the long axis to enable pore fluid (water) to access the
eventual damage zone. Experiments were carried out using an externally heated, servo-
controlled triaxial apparatus (Fig. S1) at a confining pressure of 46 MPa and pore pressure of
16 MPa, yielding an effective pressure of 30 MPa and broadly representative of volcanic
conditions and shallow plumbing systems at approximately 1.6 km depth. Standard triaxial
deformation experiments were performed at a constant strain rate of 10-5
s-1
, in order to
generate a shear/damage zone oriented at approximately 30 with respect to the loading. Once
this shear zone and the associated damage zone are created the maximum principal stress is
then reduced to yield a hydrostatic stress condition (and therefore lock the fault). At this stage
one of two protocols is followed, either i) the external furnace increases sample temperature
(and pore fluid temperature to 175°C), or ii) the temperature is held constant at approximately
25°C. After this, in both cases, through a fast-acting solenoid valve connected to the lower
end of the sample the pore fluid pressure is rapidly released to atmosphere via the rapid fluid
flow from the established damage zone.
An array of 12 Lead Zirconate Titanate (PZT) sensors (6 at 1 MHz-central frequency and 6 at
200 kHz), embedded within an engineered Nitrile jacket [Sammonds, 1999], is used to
compute P-wave elastic velocities. This consists of „pulsing‟ sensors in sequence, with the
remaining sensors recording the arrival of the signal via the time-of-flight method [Pettitt,
1998] and to derive a velocity model necessary for the location algorithm. A downhill
simplex method [Nelder & Mead, 1965; Press et al., 1994] is used to locate the micro-seismic
© 2016 American Geophysical Union. All rights reserved.
(AE) events, extracted from the continuous signal, (which we term streaming data) recorded
by 8 of the 12 channels. The streaming data is processed offline after the experiment allowing
events to be “harvested” from this streamed waveform. Before being recorded, all signals are
pre-amplified by dual 30 dB buffered amplifiers, which also incorporate a band-pass filter 10
kHz – 1 MHz to remove local noise. In this study, the use of lower frequency sensors allows
for a more robust statistics when analysing the fluid-induced (LF) AE data.
During the experiment, axial stress and pore fluid pressures are recorded via high speed data
acquisition systems. This enables the character and the frequency of the AE to be compared
to the axial stress/pore pressure change, as a function of time.
Results
A series of 7 experiments were performed (here shown the experiments with the best signal-
to-noise ratio, SNR), with peak stress at failure measured between 436 and 465 MPa. After
failure a stress drop of approximately 250 MPa is measured (Fig. S2), with post-test
inspection revealing the classic shear fracture at 30° to the σ1direction.This part of the
experiment generates a shear fault accessed by the central conduit. An instantaneous pore
pressure release (hereafter called “venting”) is then performed by discharging the pore fluid
from the bottom of the sample via a solenoid valve and recording the pore pressures at high
data acquisition rates of 5 kHz.
© 2016 American Geophysical Union. All rights reserved.
We find that the pore pressure decay follows a different path depending on sample
temperature (Fig. 1). At 25°C (experiment EB25) the lower pore pressure decreases
instantaneously to zero (Fig. 1a, solid green line), as it is directly connected to the solenoid
valve. Meanwhile, the top pore pressure decays over a period of two minutes (Fig. 1a, solid
black line). At elevated temperatures of 175°C (experiment EB175), both bottom and top
pressure decays quickly to approximately 1.5 MPa (Fig. 1b, solid lines), followed by a more
gentle decrease to 0.9 MPa over the following 10 seconds. Both pressures stabilize at this
value over a period of 70 seconds, after which the bottom pore pressure decrease to 0.2 MPa.
During the two minutes after the venting, the maximum cumulative AE hits (AE counts
above a fixed threshold) occurs during the main venting stage (around 1350 and 1500
cumulative hits in the first second in EB25 and EB175 respectively, Fig. 1a, 1b, dashed red
lines). At 25 °C, 10 seconds after the release, the cumulative hits sharply increase up to a
value of 1800 hits, while in the following 110 seconds cumulative AE hits increase at a
slower rate reaching a total of 1900 at 120 s (Fig. 1a). At 175 °C a similar behaviour is seen:
after the initial peak, the cumulative hit rate steadily increased up to 1800 hits (Fig. 1b).
Figure 1 shows a 58 ms segment around the initial pore pressure decay (Fig. 1c, 1d, thick
black and green lines), for both the raw streaming data waveform (Fig. 1c, 1d, thin blue lines)
and its frequency-power spectrogram (Fig. 1e, 1f) of that AE activity as a function of time
during venting. In EB25, the onset of a tremor-like AE activity occurred 12 ms after the
release, with a duration of 10 ms (Fig. 1c). Conversely, in EB175 the AE activity started 4 ms
after the release. This AE tremor had a much longer duration (30 ms) than the tremor
generated in EB25. In terms of frequency, for experiment EB25 we measured a broadband
tremor with frequency ranging from 40 kHz to 200 kHz (Fig. 1e), whereas for experiment
EB175 a continuous spectrum was measured instead with frequency ranging between 100
kHz and 160 kHz (Fig. 1f).
© 2016 American Geophysical Union. All rights reserved.
To further investigate this frequency switch, a systematic statistical analysis was developed.
This consisted of extracting a sequence of 819.2 µs-long events from EB25 (56 events) and
EB175 (31 events) in the 120 seconds following the venting. In each signal, the initial onset
time was picked and a FFT analysis was performed over a 102.4 µs-long window in order to
obtain a characteristic frequency of the AE. This permits the dominant frequency of each
event to be superimposed on the pore pressure decay (Fig. 2a and 2b). In general, we note
that the dominant frequencies generated at 25°C fails within the frequency range 40-160 kHz
(Fig. 2a), whereas at 175°C two subtle ranges of dominant frequency emerge: 90-110 kHz
and 160-180 kHz (Fig. 2b). This analysis has been performed on the other 5 experiments,
which resulted in analogous results (Fig. S3).
To evaluate the extent of the broadband feature in EB25 and of the bi-modality in EB175, we
use a cross-correlation analysis on the event waveforms in each experiment. The method
cross-correlates the waveforms between events, resulting in a matrix of cross-correlation
coefficients. Choosing a threshold of 0.7, we then define a master event, corresponding to the
event with the highest number of correlated event. For each of the correlated events, a
spectrum over the same time window of 102.4 μs has been calculated and finally, these
spectra are stacked, resulting in the plots shown in Figure 2c, d. In EB25, 15 events are
correlated and the stacked spectrum has a broadband feature, with 9 of these events being
classified as broadband. In EB175, 12 events are correlated, displaying a well-defined bi-
modality with narrower spectral peaks, with 7 of these events classified as bi-modal.

© 2016 American Geophysical Union. All rights reserved.
Figures 3a and 3c show a spectral analysis of these waveforms for the two master spectra and
their waveforms occurring in EB25 and EB175. When the streaming data is harvested into
discrete events, a range of broadband and bi-modal features are observed during the tremor-
like AE activity, depending on the P/T conditions. In EB25 the amplitude spectrum lies
constantly above the -6 dB threshold from 80 to 145 kHz (Fig. 3a). Conversely in EB175
only two narrow frequency ranges lie above the -6 dB threshold: 80 – 105 kHz and 150 – 180
kHz (Fig. 3c).
Finally, AE focal mechanisms were calculated. Due to the low amplitude, low SNR and low
number of picks available (just 8 channels recorded streaming data), reasonable focal
mechanisms were obtained for only 11 AEs harvested during the venting stage of both
experiments (6 for EB25, 5 for EB175: Table S1). These 11 events show a component of
Double Couple (DC) (ranging from 7% to 60%, with an average of 32%). The component of
Compensated Linear Vector Dipole (CLVD) is slightly higher, ranging from 21% to 61% and
with an average of 42%, reflecting the enhanced contribution of the fluid motion to the
mechanism [e.g. Julian, 1994; Benson et al., 2008].
Discussion and conclusions
During our experiments we recorded AE events in the frequency range from 40 to 200 kHz.
This is comparable to the field-scale volcanic seismic signals occurring at frequencies 0.1 –
10 Hz via simple frequency/scale relationship [Aki & Richards, 1980; Burlini et al., 2007;
Benson et al., 2008; Browning et al., 2016]. LP and VLP signals with both uni-modal and bi-
modal spectra have been observed at Mt. Etna on September 05, 2013 (Fig. 3b) and January
10, 2015 (Fig. 3d) respectively (recorded by INGV permanent seismic array operating at Mt
Etna). The September 05 VLP event is characterized by a spectrum, with a single peak,
© 2016 American Geophysical Union. All rights reserved.
between 0.5 Hz and 2 Hz, lying above the -6 dB threshold and has been associated to the
explosive activity at the New South-East Crater, which involves gas-rich erupted magma
[Bonaccorso et al., 2014] and is typically accompanied by intense degassing at the nearby
craters [Viccaro et al., 2015].
The January 10 LP signal instead shows a spectrum with two peaks above the -6 dB line, at
4-5 Hz and at 7.5 Hz, and has been linked to strombolian activity and ash emission at
Voragine crater. We therefore notice the link between a mono-phase fluid (gas) and a single
peak spectrum, while a double-phase fluid (liquid-gas) produces a two-peak spectrum. Bi-
modal spectra have also been found at Stromboli volcano [Sgroi et al, 2009] and interpreted
as the overlap of deep magmatic fluids and shallower fluids enriched of gas. This is
consistent with our findings, confirming the key role played by the type and number of
phases forming the fluid to the character of the fluid-induced seismicity. Although the
comparison between fluid-induced AE and volcanic LP and VLP signals has been previously
postulated by Julian [1994] and shown qualitatively in the laboratory by Benson et al. [2008],
in this work we expand this to better analyse the competition between gas and liquid due to
elevated temperatures and with respect to pore pressure decompression in order to understand
the relationship between the source and the corresponding signal. This is important, as whilst
the basic mechanism for AE generation due to the rapid movement of water through a
fractured zone (as the pore pressure is released) is known, the precise role of the pore fluid
phase (water, bubbly liquids, etc.) that generates turbulence manifested as a sustained tremor
(Fig. 1c, 1d) has yet to be constrained mainly due to the difficulties in generating low
amplitude events with acceptable quality and build a catalogue in meaningful statistical
terms.
© 2016 American Geophysical Union. All rights reserved.
To better understand the interactions between the rock matrix (damage zones) and the
influence of pore fluids and pressure fluctuations, we have developed a suite of experiments
to cover a wide spectrum of fluid phases and consider the dominant frequency of events to
better understand the contribution of the pore fluid water/gas phases to the generated AE, and
the distribution of these AE across their dominant frequencies as a function of time and fluid
pressure (Fig. 2a, 2b). This is a key novelty with respect to previous early work that used the
end members given by either fully fluid-saturated or dry rocks. For the events generated at
25°C, we obtained a fluid movement consisting of a single-phase liquid. Once the fluid is
released a broadband tremor takes place followed by events with dominant frequencies
widespread in the same frequency of the tremor, but characterized by a largely
monochromatic spectrum, as shown in Fig. 2c. Conversely, at 175°C, well above the boiling
temperature of water (at ambient pressure), a multi-phase system is generated by the venting
with a liquid-gas mixture being released to ambient pressure. These two phases coexisted
inside the sample, due to the significant gradient in pore pressure between the upper and the
lower ends of the sample, likely generating a time-varying “bubbly-liquid” type of fluid. We
interpret the resulting bi-modal AE event activity (with two clear dominant frequencies at
100 and 160 kHz) to be a consequence of a two-phase bubbly-fluid. This has previously been
established as the source of low frequency activity, both in the laboratory and the field.
Quality factor (Q) analysis (Fig. S4), revealed lower Q for experiment with liquid water and
higher Q when a “bubbly-liquid” is released, consistently with the model of Kumagai &
Chouet [2000, 2001]. Kumagai and Chouet [2000, 2001] also postulated a higher frequency
content for fluids richer in gas, which explains the 160 kHz cluster towards the end of the
venting stage (Fig. 2b), where the gas-fraction is expected to be higher due to the continue
transformation of superheated water into gas. The decrease in the amplitude ratio between the

© 2016 American Geophysical Union. All rights reserved.
spectral peak at 100 kHz and the spectral peak at 160 kHz (Fig. S5), points to the same
direction (additional discussion in SI).
Examining the pore pressure curve in EB175 (Fig. 1d), further evidence for the presence of a
two-phase fluid stems from the plateauing of top and bottom pressure at approximately 1
MPa. This is close to the stable equilibrium condition where liquid water exists
(approximately 0.7 MPa) at 175°C. The small discrepancy (0.3 MPa) is likely to be due to the
time lag due to the placement of the measuring transducers, located about 2 m (top pressure)
and 1.5 m (bottom pressure) away from the sample itself. Furthermore, the re-expansion of
the fluid and the establishment of equilibrium is then likely to impede the pore pressure decay
and therefore the generation of AEs. This is supported by the occurrence of only 4 events
during the first seconds of release (Fig. 1d), whilst some 27 events were recorded in the same
time-window for the venting at 25°C (Fig. 1c). We also observed individual events of short
duration (Fig. 3a, 3c) that we interpret as fluid-generated, due to the relatively low DC
component (32%) and the similarity in the frequency content between these and their
subsequent tremor. Both cases are consistent with a response to sudden pressure transient and
sustained pressure fluctuations [e.g. Chouet, 1996].
The key findings of this study are: 1) to find a better defined role of pore pressure decay rate
on the generation of AEs and how these transition from sustained tremor of tens of ms long to
discrete events with similar spectral characteristics, but hundreds of µs long; 2) the
simulation and characterization of the role of phase changes in the pore fluid on the
characteristic AE spectrum, determining subtle changes to the spectrogram depending on
fluid phase mixture. Such an outcome has been theoretically postulated by Kumagai and
Chouet [2000; 2001] who considered a range of different fluids within fracture damage zones

© 2016 American Geophysical Union. All rights reserved.
such as dusty gasses and bubbly fluids resonating through different crack geometries. Taken
together our data provide new quantitative evidence for models linking low frequency signals
in volcanic areas as due to the resonance of high-pressure fluid filled crack/cavities [e.g.
Chouet, 1996]. We also suggest that low frequency events (tremor, LPs and VLPs) could be
used to discriminate between different fluid-driven processes, ultimately helping eruption
forecasting by characterizing the different supercritical fluids at depth, as well as providing
better constraints on the emplacement mechanics within the volcanic edifice generally
[Neuberg, 2000]. We find that the effects of the fluids phase/type on the AE data (and by
extension, field seismic data) are very subtle, and so using such an analysis to infer deep
magmatic plumbing systems should be done with caution.
Acknowledgements
The authors acknowledge Emily Butcher for technical support in the Rock Mechanics
Laboratory, Prof. Philip Meredith (UCL) and Dr. Peter Rowley (UoP) for thoughtful
discussions, Dr. Salvatore Alparone (INGV Catania) is especially acknowledged for
providing the data from Mt Etna and useful discussions on field data. A special thanks also
for the anonymous reviewer for his/her contribution through significant revisions. The data
used are listed in the references, figure and supplements. This research was funded by a
University Graduate Bursary grant to MF. The authors declare no competing interests.
© 2016 American Geophysical Union. All rights reserved.
References
Aki, K., & Richards, P. G. (1980). Quantitative seismology: Theory and methods. Vol II.
Benson, P. M., Thompson, B. D., Meredith, P. G., Vinciguerra, S., & Young, R. P. (2007).
Imaging slow failure in triaxially deformed Etna basalt using 3D acoustic‐emission location
and X‐ray computed tomography. Geophysical research letters, 34(3).
Benson, P. M., Vinciguerra, S., Meredith, P. G., & Young, R. P. (2008). Laboratory
simulation of volcano seismicity. Science, 322(5899), 249-252.
Benson, P. M., Vinciguerra, S., Meredith, P. G., & Young, R. P. (2010). Spatio-temporal
evolution of volcano seismicity: A laboratory study. Earth and Planetary Science
Letters, 297(1), 315-323.
Benson, P. M., Vinciguerra, S., Nasseri, M. H., & Young, R. P. (2014). Laboratory
simulations of fluid/gas induced micro-earthquakes: application to volcano
seismology. Frontiers in Earth Science, 2, 32.
Bonaccorso, A., Calvari, S., Linde, A., & Sacks, S. (2014). Eruptive processes leading to the
most explosive lava fountain at Etna volcano: The 23 November 2013 episode. Geophysical
Research Letters, 41(14), 4912-4919.
Browning, J., Meredith, P., & Gudmundsson, A. (2016). Cooling‐dominated cracking in
thermally stressed volcanic rocks. Geophysical Research Letters, 43(16), 8417-8425.
Burlini, L., Vinciguerra, S., Di Toro, G., De Natale, G., Meredith, P., & Burg, J. P. (2007).
Seismicity preceding volcanic eruptions: New experimental insights. Geology, 35(2), 183-
186.
Chouet, B. A. (1996). Long-period volcano seismicity: its source and use in eruption
forecasting. Nature, 380(6572), 309-316. doi:10.1038/380309a0
Chouet, B. (2003). Volcano seismology. Pure and Applied Geophysics, 160(3-4), 739-788.
© 2016 American Geophysical Union. All rights reserved.
Chouet, B. A., & Matoza, R. S. (2013). A multi-decadal view of seismic methods for
detecting precursors of magma movement and eruption. Journal of Volcanology and
Geothermal Research, 252, 108-175.
Iverson, R. M., Dzurisin, D., Gardner, C. A., Gerlach, T. M., LaHusen, R. G., Lisowski, M.,
Major, J. J., Malone, S. D., Messerich, J. A., Moran, S. C., Pallister, J. S., Qamar, A. I.,
Schilling S. P. & Wallace, J. W. (2006). Dynamics of seismogenic volcanic extrusion at
Mount St Helens in 2004–05. Nature, 444(7118), 439-443.
Julian, B.R.(1994), Volcanic tremor: Non-linear excitation by fluid flow: J. Geophys. Res., v.
99, p. 11,859–11,877, doi: 10.1029/93JB03129.
Kendrick, J. E., Lavallée, Y., Hirose, T., Di Toro, G., Hornby, A. J., De Angelis, S., &
Dingwell, D. B. (2014). Volcanic drumbeat seismicity caused by stick-slip motion and
magmatic frictional melting. Nature Geoscience, 7(6), 438-442.
Kumagai, H., & Chouet, B. A. (2000). Acoustic properties of a crack containing magmatic or
hydrothermal fluids. Journal of Geophysical Research: Solid Earth, 105(B11), 25493-25512.
Kumagai, H., & Chouet, B. A. (2001). The dependence of acoustic properties of a crack on
the resonance mode and geometry. Geophysical research letters, 28(17), 3325-3328.
McNutt, S. R. (1996). Seismic monitoring and eruption forecasting of volcanoes: a review of
the state-of-the-art and case histories. In Monitoring and mitigation of volcano hazards (pp.
99-146). Springer Berlin Heidelberg.
McNutt, S. R. (2005). Volcanic seismology. Ann. Rev. Earth planet. Sci., 32, 461-491.
Nelder, J. A., & Mead, R. (1965). A simplex method for function minimization. The
computer journal, 7(4), 308-313.
Neuberg, J. (2000). Characteristics and causes of shallow seismicity in andesite
volcanoes. Philosophical Transactions of the Royal Society of London. Series A:
Mathematical, Physical and Engineering Sciences, 358(1770), 1533-1546.
© 2016 American Geophysical Union. All rights reserved.
Neuberg, J. W., Tuffen, H., Collier, L., Green, D., Powell, T., & Dingwell, D. (2006). The
trigger mechanism of low-frequency earthquakes on Montserrat. Journal of Volcanology and
Geothermal Research, 153(1), 37-50.
Ohnaka, M., & Mogi, K. (1982). Frequency characteristics of acoustic emission in rocks
under uniaxial compression and its relation to the fracturing process to failure. Journal of
Geophysical Research: Solid Earth (1978–2012), 87(B5), 3873-3884.
Pettitt, W. S. (1998). Acoustic emission source studies of microcracking in rock (Doctoral
dissertation, University of Keele).
Press, W. H., Flannery B. P., Teukolsky S. A., & Vetterling W. T. (1994). Numerical Recipes
in C: The Art of Scientific Computing, 2nd edition, Cambridge University Press, Cambridge.
Read, M. D., Ayling, M. R., Meredith, P. G., & Murrell, S. A. (1995). Microcracking during
triaxial deformation of porous rocks monitored by changes in rock physical properties, II.
Pore volumometry and acoustic emission measurements on water-saturated
rocks. Tectonophysics, 245(3), 223-235.
Saccorotti, G., Lokmer, I., Bean, C. J., Di Grazia, G., & Patanè, D. (2007). Analysis of
sustained long-period activity at Etna Volcano, Italy. Journal of volcanology and geothermal
research, 160(3), 340-354.
Sammonds, P. R. (1999). Understanding the fundamental physics governing the evolution
and dynamics of the Earth's crust and ice sheets. Philosophical Transactions of the Royal
Society of London. Series A: Mathematical, Physical and Engineering Sciences, 357(1763),
3377-3401.
Sgroi, T., Montuori, C., Agrusta, R., & Favali, P. (2009). Low‐frequency seismic signals
recorded by OBS at Stromboli volcano (Southern Tyrrhenian Sea). Geophysical Research
Letters, 36(4).

© 2016 American Geophysical Union. All rights reserved.
Tuffen, H., & Dingwell, D. (2005). Fault textures in volcanic conduits: evidence for seismic
trigger mechanisms during silicic eruptions. Bulletin of Volcanology, 67(4), 370-387.
Viccaro, M., Calcagno, R., Garozzo, I., Giuffrida, M., & Nicotra, E. (2015). Continuous
magma recharge at Mt. Etna during the 2011–2013 period controls the style of volcanic
activity and compositions of erupted lavas. Mineralogy and Petrology, 109(1), 67-83.
© 2016 American Geophysical Union. All rights reserved.
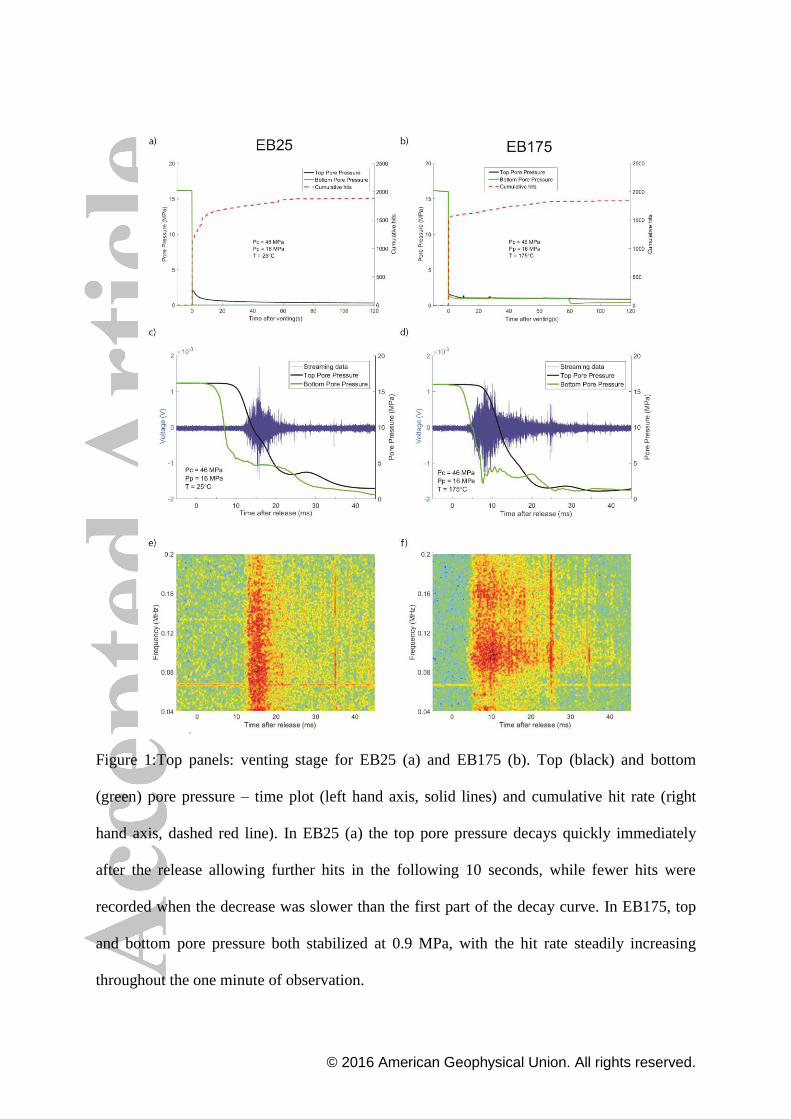
Figure 1:Top panels: venting stage for EB25 (a) and EB175 (b). Top (black) and bottom
(green) pore pressure – time plot (left hand axis, solid lines) and cumulative hit rate (right
hand axis, dashed red line). In EB25 (a) the top pore pressure decays quickly immediately
after the release allowing further hits in the following 10 seconds, while fewer hits were
recorded when the decrease was slower than the first part of the decay curve. In EB175, top
and bottom pore pressure both stabilized at 0.9 MPa, with the hit rate steadily increasing
throughout the one minute of observation.
© 2016 American Geophysical Union. All rights reserved.
Middle and bottom panels: a 58 millisecond-long snapshot of the continuous waveforms (c
and d) and their spectrograms (e and f) when the pore fluid is vented out by the solenoid
valve for EB25 and EB175 respectively. In c) and d) the thick black and green lines are top
and bottom pore pressure respectively, while the thin blue line represent the streaming data.
In e) and f), red denotes the higher amplitudes in the signal at that particular frequency and
time, while green/blue represent lower amplitudes. At 25°C (e), a broadband tremor occurred,
starting 12 ms after the release and lasting for 10 ms. At 175°C (f) the tremor starts 5 ms after
the release and has a duration of 30 ms, with the power of the signal concentrated at few
discrete frequencies, 100 and 160 kHz.
© 2016 American Geophysical Union. All rights reserved.
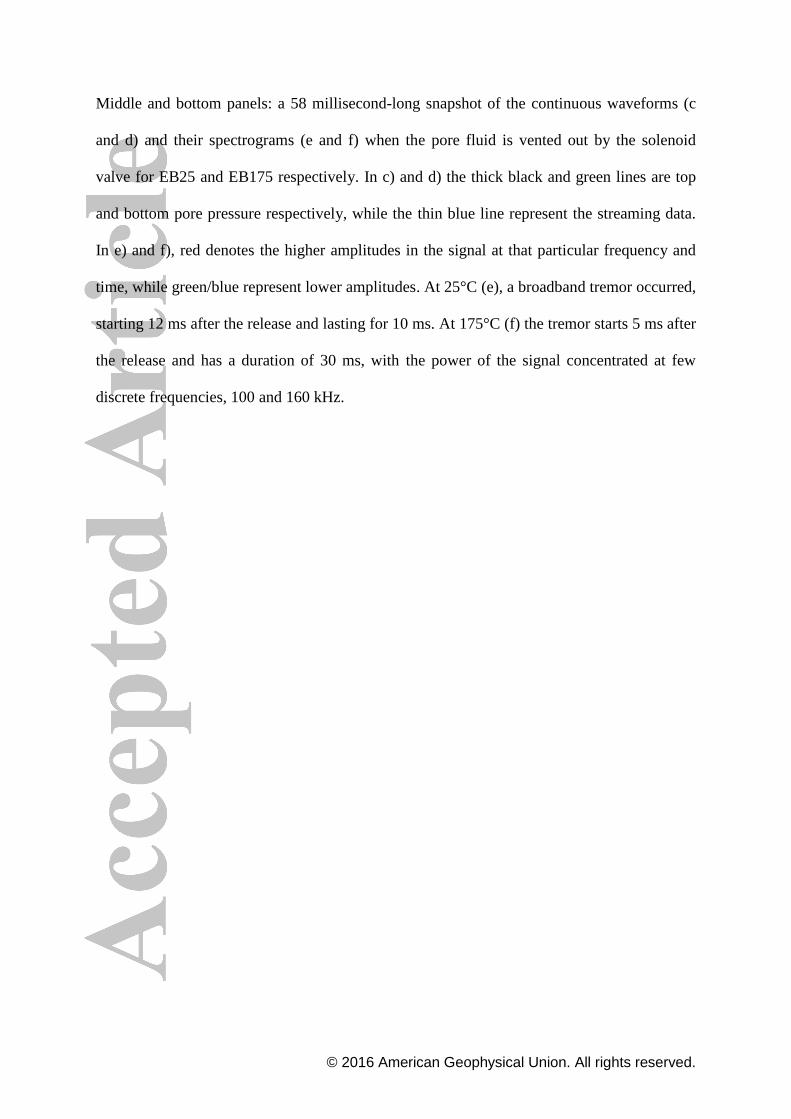
Figure 2:Panel (a) and (b) show the top (black) and bottom (grey) pore pressure – time plot
(left hand axis, solid lines) with dominant event frequencies shown on the right hand axis
(black filled circles) of the harvested events for EB25 and EB175 experiments respectively.
The arrows indicated the events shown in detail in Figure 3a and 3c.Panel (c) and (d)

© 2016 American Geophysical Union. All rights reserved.
represent the correlated waveforms and their spectra. The number on the waveform is the
correlation coefficient with the master waveform. On the bottom right of each panel, the
spectra, resulting from the stacking of the spectra of the correlated events is plotted, with the
dashed horizontal line marking -6 dB level. While in EB25 a broadband spectrum
characterizes the correlated events, the stacked spectrum in EB175 presents two peaks. These
characteristics are similar to those observed for the tremors (Fig. 2c, 2d), suggesting that the
number of phases in the fluid controls the spectrum of the AE activity.
© 2016 American Geophysical Union. All rights reserved.
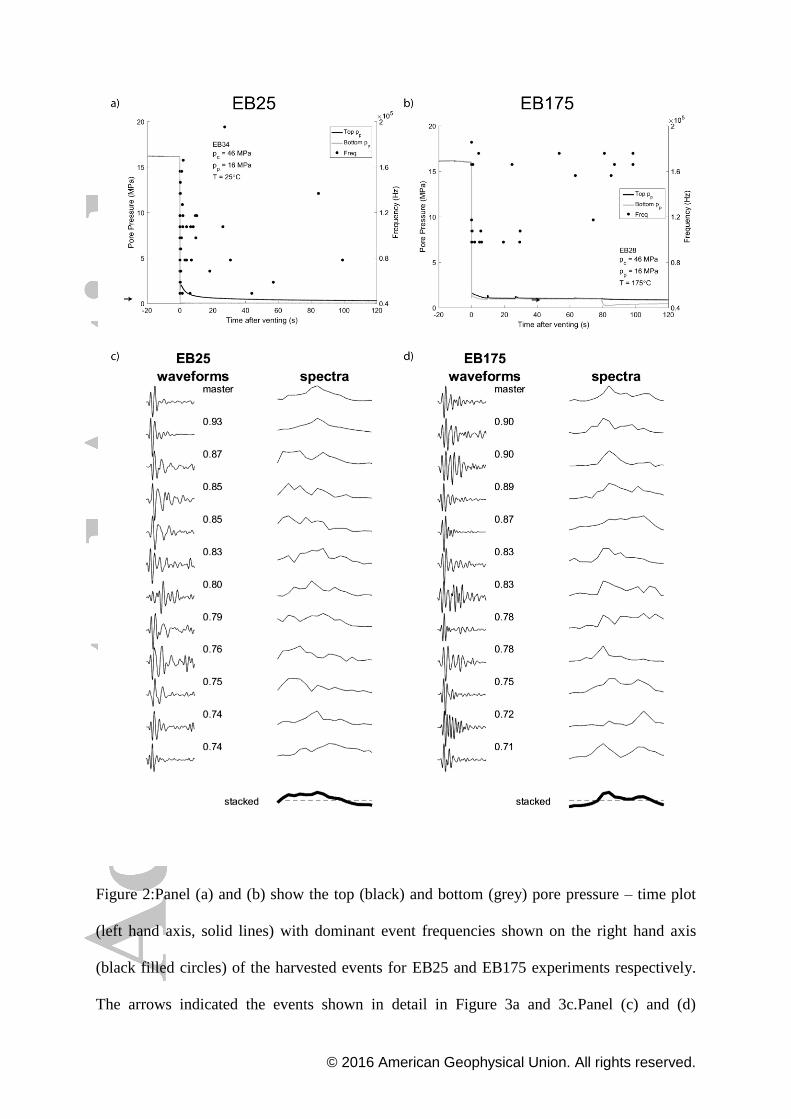
Figure 3:The laboratory signals of experiment EB25 (a) and EB175 (c) are matched with the
field scale volcanic events (b, d). Each panel shows the waveforms (upper part), the
spectrogram (middle) and the waveform spectral density (in dB units, lower part). The Fast
Fourier Transform is calculated from the onset of the event over a 1024-point-long window
(vertical dashed lines).
At 25°C (panel a), the event is characterized by a broadband spectrum with a frequency range
of 80 – 145 kHz above the -6 dB threshold. This is somehow similar to the VLP event (panel
b) recorded at Mt. Etna (Italy) on September 05, 2013, where a single peak (0.5 -2 Hz) above
the -6 dB is present. This volcanic signals was recorded three minutes before mild explosive
activity at the New South-East Crater. At 175°C two dominant frequency ranges appears
above the -6 dB threshold: 80 – 105 kHz and 150 – 180 kHz (panel c). A similar bi-modality
(first peak between 4.5 Hz and 5.5 Hz, second narrower peak at 7.5 Hz) has been observed in

© 2016 American Geophysical Union. All rights reserved.
the LP event (panel d) recorded at the same volcano on January 10, 2015. This LP signal was
associated to the continuous strombolian activity and ash emission from the Voragine crater.
This volcanic activity is marked by the simultaneous presence of both liquid and gas phases.
Field scale events come from INGV seismic network.