On the effects of leaflet microstructure and constitutive ...
22
Biomech Model Mechanobiol DOI 10.1007/s10237-015-0674-0 ORIGINAL PAPER On the effects of leaflet microstructure and constitutive model on the closing behavior of the mitral valve Chung-Hao Lee 1 · Jean-Pierre Rabbah 2 · Ajit P. Yoganathan 2 · Robert C. Gorman 3 · Joseph H. Gorman III 3 · Michael S. Sacks 4 Received: 13 January 2015 / Accepted: 1 April 2015 © Springer-Verlag Berlin Heidelberg 2015 Abstract Recent long-term studies showed an unsatisfac- tory recurrence rate of severe mitral regurgitation 3–5years after surgical repair, suggesting that excessive tissue stresses and the resulting strain-induced tissue failure are potential etiological factors controlling the success of surgical repair for treating mitral valve (MV) diseases. We hypothesized that restoring normal MV tissue stresses in MV repair techniques would ultimately lead to improved repair durability through the restoration of MV normal homeostatic state. Therefore, we developed a micro- and macro- anatomically accu- rate MV finite element model by incorporating actual fiber microstructural architecture and a realistic structure-based constitutive model. We investigated MV closing behav- iors, with extensive in vitro data used for validating the proposed model. Comparative and parametric studies were conducted to identify essential model fidelity and informa- B Michael S. Sacks [email protected] 1 Center for Cardiovascular Simulation, Institute for Computational Engineering and Sciences (ICES), The University of Texas at Austin, 201 East 24th Street, 1 University Station C0200, POB 5.236, Austin, TX 78712, USA 2 Cardiovascular Fluid Mechanics Laboratory, Department of Biomedical Engineering, Georgia Institute of Technology, 387 Technology Circle NW, Atlanta, GA 30318, USA 3 Gorman Cardiovascular Research Group, University of Pennsylvania, 3400 Civic Center Blvd, Philadelphia, PA 19104, USA 4 W. A. “Tex” Moncrief, Jr. Simulation-Based Engineering Science Chair I, Department of Biomedical Engineering, Center for Cardiovascular Simulation, Institute for Computational Engineering and Sciences (ICES), The University of Texas at Austin, 201 East 24th Street, 1 University Station C0200, POB 5.236, Austin, TX 78712, USA tion for achieving desirable accuracy. More importantly, for the first time, the interrelationship between the local fiber ensemble behavior and the organ-level MV closing behavior was investigated using a computational simulation. These novel results indicated not only the appropriate parameter ranges, but also the importance of the microstructural tuning (i.e., straightening and re-orientation) of the collagen/elastin fiber networks at the macroscopic tissue level for facilitat- ing the proper coaptation and natural functioning of the MV apparatus under physiological loading at the organ level. The proposed computational model would serve as a logical first step toward our long-term modeling goal—facilitating simulation-guided design of optimal surgical repair strate- gies for treating diseased MVs with significantly enhanced durability. Keywords Mapped fiber microstructural architecture · Image-based FE simulation · Simplified structural constitu- tive model · Affine fiber kinematics · In vitro validations 1 Introduction The mitral valve (MV) is one of the four heart valves located between the left atrium and left ventricle, and it regulates the flow between these two respective chambers. The MV is considered an “apparatus” (Komeda et al. 1997) with four pri- mary components: the anterior and posterior leaflets (MVAL and MVPL), the papillary muscles (PMs) that project from the left ventricular wall, the chordae tendineae that pro- vide connections between the papillary muscles and the MV leaflets and prevent the leaflets from prolapse during MV functioning, and the annulus that is part of the conceptual transition between the MV leaflets and the left atrium. The opening of the MV allows blood flow from the left atrium 123
Transcript of On the effects of leaflet microstructure and constitutive ...

Biomech Model MechanobiolDOI 10.1007/s10237-015-0674-0
ORIGINAL PAPER
On the effects of leaflet microstructure and constitutive modelon the closing behavior of the mitral valve
Chung-Hao Lee1 · Jean-Pierre Rabbah2 · Ajit P. Yoganathan2 ·Robert C. Gorman3 · Joseph H. Gorman III3 · Michael S. Sacks4
Received: 13 January 2015 / Accepted: 1 April 2015© Springer-Verlag Berlin Heidelberg 2015
Abstract Recent long-term studies showed an unsatisfac-tory recurrence rate of severe mitral regurgitation 3–5yearsafter surgical repair, suggesting that excessive tissue stressesand the resulting strain-induced tissue failure are potentialetiological factors controlling the success of surgical repairfor treatingmitral valve (MV) diseases.We hypothesized thatrestoring normal MV tissue stresses inMV repair techniqueswould ultimately lead to improved repair durability throughthe restoration of MV normal homeostatic state. Therefore,we developed a micro- and macro- anatomically accu-rate MV finite element model by incorporating actual fibermicrostructural architecture and a realistic structure-basedconstitutive model. We investigated MV closing behav-iors, with extensive in vitro data used for validating theproposed model. Comparative and parametric studies wereconducted to identify essential model fidelity and informa-
B Michael S. [email protected]
1 Center for Cardiovascular Simulation, Institute forComputational Engineering and Sciences (ICES),The University of Texas at Austin, 201 East 24th Street, 1University Station C0200, POB 5.236, Austin, TX 78712,USA
2 Cardiovascular Fluid Mechanics Laboratory, Department ofBiomedical Engineering, Georgia Institute of Technology,387 Technology Circle NW, Atlanta, GA 30318, USA
3 Gorman Cardiovascular Research Group, University ofPennsylvania, 3400 Civic Center Blvd, Philadelphia, PA19104, USA
4 W. A. “Tex” Moncrief, Jr. Simulation-Based EngineeringScience Chair I, Department of Biomedical Engineering,Center for Cardiovascular Simulation, Institute forComputational Engineering and Sciences (ICES), TheUniversity of Texas at Austin, 201 East 24th Street, 1University Station C0200, POB 5.236, Austin, TX 78712,USA
tion for achieving desirable accuracy. More importantly, forthe first time, the interrelationship between the local fiberensemble behavior and the organ-level MV closing behaviorwas investigated using a computational simulation. Thesenovel results indicated not only the appropriate parameterranges, but also the importance of the microstructural tuning(i.e., straightening and re-orientation) of the collagen/elastinfiber networks at the macroscopic tissue level for facilitat-ing the proper coaptation and natural functioning of the MVapparatus under physiological loading at the organ level.The proposed computational model would serve as a logicalfirst step toward our long-term modeling goal—facilitatingsimulation-guided design of optimal surgical repair strate-gies for treating diseased MVs with significantly enhanceddurability.
Keywords Mapped fiber microstructural architecture ·Image-based FE simulation · Simplified structural constitu-tive model · Affine fiber kinematics · In vitro validations
1 Introduction
The mitral valve (MV) is one of the four heart valves locatedbetween the left atrium and left ventricle, and it regulatesthe flow between these two respective chambers. The MV isconsidered an “apparatus” (Komeda et al. 1997)with four pri-mary components: the anterior and posterior leaflets (MVALand MVPL), the papillary muscles (PMs) that project fromthe left ventricular wall, the chordae tendineae that pro-vide connections between the papillary muscles and the MVleaflets and prevent the leaflets from prolapse during MVfunctioning, and the annulus that is part of the conceptualtransition between the MV leaflets and the left atrium. Theopening of the MV allows blood flow from the left atrium
123
C.-H. Lee et al.
to left ventricle in diastole of the cardiac cycle. During sys-tole, the MV closes to prevent blood backflow into the leftatrium accompanied by the contraction of the MV annulus,PM shortening, and loading of the MV chordae tendineae.Structurally, MV leaflets consist of the following four-layers(Kunzelman et al. 1993b; Sacks and Yoganathan 2008): theatrialis facing the atrium, the ventricularis on the ventricularside, and the inner spongiosa andfibrosa layers. Thefibrosa isthe thickest and primary load-bearing layer consistingmainlyof a dense network of type-I collagenfibers oriented along thecircumferential direction. The ventricularis and atrialis layersare composed of collagen and radially aligned elastin fibernetworks, which provides sufficient resistance to large radialstrains when the mitral valve is fully closed. The spongiosalayer contains a high concentration of hydrated glycosamino-glycans (GAGs) and proteoglycans (PGs) as the lubricant ofshear deformation between the fibrosa and ventricularis lay-ers. Each of these four layers has its distinct microstructureand mechanical properties, resulting in MV highly nonlinearand anisotropic mechanical behaviors.
In clinical practice, MV repair and replacement are twotypical options for treatingMVdiseases, such asmitral regur-gitation (MR) presumably caused by MV prolapse (Adamset al. 2010; Gillinov et al. 2008) and ischemic mitral regur-gitation (IMR) due to post-infarction ventricular remodeling(Gorman and Gorman 2006). After two decades of empha-sis on valve replacement, cardiac surgeons have graduallyturned toMV surgical repair (Shuhaiber and Anderson 2007;Vassileva et al. 2011) to treat valvular dysfunctions anddisease. Promising MV repair concepts include leaflet aug-mentation that restores leaflet mobility (Jassar et al. 2012;Kincaid et al. 2004; Robb et al. 2011), saddle-shaped annu-loplasty that reinstates normal annular shape (Jensen et al.2011; Mahmood et al. 2010), leaflet resection for repairingleaflet prolapse (Carpentier 1983; Carpentier et al. 1978), andchordal replacement for ruptured or inadequately function-ing native chordae (David et al. 1998; Frater et al. 1990).However, recent long-term studies showed an unsatisfactoryrecurrence rate of severe MR 3–5years after surgical repair(Braunberger et al. 2001; Flameng et al. 2003, 2008; Gilli-nov et al. 2008). It has been suggested that excessive tissuestress and the resulting strain-induced tissue failure are possi-ble etiological factors controlling the success of MV surgicalrepair (David et al. 2005; Schoen and Levy 2005). The result-ing surgery-induced excessive tissue stresses will then leadto changes in MV interstitial cell (MVIC) metabolism andprotein biosynthesis, which are essential in understanding themechanobiological responses at the organ, tissue, and cellu-lar levels (Dal-Bianco et al. 2009; Grande-Allen et al. 2005;Rabkin-Aikawa et al. 2004).
Basedon these observations,wehypothesized that restora-tion of MV leaflet tissue stresses in MV repair techniqueswhich most closely approximate the normal range would
ultimately lead to improved repair durability. This wouldoccur through the restoration of normal MVIC biosyntheticresponses and homeostatic state. We are now entering alevel of technical capability wherein computational mod-eling approaches become realistically applicable to betterunderstanding how heart valve tissues behave in their nativeway and how the MV functions. The pioneering anatomicsectioning and finite element (FE) simulation work by Kun-zelman et al. (1993a, 1998) and Reimink et al. (1995) haveclearly demonstrated how computational modeling can pro-vide insightful information about the effect of variationsof the MV components on the MV functioning. Einsteinet al. (Einstein et al. 2004; Kunzelman et al. 2007) fur-ther integrated this developed computational model into afluid-structure interaction framework to study early acousticsfor better understanding of MV diseases. Prot et al. (Protand Skallerud 2009; Prot et al. 2007) proposed constitutivemodels of the MV apparatus for both transversely isotropicmembrane and layer-specific nonlinear solid elements. Morerecently, FE simulations have been extensively utilized for invivo and patient-specificmodeling as well as surgical remod-eling and planning (Choi et al. 2014; Mansi et al. 2012;Stevanella et al. 2011; Votta et al. 2013;Wang and Sun 2013),by incorporating image-based patient-specific geometry, invivo dynamic boundaries, and/or physiopathological and sur-gically intervened conditions into the modeling platform.Computer simulations have also been applied to estimatingin vivo stresses of the MVAL tissue for understanding howvalvular stress variations affect MV function under healthyand diseased conditions (Krishnamurthy et al. 2008; Lee et al.2014).
Although thesemodels represent an important step towarddevelopingphysiologically realisticMVcomputationalmod-els, few in vitro or in vivo validations have been thoroughlyperformed. Moreover, organ-level computational modelingonly gives us basic information about the deformed geom-etry and overall pseudo-elastic responses. The ability toreproduce the native valve function is only the first step,and understanding why the MV is designed, in its nat-ural and functional way, is essential to provide insightsinto the MV apparatus considering normal, pathological,and optimally repaired scenarios. Therefore, a multiscale,biomechanical computational modeling framework couldthus provide a means for accomplishing this by connect-ing cellular transduction to adaptions of tissue structureand further to organ-level mechanical responses. As a fea-sible first step toward our long-term modeling goals, weaimed, in the present study, at developing an anatomicallyand microstructurally accurate MV finite element modelin conjunction with the direct use of realistic MV leaflettissue microstructure and realistic structurally driven con-stitutive model to investigate the effects of the MV leafletmicrostructure and mechanical properties on theMV closing
123
On the effects of leaflet microstructure and constitutive model on the closing behavior of the. . .
Nonlinear Fitting
Constitutive Models with Estimated Parameters(MV Leaflet & Chordae)
Predictive Nonlinear FE Simulations
High-Resolution Anatomical Images
Image Segmentation Fiber Mapping
Detailed Fiber Maps(Local Material Axes and Fiber
Splay Dispersions)
Applicable Boundary & Loading Conditions
Extensive In-Vitro Measurements
Organ-Level Geometry Tissue-Level Mechanical Behavior Microscopic Fiber Morphology
Measurements of Effective Transmural Fiber Architecture
Mechanical Testing Data
Direct Validatable Output(Deformed Geometry,
Displacement & Strain Fields)
Other Output (Stress Field and etc.) for Assessment
of the MV Functioning
FE Model(Leaflet Surface, Annulus
& Chordae Realization)
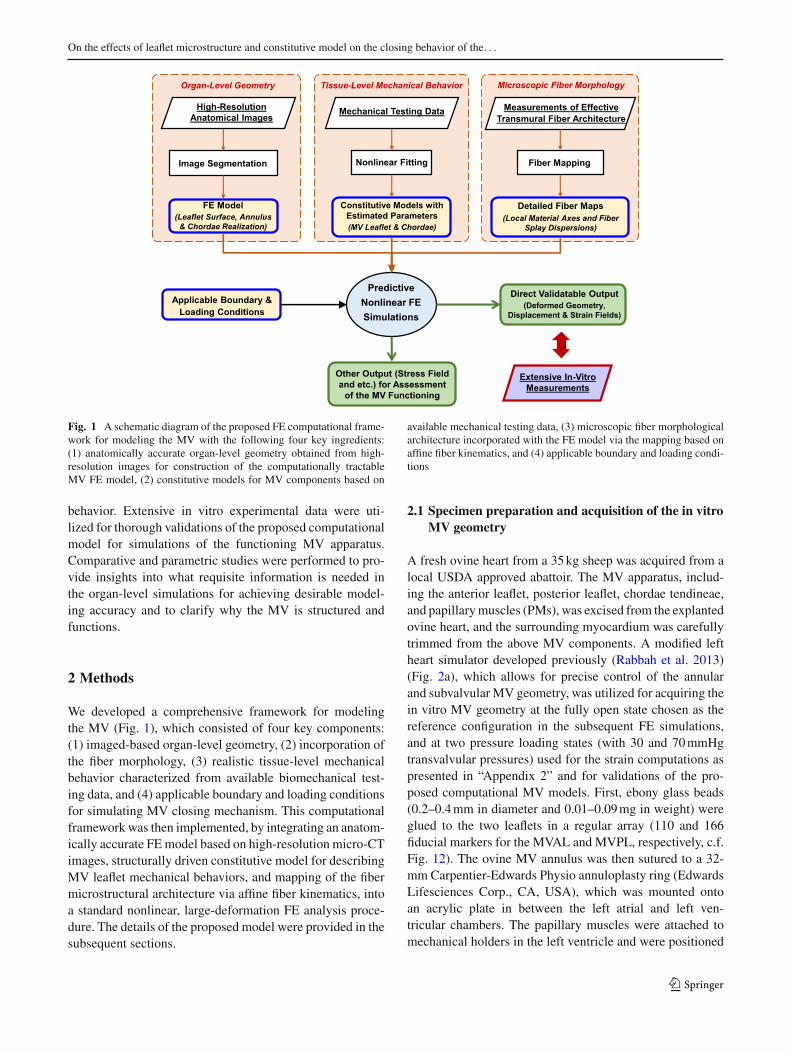
Fig. 1 A schematic diagram of the proposed FE computational frame-work for modeling the MV with the following four key ingredients:(1) anatomically accurate organ-level geometry obtained from high-resolution images for construction of the computationally tractableMV FE model, (2) constitutive models for MV components based on
available mechanical testing data, (3) microscopic fiber morphologicalarchitecture incorporated with the FE model via the mapping based onaffine fiber kinematics, and (4) applicable boundary and loading condi-tions
behavior. Extensive in vitro experimental data were uti-lized for thorough validations of the proposed computationalmodel for simulations of the functioning MV apparatus.Comparative and parametric studies were performed to pro-vide insights into what requisite information is needed inthe organ-level simulations for achieving desirable model-ing accuracy and to clarify why the MV is structured andfunctions.
2 Methods
We developed a comprehensive framework for modelingthe MV (Fig. 1), which consisted of four key components:(1) imaged-based organ-level geometry, (2) incorporation ofthe fiber morphology, (3) realistic tissue-level mechanicalbehavior characterized from available biomechanical test-ing data, and (4) applicable boundary and loading conditionsfor simulating MV closing mechanism. This computationalframework was then implemented, by integrating an anatom-ically accurate FEmodel based on high-resolution micro-CTimages, structurally driven constitutive model for describingMV leaflet mechanical behaviors, and mapping of the fibermicrostructural architecture via affine fiber kinematics, intoa standard nonlinear, large-deformation FE analysis proce-dure. The details of the proposed model were provided in thesubsequent sections.
2.1 Specimen preparation and acquisition of the in vitroMV geometry
A fresh ovine heart from a 35kg sheep was acquired from alocal USDA approved abattoir. The MV apparatus, includ-ing the anterior leaflet, posterior leaflet, chordae tendineae,and papillarymuscles (PMs), was excised from the explantedovine heart, and the surrounding myocardium was carefullytrimmed from the above MV components. A modified leftheart simulator developed previously (Rabbah et al. 2013)(Fig. 2a), which allows for precise control of the annularand subvalvular MV geometry, was utilized for acquiring thein vitro MV geometry at the fully open state chosen as thereference configuration in the subsequent FE simulations,and at two pressure loading states (with 30 and 70mmHgtransvalvular pressures) used for the strain computations aspresented in “Appendix 2” and for validations of the pro-posed computational MV models. First, ebony glass beads(0.2–0.4mm in diameter and 0.01–0.09mg in weight) wereglued to the two leaflets in a regular array (110 and 166fiducial markers for the MVAL and MVPL, respectively, c.f.Fig. 12). The ovine MV annulus was then sutured to a 32-mm Carpentier-Edwards Physio annuloplasty ring (EdwardsLifesciences Corp., CA, USA), which was mounted ontoan acrylic plate in between the left atrial and left ven-tricular chambers. The papillary muscles were attached tomechanical holders in the left ventricle and were positioned
123

C.-H. Lee et al.
Aortic Chamber
Micro-CT Scanner
Papillary Muscle Rods
Native Ovine Mitral Valve (MV)
Atrial Chamber Ventricular Chamber
Annulus Plate
(a) (b)
(c)
y-slice
MVPL-P1MVPL-P3
Papillary Muscle
Attaching Point to Leaflet
Transitional Points (with varied cross-
sectional area)
Attaching Point to Papillary Muscle Tip
z-slice
MVAL
Chordae Tendineae
Fiducial Markers
x-slice
z-slice
y-slice
Papillary Muscle Chordae
Tendineae
Anterior Leaflet (MVAL)
Annulus
Posterior Leaflet (MVPL-P3)
Posterior Leaflet (MVPL-P1)
Posterior Leaflet (MVPL-P2)
Chordae Tendineae
(d) (e)
x-slice 2.5 mm
MVAL
MVPL-P2
Ventricular Surface
Atrial Surfaces
Ventricular Surface
Median Surfaces
Fig. 2 a Modular left heart simulator for acquiring micro-CT imagesof native ovine MVs (figure modified from Rabbah et al. 2013), b3D reconstruction of the MV organ-level geometry (green) based onhigh-resolution micro-CT images with representative slices for illustra-tions of how the FE model was constructed: c atrial and ventricularMV leaflet surfaces were extracted from the 3D reconstructed MVgeometry, whereas the median leaflet surfaces (white-dashed lines)
were determined, and spatially varied thicknesses were computed forthe developed FE model; d representative landmark points, denotedby white crosses, were determined for idealization of the chordaetendineae; e the cross-sectional area associated with each chordae land-mark point as identified in c was measured based on the encompassedpixels (purple), and segmentation of the fiducial markers (in orange)was performed via a separate mask with a brighter gray-scale threshold
to ensure proper physiological MV function by achievingnormal hemodynamic conditions (120mmHg peak left ven-tricular pressure, 4.8L/min average cardiac output at a heartrate of 70 beats per minute, with 24.7mm papillary muscleseparation distance and 27.6mm distance from the acrylicplate) as previously described (Jimenez et al. 2003; Rab-bah et al. 2013). The left heart simulator was then placedin a vivaCT40 system (Scanco Medical AG, Switzerland)to acquire micro-computed tomography (micro-CT) imagesfor the above three configurations with 55keV energy andat 39μm resolution with isotropic voxels (Bouxsein et al.2010). Note that a wet sponge was placed in the ventricularchamber to maintain tissue moisture levels, and the annu-lus and papillary muscles were fixed in the left ventricularchamber during the scans. The first scan was performed atthe fully open (left ventricular diastolic) state. A subsequent
scanwas performedwith 30mmHg transvalvular air pressure(early systole). The MV leaflets were fixed under 70mmHghydrostatic pressure in 4% paraformaldehyde (PFA) for 12hbefore the last scan.
2.2 Image segmentation and development of the MVfinite element model
The stack of 3Dmicro-CT images was segmented using Sca-nIP (Simpleware Ltd., United Kingdom) to obtain anatomi-cally accurate geometry of theMVapparatus at the stress-free(Fig. 2b), 30 and 70mmHg pressure-loaded states. The atrialand ventricular leaflet surfaces were identified from the seg-mented MV geometry at each state, and a median MV leafletsurface was reconstructed in Geomagic Studio (Morrisville,NC,USA) based on these two leaflet surfaces (Fig. 2c). Local
123
On the effects of leaflet microstructure and constitutive model on the closing behavior of the. . .
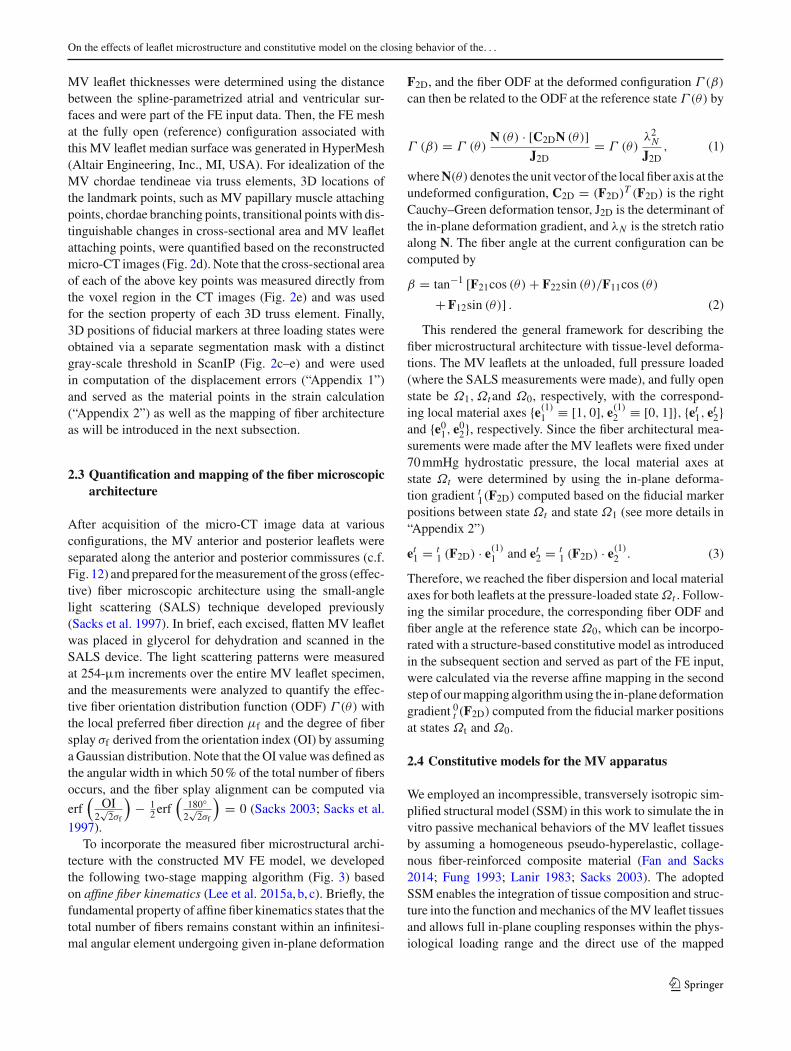
MV leaflet thicknesses were determined using the distancebetween the spline-parametrized atrial and ventricular sur-faces and were part of the FE input data. Then, the FE meshat the fully open (reference) configuration associated withthis MV leaflet median surface was generated in HyperMesh(Altair Engineering, Inc., MI, USA). For idealization of theMV chordae tendineae via truss elements, 3D locations ofthe landmark points, such as MV papillary muscle attachingpoints, chordae branching points, transitional pointswith dis-tinguishable changes in cross-sectional area and MV leafletattaching points, were quantified based on the reconstructedmicro-CT images (Fig. 2d). Note that the cross-sectional areaof each of the above key points was measured directly fromthe voxel region in the CT images (Fig. 2e) and was usedfor the section property of each 3D truss element. Finally,3D positions of fiducial markers at three loading states wereobtained via a separate segmentation mask with a distinctgray-scale threshold in ScanIP (Fig. 2c–e) and were usedin computation of the displacement errors (“Appendix 1”)and served as the material points in the strain calculation(“Appendix 2”) as well as the mapping of fiber architectureas will be introduced in the next subsection.
2.3 Quantification and mapping of the fiber microscopicarchitecture
After acquisition of the micro-CT image data at variousconfigurations, the MV anterior and posterior leaflets wereseparated along the anterior and posterior commissures (c.f.Fig. 12) and prepared for themeasurement of the gross (effec-tive) fiber microscopic architecture using the small-anglelight scattering (SALS) technique developed previously(Sacks et al. 1997). In brief, each excised, flatten MV leafletwas placed in glycerol for dehydration and scanned in theSALS device. The light scattering patterns were measuredat 254-µm increments over the entire MV leaflet specimen,and the measurements were analyzed to quantify the effec-tive fiber orientation distribution function (ODF) Γ (θ) withthe local preferred fiber direction μf and the degree of fibersplay σf derived from the orientation index (OI) by assumingaGaussian distribution. Note that the OI value was defined asthe angular width in which 50% of the total number of fibersoccurs, and the fiber splay alignment can be computed via
erf(
OI2√2σf
)− 1
2 erf(
180◦2√2σf
)= 0 (Sacks 2003; Sacks et al.
1997).To incorporate the measured fiber microstructural archi-
tecture with the constructed MV FE model, we developedthe following two-stage mapping algorithm (Fig. 3) basedon affine fiber kinematics (Lee et al. 2015a, b, c). Briefly, thefundamental property of affine fiber kinematics states that thetotal number of fibers remains constant within an infinitesi-mal angular element undergoing given in-plane deformation
F2D, and the fiber ODF at the deformed configuration Γ (β)
can then be related to the ODF at the reference state Γ (θ) by
Γ (β) = Γ (θ)N (θ) · [C2DN (θ)]
J2D= Γ (θ)
λ2N
J2D, (1)
whereN(θ)denotes the unit vector of the local fiber axis at theundeformed configuration, C2D = (F2D)T (F2D) is the rightCauchy–Green deformation tensor, J2D is the determinant ofthe in-plane deformation gradient, and λN is the stretch ratioalong N. The fiber angle at the current configuration can becomputed by
β = tan−1 [F21cos (θ) + F22sin (θ)/F11cos (θ)
+F12sin (θ)] . (2)
This rendered the general framework for describing thefiber microstructural architecture with tissue-level deforma-tions. The MV leaflets at the unloaded, full pressure loaded(where the SALS measurements were made), and fully openstate be Ω1,Ωtand Ω0, respectively, with the correspond-ing local material axes {e(1)
1 ≡ [1, 0], e(1)2 ≡ [0, 1]}, {et1, et2}
and {e01, e02}, respectively. Since the fiber architectural mea-surements were made after the MV leaflets were fixed under70mmHg hydrostatic pressure, the local material axes atstate Ωt were determined by using the in-plane deforma-tion gradient t1(F2D) computed based on the fiducial markerpositions between state Ωt and state Ω1 (see more details in“Appendix 2”)
et1 = t1 (F2D) · e(1)
1 and et2 = t1 (F2D) · e(1)
2 . (3)
Therefore, we reached the fiber dispersion and local materialaxes for both leaflets at the pressure-loaded stateΩt . Follow-ing the similar procedure, the corresponding fiber ODF andfiber angle at the reference state Ω0, which can be incorpo-rated with a structure-based constitutive model as introducedin the subsequent section and served as part of the FE input,were calculated via the reverse affine mapping in the secondstep of ourmapping algorithmusing the in-plane deformationgradient 0t (F2D) computed from the fiducial marker positionsat states Ωt and Ω0.
2.4 Constitutive models for the MV apparatus
We employed an incompressible, transversely isotropic sim-plified structural model (SSM) in this work to simulate the invitro passive mechanical behaviors of the MV leaflet tissuesby assuming a homogeneous pseudo-hyperelastic, collage-nous fiber-reinforced composite material (Fan and Sacks2014; Fung 1993; Lanir 1983; Sacks 2003). The adoptedSSM enables the integration of tissue composition and struc-ture into the function andmechanics of theMV leaflet tissuesand allows full in-plane coupling responses within the phys-iological loading range and the direct use of the mapped
123

C.-H. Lee et al.
NOI(%)
70
60
50
40
30
20
(less aligned)
(well aligned)
y'
x'
y
z
(F )1t
2D
Flatten MVAL Specimen for fiber microstructural measurements at the unloaded state Ω1
(F )t0
2D
MVAL at the pressure loaded configuration Ωt
MVAL at the fully open (reference) configuration Ω0
x
Fig. 3 A schematic diagram of the proposed technique for mappingthe collagen fiber architecture onto the 3D FE mesh (MVAL as an illus-tration). Fiber splay microstructural morphology was measured via theSALS technique for the flatten MV leaflet tissues at the unloaded stateΩ1, showing both the preferred fiber directions and strengths of fibersplay alignment. The measured fiber architecture was first mapped ontothe generated MVAL FE mesh at the pressure-loaded state Ωt via the
mapping based on affine fiber kinematics and using the deformationgradient t1(F2D) computed from the fiducial marker positions betweenstates Ω1 and Ωt . The corresponding fiber microstructural architecturewas then transformed onto the MVAL FE mesh at the reference stateΩ0 using 0
t (F2D) to obtain element local material axes and the degreeof fiber splay for the simplified structural constitutive model
fiber microstructural architecture. In brief, the MV leaflettissues are assumed to consist of two major load-bearingcomponents, a ground matrix material with non-fibrous sub-stances andwater and an effective fibrousmaterialmodel thathomogenized the elastin and type-I collagen fibers. The cor-responding total strain-energy function (SEF)Ψ is expressedas
Ψ leaflet = Ψens + Ψm =∫ π/2
−π/2Γ (θ) Ψf [Ef (θ)] dθ
+ μm
2(I1 − 3) + p (J − 1) , (4)
where Ψm is the SEF associated with the matrix compo-nent using a neo-Hookean material with a neo-Hookeanconstant μm responsible for the low-strain response andthe incompressibility of the planar tissues, Ψens is the SEFassociated with the effective fiber networks as the sum ofthe SEF of each individual fiber Ψf , Γ (θ) is the orienta-tion distribution function (ODF) of the fiber ensembles,Ef(θ) = NT (θ)EN(θ) is the effective fiber strain, N(θ) =[cos(θ), sin(θ), 0]T ,E = (C − I)/2 is the Green–Lagrangestrain tensor, C = FTF is the right Cauchy–Green defor-mation tensor, F is the deformation gradient tensor, I is theidentity tensor, I1 = trace(C), J = det(F), and p is the
Lagrange multiplier to enforce the incompressibility of theplanar tissues. Based on the pseudo-hyperelastic formation(Fung 1993), the second Piola–Kirchhoff stress tensor Sleaflet
can be derived by
Sleaflet = ∂Ψ leaflet
∂E=
∫ π/2
−π/2Γ (θ) Sf [Ef (θ)]N (θ)⊗N (θ) dθ
+μm
(I − C33C−1
). (5)
Here, C33 = 1/(C11C22 − C212) is the consequence of the
incompressibility condition, p = −μmC33 is derived fromthe plane-stress condition (Sleaflet33 = 0), and ⊗ denotes thedyadic tensor product. In this work, we adopted an exponen-tial model with a terminal stiffness for the highly nonlinearfiber stress–strain behavior (Fan and Sacks 2014)
Sf (Ef) =⎧⎨⎩c0
[exp (c1Ef) − 1
]for Ef ≤ Eub
c0[exp (c1Eub) − 1
] + c0c1exp (c1Eub)
(Ef − Eub) for Ef > Eub
. (6)
Herein, Sf is the fiber stress, c0 and c1 are material constants,and Eub is the cutoff fiber strain above which a linear fibertangent modulus is considered. The effective fiber ODF wasexpressed by a Gaussian distribution function:
123
On the effects of leaflet microstructure and constitutive model on the closing behavior of the. . .
Γ (θ) =exp
[− (θ−μ)2
2σ 2
]
erf(
π
2√2σ
)√2πσ
, (7)
where θ ∈ [−π/2,+π/2], and ∫ π/2−π/2 Γ (θ) dθ = 1. The
Cauchy stress tensor can then be obtained by the push-forward operation σ leaflet = FSleafletFT .
For modeling the MV chordae tendineae, we adopted anincompressible, isotropic hyperelastic material with the fol-lowing stress–strain relationship
Schordae= ∂Ψ chordae
∂E11=C10
[exp (C01E11)−1
], E11>0,
(8)
where E11 = 12 (F
211 − 1) is the uniaxial strain of the chordae
tendineae, and C10 and C01 are the material constants.
2.5 Parameter estimation based on an inverse modelingapproach
For characterization of the planar mechanical behavior of theovine MV leaflet tissues, we employed load-controlled biax-ial testing protocols previously developed (Grashow et al.2006). In brief, square central regions (20mm × 20mm) ofovineMV anterior and posterior leaflets were dissected, sub-merged in isotonic saline, and then connected to the biaxialtesting equipment with the tissue preferred fiber (circum-ferential, C) and cross-preferred fiber (radial, R) directionsapproximated aligned with the device axes. The stress andstrain behaviors in the two directions under equi-biaxial load-ing were recorded and used for the following parameterestimation. Note that the shear strains in this study were neg-ligible.
To estimate the model parameters associated with thesimplified structural model, we adopted an inverse model-ing approach based on the nonlinear fit of the stress–straincurves between the simulated results and the biaxial testingdata. Briefly, the SSM was first implemented in FE softwareABAQUS (SIMULIA, Dassault Systèmes, Providence, RI,USA) via the user-defined material subroutine (c.f. detailsin Fan and Sacks 2014). The equi-biaxial loading protocolwas then model, and the simulated stress–strain behaviors inboth circumferential and radial directions were compared tothe experimental data for characterizing thematerial parame-ters by iteratively minimizing the errors of the stress–straincurves between the simulation results and experimental data.Similarly, the uniaxial stress–strain behavior of the chordaetendineaewas simulated by three-dimensional truss elements(T3D2). Prescribed force and fixed boundary condition wereapplied on the opposite ends of the truss element, respec-tively. The simulated stress–strain curves of both the basaland marginal chordae were compared to available uniaxial
testing data (Ritchie et al. 2006), and parameters C10 and C01
were then characterized.
2.6 Finite element simulations of the MV closingbehavior
We first assumed that the interaction between blood flow andthe MV apparatus is idealized by transvalvular surface pres-sure loads acting on the MV leaflets, and the effect of the leftventricular contraction on theMVmechanics is mimicked byprescribed boundary motions of the MV annulus and PMs.Alterations of the MV stress and strain fields in responseto external loading were of the interest in the current study,and simulations ofMV closurewere performed inABAQUS.Nodal displacements and rotations, and elemental strain andstress fieldswere the primary output from the simulations andwere post-processed via a Python script to compute the pre-dicted fiducial marker 3D positions as well as the in-surfacemaximum and minimum principal stretches compared withthe in vitro data at 30 and 70mmHg transvalvular pressures.More details about the computations of the displacementerrors evaluated at the fiducial marker positions and the in-surface principal strains of the central leaflet regions (Fig. 12)based on the in vitromeasurementswere provided in “Appen-dices 1 and 2”. The following FE modeling specificationswere considered:
1. Explicit dynamics was utilized as a more general compu-tational framework for future extensions, such as in vivomodeling and surgical simulations. Proper mass scaling(dt = 1 × 10⁻⁶) of the inertial effects was employed tosimulate the quasi-static behavior associated with the invitro experimental condition.
2. Shell (S4) and 3D uniaxial truss (T3D2) elements wereused for the MV leaflets and chordae, respectively.
3. Spatially varied, element-based thicknesses determinedfrom anatomically accurate micro-CT images were sup-plied as part of input using DISTRIBUTION TABLE(length).
4. Element-based local material coordinate obtained fromthe mapped preferred fiber directions was defined usingORIENTATION feature along with DISTRIBUTIONTABLE (coor3d).
5. User-defined subroutine VUSDFLD was adopted tospecify element-based fiber splay dispersion σ .
6. Constitutive models of the MV apparatus were imple-mented in user-defined subroutine VUMAT.
7. AMPLITUDE feature in conjunctionwithDSLOADwasused to prescribe the transvalvular pressure loading.
8. Although clamped boundary conditions were consid-ered in the in vitro experiments, subroutine VDISPwas implemented for prescribing displacement bound-ary conditions of the MV annulus and PM tips.
123

C.-H. Lee et al.
(a) (b)
0 0.05 0.1 0.15 0.2 0.25 0.3 0.350
50
100
150
200
250
Eens
Sen
s)a
Pk( Increasing Curvature
Current Model
MVAL
MVPL
(c)
0 0.3 0.60
50
100
150
200
250
Eens
Sen
s)a
Pk( Increasing c1
Current Model
Fig. 4 Two conducted parametric studies: a considering the variationin the curvature of the ensemble fiber stress–strain relationship andb considering the variation in parameter c1. c An illustrative diagram
of the MV leaflet surfaces and the cut-view used for comparing thedeformed profiles in the above parameter studies
9. General self-contact algorithm was adopted for handlingthe coaptation and interactions of the MV leaflets duringMV closing process, and a separate element set consist-ing of all leaflet elements is defined for treating bothleaflets as a contiguous entity and their faces toward theleft atrium as potential contacting surfaces. A surfaceinteraction/behavior with a sliding-friction coefficient of0 (frictionless) and a linear pressure–overclosure coeffi-cient of 0.5.
2.7 Comparative and parametric studies
In addition to thorough validations with extensive in vitrodata,we further investigated the effect of theMV leaflet struc-tural properties on thenumerically predicted closingbehaviorof the MV through simulations of the following four pertur-bations with an increasing level of modeling fidelity: levelI—an exponential-type isotropic material (σ = 180◦), levelII—a transversely isotropic material with uniformly curvi-linear fiber directions1 and identical fiber dispersions, level
1 A convective curvilinear cylindrical coordinate was adopted todescribe the contiguous MV leaflet entity, and fiber directions wereassumed to be all uniformly aligned with the circumferential directionin this coordinate system for the case associated with uniformly curvi-linear fiber directions.
III—a transversely isotropic material with uniformly curvi-linear fiber directions and mapped fiber dispersions basedon Eq. (1), and level IV—a transversely isotropic materialwith mapped fiber directions and mapped fiber dispersionsbased on the proposed mapping algorithms. Comparisons ofthe numerically predicted displacements and in-plane princi-pal stretches were made among these four cases to examinewhether a higher model fidelity yielded more accurate solu-tions. Moreover, we conducted a series of parametric studieson how the micromechanical ensemble fiber stress–strainbehavior (Fig. 4a, b) affects the predicted MV deformations(Fig. 4c), vonMises stress field, and the deformed fiber archi-tecture (represented by NOI values) subject to transvalvularpressure loading up to 100mmHg.
3 Results
3.1 FE model information
The final FE model, constructed in this study for the nativeovine MV was composed of 6836 nodes (6720 nodes corre-sponding to the MV leaflets, 192 nodes representing the MVannulus, and 16, 39, 48, and 13 nodes associated with thechordae branching points, chordae transitional points, leaflet
123
On the effects of leaflet microstructure and constitutive model on the closing behavior of the. . .
MVAL
MVPL
(a)
(b)
Leaflet Thickness (mm)
0.45 0.8 1.2 1.6 1.9
Chordae Tendineae
Nodes of 3D Truss Elements for the Chordae Tendineae3D Truss Elements for the Chordae Tendineae
Shell Elements for the MVAL and MVPL
Annulus
MVALMVAL
MVPL
Papillary Muscle Tips
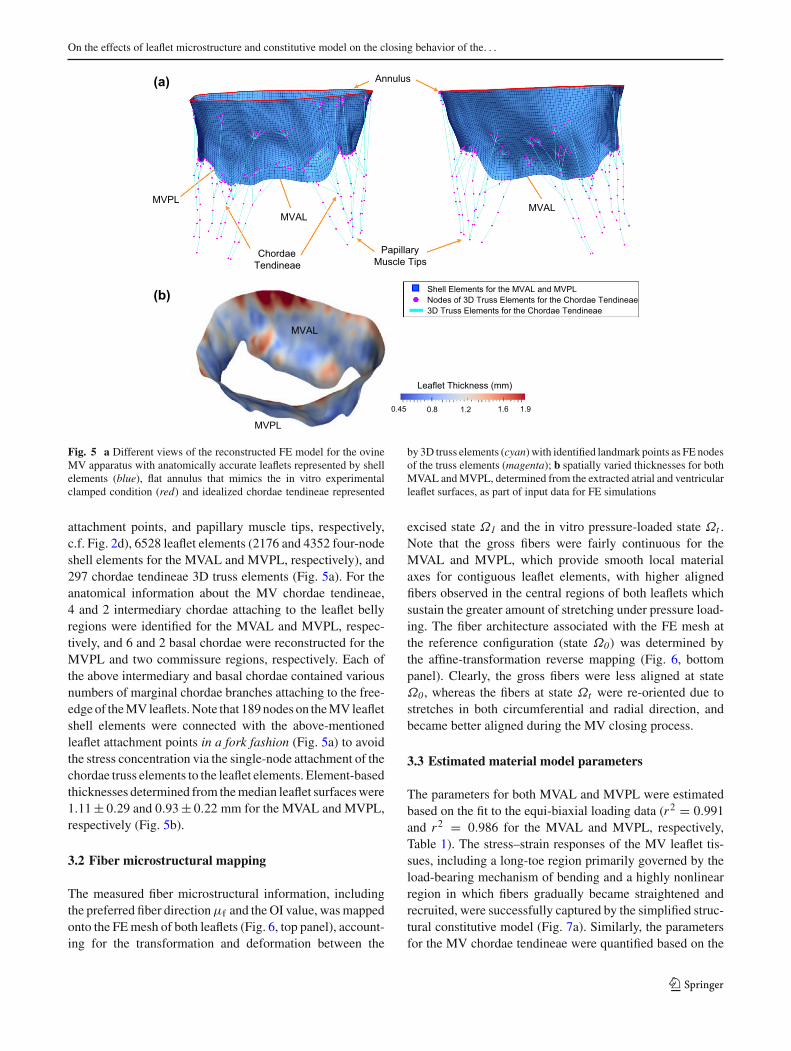
Fig. 5 a Different views of the reconstructed FE model for the ovineMV apparatus with anatomically accurate leaflets represented by shellelements (blue), flat annulus that mimics the in vitro experimentalclamped condition (red) and idealized chordae tendineae represented
by 3D truss elements (cyan) with identified landmark points as FE nodesof the truss elements (magenta); b spatially varied thicknesses for bothMVAL andMVPL, determined from the extracted atrial and ventricularleaflet surfaces, as part of input data for FE simulations
attachment points, and papillary muscle tips, respectively,c.f. Fig. 2d), 6528 leaflet elements (2176 and 4352 four-nodeshell elements for the MVAL and MVPL, respectively), and297 chordae tendineae 3D truss elements (Fig. 5a). For theanatomical information about the MV chordae tendineae,4 and 2 intermediary chordae attaching to the leaflet bellyregions were identified for the MVAL and MVPL, respec-tively, and 6 and 2 basal chordae were reconstructed for theMVPL and two commissure regions, respectively. Each ofthe above intermediary and basal chordae contained variousnumbers of marginal chordae branches attaching to the free-edgeof theMVleaflets.Note that 189nodes on theMVleafletshell elements were connected with the above-mentionedleaflet attachment points in a fork fashion (Fig. 5a) to avoidthe stress concentration via the single-node attachment of thechordae truss elements to the leaflet elements. Element-basedthicknesses determined from themedian leaflet surfaceswere1.11± 0.29 and 0.93± 0.22 mm for the MVAL and MVPL,respectively (Fig. 5b).
3.2 Fiber microstructural mapping
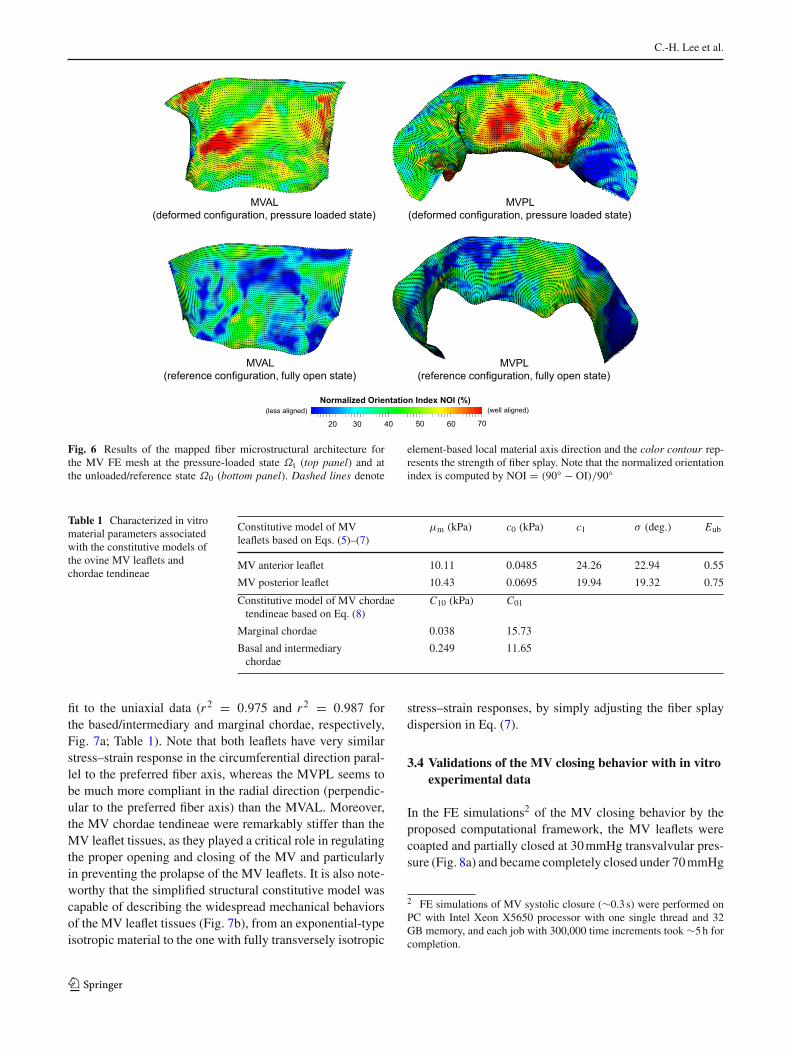
The measured fiber microstructural information, includingthe preferred fiber directionμf and the OI value, wasmappedonto the FEmesh of both leaflets (Fig. 6, top panel), account-ing for the transformation and deformation between the
excised state Ω1 and the in vitro pressure-loaded state Ωt .Note that the gross fibers were fairly continuous for theMVAL and MVPL, which provide smooth local materialaxes for contiguous leaflet elements, with higher alignedfibers observed in the central regions of both leaflets whichsustain the greater amount of stretching under pressure load-ing. The fiber architecture associated with the FE mesh atthe reference configuration (state Ω0) was determined bythe affine-transformation reverse mapping (Fig. 6, bottompanel). Clearly, the gross fibers were less aligned at stateΩ0, whereas the fibers at state Ωt were re-oriented due tostretches in both circumferential and radial direction, andbecame better aligned during the MV closing process.
3.3 Estimated material model parameters
The parameters for both MVAL and MVPL were estimatedbased on the fit to the equi-biaxial loading data (r2 = 0.991and r2 = 0.986 for the MVAL and MVPL, respectively,Table 1). The stress–strain responses of the MV leaflet tis-sues, including a long-toe region primarily governed by theload-bearing mechanism of bending and a highly nonlinearregion in which fibers gradually became straightened andrecruited, were successfully captured by the simplified struc-tural constitutive model (Fig. 7a). Similarly, the parametersfor the MV chordae tendineae were quantified based on the
123
C.-H. Lee et al.
MVAL (deformed configuration, pressure loaded state)
Normalized Orientation Index NOI (%)
706050403020
(less aligned) (well aligned)
MVAL (reference configuration, fully open state)
MVPL (reference configuration, fully open state)
MVPL (deformed configuration, pressure loaded state)
Fig. 6 Results of the mapped fiber microstructural architecture forthe MV FE mesh at the pressure-loaded state Ωt (top panel) and atthe unloaded/reference state Ω0 (bottom panel). Dashed lines denote
element-based local material axis direction and the color contour rep-resents the strength of fiber splay. Note that the normalized orientationindex is computed by NOI = (90◦ − OI)/90◦
Table 1 Characterized in vitromaterial parameters associatedwith the constitutive models ofthe ovine MV leaflets andchordae tendineae
Constitutive model of MVleaflets based on Eqs. (5)–(7)
μm (kPa) c0 (kPa) c1 σ (deg.) Eub
MV anterior leaflet 10.11 0.0485 24.26 22.94 0.55
MV posterior leaflet 10.43 0.0695 19.94 19.32 0.75
Constitutive model of MV chordaetendineae based on Eq. (8)
C10 (kPa) C01
Marginal chordae 0.038 15.73
Basal and intermediarychordae
0.249 11.65
fit to the uniaxial data (r2 = 0.975 and r2 = 0.987 forthe based/intermediary and marginal chordae, respectively,Fig. 7a; Table 1). Note that both leaflets have very similarstress–strain response in the circumferential direction paral-lel to the preferred fiber axis, whereas the MVPL seems tobe much more compliant in the radial direction (perpendic-ular to the preferred fiber axis) than the MVAL. Moreover,the MV chordae tendineae were remarkably stiffer than theMV leaflet tissues, as they played a critical role in regulatingthe proper opening and closing of the MV and particularlyin preventing the prolapse of the MV leaflets. It is also note-worthy that the simplified structural constitutive model wascapable of describing the widespread mechanical behaviorsof the MV leaflet tissues (Fig. 7b), from an exponential-typeisotropic material to the one with fully transversely isotropic
stress–strain responses, by simply adjusting the fiber splaydispersion in Eq. (7).
3.4 Validations of the MV closing behavior with in vitroexperimental data
In the FE simulations2 of the MV closing behavior by theproposed computational framework, the MV leaflets werecoapted and partially closed at 30mmHg transvalvular pres-sure (Fig. 8a) and became completely closed under 70mmHg
2 FE simulations of MV systolic closure (∼0.3 s) were performed onPC with Intel Xeon X5650 processor with one single thread and 32GB memory, and each job with 300,000 time increments took ∼5h forcompletion.
123

On the effects of leaflet microstructure and constitutive model on the closing behavior of the. . .
1.0 1.1 1.2 1.3 1.4 1.50
25
50
75
100
125
800
900
1000
MVAL(Circ.)
MVPL(Circ.)
MVAL(Rad.)
MVPL(Rad.)
Basal Chordae
Marginal Chordae
2nd)aPk( sser tS
KP
Stretch1 1.1 1.2 1.3 1.4 1.5 1.6 1.7
0
50
100
150
200
250
Stretch
IsotropicFully Transversely
Isotropic
Circ. Rad.
2nd)aPk( ssert S
K P
(a) (b)
Fig. 7 aComparisons of the fitting results and tissue-level mechanicaltesting data of the MV components: equi-biaxial loading data and fittedstress–strain curves in both the circumferential and radial directions fortheMV anterior leaflet (r2 = 0.992) and posterior leaflet (r2 = 0.986),and uniaxial loading data and fitted stress–strain curves for the basal
chordae (r2 = 0.975) and the marginal chordae (r2 = 0.987); b illus-tration of the fiber splay dispersion effect on the stress–strain curves,showing the capability of the adopted simplified structural constitutivemodel for describing wide-spectrum mechanical behaviors of the MVleaflet tissues by adjusting parameter σ
MVALMVPL
(a)
MVPL
MVAL
MVPL
MVAL
MVALMVPL
(b)
Fig. 8 Comparisons of the predicted deformed median surfaces (red)and the micro-CT reconstructed leaflet geometries (green) with fiducialmarkers (yellow): aMV loaded at 30mmHg transvalvular pressure and
b MV at 70mmHg transvalvular pressure (left 3D deformed surfaceand geometry; right cross-sectional cut-view of the deformed surfaceand geometry)
transvalvular pressure (Fig. 8b) with all chordae tendineaebeing straightened, demonstrating proper functioning of theMV apparatus. The predicted MV deformed median sur-faces at these two pressures levels agreed well with themicro-CT reconstructed MV leaflet geometries. For quan-titative assessment of the modeling accuracy, we computedthe displacements errors evaluated at 266 fiducial marker
locations between the numerical predictions and in vitroexperimental measurements, and the results were reported asfollows: 0.10± 0.05 and 0.19± 0.06mm for the MVAL andMVPL, respectively, at 30mmHg transvalvular pressure and0.13± 0.09 and 0.26± 0.09mm for the MVAL and MVPL,respectively, at 70mmHg transvalvular pressure (Table 2).Moreover, the in-surface principal strains obtained by the FE
123

C.-H. Lee et al.
Table 2 Comparisons of thedisplacement errors evaluated atthe fiducial marker positions ofthe MV leaflets for FEnumerical predictions withvarious levels of model fidelity
MVAL MVPL
Mean ± SD (mm) Max/Min (mm) Mean ± SD (mm) Max/Min (mm)
30mmHg transvalvular pressure
FE predictions—Level I 0.368 ± 0.174 0.774/0.014 0.325 ± 0.175 0.867/0.076
FE predictions—Level II 0.208 ± 0.117 0.591/0.012 0.277 ± 0.103 0.564/0.072
FE predictions—Level III 0.117 ± 0.081 0.342/0.012 0.231 ± 0.083 0.454/0.067
FE predictions—Level IV 0.096 ± 0.049 0.258/0.005 0.194 ± 0.061 0.405/0.078
70mmHg transvalvular pressure
FE predictions—Level I 0.531 ± 0.257 0.931/0.019 0.516 ± 0.302 1.197/0.093
FE predictions—Level II 0.337 ± 0.179 0.708/0.016 0.413 ± 0.199 0.907/0.082
FE predictions—Level III 0.183 ± 0.131 0.563/0.013 0.299 ± 0.112 0.609/0.081
FE predictions—Level IV 0.128 ± 0.085 0.425/0.007 0.257 ± 0.089 0.475/0.061
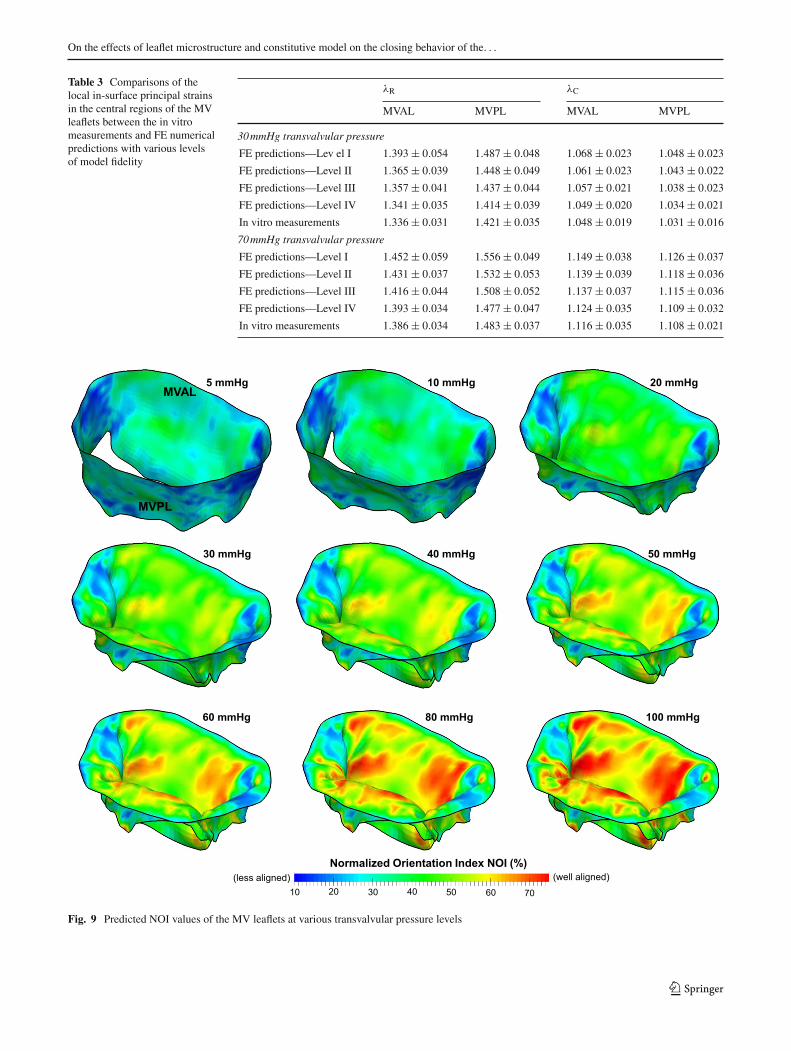
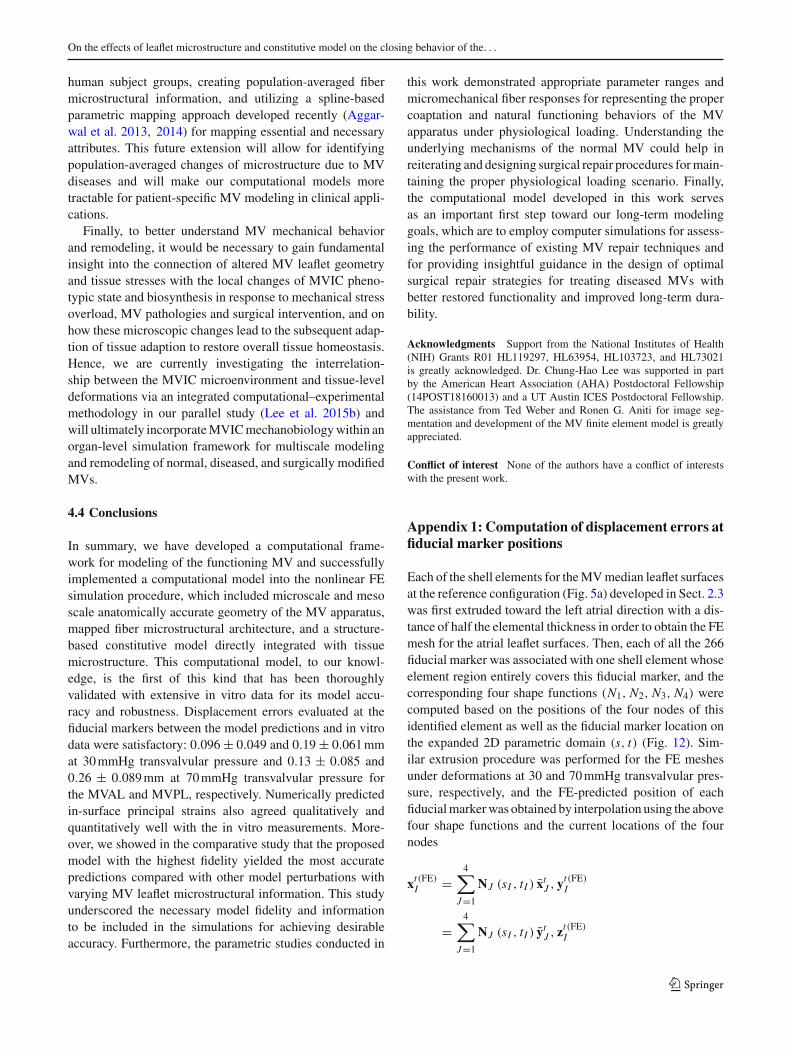
simulations using the simplified structural constitutivemodeland the proposed fiber mapping technique were also in fairlygood agreement with the in-vitro strains computed from thefiducial markers between the reference configuration andtwo different deformed configurations (Table 3; Appendix3). In addition to the above in vitro validations, we furtherinvestigated how the fiber architecture of the MV leafletschanges in response to external pressure loading, in termsof the NOI values in the deformed configurations (Fig. 9).Note that the gross fibers became much better aligned inthe central regions of both MVAL and MVPL, which under-went relatively larger deformations (Figs. 13, 14). Theseresults provides us better insight into important micromech-anisms, such as fiber straightening and re-alignment, withinMV leaflets for maintaining proper functioning of the MVapparatus under physiological loading.
3.5 Sensitivity analysis of the model fidelity: MV leafletmicrostructural information
We evaluated the effect of leaflet microstructural informationon the predicted MV closure behavior by considering fourperturbed models with increasing levels of model fidelity(Tables 2, 3, “Appendix 3”). First, the exponential-typeisotropic material model (level I) was able to capture thehighly nonlinear leaflet stress–strain response and yielded areasonable deformed geometry with displacement errors of0.53± 0.26 and 0.52± 0.31mm for the MVAL and MVPL,respectively, at 70mmHg transvalvular pressure. However,much larger errors (0.93 and 1.19mm for the MVAL andMVPL, respectively) were found particularly in the coap-tation region of the MV due to the model’s inadequacy indescribing the distinct anisotropic response. Second, switch-ing from the above material to a transversely isotropicmaterial with uniformly curvilinear fiber directions (levelII) reduced the displacement errors at 70mmHg transvalvu-lar pressure by ∼36 and ∼15% for the MVAL and MVPL,
respectively; noticeably less accurate prediction of the leafletcoaptationwas still found in this study case. Third, by assign-ing fiber splay dispersion parameter σ based on the fibermapping results (level III), the prediction errors were sig-nificantly decreased by ∼44 and ∼28% for the MVAL andMVPL, respectively, compared to level II study case. Finally,additional improvement of the accuracy was achieved byusing both themapped fiber directions as element-based localmaterial axes and fiber splay dispersions in level IV studycase. Comparisons of the principal stretches were also madebetween the four study cases and the in vitro experimentaldata (Fig. 10a, b; Table 3), and, as expected, more accuratepredictions were observed with an increasing level of modelfidelity.
3.6 Effects of local ensemble fiber mechanical behavioron the MV closure
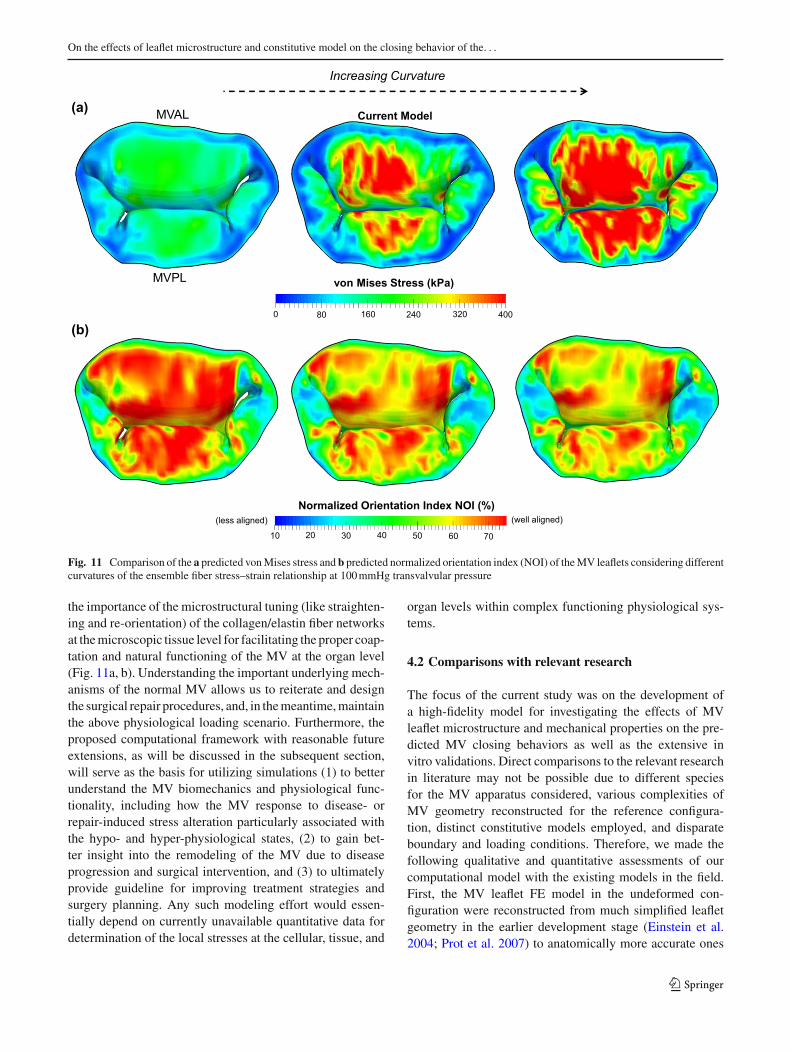
We found that increasing curvature of the microscopic fiberstress–strain relationship led to earlier contact interactionand coaptation of both anterior and posterior leaflets at lowertransvalvular pressure loading which corresponds to the lowstress–strain region primarily governed by material parame-terμm, and less leaflet deformation toward the atrial chamberat higher pressure loading which is predominantly influ-enced by the progressive engagement of the straightening ofcollagen and elastin fiber networks (Fig. 10c). This findingunderscores the importance of adopting a microstructurallyinformed constitutive model, which is able to capture boththe long-toe region and the rapid growth region in materialnonlinearity of the MV leaflet tissue’s overall stress–strainbehavior, for simulating physiological deformed profiles ofthe functioning MV. The predicted von Mises stress fieldand the NOI values at 100mmHg transvalvular pressuredwere compared among these models (Figs. 11, 12), andthe results showed that a linear ensemble fiber stress–strainmodel (red in Fig. 4a) yielded lower tissue stresses and bet-
123
On the effects of leaflet microstructure and constitutive model on the closing behavior of the. . .
Table 3 Comparisons of thelocal in-surface principal strainsin the central regions of the MVleaflets between the in vitromeasurements and FE numericalpredictions with various levelsof model fidelity
λR λC
MVAL MVPL MVAL MVPL
30mmHg transvalvular pressure
FE predictions—Lev el I 1.393 ± 0.054 1.487 ± 0.048 1.068 ± 0.023 1.048 ± 0.023
FE predictions—Level II 1.365 ± 0.039 1.448 ± 0.049 1.061 ± 0.023 1.043 ± 0.022
FE predictions—Level III 1.357 ± 0.041 1.437 ± 0.044 1.057 ± 0.021 1.038 ± 0.023
FE predictions—Level IV 1.341 ± 0.035 1.414 ± 0.039 1.049 ± 0.020 1.034 ± 0.021
In vitro measurements 1.336 ± 0.031 1.421 ± 0.035 1.048 ± 0.019 1.031 ± 0.016
70mmHg transvalvular pressure
FE predictions—Level I 1.452 ± 0.059 1.556 ± 0.049 1.149 ± 0.038 1.126 ± 0.037
FE predictions—Level II 1.431 ± 0.037 1.532 ± 0.053 1.139 ± 0.039 1.118 ± 0.036
FE predictions—Level III 1.416 ± 0.044 1.508 ± 0.052 1.137 ± 0.037 1.115 ± 0.036
FE predictions—Level IV 1.393 ± 0.034 1.477 ± 0.047 1.124 ± 0.035 1.109 ± 0.032
In vitro measurements 1.386 ± 0.034 1.483 ± 0.037 1.116 ± 0.035 1.108 ± 0.021
Normalized Orientation Index NOI (%)
706050403020(less aligned) (well aligned)
10
5 mmHg 10 mmHg 20 mmHg
30 mmHg 40 mmHg 50 mmHg
60 mmHg 80 mmHg 100 mmHg
MVAL
MVPL
Fig. 9 Predicted NOI values of the MV leaflets at various transvalvular pressure levels
123

C.-H. Lee et al.
(a) (b)
MVPL MVAL
Increasing Curvature
Current Model
(c) (d)
MVPL MVAL
Increasing c1Current Model
λ R
MVAL MVPL
Level I II III IV Exp.1.0
1.1
1.2
1.3
1.4
1.5
1.6
Level I II III IV Exp.
MVAL MVPL
λ C
1.0
1.05
1.1
1.15
1.2
Level I II III IV Exp. Level I II III IV Exp.
Fig. 10 Comparison of the principal stretches of the MV leaflets at70mmHg transvalvular pressure between the in vitromeasurements andthe FE predictions with various levels of model fidelity: a radial stretchand b circumferential stretch. Cross-sectional cut-views showing the
comparisons of the predicted deformed leaflet surfaces at 100mmHgtransvalvular pressure in the two parameter studies: c considering thevariation in the curvature of the ensemble fiber stress–strain relation-ship, and d considering the variation in parameter c1
ter aligned fibers typically in the central regions of bothleaflets compared to the current model (blue in Fig. 4a)and a fiber stress–strain model with much larger curvature(green inFig. 4a), suggesting an important balancingbetweenmicroscopic straightening and re-alignment of collagen fibernetwork and the overall tissue-level stresses for maintain-ing proper functioning of the MV apparatus. Moreover, thechange in parameter c1 had a pronounced effect on the pre-dicted MV deformation (Fig. 10d), which highlights theessential role that the microscopic fiber mechanical proper-ties plays in theMV closing behavior as well as in preservingthe realistic deformed geometry of the MV leaflets.
4 Discussion
4.1 Overall findings and implications
In this study, we developed a FE computational modelfor analyses of the MV closure, which comprised of ananatomically accurate organ-level geometry reconstructedfrom high-resolution micro-CT images, the incorporation ofthe measured microscopic fiber morphology, and a realisticstructure-based constitutive model for direct employment ofthe fiber orientation and fiber splay dispersion. The proposedcomputational model addressed some of the challenges in thestate-of-the-art MV modeling field (Choi et al. 2014; Mansiet al. 2012; Stevanella et al. 2011; Votta et al. 2013; Wang
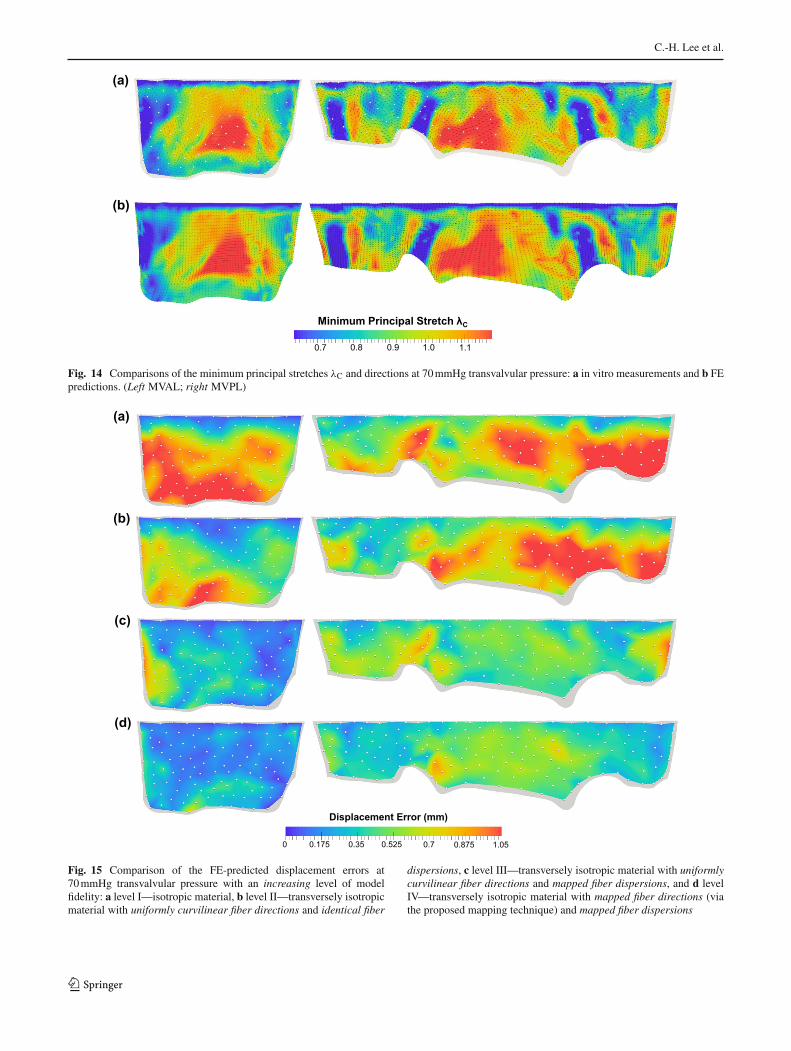
andSun2013)with our substantial improvements, such as thecapability of reconstructing all the main components of theMV apparatus, a more detailed and precise description of theMV leaflet thicknesses, a better idealization of the chordaetendineae structures with realistic key points and cross sec-tion areas identified and the detailed mapping of actual fibermicrostructure. One of the main contributions in the presentwork was the acquisition of extensive in vitro experimentaldata for thorough and rigorous validations of the accuracy ofour models, and, in the meantime, the sample integrity wascarefully maintained throughout the entire model develop-ment process, including micro-CT imaging, measurementsof fiber microstructural architecture, and mechanical testingfor the same ovine mitral valve specimen. In addition, wedemonstrated in the sensitivity study that a computationalmodel with the highest model fidelity yielded more accu-rate predictions in the displacement field (Fig. 15) as wellas in the strain field (Fig. 10a, b) during systolic closure.These results underscored the necessary information to beincluded in the computational model for achieving desir-able accuracy and provide guidance in clinical practice bycompromising betweenmodel simplification (efficiency) andsimulation accuracy.
More importantly, for the first time, we investigated theinterrelationship between the local fiber ensemble mechan-ical behavior (Fig. 4a, b) and the MV closing behavior(Fig. 10c, d) via computer simulations. These novel resultsindicated not only the appropriate parameter ranges but also
123
On the effects of leaflet microstructure and constitutive model on the closing behavior of the. . .
von Mises Stress (kPa)
400320240160800
MVAL
MVPL
Increasing Curvature
Current Model
Normalized Orientation Index NOI (%)
706050403020
(less aligned) (well aligned)
10
(a)
(b)
Fig. 11 Comparison of the a predicted vonMises stress and b predicted normalized orientation index (NOI) of theMV leaflets considering differentcurvatures of the ensemble fiber stress–strain relationship at 100mmHg transvalvular pressure
the importance of the microstructural tuning (like straighten-ing and re-orientation) of the collagen/elastin fiber networksat themicroscopic tissue level for facilitating the proper coap-tation and natural functioning of the MV at the organ level(Fig. 11a, b). Understanding the important underlying mech-anisms of the normal MV allows us to reiterate and designthe surgical repair procedures, and, in themeantime,maintainthe above physiological loading scenario. Furthermore, theproposed computational framework with reasonable futureextensions, as will be discussed in the subsequent section,will serve as the basis for utilizing simulations (1) to betterunderstand the MV biomechanics and physiological func-tionality, including how the MV response to disease- orrepair-induced stress alteration particularly associated withthe hypo- and hyper-physiological states, (2) to gain bet-ter insight into the remodeling of the MV due to diseaseprogression and surgical intervention, and (3) to ultimatelyprovide guideline for improving treatment strategies andsurgery planning. Any such modeling effort would essen-tially depend on currently unavailable quantitative data fordetermination of the local stresses at the cellular, tissue, and
organ levels within complex functioning physiological sys-tems.
4.2 Comparisons with relevant research
The focus of the current study was on the development ofa high-fidelity model for investigating the effects of MVleaflet microstructure and mechanical properties on the pre-dicted MV closing behaviors as well as the extensive invitro validations. Direct comparisons to the relevant researchin literature may not be possible due to different speciesfor the MV apparatus considered, various complexities ofMV geometry reconstructed for the reference configura-tion, distinct constitutive models employed, and disparateboundary and loading conditions. Therefore, we made thefollowing qualitative and quantitative assessments of ourcomputational model with the existing models in the field.First, the MV leaflet FE model in the undeformed con-figuration were reconstructed from much simplified leafletgeometry in the earlier development stage (Einstein et al.2004; Prot et al. 2007) to anatomically more accurate ones
123

C.-H. Lee et al.
(Mansi et al. 2012; Stevanella et al. 2011; Wang and Sun2013), such as the proposedmodel, as higher-resolutionmed-ical imaging and powerful segmentation techniques becameavailable. Second, the MV FE models with assumed chor-dae tendineae (Kunzelman et al. 2007; Stevanella et al.2009) were commonly adopted for simplicity and due to lim-ited chordae structures, whereas more realistic and detailedchordae structureswere employed in the present study.More-over, unlike the fiber microstructural information gathered,mapped, and utilized from the same specimen in the cur-rent modeling work, the MV leaflet fiber orientations wereassigned either based on previous observations (Mansi et al.2012; Prot et al. 2009; Skallerud et al. 2011) or from themeasurements taken from separate studies (Einstein et al.2005). Finally, the quantitative comparison of the principalstretches was made among the predicted in-surface strainfield in the leaflet center regions via the proposed model(MVAL: λC = 1.12 ± 0.04, λR = 1.39 ± 0.03 and MVPL:λC = 1.11± 0.03, λR = 1.48± 0.05), the previous in vitromeasurements of the porcine MVs (MVAL: λC = 1.11 ±0.04, λR = 1.32± 0.08 and MVPL: λC = 1.03± 0.1, λR =1.23± 0.14) (He et al. 2005; Sacks et al. 2002), and othernumerical predictions (MVAL: λC = 1.09, λR = 1.46 andMVPL: λC = 1.10, λR = 1.43) (Stevanella et al. 2009).
4.3 Limitations of the current study and perspectives
The adopted simplified structural constitutive model alloweddirect employment of the measured preferred fiber direc-tions and fiber splay dispersions and provided more valuableinsights into soft tissue function by integrating microscopicfiber structure, kinematics, and structural adaption with thetissue-level stress–strain responses compared to conven-tional invariant-based constitutive models (May-Newmanand Yin 1998; Prot et al. 2007) which were based on phe-nomenological observations and lacked appropriate physicalinterpretation. More realistic structure-based constitutivemodels for theMV tissues, which accounts for complex mul-tilayer microstructure and composition as well as separatedSEFs to model the mechanical responses of elastin and col-lagen fibers, are currently developed in our laboratory andwill be presented in the forthcoming publications.
Parameters of the structural constitutive model are char-acterized based on the in vitro passive mechanical data, formodeling the in vivo mechanical behaviors of the MV appa-ratus by taking account of the previously observed pre-straineffects (Amini et al. 2012) to avoid consideration of the activecontraction effect. This additional pre-strain effect can beconsidered by adding the corresponding pre-stretches intothe overall deformation gradient tensor as well as modifyingthe fiber orientation function and fiber recruitment consid-ering the deformation and transformation from the in vitroreference (excised, stress-free) state to the in vivo reference
(minimum left ventricular pressure-loaded) state (see Figs.6and 8 in Amini et al. 2012 for more details). The validness ofthis novel structurally-driven constitutive model will be jus-tified by extensive in vitro and in vivo data integrated withour previously developed inverse modeling technique (Leeet al. 2014).
In vivo and patient-specific modeling of the functioningMV as an intermediate step toward our long-term modelinggoals, several key aspects as future extensions of the proposedcomputational framework need to be addressed, including(1) integration of the dynamic motions of the MV annulusand PMs due to left ventricular contraction, (2) incorpora-tion of the pre-strain effects between the in vitro excised andthe in vivo reference states, the construction of population-based geometry of theMV leaflets and representative chordaetendineae primitives, and (3) development of morphablegeometry and attributes. Note that the MV leaflet computa-tional model can be reconstructed directly from real-time 3Dechocardiographic patient-specific image data using previ-ously developed automatic segmentation technique (Pouchet al. 2014), and dynamic annulus and PM motions canbe quantified by 3D echocardiography and sonomicrometrytechniques developed previously (Eckert et al. 2009; Gormanet al. 1996), and the measured in vivo data can be integratedwith the currently ready user-defined subroutine VDISP asprescribed displacement boundary conditions in the nonlin-ear FEanalyses.The role of theMVICs inMVleaflet functioncan also be added in a similar manner as this informationbecomes available.
Furthermore, utilizing available, extensivehigh-resolutionimage datasets, a population-averaged MV leaflet templategeometry is currently underway, which captures essentialfeatures of the MV leaflets. Moreover, a series of chordae3D geometric primitives, such as main intermediary chordaeand chordae branches, will be constructed for more realisticidealization of the chordae representation for the computa-tional modeling. General-purpose computational geometrytools will be subsequently devised for versatile manipula-tion and modification of the above leaflet template accordingto certain patient’s image data, for flexible integration of thedeveloped chordae primitiveswith themodified leaflet geom-etry, and for accurate morphing of important attributes, suchas the fiber ODF, fiber recruitment, preferred fiber directions,and other model parameters.
Although the fiber mapping algorithm represented areasonable step for integrating themeasuredfibermicrostruc-tural architecture with the structure-based constitutive modelfor FE simulations of the MV, a non-invasive mapping tech-nique for incorporation of the fiber architecture, which doesnot require a fiducial marker array, will be more attractivein clinical practice. Therefore, we are currently acquir-ing extensive MV leaflet fiber microstructural data froma large number of specimens from healthy and diseased
123
On the effects of leaflet microstructure and constitutive model on the closing behavior of the. . .
human subject groups, creating population-averaged fibermicrostructural information, and utilizing a spline-basedparametric mapping approach developed recently (Aggar-wal et al. 2013, 2014) for mapping essential and necessaryattributes. This future extension will allow for identifyingpopulation-averaged changes of microstructure due to MVdiseases and will make our computational models moretractable for patient-specific MV modeling in clinical appli-cations.
Finally, to better understand MV mechanical behaviorand remodeling, it would be necessary to gain fundamentalinsight into the connection of altered MV leaflet geometryand tissue stresses with the local changes of MVIC pheno-typic state and biosynthesis in response to mechanical stressoverload, MV pathologies and surgical intervention, and onhow these microscopic changes lead to the subsequent adap-tion of tissue adaption to restore overall tissue homeostasis.Hence, we are currently investigating the interrelation-ship between the MVIC microenvironment and tissue-leveldeformations via an integrated computational–experimentalmethodology in our parallel study (Lee et al. 2015b) andwill ultimately incorporateMVICmechanobiologywithin anorgan-level simulation framework for multiscale modelingand remodeling of normal, diseased, and surgically modifiedMVs.
4.4 Conclusions
In summary, we have developed a computational frame-work for modeling of the functioning MV and successfullyimplemented a computational model into the nonlinear FEsimulation procedure, which included microscale and mesoscale anatomically accurate geometry of the MV apparatus,mapped fiber microstructural architecture, and a structure-based constitutive model directly integrated with tissuemicrostructure. This computational model, to our knowl-edge, is the first of this kind that has been thoroughlyvalidated with extensive in vitro data for its model accu-racy and robustness. Displacement errors evaluated at thefiducial markers between the model predictions and in vitrodata were satisfactory: 0.096 ± 0.049 and 0.19 ± 0.061mmat 30mmHg transvalvular pressure and 0.13 ± 0.085 and0.26 ± 0.089mm at 70mmHg transvalvular pressure forthe MVAL and MVPL, respectively. Numerically predictedin-surface principal strains also agreed qualitatively andquantitatively well with the in vitro measurements. More-over, we showed in the comparative study that the proposedmodel with the highest fidelity yielded the most accuratepredictions compared with other model perturbations withvarying MV leaflet microstructural information. This studyunderscored the necessary model fidelity and informationto be included in the simulations for achieving desirableaccuracy. Furthermore, the parametric studies conducted in
this work demonstrated appropriate parameter ranges andmicromechanical fiber responses for representing the propercoaptation and natural functioning behaviors of the MVapparatus under physiological loading. Understanding theunderlying mechanisms of the normal MV could help inreiterating and designing surgical repair procedures formain-taining the proper physiological loading scenario. Finally,the computational model developed in this work servesas an important first step toward our long-term modelinggoals, which are to employ computer simulations for assess-ing the performance of existing MV repair techniques andfor providing insightful guidance in the design of optimalsurgical repair strategies for treating diseased MVs withbetter restored functionality and improved long-term dura-bility.
Acknowledgments Support from the National Institutes of Health(NIH) Grants R01 HL119297, HL63954, HL103723, and HL73021is greatly acknowledged. Dr. Chung-Hao Lee was supported in partby the American Heart Association (AHA) Postdoctoral Fellowship(14POST18160013) and a UT Austin ICES Postdoctoral Fellowship.The assistance from Ted Weber and Ronen G. Aniti for image seg-mentation and development of the MV finite element model is greatlyappreciated.
Conflict of interest None of the authors have a conflict of interestswith the present work.
Appendix 1: Computation of displacement errors atfiducial marker positions
Each of the shell elements for theMVmedian leaflet surfacesat the reference configuration (Fig. 5a) developed in Sect. 2.3was first extruded toward the left atrial direction with a dis-tance of half the elemental thickness in order to obtain the FEmesh for the atrial leaflet surfaces. Then, each of all the 266fiducial marker was associated with one shell element whoseelement region entirely covers this fiducial marker, and thecorresponding four shape functions (N1, N2, N3, N4) werecomputed based on the positions of the four nodes of thisidentified element as well as the fiducial marker location onthe expanded 2D parametric domain (s, t) (Fig. 12). Sim-ilar extrusion procedure was performed for the FE meshesunder deformations at 30 and 70mmHg transvalvular pres-sure, respectively, and the FE-predicted position of eachfiducialmarkerwas obtained by interpolation using the abovefour shape functions and the current locations of the fournodes
xt(FE)I =
4∑J=1
NJ (sI , tI ) xtJ , yt(FE)I
=4∑
J=1
NJ (sI , tI ) ytJ , zt(FE)I
123

C.-H. Lee et al.
=4∑
J=1
NJ (sI , tI ) ztJ , (9)
where (xtJ , ytJ , z
tJ ) is the current position (after extrusion) of
node J in the deformed configuration Ωt , and superscript tdenotes the state (30 or 70mmHg). Finally, the displacementerrors at the fiducial markers were evaluated by comparingthe micro-CT segmented locations and the FE predictions asfollows
error tI =√(
xt(FE)I −xt(in-vitro)I
)2+(yt(FE)I −yt(in-vitro)I
)2+(zt(FE)I −zt(in-vitro)I
)2.
(10)
Appendix 2: Kinematics and strain computations inthe convective curvilinear coordinates
We modified previously developed approaches (Sacks et al.1993, 2002; Smith et al. 2000) for computation of the strainfield within the fiducial marker array by adopting an in-surface convective curvilinear coordinate system (u, v, n)based on the local tangent plane (Fig. 12). This coordinatesystem was defined with unit vectors ev parallel to the cylin-drically circumferential direction, en being the local surfacenormal, and ev = en × ev . The 3D position vector of each
marker (x, y, z) at different configurations was then trans-lated and rotated into this (u, v, n) coordinate system. In thiswork, we utilized a point-based meshless surface interpo-lation to calculate the in-surface strain field within the MVleaflet delimited by the markers. The position vectors of eachpoint at the reference state and the deformed state were givenby
R0 = R0ueu + R0
vev + R0nen and rt = rtueu + rtvev+rtnen,
(11)
whereR0u,R
0v , andR
0n are the u, v, n components of the posi-
tion vector associated with the reference state, and rtu, rtv ,
and rtn are the u, v, n components of the position vectorcorresponding to the deformed state. In this study, these com-ponents were computed by using the spline interpolation
R0J (s, t) =
N P∑I=1
φI (s, t; sI , tI )(R0
J
)Iand
rtJ (s, t) =N P∑I=1
φI (s, t; sI , tI )(rtJ
)I . (12)
Here, subscript J ∈ {u, v, n}, (R0J )I and (rtJ )I are the
J -components of the position vectors of marker I corre-sponding to the reference and deformed states, respectively,and φI(s, t; sI , tI ) is theC2-continuous cubic spline functionof marker I with a compact support d covering NP markers
Anterior Leaflet
Posterior Leaflet
MVPL-P2MVPL-P3
MVPL-P1
Anterior Commissure
Fiducial Markers
MVALPosterior
Commissure
s
t
y
z
x
u,s
v,tn
Fig. 12 An illustrative diagram showing the unfolding process fromthe 3D geometry of the MV leaflet surfaces in the global coordinates(x, y, z) to the unfoldedMVALandMVPLon the 2Dparametric domain(s, t) for visualization of the displacement errors and in-surface prin-
cipal strains and computation of cubic spline functions as discussedin “Appendix 2”. The squared boxes denote the central regions of theMVAL and MVPL in which the mean values, and standard deviationsof the principal stretches were evaluated
123

On the effects of leaflet microstructure and constitutive model on the closing behavior of the. . .
which has the form
φI (zI )=
⎧⎪⎪⎨⎪⎪⎩
23 − 4z2I + 4z3I for 0 ≤ |zI | ≤ 0.5
43−4zI +4z2I − 4
3 z3I for 0.5≤|zI |≤1
0 for |zI | > 1
. (13)
where zI (s, t; sI , tI ) ≡ √(sI − s)2 + (tI − t)2/d, d was
chosen as twice of the average marker distance, and the cov-ering fiducial makers were determined on the expanded 2Dparametric domain (s, t) (Fig. 12). Hence, the covariant basevectors on the MV leaflet surfaces were determined by
Gα = R0,α =
(∂R0
α
∂α
)eα +
(∂R0
n
∂α
)en and
gα = rt,α =(
∂r tα∂α
)eα +
(∂r tn∂α
)en, (14)
where subscript α ∈ {u, v},Gα and gα are the covariantbase vectors in the reference and deformed configurations,respectively, and the third covariant base vectors werecomputed by G3 = (G1 × G2)/||G1 × G2|| and g3 =(g1 × g2)/||g1 × g2||. Then, the contra-variant base vectorswere computed by their definition
G1 = G2 × G3
G1 · (G2 × G3), G2 = G3 × G1
G1 · (G2 × G3),
G3 = G1 × G2
G1 · (G2 × G3), (15)
g1 = g2 × g3g1 · (g2 × g3)
, g2 = g3 × g1g1 · (g2 × g3)
,
g3 = g1 × g2g1 · (g2 × g3)
. (16)
After carrying out the components of each base vector, thein-plane deformation gradient tensor F2D (used for the map-ping algorithm presented in Sect. 2.3), right Cauchy–Greendeformation tensorC2D, andEuler–Almansi strain tensor e2D(served as validation data in Sects. 2.6, 2.7) were computed(Flugge 1972; Fung 1993) as the following:
F2D = gI ⊗ GI ,C2D = (F2D)T (F2D) ,
(e2D)αβ = 1
2
(gα · gβ − Gα · Gβ
)α, β = 1, 2. (17)
Finally, the corresponding principal stretches (λR, λC)
and the principal directions can then be obtained by solvingthe eigenvalue problem of the above Euler-Almansi straintensor for the eigenvalues and eigenvectors.
Appendix 3: Summary of validations of the in-surface principal stretches and sensitivity study
The FE-predicted maximum and minimum stretches inthe central regions of the MV two leaflets at 70mmHgtransvalvular pressurewere reported as follows:λR = 1.39±0.03 and λC = 1.12 ± 0.04 for the MV anterior leaflet,and λR = 1.48 ± 0.05 and λC = 1.11 ± 0.03 for the MVposterior leaflet, whereas the in vitro experimental measure-ments were λR = 1.39± 0.03 and λC = 1.12± 0.04 for theMVAL, and λR = 1.48 ± 0.04 and λC = 1.11 ± 0.02 forthe MVPL. Furthermore, the principal directions associatedwith the principal stretches from both numerical predic-tions and experimental data were very smooth, especiallyin the central regions of the MVAL and MVPL, and were
1.0 1.1 1.2 1.3 1.5
Maximum Principal Stretch λR
1.4
(b)
(a)
Fig. 13 Comparisons of the maximum principal stretches λR and directions at 70mmHg transvalvular pressure: a in vitro measurements and bFE predictions. (Left MVAL; right MVPL)
123
C.-H. Lee et al.
0.7 0.8 0.9 1.0
Minimum Principal Stretch λC
1.1
(b)
(a)
Fig. 14 Comparisons of the minimum principal stretches λC and directions at 70mmHg transvalvular pressure: a in vitro measurements and b FEpredictions. (Left MVAL; right MVPL)
(b)
(a)
(d)
(c)
0.175 0.35 0.525 0.7 0.875 1.050
Displacement Error (mm)
Fig. 15 Comparison of the FE-predicted displacement errors at70mmHg transvalvular pressure with an increasing level of modelfidelity: a level I—isotropic material, b level II—transversely isotropicmaterial with uniformly curvilinear fiber directions and identical fiber
dispersions, c level III—transversely isotropic material with uniformlycurvilinear fiber directions and mapped fiber dispersions, and d levelIV—transversely isotropic material with mapped fiber directions (viathe proposed mapping technique) and mapped fiber dispersions
123
On the effects of leaflet microstructure and constitutive model on the closing behavior of the. . .
in good alignment with the radial and circumferential direc-tions, respectively (Figs. 13, 14). For the sensitivity studyon the leaflet microstructural information, the FE predictionaccuracy with various levels of model fidelity was evaluatedbased on the displacement errors at the fiducial marker posi-tions at 70 mmHg transvalvular pressure (Fig. 15).
References
Adams DH, Rosenhek R, Falk V (2010) Degenerative mitral valveregurgitation: best practice revolution. Eur Heart J 31:1958–1966
Aggarwal A, Aguilar VS, Lee C-H, Ferrari G, Gorman JH, Gorman RC,Sacks MS (2013) Patient-specific modeling of heart valves: fromimage to simulation. In: Qurselin S, Rueckert D, Smith N (eds)Functional imaging and modeling of the heart. Springer, Berlin,pp 141–149
Aggarwal A, Ferrari G, Joyce E, Daniels MJ, Sainger R, Gorman JH3rd,GormanR,SacksMS (2014)Architectural trends in the humannormal and bicuspid aortic valve leaflet and its relevance to valvedisease. Ann Biomed Eng 42:986–998
Amini R, Eckert CE, Koomalsingh K, McGarvey J, MinakawaM, Gor-man JH,GormanRC, SacksMS (2012) On the in vivo deformationof the mitral valve anterior leaflet: effects of annular geometry andreferential configuration. Ann Biomed Eng 40:1455–1467
Bouxsein ML, Boyd SK, Christiansen BA, Guldberg RE, Jepsen KJ,Müller R (2010) Guidelines for assessment of bone microstructurein rodents using micro-computed tomography. J Bone Miner Res25:1468–1486
Braunberger E, Deloche A, Berrebi A, Abdallah F, Celestin JA,Meimoun P, Chatellier G, Chauvaud S, Fabiani JN, CarpentierA (2001) Very long-term results (more than 20 years) of valverepair with carpentier’s techniques in nonrheumatic mitral valveinsufficiency. Circulation 104:I8–11
Carpentier A (1983) Cardiac valve surgery-the “French correction”. JThorac Cardiovasc Surg 86:323–337
Carpentier A, Relland J, Deloche A, Fabiani J-N, D’Allaines C,Blondeau P, Piwnica A, Chauvaud S, Dubost C (1978) Conserva-tive management of the prolapsed mitral valve. Ann Thorac Surg26:294–302
Choi A, Rim Y, Mun JS, Kim H (2014) A novel finite element-basedpatient-specific mitral valve repair: virtual ring annuloplasty. Bio-med Mater Eng 24:341–347
Dal-Bianco JP, Aikawa E, Bischoff J, Guerrero JL, HandschumacherMD, Sullivan S, Johnson B, Titus JS, Iwamoto Y, Wylie-Sears J,Levine RA, Carpentier A (2009) Active adaptation of the tetheredmitral valve: insights into a compensatory mechanism for func-tional mitral regurgitation. Circulation 120:334–342
David TE, Ivanov J, Armstrong S, Christie D, Rakowski H (2005) Acomparison of outcomes of mitral valve repair for degenerativedisease with posterior, anterior, and bileaflet prolapse. J ThoracCardiovasc Surg 130:1242–1249
David TE, Omran A, Armstrong S, Sun Z, Ivanov J (1998) Long-term results of mitral valve repair for myxomatous disease withand without chordal replacement with expanded polytetrafluo-roethylene sutures. J Thorac Cardiovasc Surg 115:1279–1286
Eckert CE, Zubiate B, Vergnat M, Gorman JH 3rd, Gorman RC, SacksMS (2009) In vivo dynamic deformation of the mitral valve annu-lus. Ann Biomed Eng 37:1757–1771
Einstein DR, Kunzelman KS, Reinhall PG, Cochran RP, Nicosia MA(2004) Haemodynamic determinants of the mitral valve closuresound: a finite element study. Med Biol Eng Comput 42:832–846
Einstein DR, Kunzelman KS, Reinhall PG, Nicosia MA, Cochran RP(2005) The relationship of normal and abnormal microstructuralproliferation to the mitral valve closure sound. J Biomech Eng127:134–147
Fan R, Sacks MS (2014) Simulation of planar soft tissues using astructural constitutive model: finite element implementation andvalidation. J Biomech 47:2043–2054
Flameng W, Herijgers P, Bogaerts K (2003) Recurrence of mitral valveregurgitation aftermitral valve repair in degenerative valve disease.Circulation 107:1609–1613
FlamengW,Meuris B, Herijgers P, HerregodsM-C (2008) Durability ofmitral valve repair in Barlow disease versus fibroelastic deficiency.J Thorac Cardiovasc Surg 135:274–282
Flugge W (1972) Tensor analysis and continuum mechanics. Springer,New York
Frater R, Vetter H, Zussa C, Dahm M (1990) Chordal replacement inmitral valve repair. Circulation 82:IV125–IV130
FungYC (1993) Biomechanics: mechanical properties of living tissues,2nd edn. Springer, New York
Gillinov AM, Blackstone EH, Nowicki ER, Slisatkorn W, Al-DossariG, Johnston DR, George KM, Houghtaling PL, Griffin B, SabikJF III (2008) Valve repair versus valve replacement for degenera-tive mitral valve disease. J Thorac Cardiovas Surg 135:885–893e882
Gorman JH 3rd, Gupta KB, Streicher JT, Gorman RC, Jackson BM,Ratcliffe MB, Bogen DK, Edmunds LH Jr (1996) Dynamic three-dimensional imaging of the mitral valve and left ventricle byrapid sonomicrometry array localization. J Thorac CardiovascSurg 112:712–726
Gorman RC, Gorman JH 3rd (2006) Why should we repair ischemicmitral regurgitation? Ann Thorac Surg 81:785 (author reply 785–786)
Grande-Allen KJ, Borowski AG, Troughton RW, Houghtaling PL,Dipaola NR, Moravec CS, Vesely I, Griffin BP (2005) Apparentlynormal mitral valves in patients with heart failure demonstrate bio-chemical and structural derangements: an extracellular matrix andechocardiographic study. J Am Coll Cardiol 45:54–61
Grashow JS, Yoganathan AP, Sacks MS (2006) Biaxial stress-stretchbehavior of the mitral valve anterior leaflet at physiologic strainrates. Ann Biomed Eng 34:315–325
He Z, Ritchie J, Grashow JS, Sacks MS, Yoganathan AP (2005) Invitro dynamic strain behavior of the mitral valve posterior leaflet.J Biomech Eng 127:504–511
Jassar AS, Minakawa M, Shuto T, Robb JD, Koomalsingh KJ, Lev-ack MM, Vergnat M, Eperjesi TJ, Jackson BM, Gorman JH III(2012) Posterior leaflet augmentation in ischemic mitral regurgi-tation increases leaflet coaptation and mobility. Ann Thorac Surg94:1438–1445
Jensen MO, Jensen H, Levine RA, Yoganathan AP, Andersen NT,Nygaard H, Hasenkam JM, Nielsen SL (2011) Saddle-shapedmitral valve annuloplasty rings improve leaflet coaptation geome-try. J Thorac Cardiovasc Surg 142:697–703
Jimenez JH, Soerensen DD, He Z, He S, Yoganathan AP (2003) Effectsof a saddle shaped annulus on mitral valve function and chordalforce distribution: an in vitro study. Ann Biomed Eng 31:1171–1181
Kincaid EH, Riley RD, HinesMH, Hammon JW, Kon ND (2004) Ante-rior leaflet augmentation for ischemic mitral regurgitation. AnnThorac Surg 78:564–568 discussion 568
Komeda M, Glasson JR, Bolger AF, Daughters GT 2nd, MacIsaac A,Oesterle SN, Ingels NB Jr, Miller DC (1997) Geometric determi-nants of ischemic mitral regurgitation. Circulation 96(II):128–133
Krishnamurthy G, Ennis DB, Itoh A, Bothe W, Swanson JC, KarlssonM, Kuhl E, Miller DC, Ingels NB Jr (2008) Material properties ofthe ovine mitral valve anterior leaflet in vivo from inverse finite
123
C.-H. Lee et al.
element analysis. Am J Physiol Heart Circ Physiol 295:H1141–H1149
KunzelmanKS, CochranRP, ChuongC, RingWS,Verrier ED, EberhartRD (1993a) Finite element analysis of the mitral valve. J HeartValve Dis 2:326–340
KunzelmanKS, CochranRP,Murphree SS, RingWS,Verrier ED, Eber-hart RC (1993b) Differential collagen distribution in the mitralvalve and its influence on biomechanical behaviour. J Heart ValveDis 2:236–244
Kunzelman KS, Einstein DR, Cochran RP (2007) Fluid-structureinteraction models of the mitral valve: function in normal andpathological states. Philos Trans R Soc LondBBiol Sci 362:1393–1406
Kunzelman KS, Reimink MS, Cochran RP (1998) Flexible versus rigidring annuloplasty for mitral valve annular dilatation: a finite ele-ment model. J Heart Valve Dis 7:108–116
Lanir Y (1983) Constitutive equations for fibrous connective tissues. JBiomech 16:1–12
Lee C-H, Amini R, Sakamoto Y, Carruthers CA, Aggarwal A, GormanRC, Gorman JH III, Sacks MS (2015a) Mitral valves: a compu-tational framework. In: De S, Hwang W, Kuhl E (eds) Multiscalemodeling in biomechanics and mechanobiology. Springer, Lon-don, pp 223–255
Lee CH, Amini R, Gorman RC, Gorman JH 3rd, Sacks MS (2014)An inverse modeling approach for stress estimation in mitralvalve anterior leaflet valvuloplasty for in-vivo valvular biomaterialassessment. J Biomech 47:2055–2063
Lee CH, Carruthers CA, Ayoub S, Gorman RC, Gorman JH, SacksMS (2015b) Quantification and simulation of layer-specific mitralvalve interstitial cell deformation under physiological loading. JTheor Biol 373:26–39
LeeCH,ZhangW,Liao J,CarruthersCA,Sacks J, SacksMS (2015c)Onthe presence of affine fibril and fiber kinematics in the mitral valveanterior leaflet under simulated physiological loading. Biophys J108:1–14
Mahmood F, Gorman JH 3rd, SubramaniamB,GormanRC, Panzica PJ,HagbergRC, LernerAB,Hess PE,MaslowA,KhabbazKR (2010)Changes in mitral valve annular geometry after repair: saddle-shaped versus flat annuloplasty rings. Ann Thorac Surg 90:1212–1220
Mansi T,Voigt I, GeorgescuB, ZhengX,MengueEA,HacklM, IonasecRI, Noack T, Seeburger J, Comaniciu D (2012) An integratedframework for finite-elementmodeling ofmitral valve biomechan-ics from medical images: application to MitralClip interventionplanning. Med Image Anal 16:1330–1346
May-Newman K, Yin FC (1998) A constitutive law for mitral valvetissue. J Biomech Eng 120:38–47
Pouch AM, Wang H, Takabe M, Jackson BM, Gorman J, Gorman RC,Yushkevich PA, Sehgal CM (2014) Fully automatic segmenta-tion of the mitral leaflets in 3D transesophageal echocardiographicimages using multi-atlas joint label fusion and deformable medialmodeling. Med Image Anal 18:118–129
Prot V, Haaverstad R, Skallerud B (2009) Finite element analysis of themitral apparatus: annulus shape effect and chordal force distribu-tion. Biomech Model Mechanobiol 8:43–55
Prot V, Skallerud B (2009) Nonlinear solid finite element analysis ofmitral valves with heterogeneous leaflet layers. Comput Mech43:353–368
Prot V, Skallerud B, Holzapfel G (2007) Transversely isotropic mem-brane shells with application to mitral valve mechanics. Consti-tutive modelling and finite element implementation. Int J NumerMethods Eng 71:987–1008
Rabbah J-P, Saikrishnan N, Yoganathan AP (2013) A novel left heartsimulator for the multi-modality characterization of native mitralvalve geometry and fluid mechanics. Ann Biomed Eng 41:305–315
Rabkin-Aikawa E, Farber M, Aikawa M, Schoen FJ (2004) Dynamicand reversible changes of interstitial cell phenotype during remod-eling of cardiac valves. J Heart Valve Dis 13:841–847
Reimink MS, Kunzelman KS, Verrier ED, Cochran RP (1995) Theeffect of anterior chordal replacement on mitral valve functionand stresses. A finite element study. Asaio J 41:M754–762
Ritchie J, Jimenez J, He Z, SacksMS, Yoganathan AP (2006) Themate-rial properties of the native porcinemitral valve chordae tendineae:an in vitro investigation. J Biomech 39:1129–1135
Robb JD, MinakawaM, Koomalsingh KJ, Shuto T, Jassar AS, RatcliffeSJ, Gorman RC, Gorman JH, 3rd (2011) Posterior leaflet aug-mentation improves leaflet tethering in repair of ischemic mitralregurgitation. Eur J Cardiothorac Surg 40(6):1501–1507
Sacks MS (2003) Incorporation of experimentally-derived fiber orien-tation into a structural constitutive model for planar collagenoustissues. J Biomech Eng 125:280–287
Sacks MS, Chuong CJ, Templeton GH, Peshock R (1993) In vivo 3-Dreconstruction and geometric characterization of the right ventric-ular free wall. Ann Biomed Eng 21:263–275
SacksMS, He Z, Baijens L,Wanant S, Shah P, SugimotoH, YoganathanAP (2002) Surface strains in the anterior leaflet of the functioningmitral valve. Ann Biomed Eng 30:1281–1290
Sacks MS, Smith DB, Hiester ED (1997) A small angle light scatteringdevice for planar connective tissue microstructural analysis. AnnBiomed Eng 25:678–689
Sacks MS, Yoganathan AP (2008) Heart valve function: a biomechan-ical perspective. Philos Trans R Soc Lond B Biol Sci 363:2481
Schoen FJ, Levy RJ (2005) Calcification of tissue heart valve substi-tutes: progress toward understanding and prevention. Ann ThoracSurg 79:1072–1080
Shuhaiber J, Anderson RJ (2007) Meta-analysis of clinical outcomesfollowing surgical mitral valve repair or replacement. Eur J Car-diothorac Surg 31:267–275
Skallerud B, Prot V, Nordrum IS (2011) Modeling active muscle con-traction in mitral valve leaflets during systole: a first approach.Biomech Model Mechanobiol 10:11–26
Smith DB, Sacks MS, Vorp DA, Thornton M (2000) Surface geomet-ric analysis of anatomic structures using biquintic finite elementinterpolation. Ann Biomed Eng 28:598–611
Stevanella M, Maffessanti F, Conti CA, Votta E, Arnoldi A, LombardiM, Parodi O, Caiani EG, Redaelli A (2011) Mitral valve patient-specific finite element modeling from cardiac MRI: application toan annuloplasty procedure. Cardiovas Eng Technol 2:66–76
Stevanella M, Votta E, Redaelli A (2009) Mitral valve finite elementmodeling: implications of tissues’ nonlinear response and annularmotion. J Biomech Eng 131:121010
Vassileva CM, Boley T, Markwell S, Hazelrigg S (2011) Meta-analysisof short-term and long-term survival following repair versusreplacement for ischemic mitral regurgitation. Eur J Cardiotho-rac Surg 39:295–303
Votta E, Le TB, Stevanella M, Fusini L, Caiani EG, Redaelli A,Sotiropoulos F (2013) Toward patient-specific simulations of car-diac valves: state-of-the-art and future directions. J Biomech46:217–228
WangQ,SunW(2013)Finite elementmodeling ofmitral valve dynamicdeformation using patient-specific multi-slices computed tomog-raphy scans. Ann Biomed Eng 41:142–153
123