![Neural Task Programming: Learning to Generalize across ...vision.stanford.edu/pdf/xu2018icra.pdf · Summary of Contributions: 1) ... [ 20 , 33 ]. Yet these methods fall short ...](https://static.fdocuments.us/doc/165x107/5ad4ac5a7f8b9a177c8c06ea/neural-task-programming-learning-to-generalize-across-of-contributions-1.jpg)
On the Capability of Neural Networks to Generalize to ...
22
CBMM Memo No. 111 July 17, 2020 On the Capability of Neural Networks to Generalize to Unseen Category-Pose Combinations Spandan Madan 1 , Timothy Henry 2 , Jamell Dozier 2 , Helen Ho 3 , Nishchal Bhandari 3 , Tomotake Sasaki 4 , Frédo Durand 3 , Hanspeter Pfister 1 , Xavier Boix 2 1 SEAS, Harvard University 2 Center for Brains, Minds and Machines, MIT 3 MIT CSAIL 4 Fujitsu Laboratories Ltd. Abstract Recognizing an object’s category and pose lies at the heart of visual understanding. Recent works suggest that deep neural networks (DNNs) often fail to generalize to category-pose combinations not seen during training. However, it is unclear when and how such generalization may be possible. Does the number of combinations seen during training impact generalization? Is it better to learn category and pose in separate networks, or in a single shared network? Furthermore, what are the neural mechanisms that drive the network’s generalization? In this paper, we answer these questions by analyzing state-of-the-art DNNs trained to recognize both object category and pose (position, scale, and 3D viewpoint) with quantitative control over the number of category-pose combinations seen during training. We also investigate the emergence of two types of specialized neurons that can explain generalization to unseen combinations—neurons selective to category and invariant to pose, and vice versa. We perform experiments on MNIST extended with position or scale, the iLab dataset with vehicles at different viewpoints, and a challenging new dataset for car model recognition and viewpoint estimation that we introduce in this paper, the Biased-Cars dataset. Our results demonstrate that as the number of combinations seen during training increases, networks generalize better to unseen category-pose combinations, facilitated by an increase in the selectivity and invariance of individual neurons. We find that learning category and pose in separate networks compared to a shared one leads to an increase in such selectivity and invariance, as separate networks are not forced to preserve information about both category and pose. This enables separate networks to significantly outperform shared ones at predicting unseen category-pose combinations. This material is based upon work supported by the Center for Brains, Minds and Machines (CBMM), funded by NSF STC award CCF-1231216.
Transcript of On the Capability of Neural Networks to Generalize to ...

CBMM Memo No. 111 July 17, 2020
On the Capability of Neural Networks to Generalizeto Unseen Category-Pose Combinations
Spandan Madan1, Timothy Henry2, Jamell Dozier2, Helen Ho3, Nishchal Bhandari3,Tomotake Sasaki4, Frédo Durand3, Hanspeter Pfister1, Xavier Boix2
1 SEAS, Harvard University 2 Center for Brains, Minds and Machines, MIT3 MIT CSAIL 4 Fujitsu Laboratories Ltd.
Abstract
Recognizing an object’s category and pose lies at the heart of visual understanding. Recent workssuggest that deep neural networks (DNNs) often fail to generalize to category-pose combinations notseen during training. However, it is unclear when and how such generalization may be possible. Doesthe number of combinations seen during training impact generalization? Is it better to learn categoryand pose in separate networks, or in a single shared network? Furthermore, what are the neuralmechanisms that drive the network’s generalization? In this paper, we answer these questions byanalyzing state-of-the-art DNNs trained to recognize both object category and pose (position, scale,and 3D viewpoint) with quantitative control over the number of category-pose combinations seen duringtraining. We also investigate the emergence of two types of specialized neurons that can explaingeneralization to unseen combinations—neurons selective to category and invariant to pose, and viceversa. We perform experiments on MNIST extended with position or scale, the iLab dataset withvehicles at different viewpoints, and a challenging new dataset for car model recognition and viewpointestimation that we introduce in this paper, the Biased-Cars dataset. Our results demonstrate thatas the number of combinations seen during training increases, networks generalize better to unseencategory-pose combinations, facilitated by an increase in the selectivity and invariance of individualneurons. We find that learning category and pose in separate networks compared to a shared oneleads to an increase in such selectivity and invariance, as separate networks are not forced to preserveinformation about both category and pose. This enables separate networks to significantly outperformshared ones at predicting unseen category-pose combinations.
This material is based upon work supported by the Center for Brains,Minds and Machines (CBMM), funded by NSF STC award CCF-1231216.
On the Capability of Neural Networks to Generalizeto Unseen Category-Pose Combinations
Spandan Madan†
SEAS, Harvard UniversityTimothy HenryCBMM & MIT
Jamell DozierCBMM & MIT
Helen HoMIT CSAIL
Nishchal BhandariMIT CSAIL
Tomotake SasakiFujitsu Laboratories Ltd.
Frédo DurandMIT CSAIL
Hanspeter PfisterSEAS, Harvard University
Xavier Boix†
CBMM & MIT
Abstract
Recognizing an object’s category and pose lies at the heart of visual understanding.Recent works suggest that deep neural networks (DNNs) often fail to generalize tocategory-pose combinations not seen during training. However, it is unclear whenand how such generalization may be possible. Does the number of combinationsseen during training impact generalization? Is it better to learn category and pose inseparate networks, or in a single shared network? Furthermore, what are the neuralmechanisms that drive the network’s generalization? In this paper, we answerthese questions by analyzing state-of-the-art DNNs trained to recognize both objectcategory and pose (position, scale, and 3D viewpoint) with quantitative controlover the number of category-pose combinations seen during training. We alsoinvestigate the emergence of two types of specialized neurons that can explaingeneralization to unseen combinations—neurons selective to category and invariantto pose, and vice versa. We perform experiments on MNIST extended withposition or scale, the iLab dataset with vehicles at different viewpoints, and achallenging new dataset for car model recognition and viewpoint estimation that weintroduce in this paper, the Biased-Cars dataset. Our results demonstrate that as thenumber of combinations seen during training increase, networks generalize betterto unseen category-pose combinations, facilitated by an increase in the selectivityand invariance of individual neurons. We find that learning category and pose inseparate networks compared to a shared one leads to an increase in such selectivityand invariance, as separate networks are not forced to preserve information aboutboth category and pose. This enables separate networks to significantly outperformshared ones at predicting unseen category-pose combinations.
1 Introduction
In recent years, deep neural networks (DNNs) have offered state-of-the-art solutions for objectcategory recognition [1–5], pose estimation (e.g., position, scale, and 3D viewpoint) [6–9], andmore complex visual problems that rely on a combination of these two tasks. These include ObjectDetection [10–16], Visual Question Answering [17–20], and Image Captioning [21–25], amongothers. Despite this tremendous progress, recent works have uncovered evidence suggesting that gen-eralization capabilities of DNNs might be limited when testing on object category-pose combinationsnot seen during training. For object category recognition, DNNs may fail to generalize across spatialtransformations like 2D rotation and translation [26–28], and also non-canonical 3D views [29, 30].
† Corresponding authors: [email protected] and [email protected]
arX
iv:2
007.
0803
2v1
[cs
.CV
] 1
5 Ju
l 202
0

Ford Thunderbird, Front Mitsubishi Lancer, Side Ford Thunderbird, Side(a)
iLab-2M dataset Unseen Combinations (held-out) 50% Seen Combinations(b) (c) (d)
Figure 1: Category-Pose datasets. (a) Our new Biased-Cars dataset: Can a network shown onlyexamples of Ford Thunderbird from the front and of Mitsubishi Lancer from the side generalize topredict the Category and the Pose for a Thunderbird seen from the side? (b) iLab-2M dataset [31]:Each cell represents a unique category-pose combination (categories vary between rows, posebetween columns) with multiple object instances per category and backgrounds. (c) Held-out testset of category-pose combinations. The same held-out test set is used to evaluate networks trainedwith different percentage of seen combinations. (d) Example of biased training set with 50% of thecategory-pose combinations. The number of categories and poses selected is always equal.
For pose estimation, DNNs often need to be trained for specific object instances or categories [7–9],which suggests that pose estimation methods do not generalize well across arbitrary 3D objects.
It remains unclear when and how DNNs generalize across category-pose combinations not seenduring training. Fig. 1a presents a motivating example: would a network trained with examplesof a Ford Thunderbird seen only from the front, and a Mitsubishi Lancer seen only from the sidegeneralize to predict car model (category) and viewpoint (pose) for a Thunderbird shown from theside? If so, what underlying mechanisms enable a network to do so?
In order to understand the capability of DNNs to generalize to unseen category-pose combinations, weinvestigate the impact of two key factors—data diversity and architectural choices. More concretely,we train state-of-the-art DNNs on a different number of object category-pose combinations and evalu-ate them on combinations never seen during training. As category recognition and pose estimation areoften needed together to solve complex computer vision tasks, we analyze the impact of learning thetwo tasks in separate networks vs. together on the capability to generalize. Furthermore, to investigatethe underlying mechanisms driving the generalization of the network, we investigate the emergenceof selective and invariant representations which have been shown to facilitate generalization [32–38].
In a series of experiments, we demonstrate that the percentage of category-pose combinations seenduring training (training data diversity) matters significantly. As DNNs are trained with more
2

combinations, there is an increase in their accuracy on unseen combinations. Our results also revealthat learning category and pose in separate networks helps DNNs generalize substantially bettercompared to learning them together. We show that this generalization behaviour is driven by anincrease in the selectivity and invariance of the neurons, which is even more pronounced whencategory and pose prediction are learned in separate networks compared to a shared one.
These results are consistent across multiple state-of-the-art DNNs in MNIST [39] extended withposition and scale, the iLab-2M dataset [31] and in a new challenging dataset of car model recognitionand viewpoint estimation, the Biased-Cars dataset, which we introduce in this paper. This new datasetconsists of 15K photorealistic rendered images of several car models at different positions, scales andviewpoints, and under various illumination, background, clutter and occlusion conditions. With theseresults, we hope to provide a first milestone at understanding the neural mechanisms which enableDNNs to generalize to unseen category-pose combinations.
2 Category-Pose Datasets
To analyze generalization to unseen category-pose combinations, we chose the following fourdatasets as they offer complete control over the joint distribution of categories and poses. Each datasetcontains category and pose labels for all images, and networks are trained to predict both these labelssimultaneously without pretraining. Category and pose prediction are both cast as classificationproblems with an equal number of classes to ensure equal treatment of the two tasks. Additionalexperimental details including optimizers and hyper-parameters can be found in the supplement.
MNIST-Position and MNIST-Scale. These are variants of the MNIST dataset [39], created byadding pose in the form of position or scale to MNIST. MNIST-Position was created by placingMNIST images into one of nine possible locations in an empty 3-by-3 grid. For MNIST-Scale, weresized images to one of nine possible sizes followed by zero-padding. Images of the digit 9 were leftout in both these datasets ensuring nine category and nine pose classes, for a total of 81 category-posecombinations. Sample images are available in the supplement.
iLab-2M dataset. iLab-2M [31] is a large scale (two million images), natural image dataset with 3Dvariations in pose and multiple object instances for each category as shown in Fig.1b. The datasetwas created by placing physical toy objects on a turntable and photographing them from six differentazimuth viewpoints, each at five different zenith angles (total 30). From the original dataset, we chosea subset of six object categories - Bus, Car, Helicopter, Monster Truck, Plane, and Tank. In Fig. 1b,each row represents images from one category, and each column images from one azimuth angle. Allnetworks are trained to predict one of six category and the azimuth (pose) labels each.
Biased-Cars dataset. Here we introduce a challenging new dataset of object category and posewhich we call the Biased-Cars dataset. We plan to make it publicly available upon publication.This dataset was generated using our custom computer graphics pipeline to render photo-realisticoutdoor scene data with fine control over scene clutter (trees, street furniture, and pedestrians), objectocclusions, diverse backgrounds (building/road materials) and lighting conditions (sky maps). Ourdataset has 15K images and contains five different car models seen from viewpoints varying between0-90 degrees of azimuth, and 0-50 degrees of zenith across multiple scales. Sample images are shownin Fig. 1a. For additional diversity, cars were rendered in four different colors—red, green, blue, andblack. We divide the azimuth angle into five bins of 18 degrees each, ensuring five category (carmodels) and five pose classes (azimuth bins), for a total of 25 different category-pose combinations.
Building on the recent successes of synthetic city datasets and simulators for outdoor scenes [40–46],we designed our pipeline for two main reasons. Firstly, existing pre-rendered datasets did not matchthe experimental constraints we wished to have over the joint distribution of categories, pose, andother scene parameters like object colors, scene clutter, and backgrounds. Secondly, most existingsimulators use real-time rendering, and not physically based rendering (PBR) [47]. Using PBRhelped make our images more photo-realistic by accurately modeling the flow of light in the scene.Furthermore, PBR has been shown to help networks transfer to natural image data significantly betterthan real-time rendering [48, 49]. Additional details and samples are available in the supplement.
3

CATEGORY
POSE
INPUT
SHARED
CATEGORY
POSE
INPUT
SEPARATE
INPUT
CATEGORY
POSE
SPLIT-2
Figure 2: Architectures for Category Recognition and Pose Estimation. Shared, Separate and Split-2architectures for ResNet-18. In the Shared architecture, all layers until the last convolutional block areshared between tasks, followed by task specific fully connected layers. In the Separate architecture,each task is trained in a separate network with no layer sharing between tasks. Split-2 presents amiddle ground. These architectures are designed similarly for backbones other than ResNet-18.
3 Factors Affecting Generalization to Unseen Category-Pose Combinations
Below we present the two factors we study for their impact on generalization to unseen category-posecombinations - (i) data diversity, and (ii) architectural choices.
3.1 Generating Train/Test Splits with Desired Data Diversity
Every dataset described in Section 2 can be visualized as a square category-pose combinations grid asshown for the iLab dataset in Fig. 1b. Here, each row represents images from one category, and eachcolumn a pose. Thus, each cell in the combinations grid represents one category-pose combination.
Constructing the test split. For every dataset, we select and hold out a set of combinations from thecombinations grid as shown in Fig. 1c. We refer to these as the unseen combinations. Images fromthese combinations are never shown to any network during training. Instead, these images are used tobuild an unseen test split, which allows us to evaluate how well networks generalize to combinationsnever seen during training. For a fair representation of each category and pose, we ensure that everycategory and pose class occurs exactly once in the unseen combinations, ie., one cell each per rowand column is selected. One such unseen test split is constructed for each dataset.
Constructing multiple train splits. Remaining cells in the combinations grid are used to constructmultiple training splits with an increasing percentage of category-pose combinations. For each trainingsplit, we first sample a set of combinations as shown in Fig. 1d, which we call the seen combinations.Then, we build the training data-split by sampling images from these seen combinations. We ensurethat every category and pose occurs equally in the seen combinations, ie., equal numbers of cells pereach row and column. Fig. 1d shows the 50% seen training split for the iLab dataset. To ensure thatwe evaluate the effect of data diversity and not that of the amount of data, the number of images iskept constant across train splits as the percentage of seen combinations is increased. Thus, the numberof images per seen combination decreases as the percentage of seen combinations is increased.
3.2 Architectural Choices
One central question addressed in this paper is the impact of architectural choices on the capability togeneralize to unseen category-pose combinations. Work from Multi-Task Learning [50, 51] literaturesuggests learning the two tasks in the same network can help generalize better when the tasks arerelated. However, recent works suggest that architectures composed of specialized networks for sub-tasks [17–19] help improve generalization to novel conditions in relational visual question-answeringtasks [52]. To see how this architectural choice impacts generalization to unseen category-posecombinations, we defined two backbone agnostic architectures which we refer to as the Sharedand the Separate architectures. Fig. 2 depicts these architectures for a ResNet-18 backbone [1].In the Shared case, all convolutional blocks are shared between tasks, followed by task-specificfully connected layers, while there are no layers shared between tasks in the Separate architecture.Specifically for ResNet-18, we also investigated 3 additional Split architectures which represent agradual transition from Separate to Shared ResNet-18: the Split-1, Split-2, and Split-3 architectures.These were constructed by branching ResNet-18 after 1, 2, and 3 convolutional blocks as comparedto after 4 blocks as in the case of the Shared architecture as shown in Fig. 2. It is important to note
4
that splitting a layer leads to the doubling of the number of neurons in that layer. In the experimentsbelow, we show that this increase in width does not provide an added advantage.
4 Generalization through Selectivity and Invariance of Individual Neurons
Selectivity and invariance of neurons have long been hypothesized to facilitate generalization in bothbiological and artificial neural networks [33–36, 38, 53–55]. Neurons are commonly interpretedas image feature detectors, such that the neuron’s activity is high only when certain features arepresent in the image [56–60]. We refer to this property as selectivity to an image feature. Selectivityalone, however, is not sufficient to generalize to unseen category-pose combinations. For example,a neuron may be selective to features relevant to a category, but only so for a subset of all theposes. Generalization is facilitated by selective neurons that are also invariant to nuisance features.For instance, in Fig. 1a, neurons that are selective to the Ford Thunderbird and invariant to posewould have very similar activity for the Ford Thunderbird in seen and unseen poses, thus enablinggeneralization to category recognition. Similarly, generalization to pose prediction can be enabled byneurons selective to pose and invariant to category.
Here, we present our implementation for quantifying the amount of selectivity and invariance ofan individual neuron. Let N be the number of categories or poses in the dataset. We represent theactivations for a neuron across all category-pose combinations as an N × N activations grid, asshown in Fig. E.16a. Each cell in this activations grid represents the average activation of a neuron forimages from one category-pose combination, with rows and columns representing average activationsfor all images from a single category (e.g., Ford Thunderbird) and a pose (e.g., front), respectively.These activations are normalized to lie between 0 and 1 (see supplement). For neuron k, we define akijas the entry in the activations grid for column (category) i and row (pose) j. Below we introduce theevaluation of a neuron’s selectivity score with respect to category and invariance score with respectto pose. Pose selectivity score and category invariance score can be derived analogously.
Selectivity score. We first identify the category that the neuron is activated for the most on aver-age, ie., the category which has the maximum sum across the column in Fig. E.16a. We call thiscategory the neuron’s preferred category, and denote it as i?k, such that i?k = arg maxi
∑j a
kij . The
selectivity score compares the average activity for the preferred category (denoted as ak) with theaverage activity of the remaining categories (ak). Let Sk
c be the selectivity score with respect tocategory, which we define as is usual in the literature (e.g., [61, 62]) with the following expression:
Skc =
ak − ak
ak + ak, where ak =
1
N
∑
j
aki?kj , ak =
∑i 6=i?k
∑j a
kij
N(N − 1). (1)
Observe that Skc is a value between 0 and 1, and higher values of Sk
c indicate that the neuron is moreactive for the preferred category as compared to the rest. Selectivity with respect to pose, denoted asSkp , can be derived analogously by swapping indices (i, j).
Invariance score. A neuron’s invariance to pose captures the range of its average activity for thepreferred category as the pose (nuisance parameter) is changed. Let Ikp be the invariance score withrespect to pose which we define as the difference between the highest and lowest activity across allposes for the preferred category, ie.,
Ikp = 1 −(
maxj
aki?kj − minj
aki?kj
), (2)
where the range is subtracted from 1 to have the invariance score equal to 1 when there is maximalinvariance. Invariance with respect to category, denoted Ikc , can be derived analogously.
Specialization score. Generalization to category recognition may be facilitated by neurons selectiveto category and invariant to pose. Similarly, pose selective and category invariant neurons can helpgeneralize well to pose estimation. This reveals a tension when category and pose are learned together,as a neuron which is selective to category, cannot be invariant to category. The same is true for pose.One way to resolve this contradiction is the emergence of two sets of specialized neurons - categoryselective and pose invariant, and vice versa. This hypothesis is well-aligned with the findings in [63],which showed the emergence of groups of neurons contributing exclusively to single tasks. Thus,in the context of category recognition and pose estimation, we hypothesize that neurons becomeselective to either category or pose as the relevant image features for these tasks are disjoint.
5

25 50 75% Seen Combinations
0
20
40
60
80
100
Accu
racy
(%)
MNIST-Position
25 50 75% Seen Combinations
0
20
40
60
80
100
Accu
racy
(%)
MNIST-Scale
25 50 75% Seen Combinations
0
20
40
60
80
100
Accu
racy
(%)
iLab
25 50 75% Seen Combinations
0
20
40
60
80
100
Accu
racy
(%)
Biased-Cars
Networkseparateshared
TestSetUnseenSeen
(a) (b) (c) (d)
Figure 3: Generalization performance for Shared and Separate ResNet-18 as seen combinations areincreased for all datasets. The geometric mean between category recognition accuracy and poseestimation accuracy is reported along with confidence intervals (a) MNIST-Scale dataset. (b) MNIST-Position dataset. (c) iLab dataset. (d) Biased-Cars dataset.
To classify neuron k as a category or pose neuron, we compare its selectivity for both category andpose (Sk
c and Skp ). If Sk
c is greater than Skp , then neuron k is a category neuron, otherwise, it is a
pose neuron. Since generalization capability relies on both invariance and selectivity, we introduce anew metric for a neuron, the specialization score denoted as Γk, which is the geometric mean of itsselectivity and invariance scores, ie.,
Γk =
√Skc I
kp if Sk
c > Skp (category neuron)√
Skp I
kc if Sk
c ≤ Skp (pose neuron)
. (3)
In Section 6 we present results that show that the specialization score is highly indicative of anetwork’s capability to generalize to unseen combinations.
5 When do DNNs Generalize to new Category-Pose Combinations?
Below we summarize our findings from evaluating Separate and Shared architectures when testedon images from seen (different from train images) and unseen category-pose combinations. Seesupplement for experimental details.
DNNs generalize better to unseen combinations as they see more combinations. Fig. 3 presentsthe geometric mean of category and pose prediction accuracy for Separate and Shared architectureswith the ResNet-18 backbone, for all datasets. These experiments were repeated three times, andhere we present the mean performance with confidence intervals. As Fig. 3 shows, both architecturesshow a significant improvement in their performance on images from unseen combinations, as theseen combinations are increased. Thus, an increase in data diversity in the form of seen combinationsenables both these architectures to generalize better. It is to be noted that state-of-the-art DNNs donot theoretically guarantee viewpoint invariance [38]. But this result provides reassurance that DNNscan become robust to unseen category-pose combinations as long as they are shown enough diversityduring training. However, the accuracy for both category and pose prediction may not always beincreasing consistently (see supplement), even though their geometric mean (shown above) is alwaysincreasing. We attribute this to the randomness in the selection of seen and unseen combinations.
Separate architectures generalize significantly better than Shared ones. A striking finding thatemerged from our analysis is that while both architectures perform well on new images from seencombinations, for images from unseen combinations Separate architectures outperform Shared onesby a very large margin. For the ResNet-18 backbone, this result can be seen consistently across all 4datasets as shown in Fig. 3. Results for each individual task have been shown in the supplement.
We extended our analysis to Separate and Shared architectures with different backbones (ResNeXt [2],WideResNet [3], Inception v3 [4] and the DenseNet [5]), as shown in Fig. 4a and b. As can beseen, Separate architectures outperform Shared ones by a large margin for all backbones, whichconfirms that this result is not backbone specific. Investigating further, we experiment with Splitarchitectures, and as can be seen in Fig. 4c and d, there is a consistent, gradual dip in the performanceas we move from the Separate to the Shared architectures. Thus, generalization to unseen category-
6

25 50 75% Seen Combinations
0
20
40
60
80
Accu
racy
(%)
iLab
25 50 75% Seen Combinations
0
20
40
60
80
Accu
racy
(%)
Biased-Cars
sep.sh.
densenetinceptionresnextwideresnet
25 50 75% Seen Combinations
0
20
40
60
80
Accu
racy
(%)
iLab
25 50 75% Seen Combinations
0
20
40
60
80
Accu
racy
(%)
Biased-Cars
separatesplit-1split-2
split-3sh.-wideshared
(a) (b) (c) (d)
Figure 4: Generalization performance for different architectures and backbones as seen combinationsare increased for all iLab and Biased-City datasets. The geometric mean between category recogni-tion accuracy and pose recognition accuracy is reported for unseen combinations as percentage ofseen combinations is increased. (a) and (b) Accuracy of separate and shared for backbones otherthan ResNet-18, for iLab and Biased-Cars datasets, respectively. (c) and (d) Accuracy of ResNet-18Separate, Shared and different Split architectures made at different blocks of the network, for iLaband Biased-Cars datasets, respectively.
pose combinations is best achieved by learning both tasks separately, with a consistent decrease ingeneralization as more parameter sharing is enforced.
To make sure that Separate architectures do not perform better due to the added number of neurons,we made the Shared-Wide architecture by doubling the neurons in each layer of the Shared ResNet-18network. As Fig. 4c and d show, this architecture performs very similarly to the Shared one. This isin accordance with previous results that show that modern DNNs may improve in performance as thewidth is increased but to a limited extent [64, 65]. See additional results in supplement along withresults demonstrating that these findings are robust for a different number of training images.
6 How do DNNs Generalize to Unseen Category-Pose Combinations?
We now analyze the role of specialized (ie., selective and invariant) neurons in driving generalizationto unseen category-pose combinations presented in Section 5.
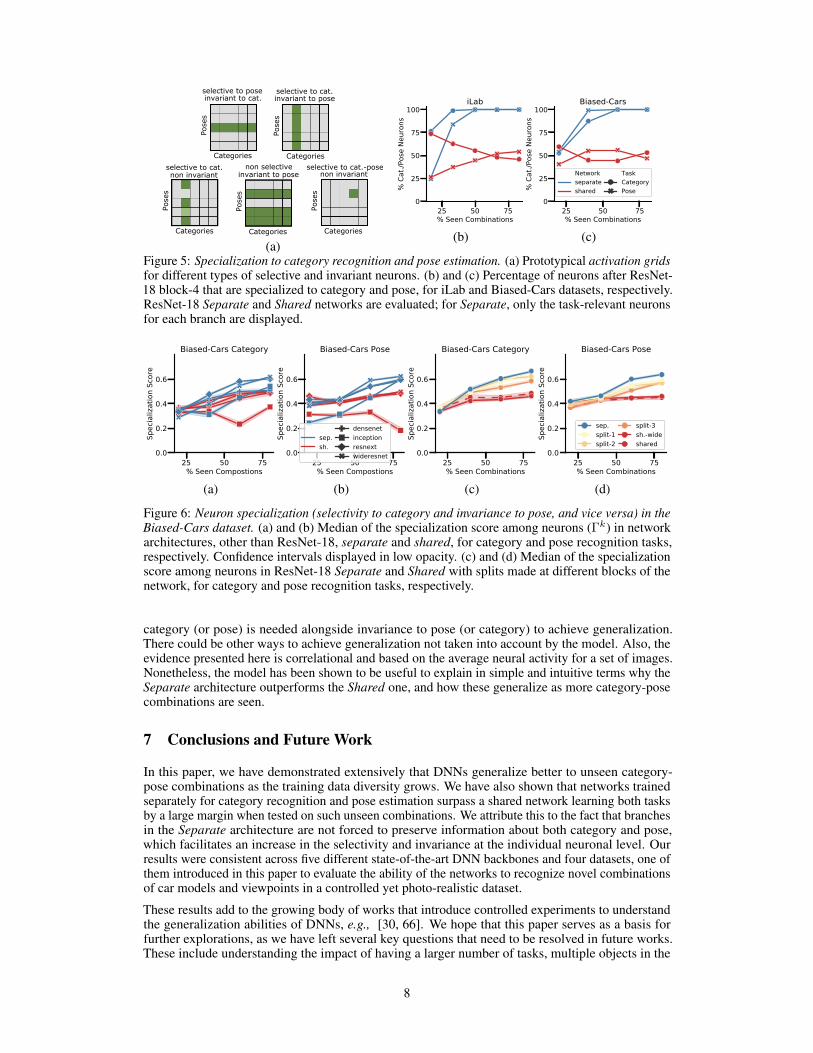
Specialization score correlates with generalization to unseen category-pose. We first investigatethe emergence of category and pose neurons in the final convolutional layer of the networks. Fig. 5band c show the percentage of neurons of each type in Shared and Separate architectures as seencombinations are increased. As can be seen, all neurons in the category and pose branches of theSeparate architecture become specialized to category and pose respectively. But in the Shared case,as the network is expected to simultaneously learn both tasks, both kinds of neurons emerge. InFig. E.16 we present the median of specialization scores across neurons, ie., the median of Γk, in thefinal convolutional layer for Shared, Split, and Separate architectures across multiple backbones inBiased-Cars dataset. These are presented separately for the category and pose neurons. We showthat as seen combinations increase, there is a steady increase in the specialization score for bothcategory and pose neurons, suggesting specialization. These trends mirror the generalization trendsfor networks which suggests that specialization facilitates generalization to unseen combinations. Inthe supplement, we present these results for the other datasets, which support the same conclusions.Also, we show that as expected, the specialization builds up across layers [35, 38].
Separate networks facilitate the emergence of specialized neurons. Fig. E.16 reveals that Separatearchitectures facilitate specialization, while the Shared architecture makes it harder for the neurons tospecialize (lower specialization scores). This might be because the Shared architecture tries to splitinto two specialized parts, but this specialization is much stronger in the Separate architecture dueto already having separate branches. This capability to specialize could explain why the Separatearchitecture generalizes better to unseen category-pose combinations.
Limitations. In this paper, we have considered selectivity and invariance of individual neurons as amodel for understanding generalization to unseen combinations. This model is limited in several waysas it only considers the properties of individual neurons, and assumes that selectivity to one single
7
Categories
selective to cat.invariant to pose
Pose
s
Categories
selective to cat.non invariant
Pose
sCategories
selective to poseinvariant to cat.
Pose
s
Categories
non selectiveinvariant to pose
Pose
sCategories
selective to cat.-pose
Pose
s
non invariant
(a)
25 50 75% Seen Combinations
0
25
50
75
100
% C
at./P
ose
Neur
ons
iLab
25 50 75% Seen Combinations
0
25
50
75
100
% C
at./P
ose
Neur
ons
Biased-Cars
Networkseparateshared
TaskCategoryPose
(b) (c)
Figure 5: Specialization to category recognition and pose estimation. (a) Prototypical activation gridsfor different types of selective and invariant neurons. (b) and (c) Percentage of neurons after ResNet-18 block-4 that are specialized to category and pose, for iLab and Biased-Cars datasets, respectively.ResNet-18 Separate and Shared networks are evaluated; for Separate, only the task-relevant neuronsfor each branch are displayed.
25 50 75% Seen Compostions
0.0
0.2
0.4
0.6
Spec
ializ
atio
n Sc
ore
Biased-Cars Category
25 50 75% Seen Compostions
0.0
0.2
0.4
0.6
Spec
ializ
atio
n Sc
ore
Biased-Cars Pose
sep.sh.
densenetinceptionresnextwideresnet
25 50 75% Seen Combinations
0.0
0.2
0.4
0.6
Spec
ializ
atio
n Sc
ore
Biased-Cars Category
25 50 75% Seen Combinations
0.0
0.2
0.4
0.6
Spec
ializ
atio
n Sc
ore
Biased-Cars Pose
sep.split-1split-2
split-3sh.-wideshared
(a) (b) (c) (d)
Figure 6: Neuron specialization (selectivity to category and invariance to pose, and vice versa) in theBiased-Cars dataset. (a) and (b) Median of the specialization score among neurons (Γk) in networkarchitectures, other than ResNet-18, separate and shared, for category and pose recognition tasks,respectively. Confidence intervals displayed in low opacity. (c) and (d) Median of the specializationscore among neurons in ResNet-18 Separate and Shared with splits made at different blocks of thenetwork, for category and pose recognition tasks, respectively.
category (or pose) is needed alongside invariance to pose (or category) to achieve generalization.There could be other ways to achieve generalization not taken into account by the model. Also, theevidence presented here is correlational and based on the average neural activity for a set of images.Nonetheless, the model has been shown to be useful to explain in simple and intuitive terms why theSeparate architecture outperforms the Shared one, and how these generalize as more category-posecombinations are seen.
7 Conclusions and Future Work
In this paper, we have demonstrated extensively that DNNs generalize better to unseen category-pose combinations as the training data diversity grows. We have also shown that networks trainedseparately for category recognition and pose estimation surpass a shared network learning both tasksby a large margin when tested on such unseen combinations. We attribute this to the fact that branchesin the Separate architecture are not forced to preserve information about both category and pose,which facilitates an increase in the selectivity and invariance at the individual neuronal level. Ourresults were consistent across five different state-of-the-art DNN backbones and four datasets, one ofthem introduced in this paper to evaluate the ability of the networks to recognize novel combinationsof car models and viewpoints in a controlled yet photo-realistic dataset.
These results add to the growing body of works that introduce controlled experiments to understandthe generalization abilities of DNNs, e.g., [30, 66]. We hope that this paper serves as a basis forfurther explorations, as we have left several key questions that need to be resolved in future works.These include understanding the impact of having a larger number of tasks, multiple objects in the
8

image, and non-uniform ways of holing-out the test set across tasks, among others. We are alsointrigued to find out which other factors can lead to an increase in selective and invariant neuralrepresentations, as this can help improve the generalization behaviour of computer vision applications.
Statement of Broader Impact
Many practical applications of deep networks require the ability to robustly extrapolate to noveldata beyond the training set. With the prevalence of DNNs increasing at an unprecedented rate,understanding the capabilities and limitations of DNNs to generalize is of paramount importance.With this work, we hope to have contributed to the use of deep networks in our society positivelyin three concrete ways. Firstly, our findings can reassure practitioners that DNNs can generalizeto unseen category-pose combinations, as long as enough data diversity is ensured in the trainingdataset. Secondly, these results can help practitioners make informed architectural choices, helpingthem build networks that may extrapolate to unseen situations more robustly. Finally, we put forth asimple model for understanding the underlying mechanisms driving the generalization of DNNs atthe individual neuron level.
Acknowledgments and Disclosure of Funding
We are grateful to Tomaso Poggio for his insightful advice and warm encouragement. This workhas been partially supported by NSF grant IIS-1901030, a Google Faculty Research Award, theToyota Research Institute, the Center for Brains, Minds and Machines (funded by NSF STC awardCCF-1231216), Fujitsu Laboratories Ltd. (Contract No. 40008819) and the MIT-Sensetime Allianceon Artificial Intelligence. We also thank Kumaraditya Gupta for help with the figures, and PrafullSharma for insightful discussions.
References[1] Kaiming He, Xiangyu Zhang, Shaoqing Ren, and Jian Sun. Deep residual learning for im-
age recognition. In Proceedings of the IEEE Conference on Computer Vision and PatternRecognition (CVPR), pages 770–778, 2016.
[2] Saining Xie, Ross Girshick, Piotr Dollár, Zhuowen Tu, and Kaiming He. Aggregated residualtransformations for deep neural networks. In Proceedings of the IEEE Conference on ComputerVision and Pattern Recognition (CVPR), pages 1492–1500, 2017.
[3] Sergey Zagoruyko and Nikos Komodakis. Wide residual networks. In Proceedings of the BritishMachine Vision Conference (BMVC), pages 87.1–87.12, 2016.
[4] Christian Szegedy, Vincent Vanhoucke, Sergey Ioffe, Jon Shlens, and Zbigniew Wojna. Re-thinking the inception architecture for computer vision. In Proceedings of the IEEE Conferenceon Computer Vision and Pattern Recognition (CVPR), pages 2818–2826, 2016.
[5] Gao Huang, Zhuang Liu, Laurens Van Der Maaten, and Kilian Q Weinberger. Densely connectedconvolutional networks. In Proceedings of the IEEE Conference on Computer Vision and PatternRecognition (CVPR), pages 4700–4708, 2017.
[6] Weicheng Kuo, Bharath Hariharan, and Jitendra Malik. Deepbox: Learning objectness withconvolutional networks. In Proceedings of the IEEE International Conference on ComputerVision (ICCV), pages 2479–2487, 2015.
[7] Yaming Wang, Xiao Tan, Yi Yang, Xiao Liu, Errui Ding, Feng Zhou, and Larry S Davis. 3Dpose estimation for fine-grained object categories. In Proceedings of the European Conferenceon Computer Vision (ECCV) Workshop, pages 619–632, 2018.
[8] Chen Wang, Danfei Xu, Yuke Zhu, Roberto Martín-Martín, Cewu Lu, Li Fei-Fei, and SilvioSavarese. DenseFusion: 6D object pose estimation by iterative dense fusion. In Proceedings ofthe IEEE Conference on Computer Vision and Pattern Recognition (CVPR), pages 3343–3352,2019.
9

[9] Yang Xiao, Xuchong Qiu, Pierre-Alain Langlois, Mathieu Aubry, and Renaud Marlet. Posefrom shape: Deep pose estimation for arbitrary 3D objects. In Proceedings of the BritishMachine Vision Conference (BMVC), 2019.
[10] Jifeng Dai, Yi Li, Kaiming He, and Jian Sun. R-FCN: Object detection via region-based fullyconvolutional networks. In Advances in Neural Information Processing Systems, pages 379–387,2016.
[11] Joseph Redmon and Ali Farhadi. YOLO9000: better, faster, stronger. In Proceedings of theIEEE Conference on Computer Vision and Pattern Recognition (CVPR), pages 7263–7271,2017.
[12] Cheng-Yang Fu, Wei Liu, Ananth Ranga, Ambrish Tyagi, and Alexander C Berg. DSSD:Deconvolutional single shot detector. arXiv preprint arXiv:1701.06659, 2017.
[13] Li Liu, Wanli Ouyang, Xiaogang Wang, Paul Fieguth, Jie Chen, Xinwang Liu, and MattiPietikäinen. Deep learning for generic object detection: A survey. International Journal ofComputer Vision, 128(2):261–318, 2020.
[14] Xiongwei Wu, Doyen Sahoo, and Steven CH Hoi. Recent advances in deep learning for objectdetection. Neurocomputing, 2020.
[15] Jiaping Zhao, Chin-kai Chang, and Laurent Itti. Learning to recognize objects by retainingother factors of variation. In Proceedings of the IEEE Winter Conference on Applications ofComputer Vision (WACV), pages 560–568. IEEE, 2017.
[16] Asako Kanezaki, Yasuyuki Matsushita, and Yoshifumi Nishida. RotationNet for joint objectcategorization and unsupervised pose estimation from multi-view images. IEEE Transactionson Pattern Analysis and Machine Intelligence, 2019.
[17] Jacob Andreas, Marcus Rohrbach, Trevor Darrell, and Dan Klein. Neural module networks.In Proceedings of the IEEE Conference on Computer Vision and Pattern Recognition (CVPR),pages 39–48, 2016.
[18] Ronghang Hu, Jacob Andreas, Marcus Rohrbach, Trevor Darrell, and Kate Saenko. Learningto reason: End-to-end module networks for visual question answering. In Proceedings of theIEEE International Conference on Computer Vision (ICCV), pages 804–813, 2017.
[19] Justin Johnson, Bharath Hariharan, Laurens Van Der Maaten, Judy Hoffman, Li Fei-Fei,C Lawrence Zitnick, and Ross Girshick. Inferring and executing programs for visual reasoning.In Proceedings of the IEEE International Conference on Computer Vision (ICCV), pages2989–2998, 2017.
[20] Seung Wook Kim, Makarand Tapaswi, and Sanja Fidler. Visual reasoning by progressivemodule networks. In Proceedings of the International Conference on Learning Representations(ICLR), 2019.
[21] Jeffrey Donahue, Lisa Anne Hendricks, Sergio Guadarrama, Marcus Rohrbach, SubhashiniVenugopalan, Kate Saenko, and Trevor Darrell. Long-term recurrent convolutional networks forvisual recognition and description. In The IEEE Conference on Computer Vision and PatternRecognition (CVPR), 2015.
[22] Marco Pedersoli, Thomas Lucas, Cordelia Schmid, and Jakob Verbeek. Areas of attention forimage captioning. In Proceedings of the IEEE International Conference on Computer Vision(ICCV), pages 1242–1250, 2017.
[23] Jiasen Lu, Caiming Xiong, Devi Parikh, and Richard Socher. Knowing when to look: Adaptiveattention via a visual sentinel for image captioning. In Proceedings of the IEEE Conference onComputer Vision and Pattern Recognition (CVPR), pages 375–383, 2017.
[24] Yufei Wang, Zhe Lin, Xiaohui Shen, Scott Cohen, and Garrison W Cottrell. Skeleton key:Image captioning by skeleton-attribute decomposition. In Proceedings of the IEEE Conferenceon Computer Vision and Pattern Recognition (CVPR), pages 7272–7281, 2017.
10
[25] Xu Yang, Hanwang Zhang, and Jianfei Cai. Learning to collocate neural modules for imagecaptioning. In Proceedings of the IEEE International Conference on Computer Vision (ICCV),pages 4250–4260, 2019.
[26] Logan Engstrom, Brandon Tran, Dimitris Tsipras, Ludwig Schmidt, and Aleksander Madry.Exploring the landscape of spatial robustness. In Proceedings of the International Conferenceon Machine Learning (ICML), pages 1802–1811, 2019.
[27] Aharon Azulay and Yair Weiss. Why do deep convolutional networks generalize so poorly tosmall image transformations? Journal of Machine Learning Research, 20(184):1–25, 2019.
[28] Sanjana Srivastava, Guy Ben-Yosef, and Xavier Boix. Minimal images in deep neural networks:Fragile object recognition in natural images. In Proceedings of the International Conference onLearning Representations (ICLR), 2019.
[29] Michael A Alcorn, Qi Li, Zhitao Gong, Chengfei Wang, Long Mai, Wei-Shinn Ku, and AnhNguyen. Strike (with) a pose: Neural networks are easily fooled by strange poses of familiarobjects. In Proceedings of the IEEE Conference on Computer Vision and Pattern Recognition(CVPR), pages 4845–4854, 2019.
[30] Andrei Barbu, David Mayo, Julian Alverio, William Luo, Christopher Wang, Dan Gutfreund,Josh Tenenbaum, and Boris Katz. ObjectNet: A large-scale bias-controlled dataset for pushingthe limits of object recognition models. In Advances in Neural Information Processing Systems,pages 9448–9458, 2019.
[31] Ali Borji, Saeed Izadi, and Laurent Itti. iLab-20M: A large-scale controlled object datasetto investigate deep learning. In Proceedings of the IEEE Conference on Computer Visionand Pattern Recognition (CVPR), pages 2221–2230, 2016. The dataset is available at https://bmobear.github.io/projects/viva/.
[32] C Lee Giles and Tom Maxwell. Learning, invariance, and generalization in high-order neuralnetworks. Applied Optics, 26(23):4972–4978, 1987.
[33] Emanuela Bricolo, Tomaso Poggio, and Nikos K Logothetis. 3D object recognition: A modelof view-tuned neurons. In Advances in Neural Information Processing Systems, pages 41–47,1997.
[34] Maximilian Riesenhuber and Tomaso Poggio. Just one view: Invariances in inferotemporal celltuning. In Advances in Neural Information Processing Systems, pages 215–221, 1998.
[35] Ian Goodfellow, Honglak Lee, Quoc V Le, Andrew Saxe, and Andrew Y Ng. Measuringinvariances in deep networks. In Advances in Neural Information Processing Systems, pages646–654, 2009.
[36] Jure Sokolic, Raja Giryes, Guillermo Sapiro, and Miguel Rodrigues. Generalization error ofinvariant classifiers. In Proceedings of the International Conference on Artifi-cial Intelligenceand Statistics (AISTATS), pages 1094–1103, 2017.
[37] Alessandro Achille and Stefano Soatto. Emergence of invariance and disentanglement in deeprepresentations. The Journal of Machine Learning Research, 19(1):1947–1980, 2018.
[38] Tomaso Poggio and Fabio Anselmi. Visual cortex and deep networks: learning invariantrepresentations. MIT Press, 2016.
[39] Yann LeCun, Léon Bottou, Yoshua Bengio, and Patrick Haffner. Gradient-based learningapplied to document recognition. Proceedings of the IEEE, 86(11):2278–2324, 1998. Thedataset is available at http://yann.lecun.com/exdb/mnist/.
[40] Weichao Qiu and Alan Yuille. UnrealCV: Connecting computer vision to Unreal Engine. InProceedings of the European Conference on Computer Vision (ECCV), pages 909–916, 2016.
[41] Holger Caesar, Varun Bankiti, Alex H Lang, Sourabh Vora, Venice Erin Liong, Qiang Xu,Anush Krishnan, Yu Pan, Giancarlo Baldan, and Oscar Beijbom. nuScenes: A multimodaldataset for autonomous driving. arXiv preprint arXiv:1903.11027, 2019.
11
[42] Alexey Dosovitskiy, German Ros, Felipe Codevilla, Antonio Lopez, and Vladlen Koltun.CARLA: An open urban driving simulator. In Proceedings of the Annual Conference on RobotLearning (CoRL), pages 1–16, 2017.
[43] Rawal Khirodkar, Donghyun Yoo, and Kris Kitani. Domain randomization for scene-specific cardetection and pose estimation. In 2019 IEEE Winter Conference on Applications of ComputerVision (WACV), pages 1932–1940. IEEE, 2019.
[44] Aayush Prakash, Shaad Boochoon, Mark Brophy, David Acuna, Eric Cameracci, Gavriel State,Omer Shapira, and Stan Birchfield. Structured domain randomization: Bridging the reality gapby context-aware synthetic data. In Proceedings of the International Conference on Roboticsand Automation (ICRA), pages 7249–7255. IEEE, 2019.
[45] Yohann Cabon, Naila Murray, and Martin Humenberger. Virtual KITTI 2. arXiv preprintarXiv:2001.10773, 2020.
[46] Adrien Gaidon, Qiao Wang, Yohann Cabon, and Eleonora Vig. Virtual worlds as proxy formulti-object tracking analysis. In Proceedings of the IEEE Conference on Computer Vision andPattern Recognition (CVPR), pages 4340–4349, 2016.
[47] Matt Pharr, Wenzel Jakob, and Greg Humphreys. Physically based rendering: From theory toimplementation. Morgan Kaufmann, 2016.
[48] Yinda Zhang, Shuran Song, Ersin Yumer, Manolis Savva, Joon-Young Lee, Hailin Jin, andThomas Funkhouser. Physically-based rendering for indoor scene understanding using convolu-tional neural networks. In Proceedings of the IEEE Conference on Computer Vision and PatternRecognition (CVPR), pages 5287–5295, 2017.
[49] Shirsendu Sukanta Halder, Jean-François Lalonde, and Raoul de Charette. Physics-basedrendering for improving robustness to rain. In Proceedings of the IEEE International Conferenceon Computer Vision (CVPR), pages 10203–10212, 2019.
[50] Rich Caruana. Multitask learning. Machine learning, 28(1):41–75, 1997.
[51] Trapit Bansal, Arvind Neelakantan, and Andrew McCallum. RelNet: End-to-end modeling ofentities & relations. arXiv preprint arXiv:1706.07179, 2017.
[52] Dzmitry Bahdanau, Shikhar Murty, Michael Noukhovitch, Thien Huu Nguyen, Harm de Vries,and Aaron Courville. Systematic generalization: What is required and can it be learned? InProceedings of the International Conference on Learning Representations (ICLR), 2019.
[53] Bruno A Olshausen, Charles H Anderson, and David C Van Essen. A neurobiological modelof visual attention and invariant pattern recognition based on dynamic routing of information.Journal of Neuroscience, 13(11):4700–4719, 1993.
[54] R Quian Quiroga, Leila Reddy, Gabriel Kreiman, Christof Koch, and Itzhak Fried. Invariantvisual representation by single neurons in the human brain. Nature, 435(7045):1102–1107,2005.
[55] Nicole C Rust and James J DiCarlo. Selectivity and tolerance (“invariance”) both increase asvisual information propagates from cortical area V4 to IT. Journal of Neuroscience, 30(39):12978–12995, 2010.
[56] Matthew D Zeiler and Rob Fergus. Visualizing and understanding convolutional networks. InEuropean conference on computer vision, pages 818–833. Springer, 2014.
[57] Karen Simonyan, Andrea Vedaldi, and Andrew Zisserman. Deep inside convolutional networks:Visualising image classification models and saliency maps. arXiv preprint arXiv:1312.6034,2013.
[58] Bolei Zhou, Aditya Khosla, Agata Lapedriza, Aude Oliva, and Antonio Torralba. Objectdetectors emerge in deep scene cnns. In Proceedings of the International Conference onLearning Representations (ICLR), 2015.
12

[59] David Bau, Bolei Zhou, Aditya Khosla, Aude Oliva, and Antonio Torralba. Network dissec-tion: Quantifying interpretability of deep visual representations. In Proceedings of the IEEEConference on Computer Vision and Pattern Recognition (CVPR), pages 6541–6549, 2017.
[60] Maxime Oquab, Léon Bottou, Ivan Laptev, and Josef Sivic. Is object localization for free?-weakly-supervised learning with convolutional neural networks. In Proceedings of the IEEEConference on Computer Vision and Pattern Recognition (CVPR), pages 685–694, 2015.
[61] Ari S Morcos, David GT Barrett, Neil C Rabinowitz, and Matthew Botvinick. On the importanceof single directions for generalization. In Proceedings of the International Conference onLearning Representations (ICLR), 2018.
[62] Bolei Zhou, Yiyou Sun, David Bau, and Antonio Torralba. Revisiting the importance ofindividual units in cnns via ablation. arXiv preprint arXiv:1806.02891, 2018.
[63] Guangyu Robert Yang, Madhura R Joglekar, H Francis Song, William T Newsome, and Xiao-Jing Wang. Task representations in neural networks trained to perform many cognitive tasks.Nature Neuroscience, 22(2):297–306, 2019.
[64] Preetum Nakkiran, Gal Kaplun, Yamini Bansal, Tristan Yang, Boaz Barak, and IlyaSutskever. Deep double descent: Where bigger models and more data hurt. arXiv preprintarXiv:1912.02292, 2019.
[65] Stephen Casper, Xavier Boix, Vanessa D’Amario, Ling Guo, Kasper Vinken, and GabrielKreiman. Removable and/or repeated units emerge in overparametrized deep neural networks.arXiv preprint arXiv:1912.04783, 2019.
[66] Adam Kortylewski, Bernhard Egger, Andreas Schneider, Thomas Gerig, Andreas Morel-Forster,and Thomas Vetter. Empirically analyzing the effect of dataset biases on deep face recognitionsystems. In Proceedings of the IEEE Conference on Computer Vision and Pattern RecognitionWorkshops, pages 2093–2102, 2018.
[67] Pascal Mueller, Simon Haegler, Andreas Ulmer, Matthias Schubiger, Stefan Müller Arisona, andBasil Weber. Esri CityEngine - a 3D city modeling software for urban design, visual effects, andVR/AR. Esri R&D Center Zurich, Accessed 2020. URL http://www.esri.com/cityengine.
[68] Blender Online Community. Blender - a 3D modelling and rendering package. BlenderFoundation, Stichting Blender Foundation, Amsterdam, Accessed 2020. URL http://www.blender.org.
[69] Antonio Torralba and Alexei A Efros. Unbiased look at dataset bias. In Proceedings of the IEEEConference on Computer Vision and Pattern Recognition (CVPR), pages 1521–1528, 2011.
[70] Diederik P Kingma and Jimmy Ba. Adam: A method for stochastic optimization. arXiv preprintarXiv:1412.6980, 2014.
13

A Additional details on Datasets (Section 2)
A.1 Samples from MNIST-Position and MNIST-Scale datasets
Fig. A.7 presents one representative example for each category-pose combination through the combi-nations grid for the MNIST-Position and MNIST-Scale datasets.
(a) MNIST-Position (b) MNIST-Scale
Figure A.7: Combinations grids for MNIST-Position and MNIST-Scale. Each row represents imagesfrom a category and each column from a pose. (a) MNIST-Position was created by adding pose in theform of position to images. For this, MNIST images were placed into one of nine positions in anempty three-by-three grid with equal probability. (b) MNIST-Scale was created by resizing imagesfrom MNIST to one of nine possible sizes, and then zero-padding.
A.2 Rendering Pipeline for Biased-Cars Dataset
To generate photo-realistic data with systematic, controlled biases we implemented our computergraphics pipeline which offered us fine grained control over scene attributes including but not limitedto - backgrounds, textures, lighting and geometry. Below we present the details of our renderingpipeline, along with some sample images.
Pipeline Details: We used Esri CityEngine [67] to model the city layout and geometry, to which weadd 3D assets - car models, pedestrians, trees, street furniture like bus stops, textures for buildings,roads and car paints. Blender Python API [68] is used to modify the 3D city file. This includes placingvehicles and other assets at user defined locations, modifying their material properties includingvehicle paint, adding specified textures to roads, buildings and pedestrians, and defining cameraattributes (lens, field of view, motion blur etc) and camera locations. For randomization, a distributionover each parameters was defined. For instance, a discrete uniform distribution over possible carcolor paints. Similarly, we defined distributions over object positions in the city, camera viewpointand distance, among other factors.
Sample images are shown in Fig. A.8 below, rendered at 1024 × 1024 pixels. As network inputwas 224 × 224, training images were rendered at 256 × 256 and then resized to 224 × 224 (as sidelength of the form 2k lead to computational gains in physically based rendering). Physically basedrendering accurately models the flow of light in the scene resulting in highly photo-realistic images.As can be seen, our pipeline reproduces lighting artefacts like color bleeding and specular highlightsvery gracefully. As shown, images include cars seen from different distances and viewpoints, underdifferent lighting conditions, scene clutter and even occlusions.
14

Figure A.8: Sample images from the Biased-Cars dataset.
15

B Experimental Details and Hyper-Parameters (Section 3)
Each of our four datasets contains both category and pose labels for all images. We define the locationand the scale as the pose for MNIST-Position and MNIST-Scale datasets respectively. For both iLaband Biased-Cars dataset, the pose refers to the azimuth viewpoint. Networks are trained to predictboth category and pose labels simultaneously, and all models are trained from scratch, without anypre-training to ensure controlled testing. This ensures that any existing biases in common pre-trainingdatasets like ImageNet [69] do not impact our results.
Number of Images: The number of training images is kept fixed for every dataset, and was decidedby training networks on these datasets while gradually increasing size, till the performance on unseencombinations saturated. For the Biased-Cars dataset, performance plateaud at 3,400 train, 445validation, and 800 unseen test images. For iLab, we used 70,000 train, 8,000 validation images,and 8,000 unseen test images. As the iLab dataset is a natural image dataset, it required much moreimages to saturate. For MNIST, 54,000 train, 8,000 validation and 8,000 test images were used.
Hyper-parameters: We used the Adam [70] optimizer with 0.001 as learning rate, and ReLUactivations. For the Biased-Cars datasets, all models were trained for 200 epochs, while we trainedfor 50 epochs for the iLab dataset. MNIST-Position and MNIST-Scale were trained for 5 epochs.These stopping criterion were picked to ensure convergence on generalization to unseen combinations.All experiments were repeated multiple times and confidence intervals are shown in the plots in themain paper. iLab and Biased-Cars experiments were repeated 3 times each, and MNIST experimentswere repeated 10 times. Loss for training Shared architectures was simply the sum of CrossEntropyLoss for both category and Pose prediction. We compared how different weighted sums perform, andfound this to be performing best as measured by the geometric mean of category and pose prediction.
C Selectivity and Invariance (Section 4)
In the paper we defined the selectivity score of a neuron with respect to category and its invariancescore with respect to pose. Following the same notation as the paper: akij denotes the activations gridfor neuron k, where each row represents one category and each column represents a pose.
C.1 Normalization of activations grid
For every neuron, we first normalize its activations for every image by dividing them by its maximumactivation across all images. This ensures that that the activation for every image lies between 0 and 1for all neurons. The entries of the activations grid for a neuron are then computed by averaging thesenormalized activation for images belonging to each category-pose combination.
The activations grid is then normalized to be between 0 and 1. To do so, we subtract the minimum ofthe activations grid and then divide it by the maximum.
C.2 Selectivity and Invariance with respect to Pose
In the paper, we used i?k, Skc , Ikp to denote the preferred category, selectivity score with respect to
category and invariance score with respect to pose respectively. We also presented these equations tocompute these quantities:
i?k = arg maxi
∑
j
akij . (C.4)
Skc =
ak − ak
ak + ak, where ak =
1
N
∑
j
aki?kj , ak =
∑i 6=i?k
∑j a
kij
N(N − 1). (C.5)
Ikp = 1 −(
maxj
aki?kj − minj
aki?kj
)(C.6)
16

We now present how to compute the selectivity with respect to pose, and invariance with respect tocategory, denoted as Sk
p and Ikc respectively. These can be obtained by first finding the preferredpose, denoted as j?k, and proceeding as in the above equations:
j?k = arg maxj
∑
i
akij . (C.7)
Skp =
ak − ak
ak + ak, where ak =
1
N
∑
i
akij?k , ak =
∑j 6=j?k
∑i a
kij
N(N − 1). (C.8)
Ikc = 1 −(
maxi
akij?k − mini
akij?k)
(C.9)
Observe that like Skc , Sk
p is a value between 0 and 1, and higher value indicates that the neuron ismore active for the preferred pose as compared to the rest of the poses. Ikc too is a value between0 and 1, with higher values indicating higher invariance to the category for images containing thepreferred pose.
D Additional Results for Section 5
Below we present additional results that re-inforce our findings presented in Section 5 of the mainpaper.
D.1 Number of Training examples
To ensure that our findings are not a function of the amount of training data, we present the resultsfor different number of images for the Biased-Cars and the iLab dataset in Fig. D.9. As can be seenin both these datasets, across a different number of images the Separate architecture substantiallyoutperforms the Shared one at generalizing to unseen category-pose combinations.
20 40 60 80% Seen Combinations
0
20
40
60
80
100
Accu
racy
(%)
Biased-Cars3500 Images2500 Images1500 Images
SeparateShared
25 50 75% Seen Combinations
0
20
40
60
80
100
Accu
racy
(%)
iLab70000 Images35000 Images17500 Images8750 Images
SeparateShared
Figure D.9: Generalization to unseen combinations as number of training images is varied. For bothiLab and Biased-Cars dataset, Separate architecture outperforms the Shared architecture trained withthe same number of images.
D.2 Number of neurons in shared vs. separate networks
To control for the number of neurons in Shared and Separate architectures, we present additionalresults with the Biased-Cars dataset in Fig. D.10. In the paper, we presented the Shared-Wide
17

architecture for the ResNet-18 backbone, which is the Shared architecture with double the number ofneurons per layer, ie., double the width. Here we go one step further and test a number of similarscenarios with the ResNet-18 backbone. The Separate Half and Separete One Fourth architecturesare made by reducing the number of neurons in every layer to one half, and one fourth of the originalnumber respectively. It is to be noted, that the Separate architectures has double the number ofneurons as the Shared architecture, as there is no weight sharing between branches in the Separatecase. Thus, the Separate Half architecture has the same number of neurons as the Shared architecture,and the Separate architecture has the same number as the Shared-Wide architecture. In a similarvein, the Shared Four Times was created by multiplying the neurons in each layer of the Sharedarchitecture four times. Thus, the Shared Four Times has double the number of neurons as comparedto the Shared Wide architecture, and 4 times the Shared architecture.
As can be seen in Fig. D.10, even at one-eighth number of neurons, the Separate One Fourtharchitecture substantially outperforms the Shared Four Times architecture at generalizing to unseencategory-pose combinations. This confirms that our findings are not a function of the number ofneurons in the Shared and Separate architectures.
20 40 60 80% Seen Combinations
0
20
40
60
80
100
Accu
racy
(%)
Biased-Cars
ResNet18ResNeXtDenseNetWide-ResNet
SeparateShared WideShared
25 50 75% Seen Combinations
0
20
40
60
80
100
Accu
racy
(%)
Biased-Cars
SeparateSep. HalfSep. One FourthSharedSh. WideSh. Four Times
Figure D.10: Generalization to unseen combinations as number of neurons per layer are varied forthe ResNet-18 backbone. Separate architectures substantially outperform Shared architectures acrossa range of widths, ie., number of neurons per layer. The Separate architecture contains double theparameters as the Shared architecture, as there is no weight sharing in the Separate case. Variants ofthese architectures are created by increasing or decreasing the neurons in each layer by a factor of 2 ata time. Even at one-eighth the number of neurons, the Separate One Fourth architecture generalizesmuch better to unseen combinations as compared to the Shared Four Times architecture.
D.3 Separate performance of Category and Pose prediction
In Fig. E.12, we show that accuracy for category and pose prediction in unseen category-pose combi-nations. The results show that Separate also obtains better accuracy than Shared for each individualtask accuracy. Note that depending on the dataset, category or pose predictions have different degreesof difficulty and not always category recognition is more difficult than pose estimation.
Furthermore, we have found that for MNIST-Position, the pooling operation at the end of ResNet-18is critical to obtain good generalization accuracy to unseen category-pose combinations. We evaluatedResNet-18 without the pooling operation and the category recognition accuracy of unseen category-pose combinations dropped to baseline. Pooling facilitates an increase of position invariance and itdoes not harm the pose estimation accuracy (as shown by [27], pooling does not remove the positioninformation).
18

25 50 75% Seen Combinations
0
20
40
60
80
100
Accu
racy
(%)
MNIST-Position
25 50 75% Seen Combinations
0
20
40
60
80
100
Accu
racy
(%)
MNIST-Scale
25 50 75% Seen Combinations
0
20
40
60
80
100
Accu
racy
(%)
iLab
25 50 75% Seen Combinations
0
20
40
60
80
100
Accu
racy
(%)
Biased-Cars
Networkseparateshared
TaskCategoryPose
(a) (b) (c) (d)
Figure D.11: Generalization performance for Shared and Separate ResNet-18 as seen combinationsare increased for all datasets. The category recognition accuracy and pose estimation accuracyare reported along with confidence intervals (a) MNIST-Position dataset. (b) MNIST-Scale dataset.(c) iLab dataset. (d) Biased-Cars dataset.
E Additional Results for Section 6
E.1 Specialization for other datasets
In the main paper we have presented specialization scores for the iLab and Biased-Cars dataset.Here we also provide these for the MNIST-Position and MNIST-Scale datasets. As can be seen,our findings are consistent across these datasets as well. Fig E.12a and b show that neurons in thefinal convolutional layer specialize to become either category or pose neurons as more category-posecombinations are shown. Category and pose branches of the Separate architecture become completelyspecialized to category and pose respectively. In the Shared architecture, both kinds of neuronsemerge in roughly equal numbers. Fig E.12c and d show that as the number of seen combinationsare increased, there is a steady increase in the specialization score for both MNIST-Position andMNIST-Scale.
In Fig. E.13, we show that the selectivity score results are also consistent in iLab for differentbackbones and split architectures.
25 50 75% Seen Combinations
0
25
50
75
100
% C
at./P
ose
Neur
ons
MNIST-Position
25 50 75% Seen Combinations
0
25
50
75
100
% C
at./P
ose
Neur
ons
MNIST-Scale
25 50 75% Seen Combinations
0.0
0.2
0.4
Spec
ializ
atio
n Sc
ore
MNIST-Position
25 50 75% Seen Combinations
0.0
0.2
0.4
Spec
ializ
atio
n Sc
ore
MNIST-Scale
Networksharedseparate
TaskCategoryPose
(a) (b) (c) (d)
Figure E.12: Neuron specialization in MNIST-Position and MNIST-Scale datasets. (a) and (b)Percentage of neurons in the final convolutional layer of ResNet-18 that are specialized to categoryand pose, for MNIST-Position and MNIST-Scale datasets, respectively. (c) and (d) Median of thespecialization scores of neurons in the final convolutional layer of ResNet-18 Separate and Sharedarchitectures, for category and pose recognition tasks, respectively.
E.2 Invariance and Selectivity Scores
In Fig. E.14 and E.15, we show the invariance and selectivity scores separately for the Biased-Carsdataset. In both cases, the trends follow what we observed for the specialization score, though thedifferences are much more pronounced in terms of invariance rather than selectivity.
19

25 50 75% Seen Compostions
0.0
0.2
0.4
0.6
Spec
ializ
atio
n Sc
ore
iLab Category
25 50 75% Seen Compostions
0.0
0.2
0.4
0.6
Spec
ializ
atio
n Sc
ore
iLab Pose
sep.sh.
densenetresnextwideresnet
25 50 75% Seen Combinations
0.0
0.2
0.4
0.6
Spec
ializ
atio
n Sc
ore
iLab Category
25 50 75% Seen Combinations
0.0
0.2
0.4
0.6
Spec
ializ
atio
n Sc
ore
iLab Posesep.split-1split-2
split-3sh.-wideshared
(a) (b) (c) (d)
Figure E.13: Neuron specialization (selectivity to category and invariance to pose, and vice versa)in the iLab dataset. (a) and (b) Median of the specialization score among neurons (Γk) in networkarchitectures, other than ResNet-18, separate and shared, for category and pose recognition tasks,respectively. Confidence intervals displayed in low opacity. (c) and (d) Median of the specializationscore among neurons in ResNet-18 Separate and Shared with splits made at different blocks of thenetwork, for category and pose recognition tasks, respectively. Similar results for the Biased-Carsdataset are provided in the main paper.
25 50 75% Seen Compostions
0.0
0.2
0.4
0.6
Inva
rianc
e Sc
ore
Biased-Cars Category
25 50 75% Seen Compostions
0.0
0.2
0.4
0.6
Inva
rianc
e Sc
ore
Biased-Cars Pose
sep.sh.
densenetinceptionresnextwideresnet
25 50 75% Seen Combinations
0.0
0.2
0.4
0.6In
varia
nce
Scor
e
Biased-Cars Category
25 50 75% Seen Combinations
0.0
0.2
0.4
0.6
Inva
rianc
e Sc
ore
Biased-Cars Pose
sep.split-1split-2
split-3sh.-wideshared
(a) (b) (c) (d)
Figure E.14: Invariance scores in the Biased-Cars dataset. (a) and (b) Median of the invariance scoreamong neurons in network architectures, other than ResNet-18, separate and shared, for categoryand pose recognition tasks, respectively. Confidence intervals displayed in low opacity. (c) and (d)Median of the invariance score among neurons in ResNet-18 Separate and Shared with splits made atdifferent blocks of the network, for category and pose recognition tasks, respectively.
25 50 75% Seen Compostions
0.0
0.2
0.4
0.6
Sele
ctiv
ity S
core
Biased-Cars Category
25 50 75% Seen Compostions
0.0
0.2
0.4
0.6
Sele
ctiv
ity S
core
Biased-Cars Pose
sep.sh.
densenetinceptionresnextwideresnet
25 50 75% Seen Combinations
0.0
0.2
0.4
0.6
Sele
ctiv
ity S
core
Biased-Cars Category
25 50 75% Seen Combinations
0.0
0.2
0.4
0.6
Sele
ctiv
ity S
core
Biased-Cars Pose
sep.split-1split-2
split-3sh.-wideshared
(a) (b) (c) (d)
Figure E.15: Selectivity scores in the Biased-Cars dataset. (a) and (b) Median of the selectivity scoreamong neurons in network architectures, other than ResNet-18, separate and shared, for categoryand pose recognition tasks, respectively. Confidence intervals displayed in low opacity. (c) and (d)Median of the selectivity score among neurons in ResNet-18 Separate and Shared with splits made atdifferent blocks of the network, for category and pose recognition tasks, respectively.
E.3 Specialization Score per Layer
In Fig. E.16, we show the specialization score in each layer. We can see that it builds up across layers,and this is more pronounced for Separate architectures than for Shared.
20

0 1 2 3 4layer
0.0
0.2
0.4
0.6
Spec
ializ
atio
n Sc
ore
iLab Category
0 1 2 3 4layer
0.0
0.2
0.4
0.6
Spec
ializ
atio
n Sc
ore
iLab Pose
0 1 2 3 4layer
0.0
0.2
0.4
0.6
Spec
ializ
atio
n Sc
ore
Biased-Cars Category
0 1 2 3 4layer
0.0
0.2
0.4
0.6
Spec
ializ
atio
n Sc
ore
Biased-Cars Pose
sep.split-1split-2
split-3sh.-wideshared
(a) (b) (c) (d)
Figure E.16: Specialization Score Per Layer for 30 seen category-pose Combinations for iLab,and 20 seen category-pose Combinations for the Biased-Cars dataset. (a) and (b) Median of thespecialization score among neurons in ResNet-18 Separate and Shared with splits made at differentblocks of the network, for category and pose recognition tasks, respectively. (c) and (d) Same as (a)and (b) for Biased-Cars dataset.
21


![Dichotomize and Generalize: PAC-Bayesian Binary ...2009], that we adapt to deep neural networks. The term binary neural networks has been coined by Bengio[2009], and further studied](https://static.fdocuments.us/doc/165x107/5ed413218d46b66d2263694c/dichotomize-and-generalize-pac-bayesian-binary-2009-that-we-adapt-to-deep.jpg)
![JOURNAL OF LA A Comprehensive Survey on Graph Neural … · these challenges [18], [19]. In our survey, we generalize the term graph neural networks to represent all deep learning](https://static.fdocuments.us/doc/165x107/5ecd1a1a41be0f2229140023/journal-of-la-a-comprehensive-survey-on-graph-neural-these-challenges-18-19.jpg)
![Understanding Anatomy Classification Through Visualization · Understanding Anatomy Classification Through ... capability of the model to generalize well [4], ... Heat map from](https://static.fdocuments.us/doc/165x107/5ae82f427f8b9ae157901c6e/understanding-anatomy-classication-through-visualization-anatomy-classication.jpg)