
On Spatially Distributed Hydrological Ecosystem Services · On Spatially Distributed Hydrological...
45
On Spatially Distributed Hydrological Ecosystem Services Bridging the Quantitative Information Gap using Remote Sensing and Hydrological Models
Transcript of On Spatially Distributed Hydrological Ecosystem Services · On Spatially Distributed Hydrological...
On Spatially Distributed
Hydrological Ecosystem Services
Bridging the Quantitative Information Gap using Remote
Sensing and Hydrological Models
Copyright © 2017
This publication has a Creative Commons 4.0 license that encourages re-use with attribution.
Published by
FutureWater
Costerweg 1V
6702 AA, Wageningen, the Netherlands
www.futurewater.eu
Acknowledgements
This research was funded by the CGIAR Research Program on Water, Land and Ecosystems in the Greater
Mekong (WLE-GM, wle-mekong.cgiar.org) and CGIAR Fund Donors (www.cgiar.org/who-we-are/cgiar-
fund/fund-donors-2) with support from SERVIR-Mekong (servir.adpc.net).
WLE-GM is funded in part by the Australian Government's Department of Foreign Affairs and Trade.

White paper prepared by
Gijs Simons (FutureWater, Delft University of Technology)*
Ate Poortinga (SERVIR Mekong, Winrock International, Spatial Informatics Group)
Wim Bastiaanssen (IHE-Delft, Delft University of Technology)
David Saah (University of San Francisco, Spatial Informatics Group)
Austin Troy (University of Colorado, Denver, Spatial Informatics Group)
Johannes Hunink (FutureWater)
Martijn de Klerk (FutureWater)
Martine Rutten (Delft University of Technology)
Peter Cutter (Spatial Informatics Group)
Lisa-Maria Rebelo (International Water Management Institute)
Lan Thanh Ha (Institute of Water Resources Planning)
Vu Phuong Nam (Institute of Water Resources Planning)
Tim Hessels (IHE-Delft)
Mark Fenn (Winrock International)
Brian Bean (Winrock International)
David Ganz (SERVIR Mekong)
Peter Droogers (FutureWater)
Tyler Erickson (Google)
Nick Clinton (Google)
*corresponding author: [email protected]
On Spatially Distributed Hydrological Ecosystem Services
Bridging the Quantitative Information Gap using Remote Sensing and Hydrological Models
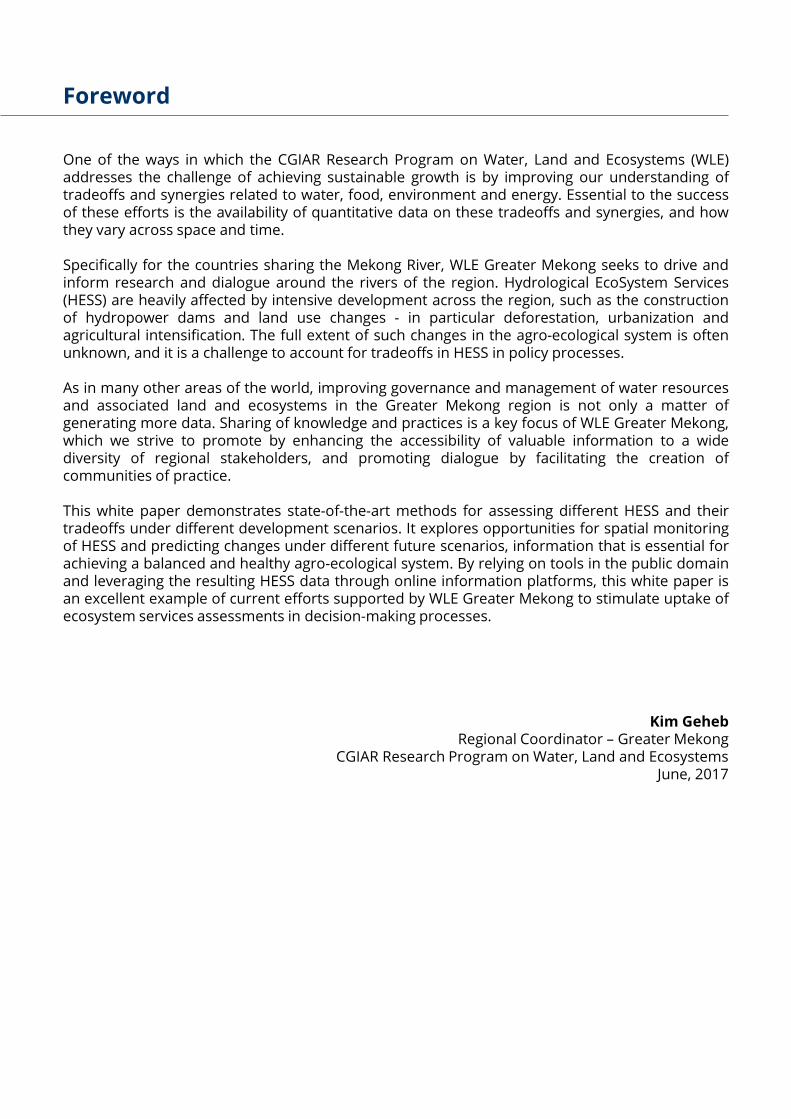
One of the ways in which the CGIAR Research Program on Water, Land and Ecosystems (WLE)addresses the challenge of achieving sustainable growth is by improving our understanding oftradeoffs and synergies related to water, food, environment and energy. Essential to the successof these efforts is the availability of quantitative data on these tradeoffs and synergies, and howthey vary across space and time.
Specifically for the countries sharing the Mekong River, WLE Greater Mekong seeks to drive andinform research and dialogue around the rivers of the region. Hydrological EcoSystem Services(HESS) are heavily affected by intensive development across the region, such as the constructionof hydropower dams and land use changes - in particular deforestation, urbanization andagricultural intensification. The full extent of such changes in the agro-ecological system is oftenunknown, and it is a challenge to account for tradeoffs in HESS in policy processes.
As in many other areas of the world, improving governance and management of water resourcesand associated land and ecosystems in the Greater Mekong region is not only a matter ofgenerating more data. Sharing of knowledge and practices is a key focus of WLE Greater Mekong,which we strive to promote by enhancing the accessibility of valuable information to a widediversity of regional stakeholders, and promoting dialogue by facilitating the creation ofcommunities of practice.
This white paper demonstrates state-of-the-art methods for assessing different HESS and theirtradeoffs under different development scenarios. It explores opportunities for spatial monitoringof HESS and predicting changes under different future scenarios, information that is essential forachieving a balanced and healthy agro-ecological system. By relying on tools in the public domainand leveraging the resulting HESS data through online information platforms, this white paper isan excellent example of current efforts supported by WLE Greater Mekong to stimulate uptake ofecosystem services assessments in decision-making processes.
Kim GehebRegional Coordinator – Greater Mekong
CGIAR Research Program on Water, Land and EcosystemsJune, 2017
Foreword
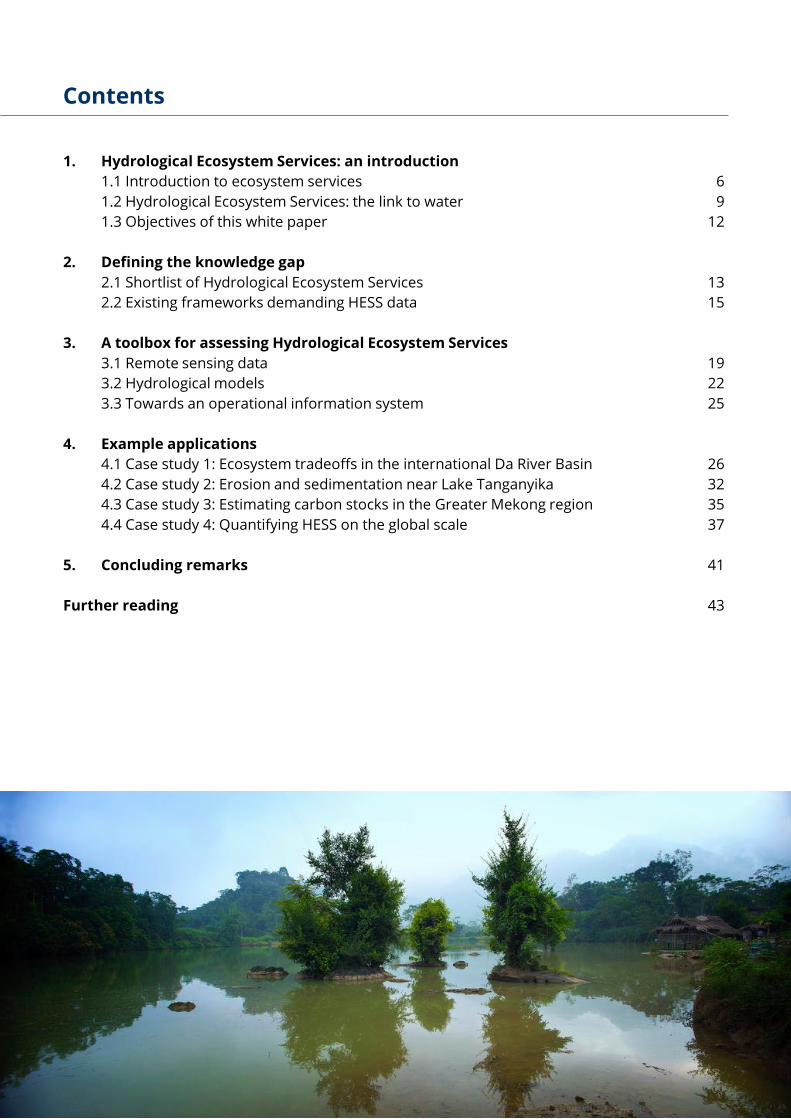
1. Hydrological Ecosystem Services: an introduction
1.1 Introduction to ecosystem services 06
1.2 Hydrological Ecosystem Services: the link to water 09
1.3 Objectives of this white paper 12
2. Defining the knowledge gap
2.1 Shortlist of Hydrological Ecosystem Services 13
2.2 Existing frameworks demanding HESS data 15
3. A toolbox for assessing Hydrological Ecosystem Services
3.1 Remote sensing data 19
3.2 Hydrological models 22
3.3 Towards an operational information system 25
4. Example applications
4.1 Case study 1: Ecosystem tradeoffs in the international Da River Basin 26
4.2 Case study 2: Erosion and sedimentation near Lake Tanganyika 32
4.3 Case study 3: Estimating carbon stocks in the Greater Mekong region 35
4.4 Case study 4: Quantifying HESS on the global scale 37
5. Concluding remarks 41
Further reading 43
Contents

1. Hydrological Ecosystem Services: an introduction
1.1 Introduction to ecosystem services
Ecosystems provide a wide range of benefits tohumans, but these ecosystem services (ESS) arerarely accounted for in any proactive way bydecision makers. More typically, ecosystem benefitsare ignored until it is too late, at which pointexpensive and reactive interventions are requiredto address the loss of ecosystem benefits. Differentframeworks based on the general concept ofecosystem services to humans were developed overthe past two decades, aiming to mainstream theproactive consideration of ecosystem benefits inplanning and policy decisions.
Application of ESS frameworks is mostfundamentally about the quantification of tradeoffs.When ecosystems are affected by economicdevelopment, the benefits that the ecosystem onceprovided may be compromised or eliminated. Somesuch services, such as the regulation of water flows,can be replaced via engineered solutions but thecost of this replacement can be significant. Incontrast, many cultural services such as theaesthetic or spiritual value of nature are oftenirreplaceable. Quantification of these opportunitycosts can be compared to the economic benefits ofthe development, allowing for a more holistic viewof costs and benefits. ESS frameworks are used notonly to look at the loss in services fromdevelopment, but also at the gain in servicesachieved through effective ecosystem restorationand its impact on people's livelihoods.
Despite the emergence of several classificationschemes, there is still debate about how ecosystemservices should be defined and categorized. One ofthe most common systems of categorization is fromthe Millennium Assessment (MA, 2005). It splits upall ecosystem services into four overarchingfunctional categories.
Application of ecosystem services frameworks is most fundamentally about the quantification of tradeoffs
6
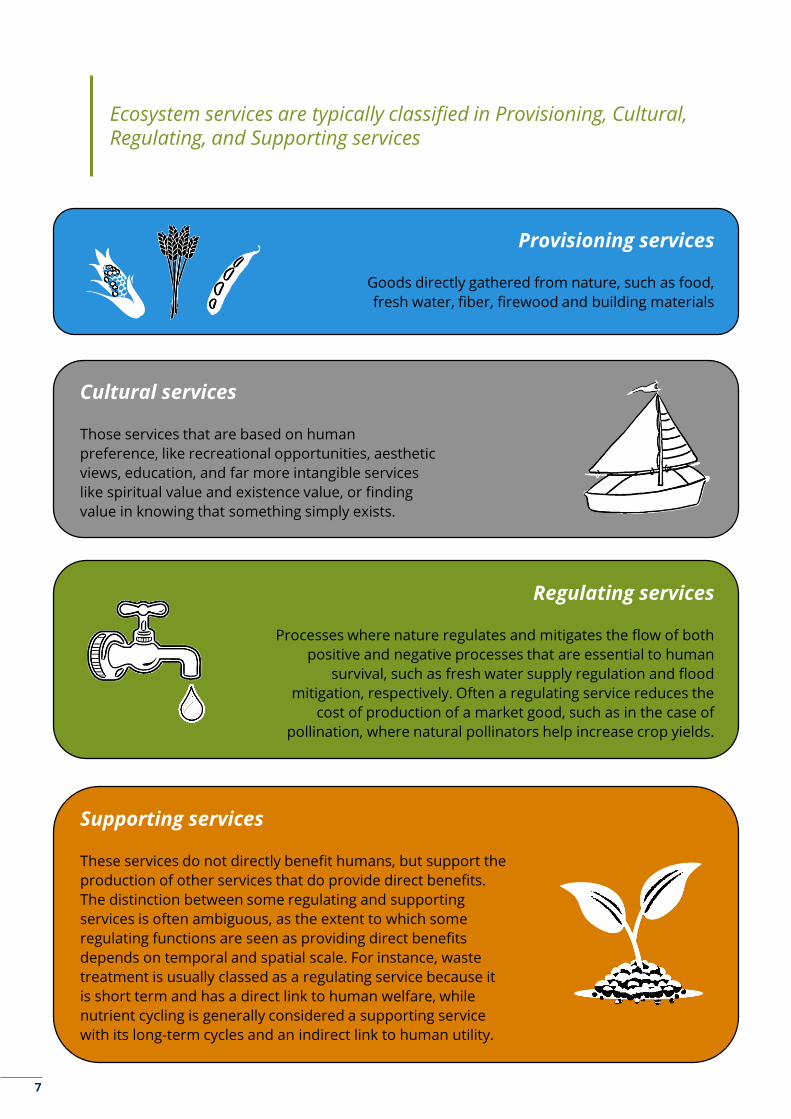
Regulating services
Processes where nature regulates and mitigates the flow of both
positive and negative processes that are essential to human
survival, such as fresh water supply regulation and flood
mitigation, respectively. Often a regulating service reduces the
cost of production of a market good, such as in the case of
pollination, where natural pollinators help increase crop yields.
Cultural services
Those services that are based on human
preference, like recreational opportunities, aesthetic
views, education, and far more intangible services
like spiritual value and existence value, or finding
value in knowing that something simply exists.
Supporting services
These services do not directly benefit humans, but support the
production of other services that do provide direct benefits.
The distinction between some regulating and supporting
services is often ambiguous, as the extent to which some
regulating functions are seen as providing direct benefits
depends on temporal and spatial scale. For instance, waste
treatment is usually classed as a regulating service because it
is short term and has a direct link to human welfare, while
nutrient cycling is generally considered a supporting service
with its long-term cycles and an indirect link to human utility.
Provisioning services
Goods directly gathered from nature, such as food,
fresh water, fiber, firewood and building materials
Ecosystem services are typically classified in Provisioning, Cultural, Regulating, and Supporting services
7

After the Millennium Assessment, one of the most significant attempts at categorizing ecosystem
services came out the Economic of Ecosystems and Biodiversity (TEEB) project, which proposed a
variant on the MA framework. This variant keeps two of four primary categories, slightly alters the
cultural category and replaces the Supporting Services category with “Habitat Services”. TEEB’s
strong focus on habitat and biodiversity is based on the contention that these two things
underpin almost all other services. The Ecosystem Services and Resilience Framework (ESR) of
the CGIAR Research Program on Water, Land and Ecosystems (CGIAR, 2014) builds on the TEEB
concept, and emphasizes the interplay between agricultural systems and ecosystems. In this
concept of integrated agricultural landscapes, communities are supported by stocks and flows of
ecosystem services that they are able to manage at different scales, in order to ultimately
improve human well-being and alleviate poverty.
Some types of ecosystem services are impossible to value or quantify. For instance, spiritual,
religious, educational, or bequest values (feeling of value associated with providing for future
generations) are of great importance for ecosystems across the world, but they do not lend
themselves to quantification in most circumstances. Nor do non-use values, such as existence or
option value, which is the value that people ascribe to a place for its mere existence, or for the
fact that it may be useful at some time in the future. Even habitat value is not generally
considered quantifiable as it is not a service that is directly consumed by human beneficiaries, but
rather supports the creation of other services that humans consume.
An extensive discussion of different ESS frameworks goes beyond the scope of this whitepaper. Excellent resources on ESS and their classification are found at:
● wle.cgiar.org/research/themes/ecosystem-services-and-resilience● www.teebweb.org/resources/ecosystem-services● biodiversity.europa.eu/topics/ecosystem-services
For more in-depth literature including many case studies, debates and proposed nuances, thereader is referred to papers by Costanza et al. (1998), Wallace (2007), Farber et al., 2006, Boyd& Banzhaf (2007), De Groot et al. (2010), Fisher & Kerry Turner (2008), Fisher, Turner, & Morling(2009), and Fisher et al. (2009).
Nonetheless, many other services—particularly those that involve the need to engineer
replacements—can be quantified and even monetized. Many services that involve water fall
under this category: water supply regulation, nutrient and sediment regulation, waste
assimilation, flood regulation, and carbon sequestration can all be quantified by using state-of-
the-art tools. A value can subsequently be ascribed to them when there are human beneficiaries
downstream. All of these services depend on healthy upstream ecosystems and we can evaluate
the extent to which land change will compromise the flow of these services which, in turn, will
require expenditures to engineer replacements to maintain a certain level of well-being among
downstream beneficiaries.
Many services can be quantified and even monetized by using state-of-the-art tools
8

Figure 1: Ecosystem service classification system, color-coded by suitability for quantification (based on Saah and Troy, 2016).
1.2 Hydrological Ecosystem Services: the link to water
Water underpins many of the services that ecosystems provide and is a critical component in
maintaining ecosystem functions. Hydrological EcoSystem Services (HESS), also known as
Water-related Ecosystem Services, comprise those ESS that explicitly describe the services
rendered from water resources.
The water cycle at the river basin scale in relation to ecosystem services is illustrated in Figure 2.
For a clear accounting of water flows, it is recommended to distinguish between the vertical and
horizontal components of water flow and fluxes. The soil water balance describes the essentially
vertical flows and the interaction between land and atmosphere, as well as the moisture
exchange between unsaturated and saturated soil. The regional water balance describes
horizontal flows that convey water through streams, rivers and aquifers. Information on
horizontal flows can be derived from adding together all spatially distributed vertical soil water
flows across a certain spatial domain. A domain can be a single catchment (e.g. the catchment of
a reservoir) and should always be studied in the context of the river basin for having access to an
estimation of the lateral flows from the upstream part.
The benefits associated with HESS are not only determined by the spatial distribution of volumes
of water, but is equally dependent on timing of water flows. In case the volume of water supplied
is too large to be put to beneficial use at a certain point in time, the extent to which certain HESS
can be provided will depend on the presence of natural or artificial storage mechanisms.
9
Provisioning Cultural Regulating Supporting
Food
Fuels
Raw materials
Fresh water
Genetic and
medicinal resources
Recreation
Aesthetics and
amenity
Spiritual and
religious
Educational
Existence and
option value
Genetic and
medicinal resources
Disturbance
regulation
Air quality and
Climate regulation
Fresh water supply
regulation
Agricultural crop
productivity
Soil formation
Habitat provision
Species diversity
Nutrient cycling
Order of directness of benefits to humans
Highly suited for
economic
valuation
Suitable to economic
valuation under
certain assumptions
and conditions
Suitable to
quantification using
Non-monetary
indicators
Not suitable to
quantification and
may require use of
different framework
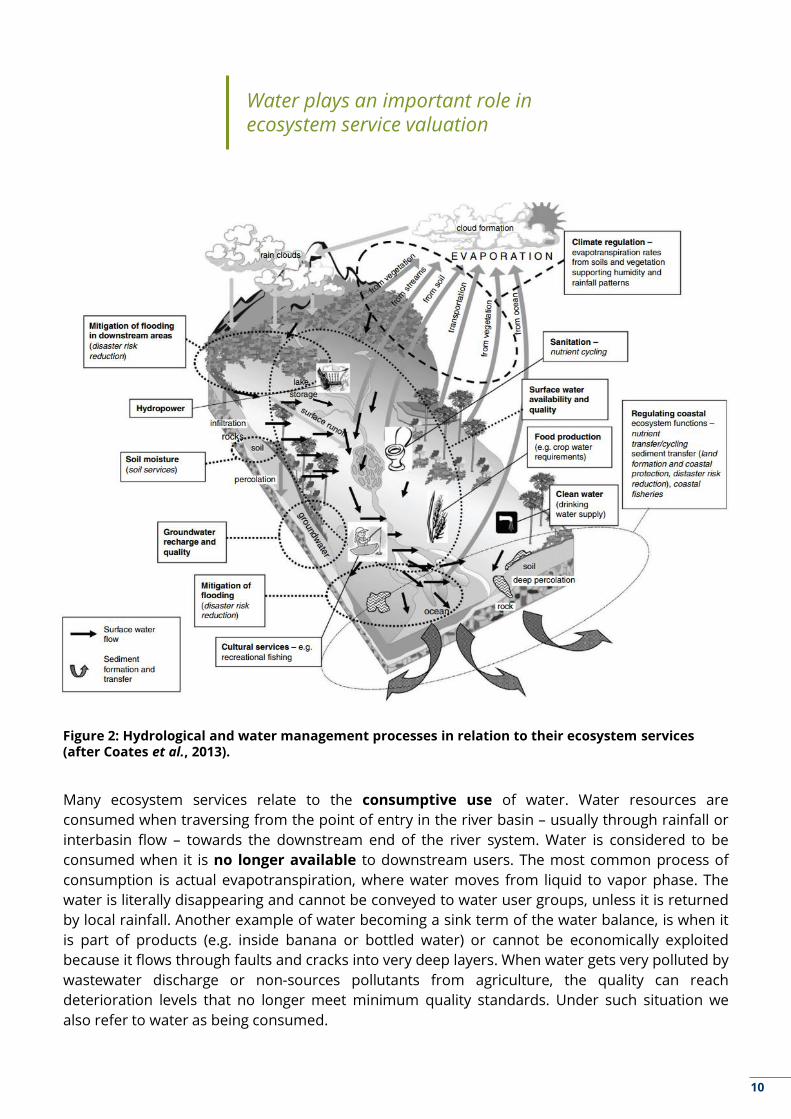
Figure 2: Hydrological and water management processes in relation to their ecosystem services (after Coates et al., 2013).
Many ecosystem services relate to the consumptive use of water. Water resources are
consumed when traversing from the point of entry in the river basin – usually through rainfall or
interbasin flow – towards the downstream end of the river system. Water is considered to be
consumed when it is no longer available to downstream users. The most common process of
consumption is actual evapotranspiration, where water moves from liquid to vapor phase. The
water is literally disappearing and cannot be conveyed to water user groups, unless it is returned
by local rainfall. Another example of water becoming a sink term of the water balance, is when it
is part of products (e.g. inside banana or bottled water) or cannot be economically exploited
because it flows through faults and cracks into very deep layers. When water gets very polluted by
wastewater discharge or non-sources pollutants from agriculture, the quality can reach
deterioration levels that no longer meet minimum quality standards. Under such situation we
also refer to water as being consumed.
Water plays an important role in ecosystem service valuation
10
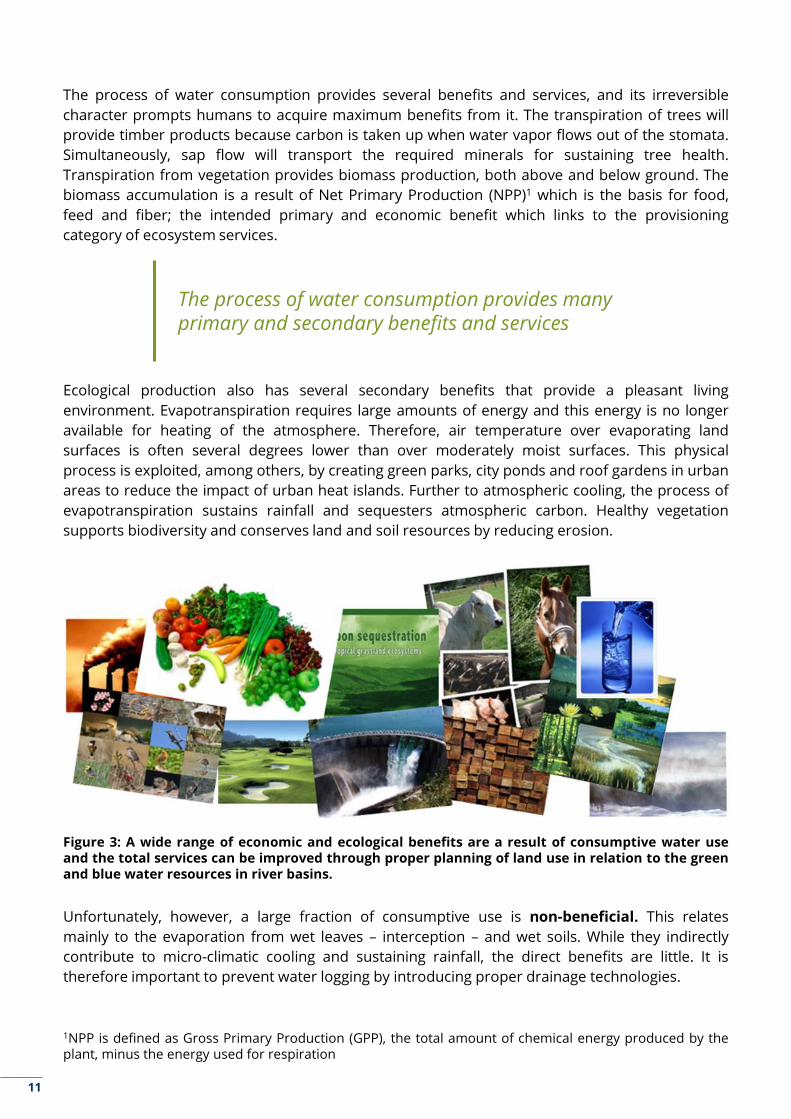
The process of water consumption provides several benefits and services, and its irreversible
character prompts humans to acquire maximum benefits from it. The transpiration of trees will
provide timber products because carbon is taken up when water vapor flows out of the stomata.
Simultaneously, sap flow will transport the required minerals for sustaining tree health.
Transpiration from vegetation provides biomass production, both above and below ground. The
biomass accumulation is a result of Net Primary Production (NPP)1 which is the basis for food,
feed and fiber; the intended primary and economic benefit which links to the provisioning
category of ecosystem services.
Figure 3: A wide range of economic and ecological benefits are a result of consumptive water useand the total services can be improved through proper planning of land use in relation to the greenand blue water resources in river basins.
Ecological production also has several secondary benefits that provide a pleasant living
environment. Evapotranspiration requires large amounts of energy and this energy is no longer
available for heating of the atmosphere. Therefore, air temperature over evaporating land
surfaces is often several degrees lower than over moderately moist surfaces. This physical
process is exploited, among others, by creating green parks, city ponds and roof gardens in urban
areas to reduce the impact of urban heat islands. Further to atmospheric cooling, the process of
evapotranspiration sustains rainfall and sequesters atmospheric carbon. Healthy vegetation
supports biodiversity and conserves land and soil resources by reducing erosion.
Unfortunately, however, a large fraction of consumptive use is non-beneficial. This relates
mainly to the evaporation from wet leaves – interception – and wet soils. While they indirectly
contribute to micro-climatic cooling and sustaining rainfall, the direct benefits are little. It is
therefore important to prevent water logging by introducing proper drainage technologies.
1NPP is defined as Gross Primary Production (GPP), the total amount of chemical energy produced by theplant, minus the energy used for respiration
The process of water consumption provides many primary and secondary benefits and services
11
1.3 Objectives of this white paper
A global revolution in the planning of scarce water resources to secure food production and
economic growth without degradation in biodiversity is urgently required. Hence, efforts to
realize green growth must be well-managed to avoid unintended social, economic and ecosystem
consequences across landscapes. This requires a thorough understanding of water flow paths
and associated hydrological ecosystem services.
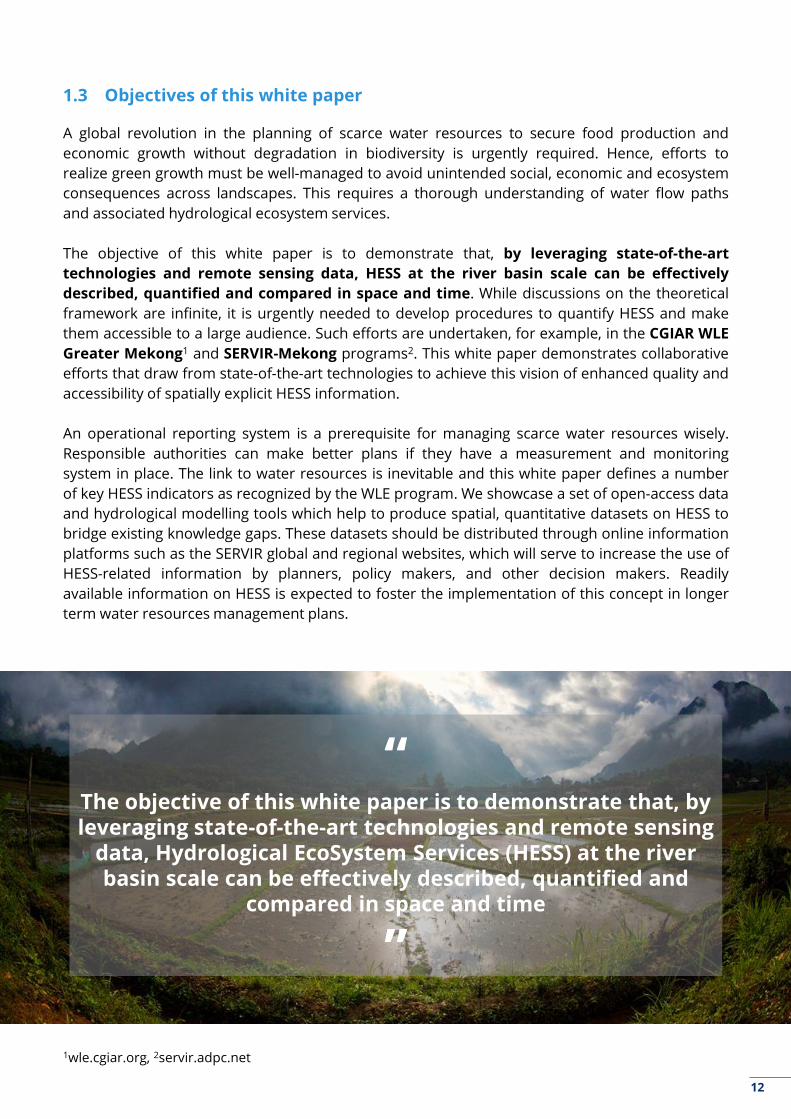
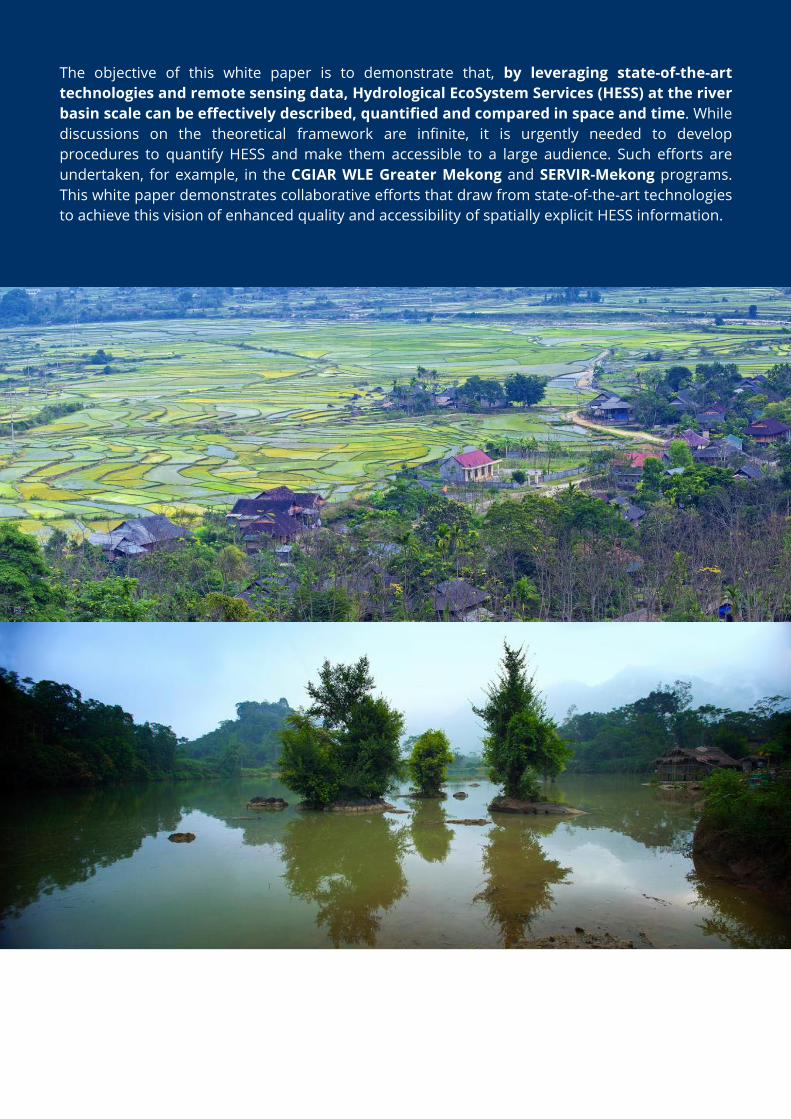
The objective of this white paper is to demonstrate that, by leveraging state-of-the-art
technologies and remote sensing data, HESS at the river basin scale can be effectively
described, quantified and compared in space and time. While discussions on the theoretical
framework are infinite, it is urgently needed to develop procedures to quantify HESS and make
them accessible to a large audience. Such efforts are undertaken, for example, in the CGIAR WLE
Greater Mekong1 and SERVIR-Mekong programs2. This white paper demonstrates collaborative
efforts that draw from state-of-the-art technologies to achieve this vision of enhanced quality and
accessibility of spatially explicit HESS information.
An operational reporting system is a prerequisite for managing scarce water resources wisely.
Responsible authorities can make better plans if they have a measurement and monitoring
system in place. The link to water resources is inevitable and this white paper defines a number
of key HESS indicators as recognized by the WLE program. We showcase a set of open-access data
and hydrological modelling tools which help to produce spatial, quantitative datasets on HESS to
bridge existing knowledge gaps. These datasets should be distributed through online information
platforms such as the SERVIR global and regional websites, which will serve to increase the use of
HESS-related information by planners, policy makers, and other decision makers. Readily
available information on HESS is expected to foster the implementation of this concept in longer
term water resources management plans.
“The objective of this white paper is to demonstrate that, by leveraging state-of-the-art technologies and remote sensing
data, Hydrological EcoSystem Services (HESS) at the river basin scale can be effectively described, quantified and
compared in space and time
”
1wle.cgiar.org, 2servir.adpc.net
12
2.1 Shortlist of Hydrological Ecosystem Services
Within the CGIAR WLE program, efforts are undertaken to improve the livelihoods and ecological
benefits derived from reservoirs and their catchments without impairing the economic and social
gains of development. WLE promotes an approach to sustainable agricultural intensification that
recognizes the fundamental role that healthy ecosystems play in sustainable natural resource
management, human well-being and resilient food system. Together with experts active in the
WLE program, a shortlist of key HESS indicators has been developed in 2015-2016 during
workshops in Vientiane and Hanoi (see Figure 4). This table can be considered a minimum list of
17 HESS indicators on which consensus was achieved during expert consultations. The link of
these HESS indicators to agro-ecological processes is described in this section.
The total availability of blue water resources in rivers, lakes, streams and aquifers is a result of
fast surface and slow groundwater runoff. Runoff arises when the soil has insufficient capacity to
retain the rainfall locally. During these moments, excess water flows to streams and aquifers that
represent the renewable water resources that can be explored for utilization. The same water
flow provides also habitats to flora and fauna and it is relevant to maintain certain historic flow
regimes – or a portion of it – for spawning and migration of fish, among others. The total water
stock is important for survival during elongated periods of drought. The vertical soil water
balance is land use dependent. Ecosystems with a good aeration will infiltrate more water and
forests will have deep rooting systems that can store large amounts of water in the vadose zone.
For these reasons, forests will have the ability to attenuate peak flow for safeguarding flooding in
downstream areas, a rather direct impact on the livelihood of people living in deltas.
Many of these water systems are natural (lakes, rivers, mangroves) and can be a source of water
during the dry season. Net Primary Production from natural pastures, alpine pastures, wetlands
and other classes provides livestock feed. For more woody types of vegetation (e.g. forests and
savannah), accumulated biomass can be used for firewood and woody vegetation sequesters
more carbon in the trunk and branches. The underground dry matter production of these
ecosystems contributes to carbon fixation in soils.
The exchanges between landscapes – and especially green landscapes - with the atmosphere
have, next to constituting a net carbon sink, also a positive impact on a reduction of the near-
surface air temperature and generation of rainfall. A higher density of atmospheric water vapor
will increase the likelihood of rainfall, which typically increases towards mountainous areas. In
case of larger river basins, this atmospheric moisture recycling will feed the upstream rivers at
their source areas and enhance their discharge rates.
Large amounts of fertile soil are potentially eroded through surface runoff or by wind gusts. Soil
conservation can be achieved by contour management and covering the soil with vegetation,
reducing erosion and sedimentation. These potential extra benefits of food production are often
not recognized.
A list of 17 important indicators of Hydrological Ecosystem Services was established
2. Defining the knowledge gap
13

Figure 4: Shortlist of 17 indicators of Hydrological EcoSystem Services.
Supporting
Cultural
Total runoff
Inland capture fishery
Natural livestock feed production
Fuelwood from natural forests
Fresh water
Food
Food
Fuel
Provisioning
Dry season base flow
Groundwater recharge
Water storage in lakes
Meeting environmental flow requirements
Sustaining rainfall
Carbon sequestration
Reduce greenhouse gas emissions
Microclimate cooling
Peak flow attenuation
Reduction of eutrophication in water
Reduction of soil erosion
Fresh water supply
Fresh water supply
Fresh water supply
Fresh water supply
Fresh water supply
Air quality and climate
Air quality and climate
Air quality and climate
Disturbance regulation
Water quality
Water quality
1
2
3
4
Habitat provision
Recreation
Aquatic connectivity(fragmentations)
Leisure
Category Service
Regulating
7
8
9
10
11
12
13
14
15
16
17
5
6
14
2.2 Existing frameworks demanding HESS data
As the concept of ecosystem services evolved during the past two decades, attempts have been
made to link academic assessments of ecosystem services to decision making processes. These
frameworks / concepts / methods all demand input data on hydrological ecosystem services,
varying in space and time. A few examples are given below to demonstrate the need for HESS
information. Given the multitude of perspectives and institutions involved in this field of work,
this is by no means an exhaustive list.
Water Accounting Plus (WA+)1
The long-term planning process for water and
environmental resources in river basins requires a
system for measurement, reporting and monitoring. The
Partnership for Water Accounting (IHE-Delft, IWMI and
FAO) works jointly on the development of an accounting
system that provides monthly standard reports on rivr
basins. WA+ is largely based on remote sensing data and
integrates hydrological processes with land use,
managed water flows and the services that result from
water consumption in river basins. In this way, it aims to
provide the information needed to achieve equitable
and transparent water governance for all users. Explicit
spatial information is provided through this framework
on water consumption and withdrawal processes, going
beyond flow and runoff accounting. Software tools are
being prepared that link open-access input data to
reporting sheets. WA+ can be used to evaluate and plan
water resources management, to monitor changes in
water resources and to assess the impacts of future
interventions, ensuring a sustainable water balance.
www.wateraccounting.org
As part of the CGIAR WLE program, WA+ has been implemented in the Nile, Greater Mekong and
Volta basins, as well as in smaller basins such as the Red River basin. This work has involved the
development of an indicator framework for HESS which has been incorporated into the WA+
approach. Here, quantified HESS (mainly provisioning & regulating) are related to consumptive
and non-consumptive water use by different categories of land use classes, corresponding with
land use - specific water management options. A publically available sheet generator converts
HESS data into the reporting sheet presented in Figure 5.
WA+ improves understanding of the current state of water resources in a river basin, development opportunities and future challenges
15
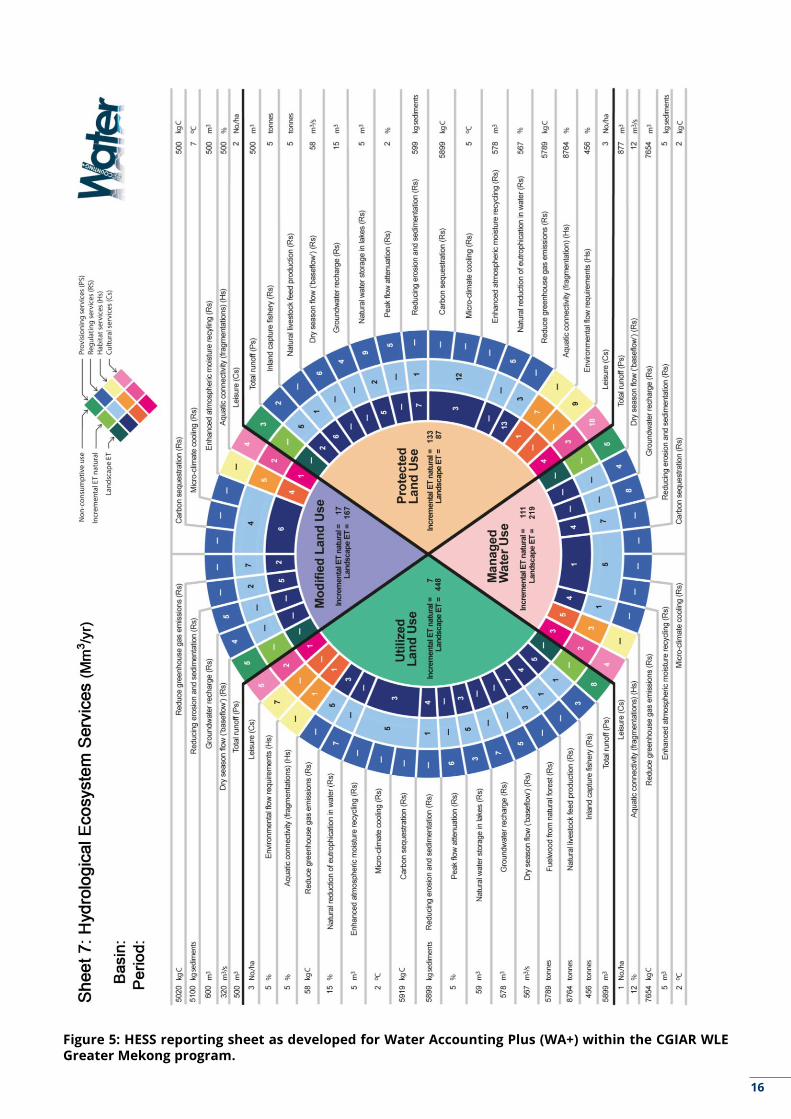
Figure 5: HESS reporting sheet as developed for Water Accounting Plus (WA+) within the CGIAR WLEGreater Mekong program.
16
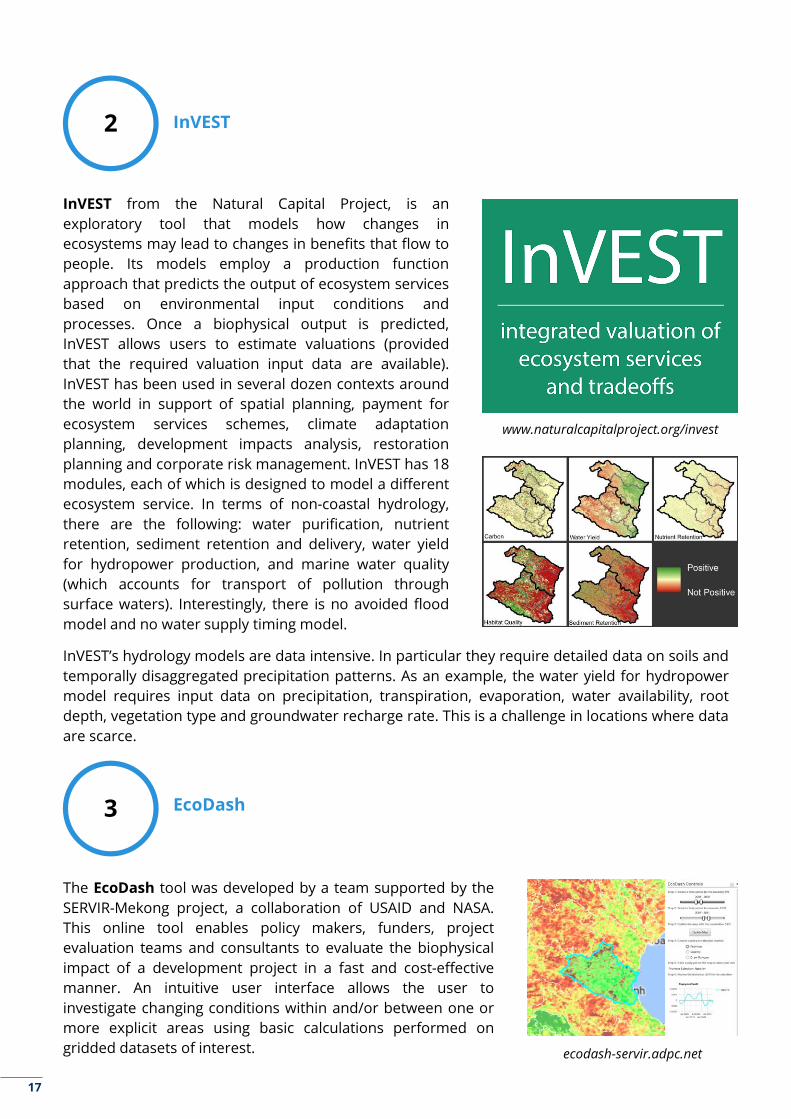
InVEST from the Natural Capital Project, is an
exploratory tool that models how changes in
ecosystems may lead to changes in benefits that flow to
people. Its models employ a production function
approach that predicts the output of ecosystem services
based on environmental input conditions and
processes. Once a biophysical output is predicted,
InVEST allows users to estimate valuations (provided
that the required valuation input data are available).
InVEST has been used in several dozen contexts around
the world in support of spatial planning, payment for
ecosystem services schemes, climate adaptation
planning, development impacts analysis, restoration
planning and corporate risk management. InVEST has 18
modules, each of which is designed to model a different
ecosystem service. In terms of non-coastal hydrology,
there are the following: water purification, nutrient
retention, sediment retention and delivery, water yield
for hydropower production, and marine water quality
(which accounts for transport of pollution through
surface waters). Interestingly, there is no avoided flood
model and no water supply timing model.
www.naturalcapitalproject.org/invest
InVEST’s hydrology models are data intensive. In particular they require detailed data on soils and
temporally disaggregated precipitation patterns. As an example, the water yield for hydropower
model requires input data on precipitation, transpiration, evaporation, water availability, root
depth, vegetation type and groundwater recharge rate. This is a challenge in locations where data
are scarce.
The EcoDash tool was developed by a team supported by the
SERVIR-Mekong project, a collaboration of USAID and NASA.
This online tool enables policy makers, funders, project
evaluation teams and consultants to evaluate the biophysical
impact of a development project in a fast and cost-effective
manner. An intuitive user interface allows the user to
investigate changing conditions within and/or between one or
more explicit areas using basic calculations performed on
gridded datasets of interest. ecodash-servir.adpc.net
3 EcoDash
2 InVEST
17

4 ARIES (ARtificial Intelligence for Ecosystem Services)
ARIES “strives to quantify the benefits that nature provides to
society in a manner that accounts for dynamic complexity and its
consequences, but keeps models clear enough to users to remain
understandable, usable, and adaptable to conditions of varying data
availability”. ARIES is essentially an integrated modelling framework
that aims to serve and connect modelers, institutions, researchers
and decision makers. Its focus is on modeling the spatial connection
between service producing ecosystems, flow paths of services, and
the beneficiaries who consume those services. Information from
earth observing satellites, airborne, land and water-based sensor
networks, and crowdsourced observations are combined in order to
enhance collaboration and communication among stakeholders.
Potential uses of ARIES include spatial economic valuation of
ecosystem services, natural capital accounting, optimization of
payment schemes for Ecosystem Services, and forecasting of future
changes in ecosystem service provisioning, all of which demand
spatial quantification of hydrological ecosystem services.
aries.integratedmodelling.org
The current implementation leverages Google Earth Engine’s state-of-the-art cloud-based GIS
technologies consisting of unparalleled co-located data and computing power. The tool enables
users to compare the biophysical conditions of an area with historical baseline conditions and/or
with other sites. Currently the focus of the tool is on the Enhanced Vegetation Index derived from
NASA's MODIS Earth observation mission. However, additional HESS indicators will be accessible
via the tool in the near future and it is seen as an important development milestone in the
process of creating a broad and robust platform to support the general access to and use of HESS
and related data.
Original satellite radiance measurements (i.e. raw data)
Standardized land and water management data provided by space agencies.
Added value products provided by knowledge centers (i.e. directly available)
Additional data needed specifically for HESS analysis (i.e. indirectly available)
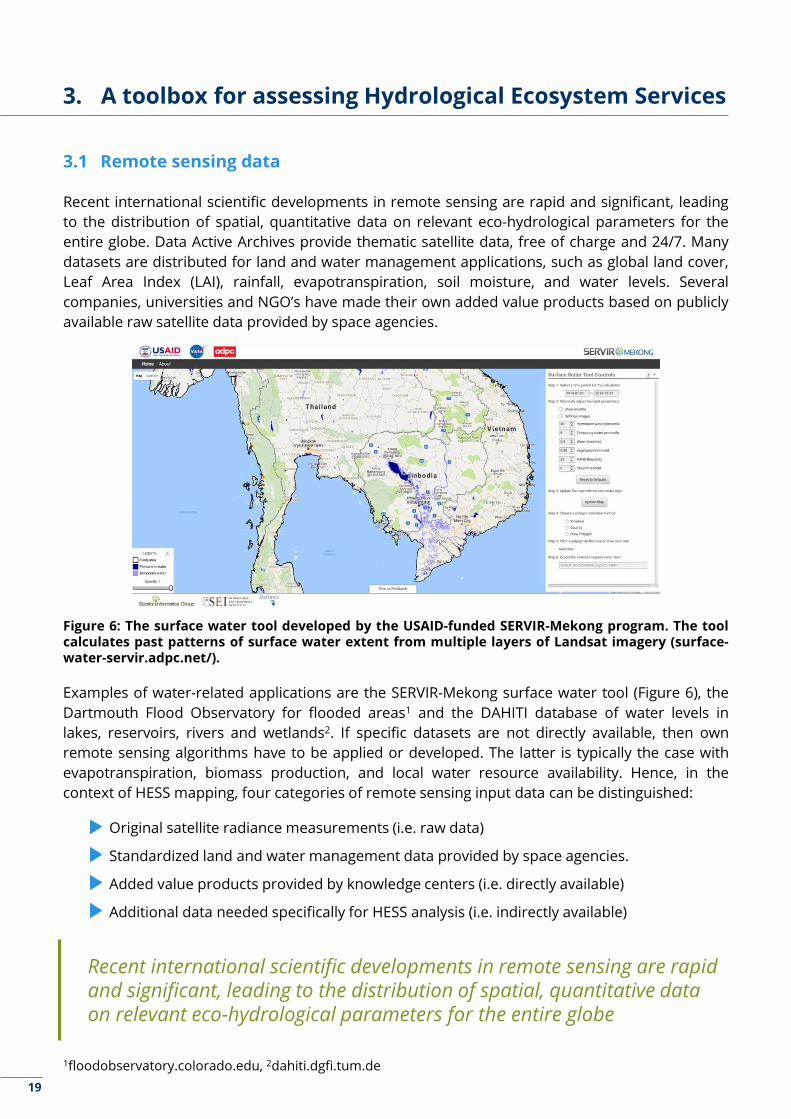
Examples of water-related applications are the SERVIR-Mekong surface water tool (Figure 6), the
Dartmouth Flood Observatory for flooded areas1 and the DAHITI database of water levels in
lakes, reservoirs, rivers and wetlands2. If specific datasets are not directly available, then own
remote sensing algorithms have to be applied or developed. The latter is typically the case with
evapotranspiration, biomass production, and local water resource availability. Hence, in the
context of HESS mapping, four categories of remote sensing input data can be distinguished:
Figure 6: The surface water tool developed by the USAID-funded SERVIR-Mekong program. The toolcalculates past patterns of surface water extent from multiple layers of Landsat imagery (surface-water-servir.adpc.net/).
3.1 Remote sensing data
Recent international scientific developments in remote sensing are rapid and significant, leading
to the distribution of spatial, quantitative data on relevant eco-hydrological parameters for the
entire globe. Data Active Archives provide thematic satellite data, free of charge and 24/7. Many
datasets are distributed for land and water management applications, such as global land cover,
Leaf Area Index (LAI), rainfall, evapotranspiration, soil moisture, and water levels. Several
companies, universities and NGO’s have made their own added value products based on publicly
available raw satellite data provided by space agencies.
1floodobservatory.colorado.edu, 2dahiti.dgfi.tum.de
3. A toolbox for assessing Hydrological Ecosystem Services
Recent international scientific developments in remote sensing are rapid and significant, leading to the distribution of spatial, quantitative data on relevant eco-hydrological parameters for the entire globe
19
It is possible to obtain or produce most of these data at a spatial resolution of 1 km x 1 km at the
daily scale, following the typical moderate resolution satellite images from MODIS and related
earth observing systems. VIIRS is the successor of MODIS, and it provides grids with cells of 375 m
x 375 m, every day. Certain products can also be created at 100 m x 100 m data using PROBA-V
satellite measurements1.
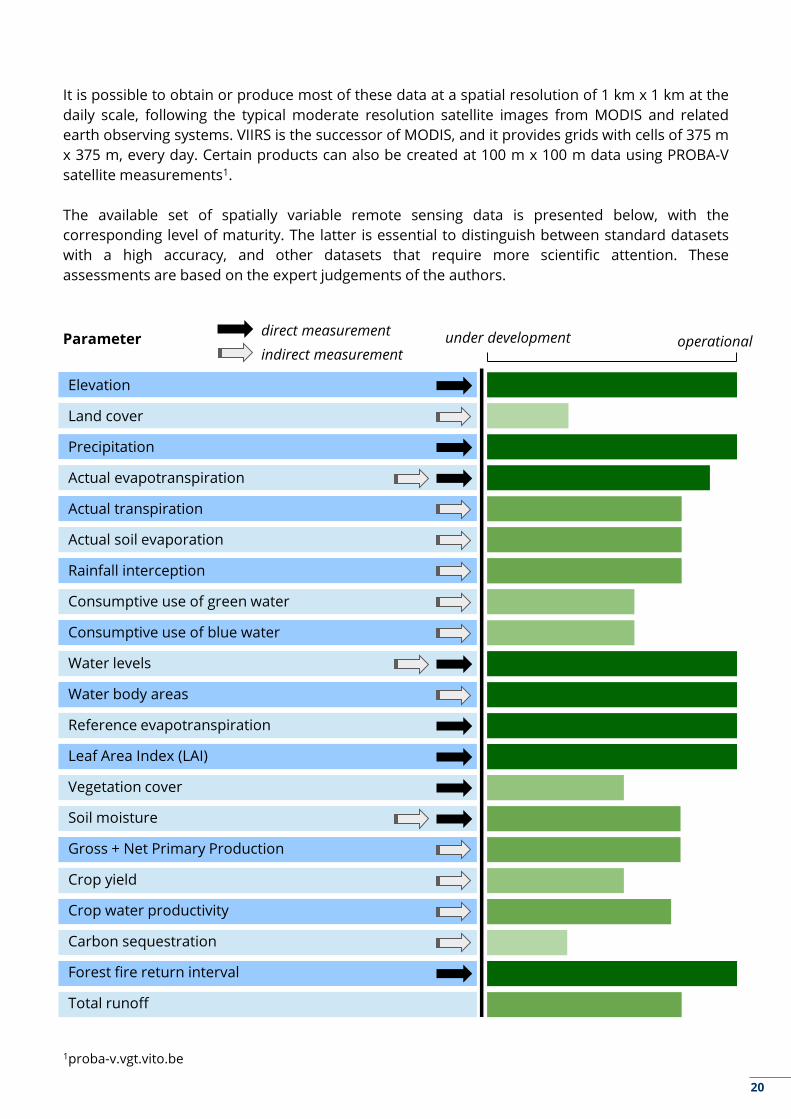
The available set of spatially variable remote sensing data is presented below, with the
corresponding level of maturity. The latter is essential to distinguish between standard datasets
with a high accuracy, and other datasets that require more scientific attention. These
assessments are based on the expert judgements of the authors.
operational
1proba-v.vgt.vito.be
Elevation
Land cover
Precipitation
Actual evapotranspiration
Actual transpiration
Actual soil evaporation
Rainfall interception
Consumptive use of green water
Consumptive use of blue water
Water levels
Water body areas
Reference evapotranspiration
Leaf Area Index (LAI)
Vegetation cover
Soil moisture
Gross + Net Primary Production
Crop yield
Crop water productivity
Carbon sequestration
Forest fire return interval
Total runoff
under developmentParameterdirect measurement
indirect measurement
20
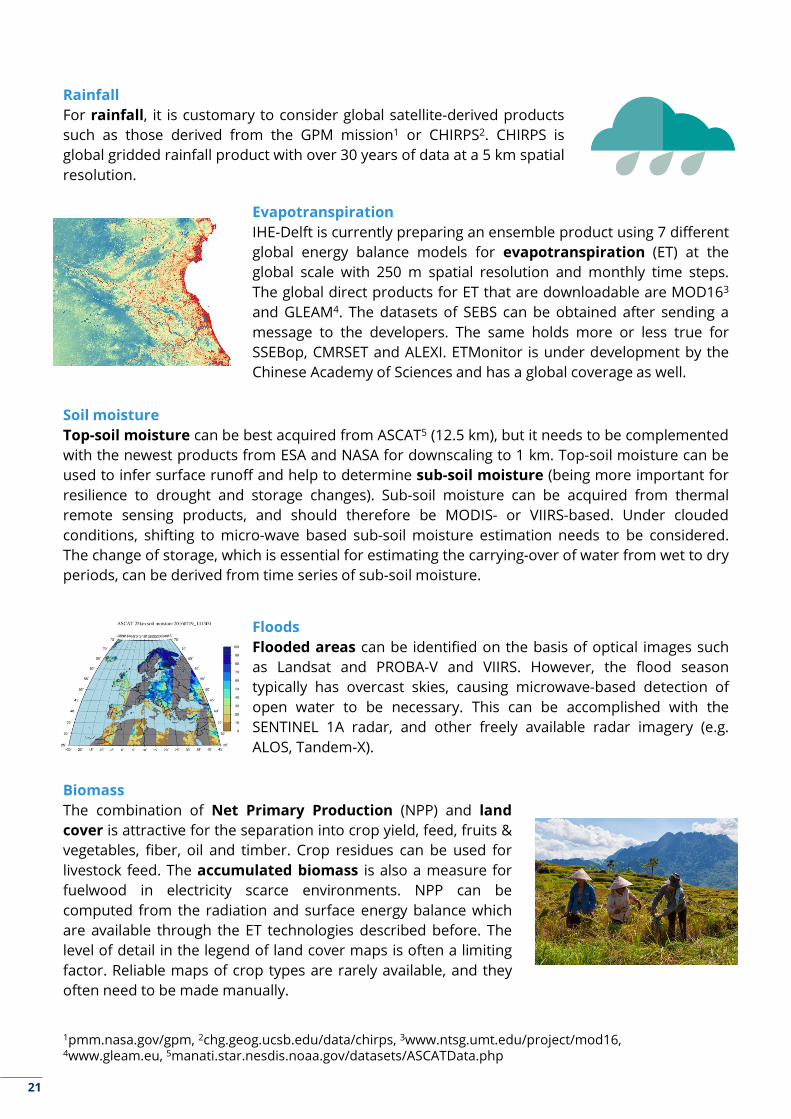
Floods
Flooded areas can be identified on the basis of optical images such
as Landsat and PROBA-V and VIIRS. However, the flood season
typically has overcast skies, causing microwave-based detection of
open water to be necessary. This can be accomplished with the
SENTINEL 1A radar, and other freely available radar imagery (e.g.
ALOS, Tandem-X).
Rainfall
For rainfall, it is customary to consider global satellite-derived products
such as those derived from the GPM mission1 or CHIRPS2. CHIRPS is
global gridded rainfall product with over 30 years of data at a 5 km spatial
resolution.
Soil moisture
Top-soil moisture can be best acquired from ASCAT5 (12.5 km), but it needs to be complemented
with the newest products from ESA and NASA for downscaling to 1 km. Top-soil moisture can be
used to infer surface runoff and help to determine sub-soil moisture (being more important for
resilience to drought and storage changes). Sub-soil moisture can be acquired from thermal
remote sensing products, and should therefore be MODIS- or VIIRS-based. Under clouded
conditions, shifting to micro-wave based sub-soil moisture estimation needs to be considered.
The change of storage, which is essential for estimating the carrying-over of water from wet to dry
periods, can be derived from time series of sub-soil moisture.
Evapotranspiration
IHE-Delft is currently preparing an ensemble product using 7 different
global energy balance models for evapotranspiration (ET) at the
global scale with 250 m spatial resolution and monthly time steps.
The global direct products for ET that are downloadable are MOD163
and GLEAM4. The datasets of SEBS can be obtained after sending a
message to the developers. The same holds more or less true for
SSEBop, CMRSET and ALEXI. ETMonitor is under development by the
Chinese Academy of Sciences and has a global coverage as well.
Biomass
The combination of Net Primary Production (NPP) and land
cover is attractive for the separation into crop yield, feed, fruits &
vegetables, fiber, oil and timber. Crop residues can be used for
livestock feed. The accumulated biomass is also a measure for
fuelwood in electricity scarce environments. NPP can be
computed from the radiation and surface energy balance which
are available through the ET technologies described before. The
level of detail in the legend of land cover maps is often a limiting
factor. Reliable maps of crop types are rarely available, and they
often need to be made manually.
1pmm.nasa.gov/gpm, 2chg.geog.ucsb.edu/data/chirps, 3www.ntsg.umt.edu/project/mod16,4www.gleam.eu, 5manati.star.nesdis.noaa.gov/datasets/ASCATData.php
21

Today
Policies:A, B, C
• Observations• Statistics• Questionnaires• Remote Sensing
• Evaluate Alternatives• Simulation Models
Trend
FuturePast
Future B
3.2 Hydrological models
As discussed in the previous section, remote sensing provides important information for
quantifying eco-hydrological processes at the land surface. However, by solely using earth
observation techniques it is not possible to address all relevant hydrological processes. The
lateral flow arising from surface runoff, drainage, floods, groundwater recharge and groundwater
seepage must be computed with hydrological models. In addition, satellites by definition provide
a view on the past, whereas decision makers need to know HESS under current and especially
future conditions. Such scenario thinking allows for the evaluation of potential impacts of policy
interventions.
Figure 7: Why models are needed to support decision makers.
Simulation models are an ideal tool for providing an outlook on different possible futures,
dependent on factors both within and outside control of the decision maker. They can also
provide information on subsurface processes, something which satellites cannot do (or only very
limited). Models can be calibrated and validated for current conditions using data from
observations and remote sensing. Once a satisfactory model performance has been established,
model inputs can be varied to simulate different future scenarios. Analysis of the outcomes of
these models allows for anticipation on e.g. future shifts in climate patterns and evaluation of the
effect of different policies.
22
Quantitative tools to support decision making

Many hydrological models are available, each with their own strengths and weaknesses. Selecting
the right model for the right application is often the most difficult task. For bridging the HESS
knowledge gap, it is important that the selected model provides quantitative information on the
hydrological processes that govern the majority of the shortlisted HESS indicators. Furthermore,
the model should be applicable at the river basin scale, contain sufficient biophysical detail, and
ideally be available in the public domain (to facilitate easy uptake around the world). Two
examples of such hydrological models that have proven their use in ecosystem services
assessments are Soil and Water Assessment Tool (SWAT) and Spatial Processes in Hydrology
(SPHY). In this white paper we propose the use of SPHY due to its pixel-based nature that allows
for easy integration with remote sensing data.
SPHY (Terink et al. 2015) is an eco-hydrological modeling tool suitable
and applied for a wide range of water resource management
applications. It is a state-of-the-art, easy to use, robust tool, that can be
applied for operational as well as strategic decision support. SPHY was
developed by FutureWater in cooperation with national and
international clients and partners and is meant to close the gap
between the more complex hydrological models and the steady-state
approaches. It is open-source and in the public domain, thus freely
available for download and application by everyone.
SPHY has been successfully applied in various studies ranging from real-time soil moisture
predictions in flat lands, to operational reservoir inflow forecasting applications in mountainous
catchments, solutions to water scarcity in the Middle East, and detailed climate change impact
studies in the snow- and glacier-melt dominated the Himalayan region. SPHY was developed with
the explicit aim to simulate terrestrial hydrology at flexible scales, under various land use and
climate conditions. The main terrestrial hydrological processes are described in a physically
consistent way so that changes in storages and fluxes can be assessed adequately over time and
space. Different modules are available, including an erosion and a reservoir module, which can be
switched on and off depending on the specific task.
1swat.tamu.edu, 2www.sphy.nl, 3www.sphy.nl/applications
Simulation models are an ideal tool for providing an outlook on different possible futures, dependent on factors both within and outside control of the decision maker
23
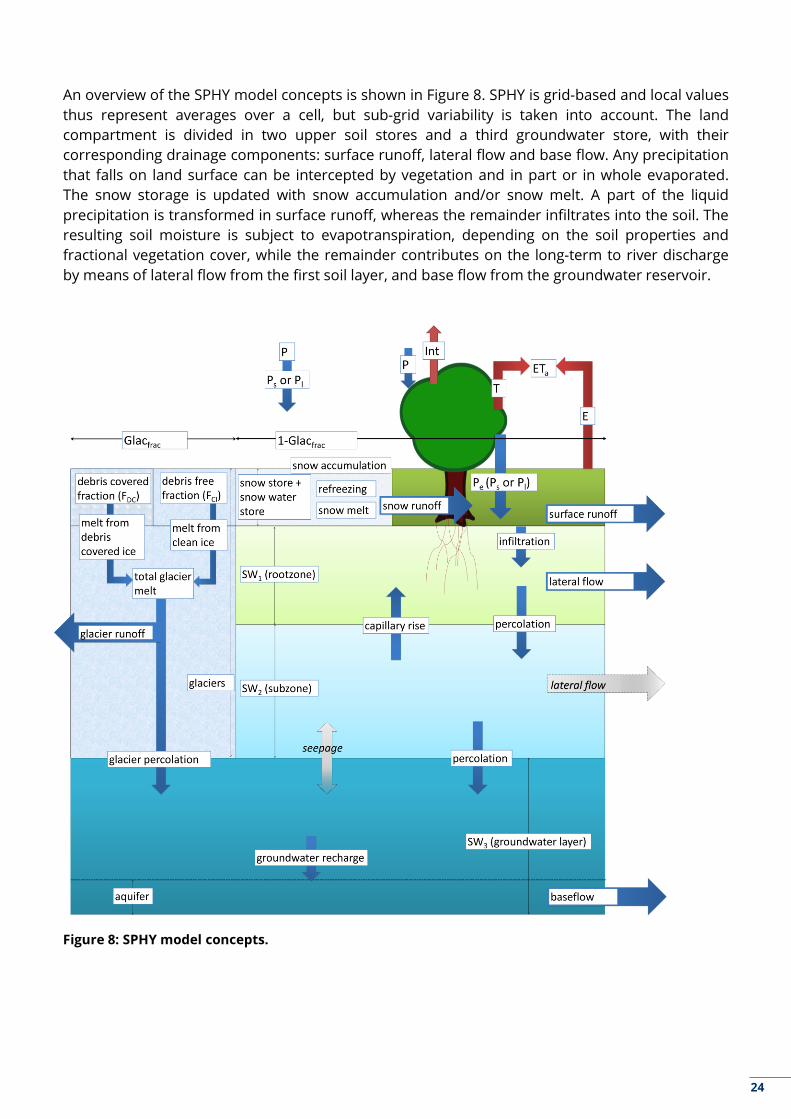
An overview of the SPHY model concepts is shown in Figure 8. SPHY is grid-based and local values
thus represent averages over a cell, but sub-grid variability is taken into account. The land
compartment is divided in two upper soil stores and a third groundwater store, with their
corresponding drainage components: surface runoff, lateral flow and base flow. Any precipitation
that falls on land surface can be intercepted by vegetation and in part or in whole evaporated.
The snow storage is updated with snow accumulation and/or snow melt. A part of the liquid
precipitation is transformed in surface runoff, whereas the remainder infiltrates into the soil. The
resulting soil moisture is subject to evapotranspiration, depending on the soil properties and
fractional vegetation cover, while the remainder contributes on the long-term to river discharge
by means of lateral flow from the first soil layer, and base flow from the groundwater reservoir.
Figure 8: SPHY model concepts.
24
As input, SPHY requires data on state variables as well as dynamic variables. For the state
variables the most relevant are Digital Elevation Model (DEM), land use type, glacier cover,
reservoirs and soil characteristics. The main dynamic variables are climate data such as
precipitation, temperature, reference evapotranspiration. In addition, very relevant for HESS
applications, the dynamic vegetation module relies on satellite-based vegetation data in order to
simulate the temporal variability of soil-water-vegetation-atmosphere interactions.
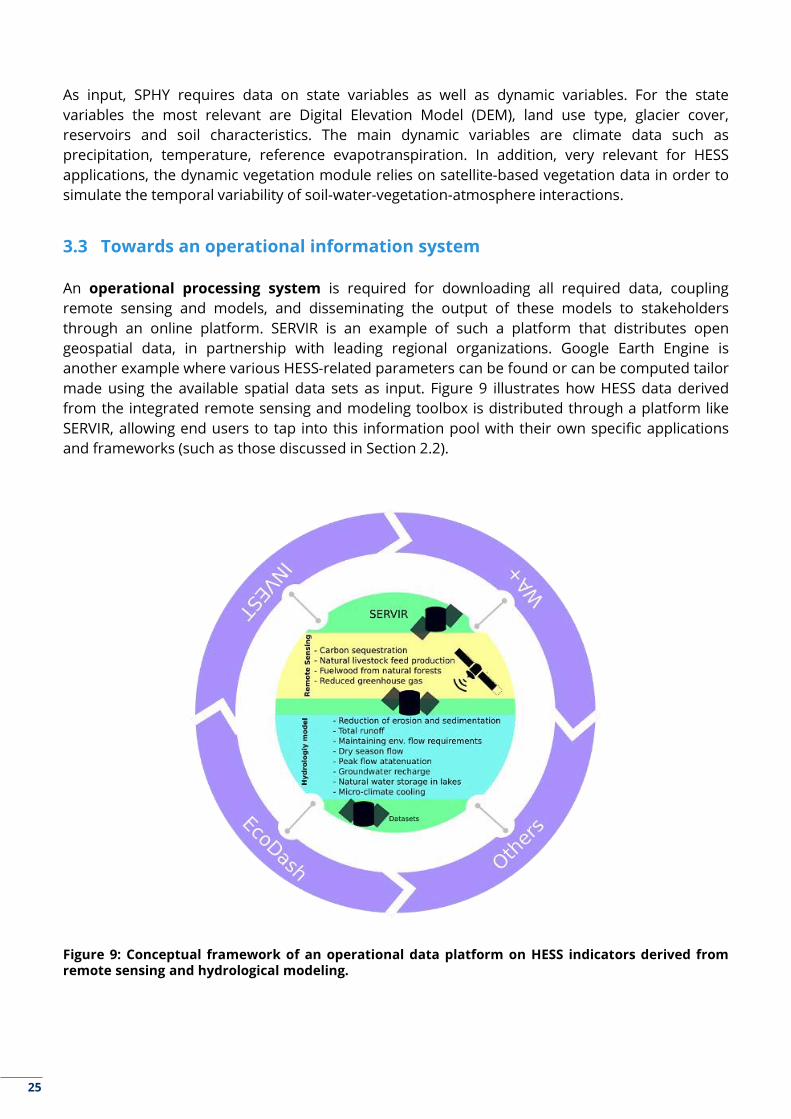
3.3 Towards an operational information system
An operational processing system is required for downloading all required data, coupling
remote sensing and models, and disseminating the output of these models to stakeholders
through an online platform. SERVIR is an example of such a platform that distributes open
geospatial data, in partnership with leading regional organizations. Google Earth Engine is
another example where various HESS-related parameters can be found or can be computed tailor
made using the available spatial data sets as input. Figure 9 illustrates how HESS data derived
from the integrated remote sensing and modeling toolbox is distributed through a platform like
SERVIR, allowing end users to tap into this information pool with their own specific applications
and frameworks (such as those discussed in Section 2.2).
Figure 9: Conceptual framework of an operational data platform on HESS indicators derived fromremote sensing and hydrological modeling.
25
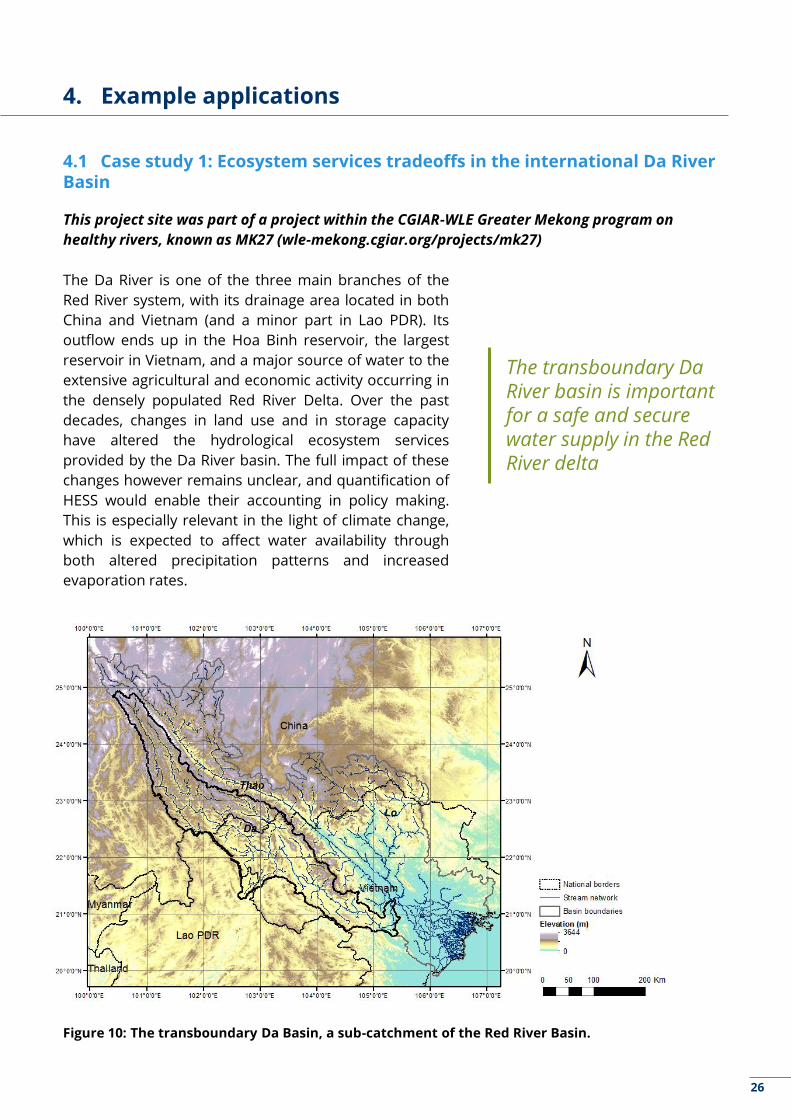
4.1 Case study 1: Ecosystem services tradeoffs in the international Da River Basin
The Da River is one of the three main branches of the
Red River system, with its drainage area located in both
China and Vietnam (and a minor part in Lao PDR). Its
outflow ends up in the Hoa Binh reservoir, the largest
reservoir in Vietnam, and a major source of water to the
extensive agricultural and economic activity occurring in
the densely populated Red River Delta. Over the past
decades, changes in land use and in storage capacity
have altered the hydrological ecosystem services
provided by the Da River basin. The full impact of these
changes however remains unclear, and quantification of
HESS would enable their accounting in policy making.
This is especially relevant in the light of climate change,
which is expected to affect water availability through
both altered precipitation patterns and increased
evaporation rates.
Figure 10: The transboundary Da Basin, a sub-catchment of the Red River Basin.
This project site was part of a project within the CGIAR-WLE Greater Mekong program on
healthy rivers, known as MK27 (wle-mekong.cgiar.org/projects/mk27)
4. Example applications
The transboundary Da River basin is important for a safe and secure water supply in the Red River delta
26

The SPHY model was set up at a 500 x 500 m resolution with daily time steps for a period of 11
years (1 January 2000 - 31 December 2010), in order to simulate baseline conditions in Da River
Basin. The satellite-based MODIS Normalized Difference Vegetation Index (NDVI) product was
used to implement temporal vegetation dynamics. The spatially explicit nature of the SPHY model
allows for the identification of locations with particularly high or low values for a certain HESS
indicator. FIgures 12 and 13 demonstrate two of the resulting maps, for the HESS microclimate
cooling and natural fuelwood production respectively.
Figure 11: Performance of the SPHY model in predicting streamflow at the downstream end of Da River Basin (inflow into Hoa Binh reservoir). Qobs represents measured values, Qmod depicts model results.
In addition to an assessment of the current situation,
the SPHY model was used for simulating different
future scenarios. The objective of this assessment is
to provide regional policy makers with spatial,
quantitative information on HESS under different
future scenarios, thus supporting the definition of
policies which can increase total HESS. The following
page lists all scenarios that were evaluated. Scenarios
A to E essentially amount to changes in land cover
parameters, in order to use analyze the impact of
different management interventions that regional
planning agencies may consider. Scenarios F1 and F2
serve to investigate the impact of predicted changes
in climate. In these scenarios, precipitation and
temperature forcing was altered with delta change
factors obtained from running the online climate
modeling tool Climate Explorer.
1climexp.knmi.nl
27

0
A1
A2
B
C
D
E
F1
F2
Baseline conditions (2000-2010)
Deforestation within existing forested areas (5%) and conversion into rainfed cropland
Deforestation by thinning of existing forests
Reforestation (10%)
Urban expansion (500 m buffer around urban centers)
Increase irrigated acreage (10%)
More surface water storage – addition of a new hydropower reservoir
Projected climate in 2050s (1.5 °C temperature rise)
Projected climate in 2090s (1.5 °C temperature rise and 6% rainfall increase)
Eight different scenarios were evaluated for Da River Basin
28

Figure 12: Micro-climate cooling in Da River Basin under baseline conditions.
Figure 13: Natural fuelwood production in Da River Basin under baseline conditions.
29

For each of the HESS, baseline maps were compared to expected changes in the different future
scenarios, to assess tradeoffs in a spatially explicit manner. Figure 14 depicts how the expected
temperature increase due to climate change is expected to lead to reduced groundwater
recharge in the 2050s. As the evaporative demand of the atmosphere will increase, partitioning
between evapotranspiration and runoff will shift and less water will percolate to replenish the
aquifers, leading to a reduction of this particular HESS.
Figure 14: Predicted changes in groundwater recharge in the 2050s as compared to baseline conditions.
Table 1 summarizes all evaluated HESS provided by Da River Basin under baseline conditions, as
well as three selected scenarios. The table clearly shows how tradeoffs in HESS can occur due to
shifts in land management or climate patterns. Even deforestation leads to improved values of
certain HESS, such as streamflow in the dry season and environmental flow. Naturally, however,
sediment yield from the basin will increase substantially with the removal of forest, as well as
peak flows and corresponding flood risk. Climate change also has an ambiguous effect on the
general state of HESS provided by the basin. Da River Basin is clearly not a water-limited system,
as the predicted temperature rise in the 2050s (F1) is expected to lead to increased plant
transpiration and enhanced provisioning services from biomass, such as crop production and
fuelwood. As precipitation amounts change further into the future (F2), these provisioning
services will improve even further, although at the cost of higher erosion and peak flows. It is
interesting to observe that 7 out of the 11 HESS values will increase with climate change. Focusing
on a single HESS value thus provides an incomplete picture.
For the sake of brevity, Table 1 only shows annual averages and therefore relates to long-term
trends under the different scenarios. However, as the SPHY model is run with daily time steps and
input data from remote sensing is frequently updated, also the timing of HESS provision can be
evaluated and the impact of temporal shifts (e.g. of water availability) can be evaluated.
30
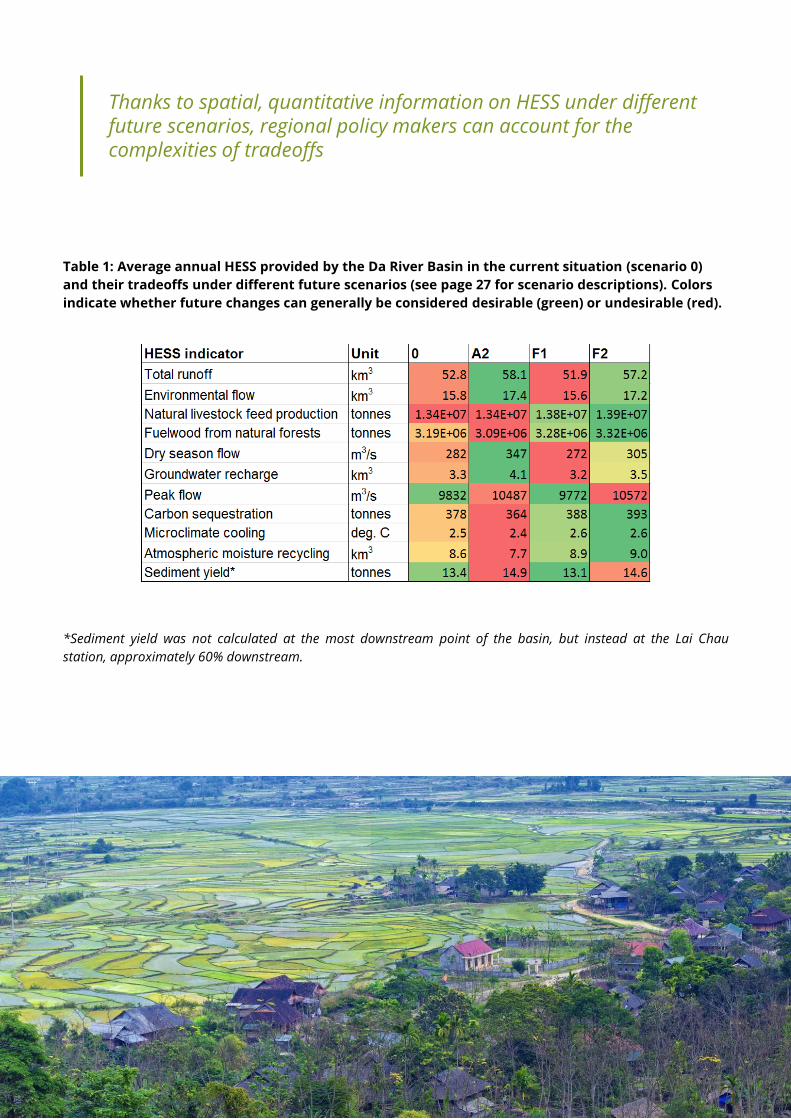
*Sediment yield was not calculated at the most downstream point of the basin, but instead at the Lai Chau
station, approximately 60% downstream.
Table 1: Average annual HESS provided by the Da River Basin in the current situation (scenario 0)
and their tradeoffs under different future scenarios (see page 27 for scenario descriptions). Colors
indicate whether future changes can generally be considered desirable (green) or undesirable (red).
Thanks to spatial, quantitative information on HESS under different future scenarios, regional policy makers can account for the complexities of tradeoffs
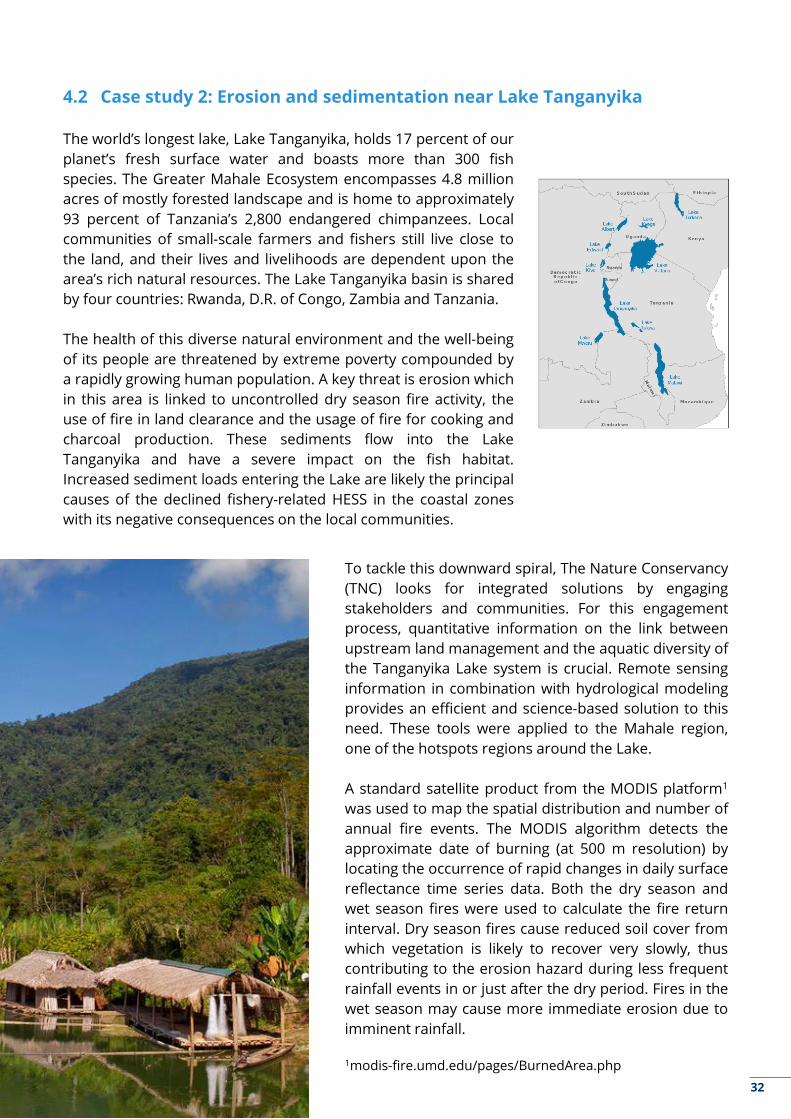
4.2 Case study 2: Erosion and sedimentation near Lake Tanganyika
The world’s longest lake, Lake Tanganyika, holds 17 percent of our
planet’s fresh surface water and boasts more than 300 fish
species. The Greater Mahale Ecosystem encompasses 4.8 million
acres of mostly forested landscape and is home to approximately
93 percent of Tanzania’s 2,800 endangered chimpanzees. Local
communities of small-scale farmers and fishers still live close to
the land, and their lives and livelihoods are dependent upon the
area’s rich natural resources. The Lake Tanganyika basin is shared
by four countries: Rwanda, D.R. of Congo, Zambia and Tanzania.
The health of this diverse natural environment and the well-being
of its people are threatened by extreme poverty compounded by
a rapidly growing human population. A key threat is erosion which
in this area is linked to uncontrolled dry season fire activity, the
use of fire in land clearance and the usage of fire for cooking and
charcoal production. These sediments flow into the Lake
Tanganyika and have a severe impact on the fish habitat.
Increased sediment loads entering the Lake are likely the principal
causes of the declined fishery-related HESS in the coastal zones
with its negative consequences on the local communities.
To tackle this downward spiral, The Nature Conservancy
(TNC) looks for integrated solutions by engaging
stakeholders and communities. For this engagement
process, quantitative information on the link between
upstream land management and the aquatic diversity of
the Tanganyika Lake system is crucial. Remote sensing
information in combination with hydrological modeling
provides an efficient and science-based solution to this
need. These tools were applied to the Mahale region,
one of the hotspots regions around the Lake.
A standard satellite product from the MODIS platform1
was used to map the spatial distribution and number of
annual fire events. The MODIS algorithm detects the
approximate date of burning (at 500 m resolution) by
locating the occurrence of rapid changes in daily surface
reflectance time series data. Both the dry season and
wet season fires were used to calculate the fire return
interval. Dry season fires cause reduced soil cover from
which vegetation is likely to recover very slowly, thus
contributing to the erosion hazard during less frequent
rainfall events in or just after the dry period. Fires in the
wet season may cause more immediate erosion due to
imminent rainfall.
1modis-fire.umd.edu/pages/BurnedArea.php
32

Figure 15: Fire return interval (left) and mean annual erosion rate (right).
The satellite-derived fire return interval for each location was related to the hydrological and
erosion parameters in the hydrological model SPHY. Figure 15 shows that patterns of fire return
interval and erosion are linked to some extent, but in some areas with steep slopes combined
with dense vegetation show substantially lower erosion rates. Other areas are relatively prone to
erosion due to wildfires and lower vegetation cover. For the northern and southern parts of the
study area, runoff and erosion is relatively low: these areas have a relatively low slope, and only
minor cultivated areas. The combination of remote sensing information and hydrological
modeling was used to obtain quantitative insight in how the interplay between hydrology and
erosion processes determine HESS provision for different land use types.
TNC is using this spatially explicit information to target certain priority areas and focal issues.
These results showed that especially wildfires in the bamboo zone contribute significantly to the
total sediment load entering the Lake. Another critical land use is the Miombo woodland, which is
by far the principal land cover (>60%) in the region, and contributes considerably to the erosion
hazard (27%). Another important outcome of the analysis is the influence of newly cultivated area,
which has increased by more than 50% over the last 10 years. The analysis shows that the newly
cultivated areas contribute an additional 14% of sediment to the total sediment yield of the area.
The combination of remote sensing information and hydrological modeling was used to quantify how the interplay between hydrology and erosion processes determines HESS provision for different land use types.
33
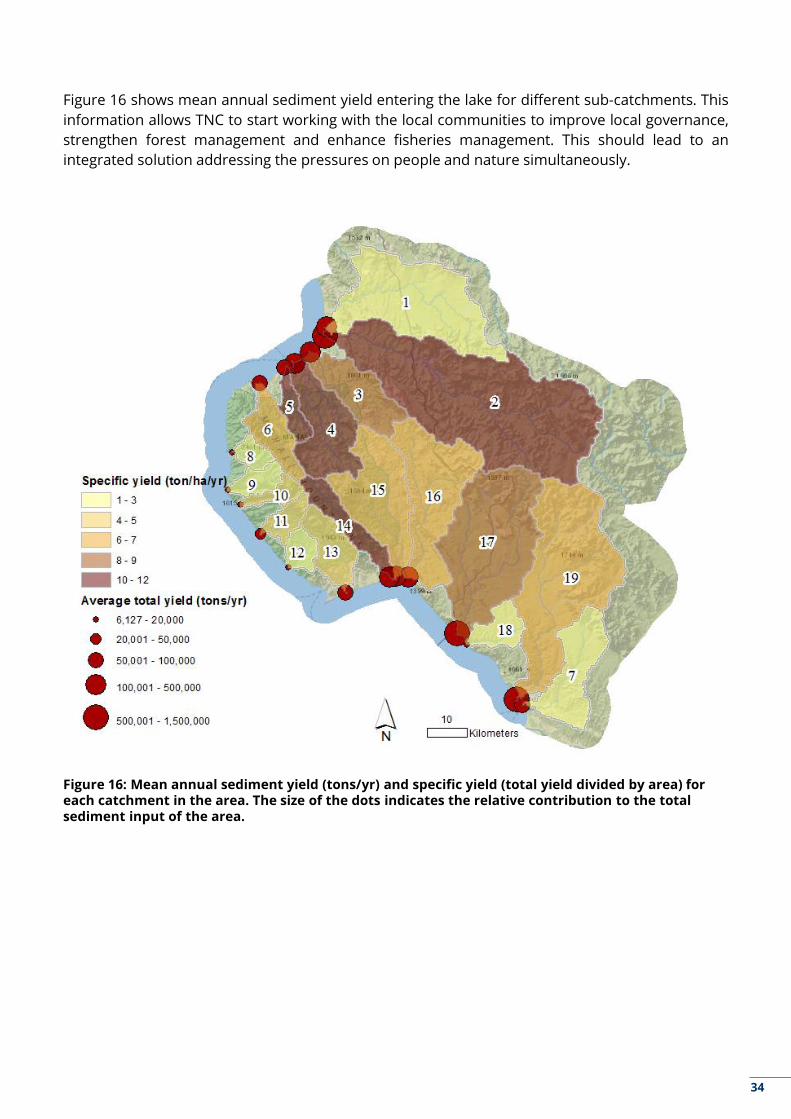
Figure 16: Mean annual sediment yield (tons/yr) and specific yield (total yield divided by area) for each catchment in the area. The size of the dots indicates the relative contribution to the total sediment input of the area.
Figure 16 shows mean annual sediment yield entering the lake for different sub-catchments. This
information allows TNC to start working with the local communities to improve local governance,
strengthen forest management and enhance fisheries management. This should lead to an
integrated solution addressing the pressures on people and nature simultaneously.
34

4.3 Case study 3: Estimating carbon stocks in the Greater Mekong region
Remote sensing offers exciting opportunities to
compare the conditions of a landscape in a
standardized and reproducible manner. However,
to obtain, process and interpret satellite data
requires technical expertise and is a time and
resource consuming endeavor. Recent technological
advances such as Google Earth Engine platform
allow natural resources managers to investigate
natural capital in a fast and cost effective manner.
Readily available satellite-derived products (such as
those related to vegetation health, the leaf area of
trees, temperature, carbon, etc.) provide valuable
direct or indirect information on the ecosystem
services delivered by the landscape.
Figure 17: Estimated market value of carbon stocks in the
Greater Mekong Subregion at the country level.
In this section we demonstrate how MODIS products that estimate Gross and Net primary
Production (NPP & GPP)1 can be used to estimate the value of carbon gained or lost by vegetation
on a country scale. Based on these data products, changes in the estimated net carbon stored for
the period 2011 - 2014 are compared with a baseline period (2001 - 2010). Cumulative changes in
net carbon storage are monetized using a value of $15 per ton of CO2.
1www.ntsg.umt.edu/project/MOD17
Satellite-derived information on ecosystem services allow countries to monetize natural capital and estimate net benefits of environmental protection
35
Figure 17 shows that all
countries in the Greater
Mekong region experience a
decline in net carbon storage
in 2011 - 2014 when compared
to the period 2000 - 2010.
Numbers add up to over 16
billion dollar for Myanmar and
Thailand, but Vietnam and
Cambodia have losses of 6
and 10 billion dollar
respectively. Moreover, losses
are in the same order of
magnitude for all years and do
not seem to stabilize.
Environmental protection
programs may improve
carbon storage capacity of the
countries.

High resolution satellite data also allow to map the areas with the highest gain or loss in net
carbon. These spatial maps allow policy makers to quickly and intuitively identify regions
undergoing environmental degradation and/or areas with the best return on investment for
various types of intervention.
Figure 18: Carbon storage measured from space. The years 2013 - 2014 were compared to the baseline period 2001 - 2012. Green colors indicate an increase in storage, red colors a decrease (Map data ©2017 Google, SK telecom, ZENRIN).
36

Figure 20: A global map of precipitation (P) minus Evapotranspiration (ET) for the year 2009. CHIRPS is used for P and MOD16 is used for ET.
4.4 Case study 4: Quantifying HESS on the global scale
Recent progress in the field of remote sensing, storing capacity and computational power allow to
estimate hydrological ecosystem services on a planetary scale (Simons et al., 2016). Complete
archives on rainfall products such as CHIRPS and GPM are readily available and can be used to
estimate water inflow into river basins. Although more global products on evapotranspiration (ET)
such as MOD16, EEflux1, SSEBop2 and the Surface Surface Energy Balance Algorithm for Land
(SEBAL) will gradually become available on the Earth Engine, they are not fully operational yet.
Meanwhile, the archives of the IHE-Delft ET Ensemble product will be uploaded to the cloud and
can be accessed for high performance parallel computing architecture.
Figure 19: Downscaled ET for the Ca river basin in Vietnam (values in mm/month).
With no limitations on storage space and computational demand, we can apply a simple water
balance equation of Precipitation (P) minus ET at the global scale (Figure 20). Where procedures
to estimate yearly runoff from satellite imagery were time and resource consuming in the past,
total annual runoff can now be calculated easily for any location with unprecedented precision.
For most basins, estimates of ET are
specifically important, as ET is not
measured in a routine manner while
it accounts for a large portion of the
water balance. Sophisticated
calculations using the energy balance
fill this gap and provide water
resource managers with valuable
information. An example is shown in
Figure 19. It shows monthly ET on a
30 meter spatial resolution for the Ca
river basin in Vietnam. It illustrates
that remote sensing has reduced the
need for extensive field campaigns
and elaborate sensor networks, as
satellites measures large areas in a
standardized and routinely manner.
1eeflux-level1.appspot.com, 2earlywarning.usgs.gov/docs/SSEBopETreadme.pdf
37

Figure 22: Global runoff anomaly in the El Nino year 2009 - 2010 for December until February computed with a preliminary version of the WaterPix model (Poortinga et al., 2017).
A recent publication of Poortinga et al. (2017) presents a novel way to partition maps of P-ET into
surface runoff and groundwater recharge. The method makes use of satellite-derived
estimates of precipitation, evapotranspiration, soil moisture and Leaf Area Index to separate
runoff and storage changes. This method is specifically suitable for cloud-based computational
platforms in ungauged river basins. The empirical formula of the Soil Conservation Service to
calculate runoff from rainfall, soil moisture and interception was used, after an innovative self-
calibration method, to calculate the runoff anomaly for El Nino event in 2009 - 2010 for the
months December - January (Figure 22). It can be seen that large parts of South-East Asia and
northern Latin America experience a severe runoff deficit, whereas runoff in parts of North
America and Argentina is significantly higher compared to average years.
Figure 21: Cumulative P-ET (precipitation - evapotranspiration) in California (2007-2013).
California has been challenged by drought
and groundwater depletion in the recent
past. We investigated water resources in
California for the period 2007-2013.
Figure 21 shows cumulative P-ET in this
period. The areas with higher ET than
rainfall are indicated with a red color.
These are mostly irrigated agricultural
areas. The net water consumption areas
are indicated with a red color. These are
mostly irrigated areas or areas with
Groundwater Dependent Ecosystems
(GDE). The graph in Figure 21 shows the
evolution of the cumulative P-ET trend for
the entire state. It can be seen that 2007,
2012 and 2013 were dry years with a
negative water balance, while the other
years have a positive water balance. Maps
on the overexploitation of water are
useful to investigate viable mitigation
measures, as they provide quantitative
insights on the problems at hand.
38
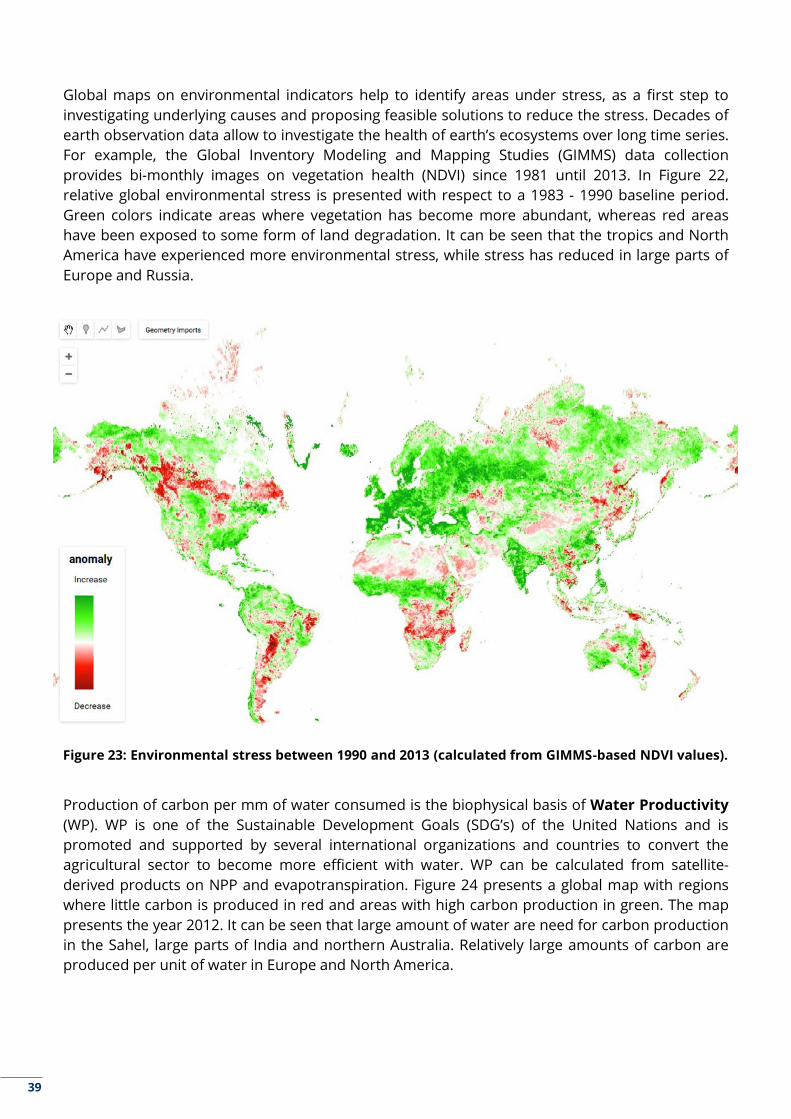
Figure 23: Environmental stress between 1990 and 2013 (calculated from GIMMS-based NDVI values).
Global maps on environmental indicators help to identify areas under stress, as a first step to
investigating underlying causes and proposing feasible solutions to reduce the stress. Decades of
earth observation data allow to investigate the health of earth’s ecosystems over long time series.
For example, the Global Inventory Modeling and Mapping Studies (GIMMS) data collection
provides bi-monthly images on vegetation health (NDVI) since 1981 until 2013. In Figure 22,
relative global environmental stress is presented with respect to a 1983 - 1990 baseline period.
Green colors indicate areas where vegetation has become more abundant, whereas red areas
have been exposed to some form of land degradation. It can be seen that the tropics and North
America have experienced more environmental stress, while stress has reduced in large parts of
Europe and Russia.
Production of carbon per mm of water consumed is the biophysical basis of Water Productivity
(WP). WP is one of the Sustainable Development Goals (SDG’s) of the United Nations and is
promoted and supported by several international organizations and countries to convert the
agricultural sector to become more efficient with water. WP can be calculated from satellite-
derived products on NPP and evapotranspiration. Figure 24 presents a global map with regions
where little carbon is produced in red and areas with high carbon production in green. The map
presents the year 2012. It can be seen that large amount of water are need for carbon production
in the Sahel, large parts of India and northern Australia. Relatively large amounts of carbon are
produced per unit of water in Europe and North America.
39

Figure 24: Amount of carbon produced per mm of water in the year 2012.
40
Sustainable planning of scarce water resources to secure food production and economic growth
without further environmental degradation is urgently needed. Most ecosystem services, and
certainly those related to the water cycle, have long been under-acknowledged and undervalued.
Two main causes for the lack of explicit uptake of Hydrological EcoSystem Services (HESS) in
policy frameworks can be identified:
1. Assessing and modeling the status and change of natural capital is challenging. This is the
case all over the world, including relatively data-rich areas.
2. Even in areas with responsive and responsible environmental policy frameworks, policy
processes are not designed to respond to new information about ecosystem management
tradeoffs
In this white paper, we present the definition of a standard set of HESS indicators and
demonstrate how an integrated toolset of state-of-the-art remote sensing and hydrological
models can be put to use to quantify and value them. Thanks to earth-observing satellites, spatial
data and long time series of important indicators of ecosystem health and hydrological processes
are available irrespective of political borders and terrain accessibility. Information that cannot be
directly distilled from remote sensing can be obtained by running hydrological models, which are
fed and calibrated by satellite data. Next to completing the outlook on the eco-hydrological
system, these models offer the chance to look into the future and evaluate different scenarios, as
demonstrated in Section 4.1 of this white paper.
Coupled with powerful new geospatial information technologies, the integration of remote
sensing and simulation models sets the stage for an operational system that can provide
geospatial data on hydrological ecosystem services in data-scarce areas. By combining this
information with simulation models, scenario analyses can be performed which allow policy
makers to evaluate the expected impacts of different land and water management policies and
anticipate on changing conditions under climate change. As explained in this white paper, it is
important to examine ecosystem services of both consumptive and non-consumptive water use,
and maximize the benefits associated with water consumption: the water that truly disappears
from the watershed.
Although this is an important step towards addressing the first challenge identified above, actual
uptake of this information in policy frameworks remains a prerequisite for truly altering
management of water resources. How easily decision makers can acquire the information they
need, in the form they need it, and when they need it, will determine its use. SERVIR and other
initiatives that base their work on the needs of end users can be key agents for operationalizing
systems to enhance access to information and increase transparency. As such systems
become more common and prove their worth in environmental management, it is expected that
decision-making processes will benefit from (and maybe even adapt to) this new pool of valuable
and timely information.
5. Concluding remarks: mainstreaming assessments of hydrological ecosystem services into decision making
41

Figure 25: Historical development and future outlook regarding satellite-based sensors, scientific advances, computational power and storage capacity.
This white paper puts in evidence that nowadays, the technology and science is sufficiently
mature to provide clear-cut and policy-oriented spatial information on HESS. Decades of
development and new technologies in sensors, satellite platforms, data storage and
computational power have resulted in advanced tools (Figure 25) that are already being used for
policy change as demonstrated in the case studies (Section 4). As the digital information age
advances, future progress is expected to enable further upscaling and standardization of
operational monitoring of Hydrological Ecosystem Services.
42
The list of literature below contains the sources referenced in this white paper, as well as
additional recommended literature on Hydrological Ecosystem Services; their background and
classification as well as the existing technologies for quantifying them using satellite-derived data
products and hydrological models.
Bastiaanssen, W.G.M., P. Karimi, L-M., Rebelo, Z. Duan, G. Senay, L. Muttuwatte and V. Smakhtin, 2014.
Earth Observation-based Assessment of the Water Production and Water Consumption of Nile Basin
Agro-Ecosystems, Open Access Remote Sensing, special issue on water resources in Africa, 6, 10306-
10334;doi:10.3390/rs6111030
Bastiaanssen, W.G.M. and P. Steduto, 2017. The Water Productivity Score (WPS) at Global and Regional
Level: Methodology and first global results from remote sensing for wheat, rice and maize, Science of
the Total Environment, Volume 575, 1 January 2017, Pages 595-611
Boyd, J., & Banzhaf, S. (2007). What are ecosystem services? The need for standardized environmental
accounting units. Ecological Economics, 63(2–3), 616–626. doi.org/10.1016/j.ecolecon.2007.01.002
CGIAR Research Program on Water Land and Ecosystems: Ecosystem services and resilience
framework., 2014, www.iwmi.cgiar.org/Publications/wle/corporate/ecosystem_services_and_resilience_
framework.pdf
Coates, D., Pert, P. L., Barron, J., Muthuri, C., Nguyen-Khoa, S., Boelee, E. and Jarvis, D. I.: Water-related
Ecosystem Services and Food Security, Manag. Water Agroecosystems Food Secur., 29–41,
doi:10.1079/9781780640884.0029, 2013
Costanza, R., d’Arge, R., De Groot, R., Farber, S., Grasso, M., Hannon, B., … Paruelo, J. (1998). The value
of the world’s ecosystem services and natural capital. Ecological Economics, 25(1), 3–15
De Groot, R. S., Fisher, B., Christie, M., Aronson, J., Braat, L., Haines-Young, R., … Polasky, S. (2010).
Integrating the ecological and economic dimensions in biodiversity and ecosystem service valuation.
Retrieved from agris.fao.org/agris-search/search.do?recordID=NL2012032162
Duku, C. et al., 2015. Towards ecosystem accounting: A comprehensive approach to modelling multiple
hydrological ecosystem services. Hydrology and Earth System Sciences, 19(10), pp.4377–4396
Farber, S., Costanza, R., Childers, D. L., Erickson, J., Gross, K., Grove, M., … Troy, A. (2006). Linking
ecology and economics for ecosystem management. Bioscience, 56(2), 121–133
Fisher, B., & Kerry Turner, R. (2008). Ecosystem services: Classification for valuation. Biological
Conservation, 141(5), 1167–1169. doi.org/10.1016/j.biocon.2008.02.019
Fisher, B., Turner, R. K., & Morling, P. (2009). Defining and classifying ecosystem services for decision
making. Ecological Economics, 68(3), 643–653. doi.org/10.1016/j.ecolecon.2008.09.014
Further reading
43

Hunink, J.E., S. Contreras, G.W.H. Simons, P. Droogers. 2017. Hydrological Evaluation and Ecosystem
Valuation of the Lukanga Swamps. FutureWater Report 167
Hunink, J.E., W. Terink, S. Contreras, P. Droogers. 2015. Scoping Assessment of Erosion Levels for the
Mahale region, Lake Tanganyika, Tanzania. FutureWater Report 148
Karimi, P., W.G.M. Bastiaanssen and D.J. Molden, 2013. Water Accounting Plus (WA+) – a water
accounting procedure for complex river basins based on satellite measurements, Hydrol. Earth Syst.
Sci., 17, 2459–2472
Karimi, P. and W.G.M. Bastiaanssen, 2015. Spatial Evapotranspiration, Rainfall and Land Use Data in
Water Accounting - Part 1: Review of the accuracy of the remote sensing data, HESS 19, 507–532
Kauffman, S., P. Droogers, J.E. Hunink, B. Mwaniki, F. Muchena, P. Gicheru, P. Bindraban, D. Onduru, R.
Cleveringa, J. Bouma. 2014. Green Water Credits - exploring its potential to enhance ecosystem services
by reducing soil erosion in the Upper Tana basin, Kenya. International Journal of Biodiversity Science,
Ecosystem Services & Management 10: 133-143
Lines, C., M. Werner and W.G.M. Bastiaanssen, 2016. The predictability of reported drought events and
impacts in the Ebro basin using six different remote sensing datasets, HESSD, doi:10.5194/hess-2016-
671
Millennium Ecosystem Assessment. (2005). Ecosystems and human well-being (Vol. 5). Island Press
Washington, DC. Retrieved from www.who.int/entity/globalchange/ecosystems/ecosys.pdf
Poortinga, A., W.G.M. Bastiaanssen, G. Simons, D. Saah, G. Senay, M. Fenn, B. Bean and J. Kadyszewski,
2017. A Self-Calibrating Runoff and Streamflow Remote Sensing Model for Ungauged Basins Using
Open-Access Earth Observation Data, MDPI Remote Sensing, Remote Sens. 2017, 9(1), 86;
doi:10.3390/rs9010086
Saah, D. and Troy, A, 2016. The Ecosystem Services Framework and its Application To Thanh Hoa and
Nghe An, SIG report prepared for Vietnam Forests and Deltas (VFD) program, Vietnam
Simons, G.W.H., W.G.M. Bastiaanssen and W.W. Immerzeel, 2015. Water reuse in river basins with
multiple users: a literature review, J. of Hydr. 522: 558-571
Simons, G., Bastiaanssen, W., Ngô, L., Hain, C., Anderson, M. and Senay, G.: Integrating Global Satellite-
Derived Data Products as a Pre-Analysis for Hydrological Modelling Studies: A Case Study for the Red
River Basin, Remote Sens., 8(4), 279, doi:10.3390/rs8040279, 2016
Terink, W., Lutz, A. F., Simons, G. W. H., Immerzeel, W. W. and Droogers, P.: SPHY v2.0: Spatial Processes
in HYdrology, Geosci. Model Dev., 8(7), 2009–2034, doi:10.5194/gmd-8-2009-2015, 2015
Than Ha, L., W.G.M. Bastiaanssen, A. van Griensven, A.I.J.M. van Dijk, J.P Guerschman and G.B. Senay,
2017. SWAT-CUP for the calibration of spatially distributed hydrological processes and ecosystem
services in a Vietnamese river basin using remote sensing, HESSD
Wallace, K. J. (2007). Classification of ecosystem services: problems and solutions. Biological
Conservation, 139(3), 235–246
44
The objective of this white paper is to demonstrate that, by leveraging state-of-the-art
technologies and remote sensing data, Hydrological EcoSystem Services (HESS) at the river
basin scale can be effectively described, quantified and compared in space and time. While
discussions on the theoretical framework are infinite, it is urgently needed to develop
procedures to quantify HESS and make them accessible to a large audience. Such efforts are
undertaken, for example, in the CGIAR WLE Greater Mekong and SERVIR-Mekong programs.
This white paper demonstrates collaborative efforts that draw from state-of-the-art technologies
to achieve this vision of enhanced quality and accessibility of spatially explicit HESS information.