Watershed Fish Production - Guide to Site Selection and Construction

On-site and Off-site Impact of Watershed Development: A Case Study of
Rajasamadhiyala, Gujarat, India
Sreedevi TK, Wani SP, Sudi R, Patel MS, Jayesh T, Singh SN and Tushar Shah. 2006. On-site
and Off-site Impact of Watershed Development: A Case Study of Rajasamadhiyala, Gujarat, India. Global
Theme on Agroecosystems Report no. 20, Patancheru 502 324, Andhra Pradesh, India: International Crops
Research Institute for the Semi-Arid Tropics.
An Open Access Journal published by ICRISAT________________________________________________________________________________________________________
SAT eJournal | ejournal.icrisat.org August 2006 | Volume 2 | Issue 1
1
Background
The world population is expected to touch 9.19 billion by 2050. Most of the population increase is
expected in developing countries in Asia and Africa (5.33 and 1.66 billion respectively). Each year
an additional 0.25 billion metric tons of grain must be produced to feed the increased population,
which is 21% increase in food production each year (Lecture 40 - World Food Problems). Looming
water scarcity over large parts of the world and increased withdrawal by agriculture from 2500 km3
in 2000 to 3200 km3 by 2025 (Shiklomanov, 1999) has attracted the attention of policy makers
and researchers for achieving food and water security. It is estimated that by 2025, one third of the
world’s population (especially in the developing countries) would face severe water scarcity. (Secklar
et al. 1998). To achieve food security, minimize the water conflicts and reduce poverty it has become
essential to increase productivity of rainfed systems by harnessing the existing potential (Wani et al.
2003). Globally 80% of agriculture is rainfed and contributes 60% to world’s food basket. Current
productivity levels of rainfed agriculture are low (<1 t ha-1). However, there are evidences to indicate
that productivity of rainfed systems could be doubled in Asia (Wani et al. 2001 and 2004) or even
quadrupled in Africa with adoption of appropriate soil, water and nutrient management (SWNM)
options (Rockstrom et al. 2003).
The comprehensive assessment (CA) program has initiated an exhaustive study to assess the water
needs for food production, which includes a multilevel assessment. The main objectives of the rainfed
project are:
• To quantify potential of rainfed systems for achieving food security;
• To quantify constraints, alternative technological, policy, and institutional options for achieving the
potential of rainfed systems; and
• To suggest intervention strategies including supplemental irrigation for increasing productivity
through enhanced resource use efficiency.
In order to assess the achievable yields on farmers’ field at micro-level we have adopted the approach
of detailed case studies in different regions where improved technologies are applied for increasing
productivity of rainfed systems. This case study is part of the larger study under the comprehensive
assessment of rainfed systems in the semi-arid tropics (SAT) of India, where micro-level studies at
watershed scale will be linked to meso and macro levels using simulation-modeling approach at eco-
regional and global scales. Main expected outputs from studies at different scales are to assess the
potential contribution of rainfed systems to global food basket, impact on livelihoods, environment,
policy and institutional guidelines to meet the achievable yields on larger scale and identify the
research and development needs to minimize the gap between potential and achievable yields of
important crops in the rainfed systems.
In India watershed management is adopted on a large scale for conserving rainwater and soil and also
for increasing production of rainfed systems (Wani et al. 2005). In India various watershed programs
have spent more than US$ 2 billion till 2004 (Joshi et al. 2004).
Introduction
Erratic and low rainfall, low fertility soils, poor infrastructure development, along with high population
pressure with low literacy levels are some of the main causes of poverty in the SAT. High demographic
pressure of one billion people in India and additional 519 million people are expected to be added by
2050. Furthermore 33% of the world’s population mostly from developing countries including India
will be affected by water scarcity by 2025. Inherent low fertility soils in the tropics are prone to severe
land degradation and 51% of India’s geographical area (329 million ha) is categorized as degraded,
most of which occurs in rainfed agro-eco systems (Wani et al. 2001). Water and soil resources are
An Open Access Journal published by ICRISAT________________________________________________________________________________________________________
SAT eJournal | ejournal.icrisat.org August 2006 | Volume 2 | Issue 1

2
finite, non-renewable over the human life time frame, and prone to degradation through misuse and
mismanagement (Lal 2000).
The Government of India (GOI) adopted watershed management as a strategy to address the
sustainable agricultural productivity in the rainfed areas since the last three decades. Further GOI
has adopted watershed management as a national policy since 2003 (Joshi et al. 2004). The case study
region of Sourashtra is characterized by low, erratic and undependable rainfall with low productive
soils. Scarcity of water for agricultural and domestic purpose remains a major problem in the region
and has led to low crop productivity and environmental degradation. Decline in per capita agricultural
production has seriously affected food security and livelihoods of people. Several studies have
highlighted that appropriate rainwater management and utilization results in enhanced agricultural
productivity (Samra 1997, Wani et al. 2003, Joshi et al. 2005). However, systematic assessment of
on-site and off-site impact studies of watershed development are lacking (Wani et al. 2004). Through
this study an attempt is made to study the on-site and off-site impact of considerable rainwater
harvesting measures implemented at Rajasamadhiyala watershed, in Rajkot district of Gujarat since
1978, and the specific watershed development activities initiated from 1995 onwards.
A comprehensive assessment of Rajasamadhiyala watershed was taken up under the present study
to assess the on-site impact of watershed development program as well as off-site impacts on
two downstream watersheds. The overall goal of this case study is to get insights into watershed
management programs as implemented and to identify the avenues for augmenting the progress and
impact of it in India. The specific objectives of the study were to:
i) To assess the impact of watershed development on crop production, crop and fodder productivity,
improved livelihoods, minimizing land degradation and groundwater availability in the micro-
watershed
ii) To assess the off-site impact on the downstream villages in terms of groundwater availability and crop
production, because of rainwater harvesting in the micro-watershed above on a toposequence
iii) To identify the gaps/constraints for increasing water productivity in the watershed for harnessing
full potential of rainfed systems.
Description of Watershed
Physiographical properties
Location
Rajasamadhiyala micro-watershed at latitude 22o 8’ 15”N to 22o 13’ 15”N, and longitude 70o 54’
30”E to 70o 59’ 15”E covering over an area of 1090 ha is situated 22 km from Rajkot in semi-arid
Saurashtra region, on Rajkot-Bhavnagar state highway in Rajkot District of Gujarat (Fig. 1). The
micro-watershed is surrounded by Lilisajadiyali, Lakhapur, Sardhar on upstream and Dhandhya,
Kasturba Dham (Tramba) and Aniyala villages on downstream along the toposequence.
Rainfall
The annual rainfall at Rajasamadhiyala during 2002–04 was 419, 709 and 490 mm respectively with
a mean annual rainfall of 539 mm (Fig. 2). Mean annual rainfall of Rajkot town located 20 km
downstream West of the watershed village during 1985–04 is 503 mm. The lowest rainfall recorded
during the past 20 years was 172 mm in 1987 and highest was 1016 mm in 1988. Rainfall received
was below normal in 12 out of 20 years (Fig. 3).
An Open Access Journal published by ICRISAT________________________________________________________________________________________________________
SAT eJournal | ejournal.icrisat.org August 2006 | Volume 2 | Issue 1

3
Figure 1. Physiographic map of Rajasamadhiyala micro-watershed.
Figure 2. Monthly distribution of rainfall at Rajasamadhiyala, Gujarat (2002–2004).
An Open Access Journal published by ICRISAT________________________________________________________________________________________________________
SAT eJournal | ejournal.icrisat.org August 2006 | Volume 2 | Issue 1

4
Soils
Soils in the watershed are shallow to medium deep black soils (inceptisols) and are formed on hard
rock bed. The soil depth ranges from 0.15 m to 1.25 m. Detailed analysis of surface soil samples
collected from different locations in the watershed in 2004 revealed that these were clay loam to
loamy soil. Moisture at field capacity (1/3 bar) ranged from 24.8 to 34.7% (mean 29.9%), and wilting
point (15 bar) from 16.6 to 23.1% (mean 20.2%). Plant available moisture of soil ranged from 8.0 to
12%. These soils were severely deficient in boron, zinc and sulphur along with nitrogen and medium
available phosphorus content (Table 1).
Table 1. Physical and chemical properties of surface (0–10 cm) soil samples from Rajasamadhiyala micro-watershed, 2004.
Physical properties Chemical properties
Texture pH 8.24
Clay (%) 19.3 Organic C (%) 0.81
Silt (%) 27.5 Total N (mg kg-1 soil) 810
Sand (%) 53.2 Olsen P (mg kg-1 soil) 8.69
Boron (mg kg-1 soil) 0.93
Moisture retention capacity Sulphur (mg kg-1 soil) 9.21
At field capacity (%) 29.9 Zinc (mg kg-1 soil) 0.50
At wilting point (%) 20.2 EC (Ds/m) 0.36
Geology and geohydrology
The oldest formation found in Rajasamadhiyala watershed is ‘Deccan Trap’ of Cretaceous-Eocene age.
Below the topsoil the weathered trap that is encountered has a thickness varying between 5 to 25 m.
Below the weathered trap, hard trap with secondary fillings and occasional fractures are encountered
with varying thickness. This is underlaid by a hard compact trap. The compactness of rock increases
with depth resulting in poor groundwater recharge in general.
The Deccan basalt trap being a volcanic consolidated rock unit does not have a well-defined aquifer
system due to lack of primary porosity. Groundwater is mainly confined to weathered zones within
shallow depths as well as in the cracks, fissures, joints and fractures.
Figure 3. Annual rainfall of Rajkot, Gujarat (1985–2004).
An Open Access Journal published by ICRISAT________________________________________________________________________________________________________
SAT eJournal | ejournal.icrisat.org August 2006 | Volume 2 | Issue 1

5
The fissures and other fracture filled channels cutting across the flows, occur as intrusive dykes. There
are innumerable dykes running not only vertically but also to a very deep extent. These weak zones
are the sources of recharging. Thickness of weathered zone varies widely giving rise to the highly
heterogeneous groundwater conditions.
Physiography
The physiography of watershed is gentle to moderate sloping with an average slope of 1–2%. The
land slope in upstream region is low (1.0%) and increases as it approaches downstream (2%). Farmers
reported that soils are deeper (1.0–1.25m) between Saran and Morabo streams, and also in the upper
portion where the slope is around 1% and lower region have very shallow to medium deep (0.15m to
<1.0m) in the portion with comparatively higher slopes (about 2%).
Drainage
The Rajasamadhiyala micro-watershed drains the excess runoff water into four major streams – Saran
nadi, Morabo nadi, Khari nadi and Dhadaklu nadi. These streams join the Aaji river at the downstream
of Rajasamadhiyala towards Rajkot (Fig. 1). A reservoir on Aaji river constructed near Rajkot town,
supplies water to the Rajkot town. Saran and Morabo streams emerge from Lakhapur and Sardhar
villages, Khari stream surfaces from Lilisajadiyali and partly from Dhandhiya. The Saran stream in
Rajasamadhiyala gets runoff water from Lakhapur watershed (about 50%) and Sardhar watershed
(about 25%) as base flow/seepage water flow, hence still water flow exists in this stream. Three
streams (Morabo, Khari and Dhadaklu) get less water compared to Saran. Due to good flow in Saran
stream, farmers are able to store the runoff water in water harvesting structures that have helped in
recharging of groundwater.
Crops
Groundnut and cotton are the predominant crops grown here. Some of the other crops are wheat,
pearl millet, sorghum, vegetables, maize, pigeonpea, sugarcane, cumin and lucerne fodder crop.
Due to additional availability of water in wells, farmers are now able to grow vegetable crops during
summer. Even after taking rainy season and postrainy season crops into consideration, they get a good
price for vegetables in summer. Mostly farmers with large families prefer to grow vegetables, as the
crops need timely availability of human labor to harvest and encash the market potential.
Demography
Rajasamadhiyala has a population of 1747 (male 872: 875 female) with 300 households and an
average family size of 5.8 members Forty four percent among these households are marginal with
<1 ha land holding, 38% are large with 74 ha land and 2% households are landless in Rajasamadhiyala
(Table 2). Watershed project covered 80% marginal, 81% small and medium, 80% large and 100%
landless households. Typically this village has mixed communities: Patels (50%), Darbars (10%),
Rajputs (20%), schedule caste (10%) and others (10%). This village has drinking water supplied
through pipeline, primary school, primary health centre, post office, telephone, electricity, cement
concrete roads, street lights, drainage, and a gram panchayat run fair price food grain shop, well
connected with road and an accessible market yard.
An Open Access Journal published by ICRISAT________________________________________________________________________________________________________
SAT eJournal | ejournal.icrisat.org August 2006 | Volume 2 | Issue 1

6
Table 2. Land holding households (HH) categories in Rajasamadhiyala.
Household categories Number of HH HH covered under project HH under project (%)
Marginal (<1ha) 132 105 79.5Small and medium (1–4 ha) 47 38 80.9Large (>4 ha) 115 92 80.0Landless 6 6 100.0Total 300 241 80.3
Major constraints
Prior to rainwater harvesting, acute water scarcity was the major constraint for agriculture. As the
watershed is in the semi-arid part of Sourasthra with low, erratic rainfall and for a short duration
coupled with high intensity, it leads frequently to crop failure and drought. For domestic purposes the
women of Rajasamadhiyala had to walk as much as 2.5 km previously to fetch water in summer. Poor
soils with low-water holding capacity and inherent low fertility resulted in low crop yields. Migration
of people to Rajkot in search of a livelihood used to be a very common feature.
Data Sources and Research Methodology
The present study is based on primary data collected through focused group discussions (FGDs)
as well as through stratified detailed household surveys. For the purpose of collecting primary data
sets of questionnaire was prepared by scientists of ICRISAT, IWMI and officials of BAIF. The team
visited the watersheds, conducted meetings with farmers and had elaborate discussions followed by
field visits to collect the primary information such as water conservation structures, groundwater,
agricultural crop productivity, water conservation and socioeconomic data (Fig. 4).
Figure 4. Meeting with farmers and watershed committees.
The primary data was collected through investigation of farmers with pre-tested questionnaires
and about 20% households/farmers were selected by stratified random sampling method in order
to collect data in Rajasamadhiyala watershed for on-site impact assessment and two downstream
villages to assess the off-site impact. The secondary data were collected from various sources like
reports prepared by BAIF an NGO, project implementing agency (PIA) for the watershed program,
Government of Gujarat. Data on expenditure incurred on various activities of watershed development
were compiled from the published report (GRISERV-BAIF, 2003) and Government of Gujarat
(2004). The storage capacity of water harvesting structures was quantified through detailed contour
survey and measurements.
An Open Access Journal published by ICRISAT________________________________________________________________________________________________________
SAT eJournal | ejournal.icrisat.org August 2006 | Volume 2 | Issue 1
7
For the water filled structures, capacity was measured by recording the area under submergence up
to outlet/crest level and depth of the water was measured at several places across the cross section
to calculate the volume of water stored in the structures. To ascertain the extent of groundwater
recharging due to water harvesting structures and natural recharging at Rajasamadhiyala the following
method was adopted:
Scenario based on lean, normal and good rainfall years was generated. Rainfall data (1968–04) of
Sardhar raingauge station (upstream of Rajasamadhiyala village) was used to generate scenario. The
years identified for carrying out the study were grouped as follows:
Rainfall classification Year Rainfall (mm)
Good 1994 803
Average 1996 573
Lean 1995 233
The quantum of water harvested naturally and through watershed interventions was computed for
different rainfall conditions. Based on the general values suggested for Saurashtra region and considering
the terrain of Rajasamadhiyala the natural recharge is considered as 15% of total precipitation for all the
three rainfall conditions. (Based on a study by PP Patel, Geologist, Salinity Ingress Prevention Circle, Rajkot, in Impact of Watershed Interventions on Groundwater in Rajasamadhiyala and Downstream
Villages, prepared by Rishab Hemani, IWMI External Researcher, 2005). The net quantity of water,
which additionally percolated through interventions, was computed by taking into account all the
watershed interventions in Rajasamadhiyala. The duration of water, which remained in the structure,
and area it covered, varied in different conditions of rainfall. Hence, appropriate assumptions were
made for the duration (days) for which water was retained in water harvesting structures covering
100% area at full reservoir level (FRL) and decreased to 60% of area in later days. Three percolation
rates of 20 mm day-1, 15 mm day-1 and 10 mm day-1 were adopted for different periods of monsoon,
to take into account the decreased percolation as substrata reaches saturation point.
Financial details were collected from PIA and Village Development Committee (VDC). The
hypothesis testing was used to verify the sample data. The statistical techniques such as percentage,
central tendency, and coefficient of variation, correlation, coefficient of determination were used to
analyze the primary data. The post project impact assessment of investment on watershed activities
in the village was carried out to examine the efficiency of economic returns, etc. In order to measure
the crop diversification, Hirschman-Herfindahl diversification index model was used.
Results and Discussion
On-site impact of watershed development
Rajasamadhiyala watershed was taken for investigation for the on-site impact of various watershed
activities such as water harvesting structures (causeways-cum-check dam, earthen bund, farm
pond, gully plug and percolation tank), agriculture, afforestation and animal husbandry. These were
implemented to support sustainable development of agricultural productivity, improving natural
resources and environmental quality, and livelihood which would contribute to food security. Impact
assessment is undertaken for the period since 1995 onwards only as baseline data were available
from 1995 when watershed program was initiated although rainwater harvesting was undertaken
An Open Access Journal published by ICRISAT________________________________________________________________________________________________________
SAT eJournal | ejournal.icrisat.org August 2006 | Volume 2 | Issue 1

8
since 1983. Large benefits through rainwater harvesting measures for 12 years prior to 1995 were
missed out for calculating the impacts whereas the expenses since 1983 were used as costs. This has
tremendously underestimated the impacts in terms of B:C ratio, cropping intensity, production and
productivity gains, groundwater recharge, etc.
Biophysical indicators
Process of development: The process of development began in 1978, when Sri Hardevsinh Jadeja
was elected as the sarpanch of the village. The Village Development Committee (VDC) was formed
constituting leaders representing different sections and communities.
The committee had pledged to eradicate the evils of blind faith from the village and unanimously
take decisions in all the matters of village development. The committee also guided and inspected
the functioning of the village panchayat. The selflessness and strong commitment of the committee
brought about the changes to transform the village from one of subsistence to one of prosperity. A
set of rules at community level were formulated and strictly adhered to maintain discipline in the
village (Government of Gujarat, 2004), which in turn played a key role in development process. The
committee chalked out various developmental initiatives. Initially these included, widening of roads,
renovation of Ram temple, getting rid of witch doctors, social ban on alcohol consumption and use
of plastics and later followed by construction of rainwater harvesting and groundwater recharging
structures, increase in cropping intensity or double cropping and crop diversification with help of
organizations like Bhartiya Agro Industries Foundation (BAIF), Indian Space Research Organization
(ISRO), and Government of Gujarat. The commitment and the fruits of their efforts received full
support and cooperation from the villagers. Since then, this village has become a model for other
neighboring villages (Fig. 5).
Figure 5. Well-built houses equipped with modern communication facilities.
Water harvesting and recharging structures
Construction of Rain Water Harvesting Structures (RWHS) was initiated in 1983. Initially, the VDC
with the strong support of Mr Jadeja had to convince the farmers to build the first water harvesting
structure. After realizing the benefits, it received full support and cooperation from the villagers. At
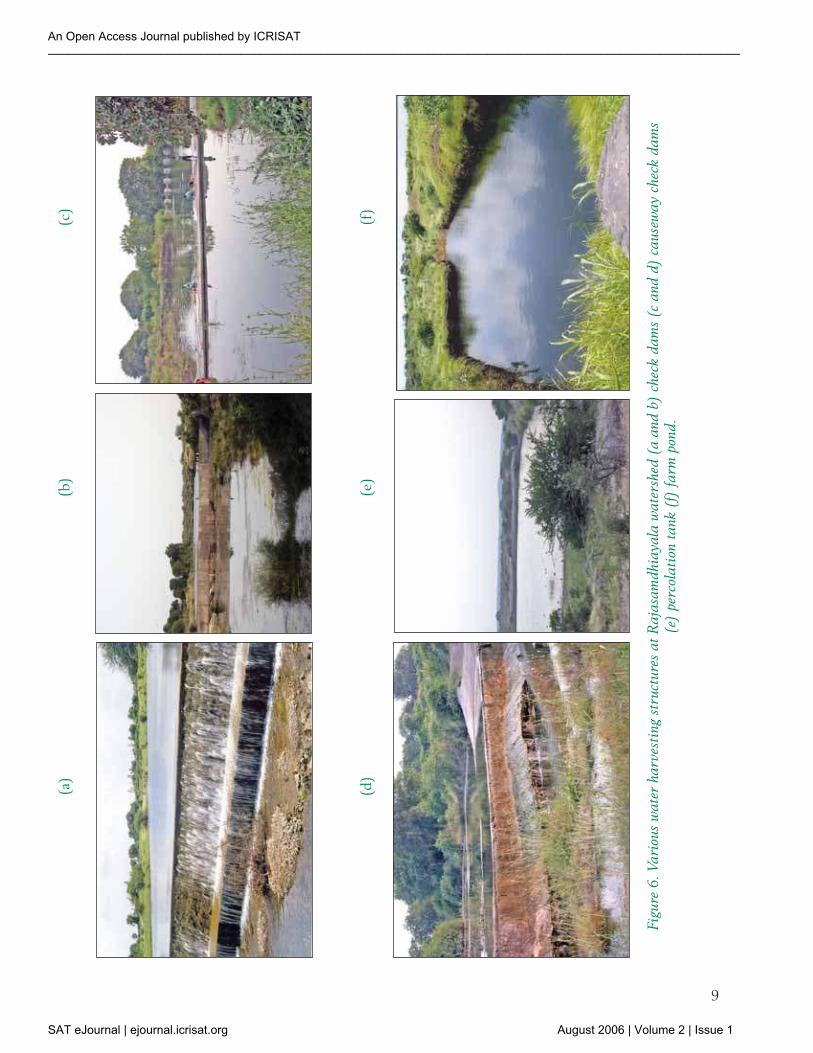
present there are 46 structures comprising of check dams, causeways-cum-check dams, percolation
tanks, and farm ponds (Fig. 6). These structures were constructed with the financial support from
various organizations like District Rural Development Agency (DRDA), grants given by Government
of Gujarat during drought years, Gujarat Water Supply and Sewage Board (GWSSB), Sampurna
Gramin Rojgar Yojana (SGRY) and some social welfare trusts like Rajkot Lodhika Sahakar Sangh. Total
investment of 16.25 million rupees in rainwater harvesting structures in Rajasamadhiyala is made since
1983. The Gujarat Rural Institute for Socio Economic Reconstruction (GRISERV-BAIF), Vadodara
implemented the watershed project during 1995 to 2003 with grants from the Gujarat Government.
An Open Access Journal published by ICRISAT________________________________________________________________________________________________________
SAT eJournal | ejournal.icrisat.org August 2006 | Volume 2 | Issue 1
9
(a)
(b)
(c)
(d)
(e)
(f)
Figu
re 6
. Vari
ous
wate
r ha
rves
ting
stru
cture
s at
Raja
sam
dhi
aya
la w
ate
rshe
d (
a a
nd b
) ch
eck
dam
s (c
and d
) ca
use
way
chec
k dam
s (e
) pe
rcol
ati
on t
ank
(f)
farm
pon
d.
An Open Access Journal published by ICRISAT________________________________________________________________________________________________________
SAT eJournal | ejournal.icrisat.org August 2006 | Volume 2 | Issue 1

10
Table 3. Details of water harvesting structures, storage capacities and average unit cost, 1995–2003.
Water harvesting structure
No. of structures
Storagecapacity
range(m3)
Total storagescapacity
(m3)
Average unit cost(Rs m-3)
Areabenefited
(ha)
Numberof wells
benefited
Numberof farmers benefited
Check dam 13 1000–15000 64410 17 149 65 57Causeway-cum-check dam
10 1266–11800 45855 28 132 63 55
Percolation tank 14 1100–132500 731811 20 461 149 101Farm pond 6 800 4800 24 9 4 3Earthen Bund 3 2550–4850 7385 7 4 2 2
The details of water harvesting structures
are given in Table 3. The storage capacity
of check dam/causeway cum check dams
ranged from 1000–15000 m3, and unit
cost of construction varied from Rs 10–49
m-3 of water stored benefiting 128 open
wells of 112 farmers with an area of 281
ha. Similarly percolation tanks with a larger
storage capacity vary from 7600–132500 m3
and the unit cost of construction worked
out to be Rs 5–38 per m3, has benefited
101 farmers with an area of 461 ha having
149 open wells. Farm ponds of 10 × 20 × 4
m were constructed with a unit cost of Rs
24 m-3 of stored water. The earthen bunds
with natural outlets were constructed with
considerably less cost of Rs 7 m-3. Details of
individual structures are given in Annexure
1. Details of watershed activities and the
expenditure incurred are shown in Annexure
2. The various activities taken up during the
watershed project were construction of water
harvesting structures, agricultural activities,
afforestation and animal husbandry. The
total amount spent was Rs 1.8 million, in
which Rs 0.12 million spent on entry point
activities, Rs 1.55 million on water harvesting
structures, Rs 0.042 million on agriculture,
Rs 0.050 million on afforestion and Rs 0.041
million on animal husbandry.
Total storage capacity of all the water
harvesting structures in the watershed is
855461 m3 or 79 mm or about 16% of mean
annual rainfall (mean of 20 years rainfall is
503 mm). This is equivalent to the potential
Box 1. Distress migration is a thing of past in Rajasamadhiyala.
Mr Devshibhai Kakadia sarpanch of the village
proudly stated that the village prosperity was
mainly due to the watershed interventions. “Not
only do we have no problem for drinking water but
also have sufficient water for irrigation purpose”.
Prior to implementation of watershed program,
crops used to suffer during drought and therefore
productivity and production would be low. As
drought was a regular phenomenon, many male
members would migrate to neighboring places or
Rajkot in search of sustenance. This situation has
changed tremendously during recent years with
the availability of sufficient water for farming due
to the introduction of watershed management.
Now we have increased earnings and prosperity
in the village. Also very few literates and skilled
people are now leaving the village as there is so
much work in the fields. We are now not only
harvesting three crops a year but also using
advanced machinery and tools”.
An Open Access Journal published by ICRISAT________________________________________________________________________________________________________
SAT eJournal | ejournal.icrisat.org August 2006 | Volume 2 | Issue 1

11
runoff during a normal rainfall year in the
watershed with an average unit cost of
construction of Rs 19 per m3. Considering
the percolation/seepage and evaporation
from the water harvesting structures, about
40% of mean annual rainfall can be harvested.
Despite this fact, during normal rainfall
years, 2–3 times overflow takes place from
the structures. In addition, downstream
watersheds get water through seepage/base
flow from these structures; hence they are
not affected by reduction in surface runoff
to their watershed due to the construction
of water harvesting structures in the
upstream watersheds coming from upstream
drains/streams. In addition to this, the
downstream watersheds have also benefited
by good groundwater recharge due to the
water harvesting structures constructed in
the upstream watersheds. This aspect of
subsurface water flows and runoff benefiting
the down stream villages in spite of huge
rainwater harvesting in Rajasamadhiyala
need to be considered along with geological
formation in the region. Formation of soil on
hard bed of basalt drastically affects ground
water recharge but benefits through perched
water table.
Indian Space Research Organization (ISRO),
Vadodara, helped in identifying groundwater
resource by using remote sensing technique
in delineating the lineaments (water carriers)
and dyke (water barriers) to open up the
potential aquifers ISRO has inferred from the study that four lineaments and one dyke run through
the watershed (Fig. 1). ISRO scientists advised the farmers to excavate pits at the spots where the
lineaments and dyke intersected to open up the aquifers to recharge the groundwater (Fig. 7). It
was found that this method increased the recharging potential by 125% (Government of Gujarat,
2004).
Table 4 shows the relation between the areas irrigated and production due to the water harvesting
structures during 1995, 1999 and 2004. Total production includes cereals (wheat, pearl millet,
sorghum and maize), pulses (mungbean, pigeonpea, blackgram, and chickpea), oil seeds (groundnut
and til), vegetables (brinjal, cluster bean, chilly, coriander and tomato), cash crops (cotton, sugarcanesugarcane
and cumin), green fodder (lucerne and maize). During 1995, the production per unit storage capacity
of WHS was 4.9 kg m-3 with an average production per unit area of 4443 kg ha-1. During 1999, the
production was 6.6 kg m-3 with an average yield of 5270 kg ha-1. During 2004, a 7.7 kg m-3 production
Box 2. Reduced drudgery for women
In the month of October 2004 the team visited
Rajasamadhiyala and interacted with a group of
women washing clothes on the wall of one of the
several masonry check dams in the village. Mrs Radha
Ben Timbedia a woman from the village washing
clothes at one of the check dams in Rajasamadhiyala
spoke with the team: “Earlier we used to walk a two
km stretch to fetch water and almost the whole day
we spent fetching water for household use. Now
we have enough water in the village itself. It has
relieved our drudgery of fetching water from long
distances. Now we can devote much more of our
time to either farming or to our children – thanks to
watershed development. Now we are sure that our
children will have a better life with education. Oursbetter life with education. Ourslife with education. Ours
is a happy family. It was not so 10 years ago”.
An Open Access Journal published by ICRISAT________________________________________________________________________________________________________
SAT eJournal | ejournal.icrisat.org August 2006 | Volume 2 | Issue 1

12
with an average yield of 5434 kg ha-1 was reported. The overall production of 6.5 kg m-3 of storage
capacity with an average yield of 5124 kg ha-1 was observed, which is about 33% increase in production
(kg) per unit storage capacity (m3), while there was a 15% increase in yield (kg) per unit area irrigated
(ha) in 2004 over 1995. This trend of increase in area irrigated and production due to increase in
storage of water harvesting structures was consistent and is further supported by statistical analysis.
The standard deviation of storage capacity from 1995 to 2004 was computed 792389.3 m3 and
coefficient of variation was 6.5%. The standard deviation of irrigated area was 145.3 ha and coefficient
of variation was 14.5%. The standard deviation of production was estimated 1042.3 t and coefficient
of variation was 20.2%. The storage capacity of water harvesting structures over a period of time in
comparison with area irrigated, production and the coefficient of variation, is quite consistent (Table 4).
Table 4. Water harvesting structures and its impact on area and production
Year
Rainfall(mm)
(1)
WHS storage capacity (m3)
(2)
Areairrigated
(ha)Yield
(kg ha-1)
Production(t)(3)
Production(kg m-3 of
storage capacity)
1995 307 699510 769 4443 3417 4.91999 311 806058 1005 5270 (19)* 5296 6.6 (35)2004 503 855461 1218 5434 (22) 6619 7.7 (59)Mean 510 792389.3 1001.9 5106 5173.5 6.5 (33)SD 185.4 51674.1 145.3 344.0 1042.4 0.91C.V (%) 36.3 6.5 14.5 6.7 20.2 14.1
* Values in parentheses are the percentage increase over 1995; No. of observations = 10.
Figure 7. Pit excavated at the intersection point of lineament and dyke.
An Open Access Journal published by ICRISAT________________________________________________________________________________________________________
SAT eJournal | ejournal.icrisat.org August 2006 | Volume 2 | Issue 1

13
Partial correlation between Rainfall (1), WHS (2) and Production (3)
r13.2
= –0.3796 Pro error = 0.314
r2 = 0.144
r23.1
= 0.9538 Pro error =0
r2 =0.909
The higher degree of correlation amongst storage capacity of water harvesting structures, area irrigated
and production was found. The coefficient of determination (r2) between storage capacity of water
harvesting structures and production was 0.95. This indicates the 95% change in the production was
influenced due to the storage capacity of water harvesting structures and remaining 5% by other
exogenous factors. The partial correlation between rainfall and production keeping water-harvesting
structures constant are –0.3796 and r2 is 0.144, which clearly indicate that there is no consistent
relationship between rainfall and production. The analysis reveals that crop production had increased
due to the water harvesting structures, which has nullified the effect of rainfall variability and increased
resilience during low rainfall/drought years.
Groundwater recharge and availability
The total recharge taking place through natural and water harvesting interventions is greatly affected
by the amount of rainfall, its intensity, duration of monsoon, ground and sub-surface characteristic
(i.e., percolation rate and runoff coefficient). The total storage capacity of all the water harvesting
structures is 0.855461 MCM or 79 mm. When all the structures are filled at FRL the area covered
by water is 0.3379 million sq. m. The recharge by all the structures is computed by area of ground
in contact with water, its duration of contact and percolation rate of upper soil strata. Considering
the terrain of Rajasamadhiyala the natural recharge percentage has been considered as 15% of total
precipitation for all the three rainfall conditions based on the values suggested for Saurashtra region
(based on study by PP Patel, Geologist, Salinity Ingress Prevention Circle, Rajkot. In Impact of
Watershed Interventions on Groundwater in Rajasamadhiyala and Downstream Villages, prepared by
Rishab Hemani, IWMI External Researcher. 2005). A detailed computation of total water recharge and
downstream runoff in Rajasamadhiyala village during good, average and lean rainfall year is presented
in Table 5. Total groundwater recharge and downstream runoff from Rajasamadhiyala watershed
during good, average and lean rainfall years estimated were 45% and 20%; 50% and 12%; 42% and
8% of rainfall, respectively.
Table 5. Groundwater recharging and downstream runoff in Rajasamadhiyala village.
Rainfall scenarioRainfall(mm)
Recharge through
CD & PT(mm)
Naturalrecharge
(mm)
Totalrecharge
(mm)
Totaldownstream
runoff(mm)
Good Rainfall year (1994) 803 241 (30)* 123 (15) 364 (45) 163 (20)Average Rainfall year (1996) 573 195 (34) 92 (16) 287 (50) 69 (12)Lean Rainfall year (1995) 233 61 (26) 37 (16) 98 (42) 19 (8)
* Values in parentheses are the percent of rainfall
An Open Access Journal published by ICRISAT________________________________________________________________________________________________________
SAT eJournal | ejournal.icrisat.org August 2006 | Volume 2 | Issue 1

14
The total water requirement for crop irrigation in Rajasamadhiyala for good, average and lean rainfall
year has been summarized in Table 6. It can be inferred from Table 6 that the total groundwater
recharge has increased by three folds in different rainfall situations. Water requirement in
Rajasamadhiyala has doubled after the watershed interventions due to increased cropping intensity
and change in cropping pattern. This has had a direct impact on production, productivity and income,
which have increased considerably.
Table 6. Pre- and Post-interventions scenario of total water requirement for crop irrigation and total groundwater recharge for good, average and lean rainfall years in Rajasamadhiyala.
Rainfallscenario
Pre-intervention groundwater (GW)scenario (mm)
Post-intervention groundwater (GW)scenario (mm)
TotalGW
recharge
Total water requirement for
irrigation
Netground water
balance
TotalGW
recharge
Total water requirementfor irrigation
Netground water
balance
Good 123 99 29 364 212 155
Average 92 79 13 287 165 122
Lean 37 39 -1 98 87 11
As many as 255 open wells existed in 1995, with very poor yield with an average water column of
5.9 m in 1995, but presently there are 308 wells with mean water column of 10.4 m (Fig. 8). The
average depth of wells in the watershed is 18 m. The increase in water column during rainy season
was 6.6 m, postrainy season was 5.3 m, and in summer was 1.3 m. Overall there has been an increase
of 4.4 m of water column in 2004, as compared to that of 1995.
Not only an increase in water column is observed, but significant improvement in water yield in wells
was also reported as evident by the duration of pumping hours per day for irrigation (Fig. 9 and 10).
The average pumping duration of 5.25 hours per day in 1995 has increased to 10.4 hours per day in
2004. This reveals that there has been a net increase of 5.2 hours per day of pumping. The increase
in pumping duration in rainy season was 9.5 h day-1, postrainy season was 5.25 h day-1, and in summer
was 0.75 h day-1.
Figure 8. Average water column in open wells.
An Open Access Journal published by ICRISAT________________________________________________________________________________________________________
SAT eJournal | ejournal.icrisat.org August 2006 | Volume 2 | Issue 1

15
The increased availability of water in wells has tremendously increased the area under irrigation
(Table 7). The increase in area under irrigation in 2003 over 1995 during rainy season, postrainy
season and summer were 60, 55 and 118% respectively. The overall total area increased by 58% under
irrigation.
Table 7. Area under irrigation (ha), 1995–2003
Cropping season 1995 1999 2003% Increase in 2003
over 1995
Rainy season 402 518 643643 60Postrainy season 356 469469 551551 55Summer 11 18 24 118Total 769 1005 1218 58
Figure 9. Average pumping duration of open wells.
Figure 10. Open well water level is up to the ground level recharged by water harvesting structure (WHS).
An Open Access Journal published by ICRISAT________________________________________________________________________________________________________
SAT eJournal | ejournal.icrisat.org August 2006 | Volume 2 | Issue 1

16
Similarly 102 bore wells were present in 1995; most of them were defunct with very low groundwater
level. At present 200 bore wells are in use. The density of open wells (number of wells per ha) in
1995, 1999 and 2003 was 0.23, 0.26, and 0.28 respectively, whereas bore wells was 0.09, 0.15, 0.18
respectively; and cumulative density of both open wells and bore wells was 0.38, 0.41, and 0.47
respectively over a period of time. The increase in number of wells and area irrigated has been due
to the significant improvement in groundwater level and yield attributed to the water harvesting
structures. This has significantly increased the irrigation facility and equipments procured by farmers
(Fig. 11 and Table 8). Watershed development in Rajasamadhiyala has impacted positively in termsFig. 11 and Table 8). Watershed development in Rajasamadhiyala has impacted positively in termsTable 8). Watershed development in Rajasamadhiyala has impacted positively in terms
of increased groundwater availability, which farmers have harnessed through doubling the hours of
pumping in 1999 as that of 1995 and also increased number of bore and open wells considerably. Area
under irrigation has also increased from 769 ha in 1995 to 1002 ha in 1999. Doubling of the number
of the bore wells in the watershed is a cause of concern as inspite of farmers’ experience of defunct
bore wells in 1995 and earlier, they have again drilled more bore wells than open wells. The marginal
positive groundwater balance in lean and average rainfall years could tilt to negative side very soon if
the farmers continued drilling bore wells and pumping at the rate they have done from 1995 to 1999.
Although, villagers acted collectively for water harvesting there is no concern or awareness amongst
the villagers for sustainable use of groundwater. There is an urgent need of community monitoring
of groundwater and its allocation to individuals. Similarly suitable policy for restricting drilling of
bore wells in developed watersheds is required to avoid the over-exploitation of groundwater by
individuals or community. If such policies or community initiatives are not there, soon the benefits
of well-developed watersheds would be undone and the villagers will be where they were prior to
watershed development or in a worse situation.
in cotton crop (c) drip irrigation set.
The number of diesel engine pumps declined by 22% over the period (1995 to 2003), while there
was considerable increase of 80% in the electric motor pumps. Such an increase in number of electric
pump-sets in spite of erratic power supply is mainly due to the subsidized electricity supply to the
farmers. The number of farmers who have procured pipeline for irrigation have increased by 156%,
which helps in preventing the water loss through seepage and increases the irrigation efficiency (Table
8). There was also considerable increase in procurement of drip and sprinkler irrigation sets too.
(a) (b) (c)
An Open Access Journal published by ICRISAT________________________________________________________________________________________________________
SAT eJournal | ejournal.icrisat.org August 2006 | Volume 2 | Issue 1

17
Table 8. Change in irrigation facility and equipments available in watershed (1995–2003).
Irrigation facility/equipments 1995 1999 2003Increase or
decrease (%)
Diesel engine pumps 208 188 162 -22Electric pump 205 281 368 80No. of farmers procured pipeline 48 84 123 156Drip irrigation set 16 22 38 138Sprinkler irrigation set 1 2 4 300
Table 9 reveals that the total number of farmers having access to irrigation has increased by 188% from
1995 to 2003. There has been a sharp increase in the number of marginal and small farmers who havemarginal and small farmers who havesmall farmers who have
access to irrigation compared to large farmers (172%) increased by 292 and 317% respectively.
Table 9. Change in the number of farmers having access to irrigation.
Farmerscategory 1995 1999 2003
Increase in 2003over 1995 (%)
Marginal 16 28 35 317
Small 25 82 9898 292Large 32 6565 8787 172Total 73 175 220 188
Increased water availability due to various watershed development activities encouraged private
investment from farmers on procurement of irrigation facilities and farm machineries. During the
project period private investment of Rs 10.5 million (million US$ 0.24) for construction of open and
tube wells, Rs 2.47 million (million US$ 0.06) on irrigation facilities and Rs 1.56 million (million
US$ 0.04) on threshers and tractors was used for the watershed program. This is an excellent
example of enhanced private investment in agriculture once the public investment through watershed
development ensured groundwater availability.
Cropping pattern, area, production and productivity
After the implementation of water harvesting system, considerable area was brought under irrigation
(Table 10) and 25 ha of wasteland were also brought under cultivation. Prior to the watershed
development program in the village, one crop in a year was harvested and vegetables were not grown.
After the implementation of watershed development program, there was considerable increase from 33
to 171 ha under double cropping (Table 11) owing to the availability of additional water (Fig. 12). At
present several farmers harvest around three crops in a year including vegetable crops.
Table 10. The land use pattern of watershed area (ha).
Land use 1995 1999 2003
Agriculture (rainfed) 372 278 212Agriculture (irrigated) 356 469 551Pasture 64 56 54Waste (uncultivated) 283 272 258Village 14 14 14
An Open Access Journal published by ICRISAT________________________________________________________________________________________________________
SAT eJournal | ejournal.icrisat.org August 2006 | Volume 2 | Issue 1

18
Figure 12. Good cotton crop in the Rajasamadhiayala watershed, 2004.
Figure 13. Change in cropped area over cultivable area in percentage.
Table 11. Change in cropping system area (ha year-1).
Cropping system 1995 1999 2003
Single crop 403 348 386Two crops 33 70 171Long duration crops 323 396 377Three crops 9 15 21Agro-horticulture 3 5 7Agro-forestry 7 11 15Perennial crop 2 3 3Pasture 64 56 54
Table 12 reveals the change in the area, productivity and yields of various crops grown during rainy,
postrainy and summer seasons over a period of time. In rainy season, the area under maize crop
increased sharply (55.56%) followed by vegetables (44.83%) and pearl millet (bajri) (37.5%) from
1995–96 to 2003–04. Although there was a considerable increase in the productivity of groundnut
(119.4%), but the area decreased by 13% during the same period. In rabi, the percent change in
the area of wheat cultivation was found highest (764%) followed by cumin (363%). The area under
pulses crops decreased by 20% in 2003–04 compared to 1995–96. The percent of total cropped area
in 1995, 1999 and 2003 is also provided in parenthesis in Table 12.
An Open Access Journal published by ICRISAT________________________________________________________________________________________________________
SAT eJournal | ejournal.icrisat.org August 2006 | Volume 2 | Issue 1

19
Table 12. Area, productivity and production of various crops in Rajasamadhiyala watershed.
Crops
1995 1999 2003
Area(ha)
Productivity(q ha-1)
Production(q)
Area(ha)
Productivity(q ha-1)
Production(q)
Area(ha)
Productivity(q ha-1)
Production(q)
Rainy season
Cotton 323 (44.5) 17.3 5594 396 (53.2) 24.8 (43)* 9833 377 (49.4) 26.6 (53)* 10021
Groundnut 338 (46.6) 7.1 2407 278 (37.3) 11.6 (63) 3219 294 (38.5) 15.6 (119) 4592
Jowar 7 (1.0) 14.3 100 5 (0.7) 16.7 (17) 84 9 (1.2) 18.1 (27) 163
Bajra 8 (1.1) 15.7 126 10 (1.3) 17.7 (12) 177 11 (1.4) 18.4 (17) 203
Maize 9 (1.2) 11.4 102 11 (1.5) 13.4 (18) 148 14 (1.8) 15.6 (37) 219
Vegetable 29 (4.0) 144.8 4200 33 (4.4) 162.5 (12) 5361 42 (5.5) 167.6 (16) 7039
Pulses 6 (0.8) 5.1 31 5 (0.7) 7.3 (42) 36 7 (0.9) 8.4 (65) 59
Other 6 (0.8) 4.1 25 7 (0.9) 4.9 (19) 34 9 (1.2) 5.3 (28) 47
Postrainy season
Wheat 14 (42.4) 16.8 236 37 (59.9) 28.3 (68) 1048 121 (70.8) 32.9 (95) 3979
Cumin 8 (24.2) 7.2 57 17 (24.3) 9.2 (28) 156 37 (21.6) 10.7 (50) 3967
Pulses 5 (15.2) 6.2 31 3 (4.3) 7.3 (18) 22 4 (2.3) 7.8 (27) 31
Vegetable 3 (9.1) 132.2 397 8 (11.4) 158.9 (20) 1271 5 (2.9) 162.2 (23) 811
Fodder 3 (9.1) 692.9 2079 5 (7.1) 778.6 (13) 3893 4 (2.3) 793.9 (15) 3176
Summer
Fodder 5 (13.5) 688.1 3441 8 (14.3) 762.8 (11) 6102 10 (13.2) 789.1 (15) 7891
Vegetable 4 (10.8) 128.1 513 7 (12.5) 152.7 (19) 1070 11 (14.5) 153.2 (20) 1685
Sugarcane 2 (5.4) 2042.8 4086 3 (5.4) 2188.3 (7) 6565 3 (3.9) 2218.5 (9) 6655
Maize+g.nut 19 (51.4) 382.9 7274 25 (44.6) 389.6 (2) 9739 34 (44.1) 397.5 (4) 13514
Pulses+g.nut 7 (18.9) (18.9) 5.2 36 13 (23.2)(23.2) 6.6 (28) 86 18 (23.7)(23.7) 7.9 (53) 142
* Percentage change of yield over 1995.
During summer, the area of vegetable crops was found to substantially increase (175%) followed by
pulses + groundnut (157.14%) and fodder (100%). Significant gains in crop productivity ranging from
15.72% in vegetables to 119% in groundnut crop were recorded in the watershed. The productivity of
crops grown in rainy and postrainy seasons was increased along with the area under cultivation.
The cropping intensity in 1995 was 114% subsequently in 1999 and in 2003 it was 130% and 164%
respectively (Table 11). Over a period of time, the cultivated area devoted to major crops viz., cotton,Over a period of time, the cultivated area devoted to major crops viz., cotton,
groundnut, wheat and cumin grew (Fig. 13 and Fig. 14). The cropping intensity increased in 1999 by
Figure 14. Crops diversification with sugarcane, cauliflower and ladies finger in Rajasamadhiyala.
An Open Access Journal published by ICRISAT________________________________________________________________________________________________________
SAT eJournal | ejournal.icrisat.org August 2006 | Volume 2 | Issue 1

20
16% over 1995 while in 2003 by 34% compared to 1995. As mentioned earlier, value for change in
cropping intensity during 1995 to 2003 was lower by 50% as against 66% observed in other watershed
programs in India (Joshi et al. 2005). This could be largely because the initial increase in cropping
intensity during 1983 to 1995 period could not be captured due to lack of baseline data in 1983.
Crop Diversification
Crop diversification over a period of time is measured using the Hirschman-Herfindahl diversification
index. The diversification index, calculated as DI = 1-H, where H is Hirschman-Herfindahl Index,
measured by (Pit/ P
it)2, P
it being the value of production at 2002–03 prices of the i-th crop in
year t. The higher diversity index indicates greater crop diversity in production patterns (Fig. 15).
Except pulse crops the indices of diversity for other remaining crops changed. The index of cotton
declined in 1999–2000 but sharply increased in 2003–04 which indicates higher diversification rather
than concentration in 1999–2000. The index of groundnut remains stable in 1999–00 the crop was
diversified marginally but in 2003–04 it was concentrated. The index of both wheat and cumin
crops declining continuously over a period, which indicates the concentration of crops during the
same period of time. The Diversification Index (DI) in the output mix declining continuously from
1995–96 to 2003–04 which indicates higher concentration of mixed crops on production pattern
rather than diversification. The results reveal that due to availability of water, crops like vegetables
and fodder are grown instead of cereal crops – further diversifying the crops.
With a population of 1,747, the village is growing three crops, including an amazing 18–20 varieties of
vegetables which garners Rs 5–6 crore annually (twice the income of neighboring villages) with its 300
families netting in between Rs 50,000 to Rs 12 lakh per year. The village is lush with 60,000 trees. The
indices of diversification also indicate that traditional crops have concentrated rather than diversified
during the period of interventions of watershed technologies in the village. The other commercial
crops are diversified because of availability of water in the village (Fig. 16).
The DI for each crop examines their level of spread resulting in crop diversification and concentration
(against diversification). The figure indicates that from 1995–96 to 1999–00 with the highest value of
diversification index the pulse crop remained cultivated while there was high concentration in cotton
in the village. However from 1993–94 to 2003–04 the scenario of cropping pattern changed sharply
and the crop of cotton further diversified and groundnut dominated once again. It is interesting to
note that the index of pulse crop remained constant indicating that there was neither diversification
nor concentration over a period of time. This could be because of a stable market price of pulses as
well as need for home consumption as a source of protein.
The gross output of each crop for different years is valued at constant (2003–04 farm harvest) prices
and in order summed up to arrive at the aggregate value of crop production. The total value of output
increased by more than two times between 1995–96 and 2003–04. The total value of output of all
crops increased at a compound growth rate (CGR) of 11.39% during 1995–96 to 1999–00, but CGR
declined sharply to 3.58% from 1999–00 to 2003–04. These results indicate that initial effects of
irrigation resulted in higher CGR. However, to maintain similar CGR necessary intervention to bring in
enhanced water use efficiency are needed. Overall from 1995–96 to 2003–04 the CGR of production
of all crops increased by 18.92% (Table 13). In terms of value of production in constant prices in
1999–2003, Rajasamadhiyala recorded cotton receiving Rs 2750 per quintal, groundnut Rs 1625 per
quintal, wheat Rs 800 per quintal, cumin Rs 6008 per quintal and pulses Rs 1500 per quintal.
An Open Access Journal published by ICRISAT________________________________________________________________________________________________________
SAT eJournal | ejournal.icrisat.org August 2006 | Volume 2 | Issue 1

21
Figure 16. Various crops like sugarcane, vegetable and fruit plants are grown.
Figure 15. Diversification Index over a period of time.
An Open Access Journal published by ICRISAT________________________________________________________________________________________________________
SAT eJournal | ejournal.icrisat.org August 2006 | Volume 2 | Issue 1

22
Table 13. The value and growth of total production in Rajasamadhiyala watershed.
YearCotton
(Rs)Groundnut
(Rs)Wheat(Rs)
Cumin(Rs)
Pulses(Rs)
Total Production (Rs) CGR
1995 15384490(77.41)*
(0.401)**
3910660(19.68)(0.961)
188496(0.95)(1.00)
344160(1.73)(1.00)
45160(0.23)(1.00)
19872966(21.00)(0.956)
From1995–99
11.39
1999 27039870(79.34)(0.371)
5231265(15.35)(0.976)
838272(2.46)(0.999)
937380(2.75)
(0.999)
34944(0.10)(1.00)
34081731(36.00)(0.871)
From1999–03
3.58
2003 27556815(67.82)(0.540)
7462455(18.37)(0.966)
3182784(7.83)(0.994)
2379840(5.86)
(0.997)
52000(0.13)(1.00)
40633894(42.96)(0.816)
From1995–03
18.92
* The figures in parentheses are the percentage of value of particular crops over total value of all crops **The figures in parentheses are the values of diversification index
Socioeconomic indicators
The socioeconomic status of the people improved sharply because of watershed interventions within
a short span of time in the village. Farmers are realizing the importance of watershed management
which directly contributed in uplifting their standard of living.
Change in demographic status
The per capita income of population increased by 38.52% during project period. The village exhibits
a fairly good sex ratio of 1003 female for every 1000 male, which is worth noting that the sex ratio
in the village is above the average of the state and the nation. It indicates that the status of women
have improved which is attributed to the standard of living as well as increased awareness of child
care, nutrition intake and moral status. The literacy rates amongst male as well as female were found
higher in 2004. There has been 100% enrollment in primary education and children below 5 years
are going to anganbadi.
The literacy rate is about 41.5% for male and 56.2% for female. Generally boys are withdrawn
from school to work on their farm by the 8th standard while girls continue with their study till
the 12th standard. Total migration of unskilled labor has declined (2–3% of total population),
as there is availability of work in the village itself. Although total migration has come down
Food, fodder and fuel security
Food security is a state of assuring physical availability and economic accessibility of enough food (in an state of assuring physical availability and economic accessibility of enough food (in an
environmentally and socially sustainable manner) in terms of quantity (amount, distribution, calories),
quality (safe, nutritious, balanced) and cultural acceptability for all people at all times for a healthy
and active life. The parameters used to measure food security in the village based on the World Food The parameters used to measure food security in the village based on the World Food
Summit (1996) held in Rome, basically ensured availability, accessibility and acceptability. As per the
norms of World Food Summit (1996), the availability of food requires adequate and reliable food for
an active and healthy life at present and for future generation. While accessibility ensures distribution
and access to food within and between societies, acceptability means culturally acceptable food and
distribution systems, which respect human dignity, social and cultural norms. The various measures
An Open Access Journal published by ICRISAT________________________________________________________________________________________________________
SAT eJournal | ejournal.icrisat.org August 2006 | Volume 2 | Issue 1

23
implemented through watershed program have improved food, fodder and fuel security over a period
time (Figs. 17 and 18).
Table 14 reveals the availability and requirement of food per capita per month in monitory value
to measure the food gap as well as security. In 1995, per capita food secured was only 20% against
requirement, while the food security increased significantly to 71% (59.5) in 1999. In 2003–04 total
per capita food security attained was 109% (75.6). This was due to the overall development activities of
watershed programs in general and in particular due to additional water availability through rainwater
harvesting and groundwater recharging structures.
Figure 17. Healthy animals indicate good availability of fodder in the watershed.
Figure 18. Change in food, fodder and fuel security over a period of time in Rajasamadhiyala.
An Open Access Journal published by ICRISAT________________________________________________________________________________________________________
SAT eJournal | ejournal.icrisat.org August 2006 | Volume 2 | Issue 1

24
Table 14. Food security over a period of time
Unit 1995 1999 2003
Total Population No. 1631 1691 1747Land Availability per capita ha 0.446 0.442 0.437Land value Rs 100000/ha 0.558 1.336 1.747
Income from all sourcesInterest on land Rs 100000 0.0335 0.0802 0.1048Crops 18.75 169.69 306.57Animal husbandry 11.41 11.26 11.6Other Income (services/employment) 0.78 1.02 1.45Total Income – 30.97 182.05 319.72
Income per capita Rs 100000per month
0.019 0.108 0.183
Income Availability* Rs per month 437.05 1564.91 (1300)** 2398.11(1662.40)**Income Requirement Rs per month 2200.00 2200.00 2200.00Food Gap Rs (Required-Availability)* -1762.95 -635.10 (-892)** 198.11 (-537.6)**Food security per capita per month (%) 19.866 71.132 (59.5)** 109.005 (75.6)**
* Rs 70.97 per capita per day are calculated based on the definition of World Food Summit, 1996, Rome, to measure food security (availability, acceptability and utilization).
**Income availability is calculated by taking into account the All India Wholesale price index for comparing 1995 with 1999 and 2003.
In case of fodder security, only 61% was secured in 1995, while in 1999 it was fully secured (103%)
within a short span of time (Table 15 and Fig 18). The fuel security also improved in 1999 (138%)
compared to 1995 (Table 16 and Fig.18)
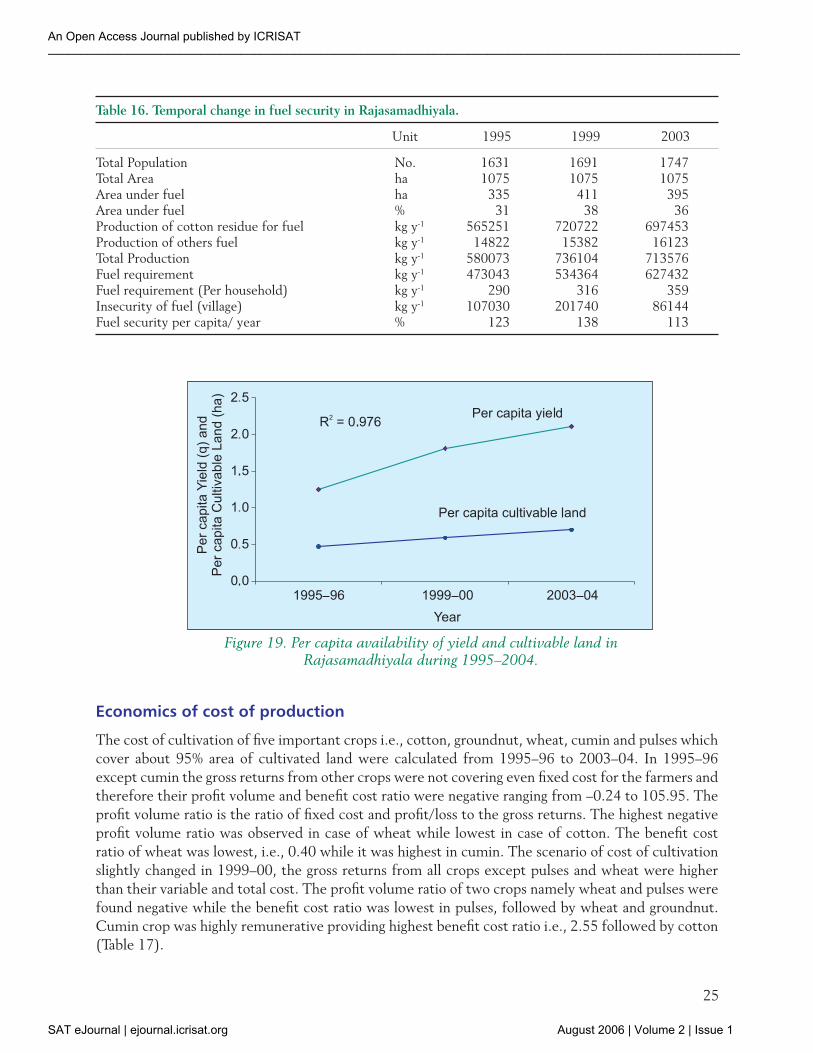
Over a period of time both per capita yield availability and cultivable area increased but there was
a significant change in per capita yield recorded, compared to change in per capita cultivable land.
The rate of marginal growth in case of yield is higher than cultivable land indicating that increased
water availability resulted in extensification as well as intensification of agriculture in Rajasamadhiyala
(Fig. 19).
Table 15. Fodder security over a period of time in Rajasamadhiyala.
Unit 1995 1999 2003
Total animal No. 1743 1526 1235
Total area ha 1075 1075 1075Area under fodder ha 404 381 501Area under fodder % 37 35 46Fodder productivity kg ha-1 5739 7979 7590Fodder production kg y-1 2318556 3039999 3802840Fodder from by-product kg y-1 1456805 1967169 2296282Total fodder availability kg y-1 3775361 5007168 6099123Fodder requirement (Village) kg y-1 6175251 4879453 5597122Fodder insecurity (Village) kg y-1 -2399890 127715 502001Fodder insecurity (Per animal) kg y-1 -1377 84 406.Fodder security per animal per annum (%) 61 102 109
An Open Access Journal published by ICRISAT________________________________________________________________________________________________________
SAT eJournal | ejournal.icrisat.org August 2006 | Volume 2 | Issue 1
25
Table 16. Temporal change in fuel security in Rajasamadhiyala.
Unit 1995 1999 2003
Total Population No. 1631 1691 1747Total Area ha 1075 1075 1075Area under fuel ha 335 411 395Area under fuel % 31 38 36Production of cotton residue for fuel kg y-1 565251 720722 697453Production of others fuel kg y-1 14822 15382 16123Total Production kg y-1 580073 736104 713576Fuel requirement kg y-1 473043 534364 627432Fuel requirement (Per household) kg y-1 290 316 359Insecurity of fuel (village) kg y-1 107030 201740 86144Fuel security per capita/ year % 123 138 113
Figure 19. Per capita availability of yield and cultivable land in Rajasamadhiyala during 1995–2004.
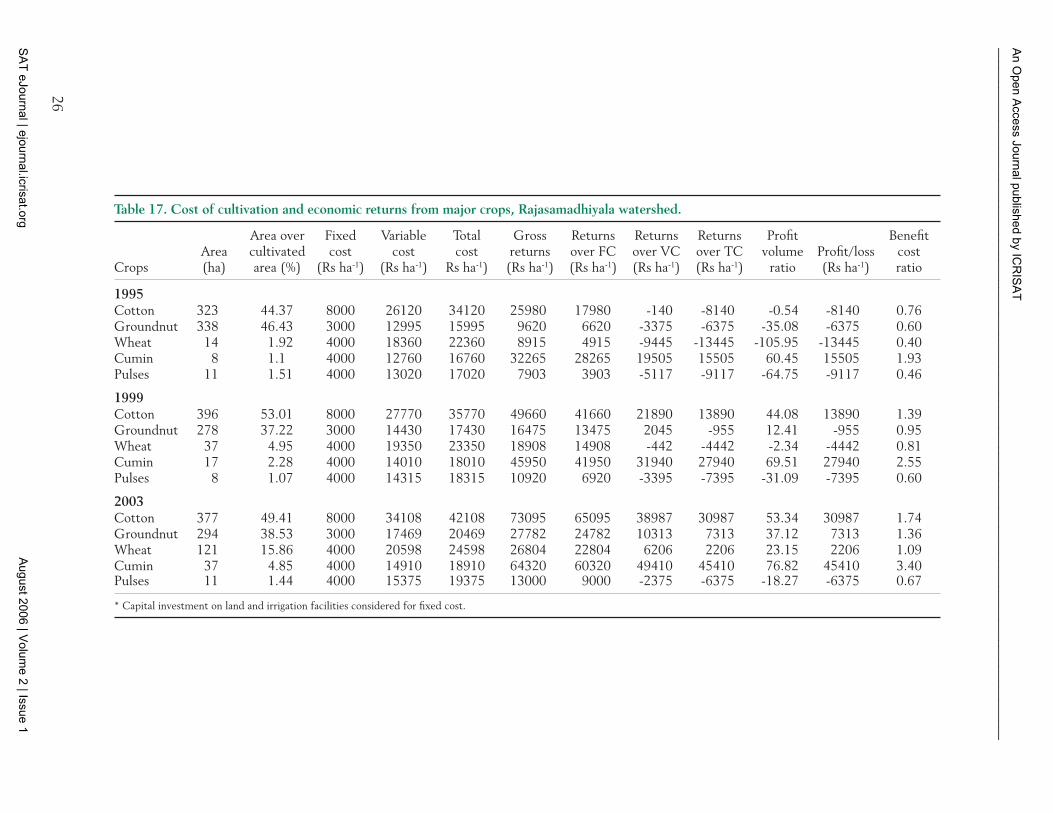
Economics of cost of production
The cost of cultivation of five important crops i.e., cotton, groundnut, wheat, cumin and pulses which
cover about 95% area of cultivated land were calculated from 1995–96 to 2003–04. In 1995–96
except cumin the gross returns from other crops were not covering even fixed cost for the farmers and
therefore their profit volume and benefit cost ratio were negative ranging from –0.24 to 105.95. The
profit volume ratio is the ratio of fixed cost and profit/loss to the gross returns. The highest negative
profit volume ratio was observed in case of wheat while lowest in case of cotton. The benefit cost
ratio of wheat was lowest, i.e., 0.40 while it was highest in cumin. The scenario of cost of cultivation
slightly changed in 1999–00, the gross returns from all crops except pulses and wheat were higher
than their variable and total cost. The profit volume ratio of two crops namely wheat and pulses were
found negative while the benefit cost ratio was lowest in pulses, followed by wheat and groundnut.
Cumin crop was highly remunerative providing highest benefit cost ratio i.e., 2.55 followed by cotton
(Table 17).
An Open Access Journal published by ICRISAT________________________________________________________________________________________________________
SAT eJournal | ejournal.icrisat.org August 2006 | Volume 2 | Issue 1
26
Table 17. Cost of cultivation and economic returns from major crops, Rajasamadhiyala watershed.
CropsArea(ha)
Area overcultivatedarea (%)
Fixedcost
(Rs ha-1)
Variablecost
(Rs ha-1)
Totalcost
Rs ha-1)
Grossreturns
(Rs ha-1)
Returnsover FC(Rs ha-1)
Returnsover VC(Rs ha-1)
Returnsover TC(Rs ha-1)
Profitvolume
ratioProfit/loss (Rs ha-1)
Benefitcostratio
1995Cotton 323 44.37 8000 26120 34120 25980 17980 -140 -8140 -0.54 -8140 0.76Groundnut 338 46.43 3000 12995 15995 9620 6620 -3375 -6375 -35.08 -6375 0.60Wheat 14 1.92 4000 18360 22360 8915 4915 -9445 -13445 -105.95 -13445 0.40Cumin 8 1.1 4000 12760 16760 32265 28265 19505 15505 60.45 15505 1.93Pulses 11 1.51 4000 13020 17020 7903 3903 -5117 -9117 -64.75 -9117 0.46
1999Cotton 396 53.01 8000 27770 35770 49660 41660 21890 13890 44.08 13890 1.39Groundnut 278 37.22 3000 14430 17430 16475 13475 2045 -955 12.41 -955 0.95Wheat 37 4.95 4000 19350 23350 18908 14908 -442 -4442 -2.34 -4442 0.81Cumin 17 2.28 4000 14010 18010 45950 41950 31940 27940 69.51 27940 2.55Pulses 8 1.07 4000 14315 18315 10920 6920 -3395 -7395 -31.09 -7395 0.60
2003Cotton 377 49.41 8000 34108 42108 73095 65095 38987 30987 53.34 30987 1.74Groundnut 294 38.53 3000 17469 20469 27782 24782 10313 7313 37.12 7313 1.36Wheat 121 15.86 4000 20598 24598 26804 22804 6206 2206 23.15 2206 1.09Cumin 37 4.85 4000 14910 18910 64320 60320 49410 45410 76.82 45410 3.40Pulses 11 1.44 4000 15375 19375 13000 9000 -2375 -6375 -18.27 -6375 0.67
* Capital investment on land and irrigation facilities considered for fixed cost.
An O
pen A
ccess J
ourn
al p
ublis
hed b
y IC
RIS
AT
_________________________________________________________________________________________________
__
__
__
_
SA
T e
Journ
al | e
journ
al.ic
risat.o
rg A
ugust 2
006 | V
olu
me 2
| Issu
e 1

27
The results of cost of cultivation in 2003–04
sharply changed due to active intervention of
watershed management technologies. Except in
the case of pulses, most of the crops were highly
remunerative and the returns were more than
their variable as well as fixed cost. In spite of low
returns, pulse area did not decline over the years
pulses’ yields are low (7.83 q ha-1) and there
was a need to include productivity enhancement
interventions. Cumin was the highest profitable
crop followed by cotton and groundnut crops
during this year having higher profit volume and
benefit:cost ratio. The overall results suggest that
rainfed crops have more potential and economical
benefit if they are managed properly through
watershed interventions.
Impact assessment and evaluation of investment
Ex-post impact assessment of investment on
watershed development activities estimate the
accrued benefits from research and development
and examine whether the economic returns are
satisfactory and efficient in use of resources. It is
desirable, even essential that research be properly
evaluated to judge what impact it has on its target
clientele (Bantilan 1993). In Rajasamadhiyala
a single traditional water storage structure
(percolation tank) existed way back in 1942; but
from 1983 onwards funds were being invested
on various watershed development activities
through different agencies of government and
non-government organizations.
The key interventions under watershed develop-
ment programs and rainwater conservation
measures were evaluated individually and in
combination for their impact on productivity and
resource conservation in the village. Accordingly,
on-site and off-site impact assessment study was
planned and undertaken by a multidisciplinary
team of researchers The important details of the
watershed activities at village level are mentioned
earlier in the Annexure 1 and crop wise area is
mentioned in Table 18.
Box 3. Prosperity at the doorsteps of villagers after watershed development program
Improved livelihoods of villagers: an example
of Mr Narayan Bhai Ramani resident of
Rajasamadhiyala village who is a typical farmer
in the Rajasamadhiyala watershed. His family
has 4 male and 2 female members. He holds
6.4 ha of land, and grows groundnut crop
prior to watershed development use to harvest
one tonne groundnut per ha. However with
the improved water availability in his open
well last year he harvested 1.7 tonnes per ha
using Gujarat 20 variety. With the improved
groundnut productivity and fodder availability,
Narayan Bhai invested in 2 buffaloes and 2
cows (improved breeds). The two buffaloes
yield 14 L milk and cross breed cow yields 16
L milk. Out of 30 L of milk 5 L is consumed in
the family of 6 persons. In his family women
participate in all types of field work including
spraying pesticides and ploughing, etc. Two
daughters studied up to 7th and 10th standard
and then got married at the age of twenty.
Family spent about 1.5 lakh rupee (US $ 3490)
on each daughter’s marriage. He possesses a
TV, VCR, fridge and bullet motorcycle (seen
in the picture) besides a house in Rajkot.
He believes that prosperity came after
construction of the check dams in the village.
Mr Narayan Bhai Ramani is not an isolated case
enjoying the fruits of prosperity due to improved
water availability in the watershed but one
amongst 300 households in the village.
An Open Access Journal published by ICRISAT________________________________________________________________________________________________________
SAT eJournal | ejournal.icrisat.org August 2006 | Volume 2 | Issue 1
28
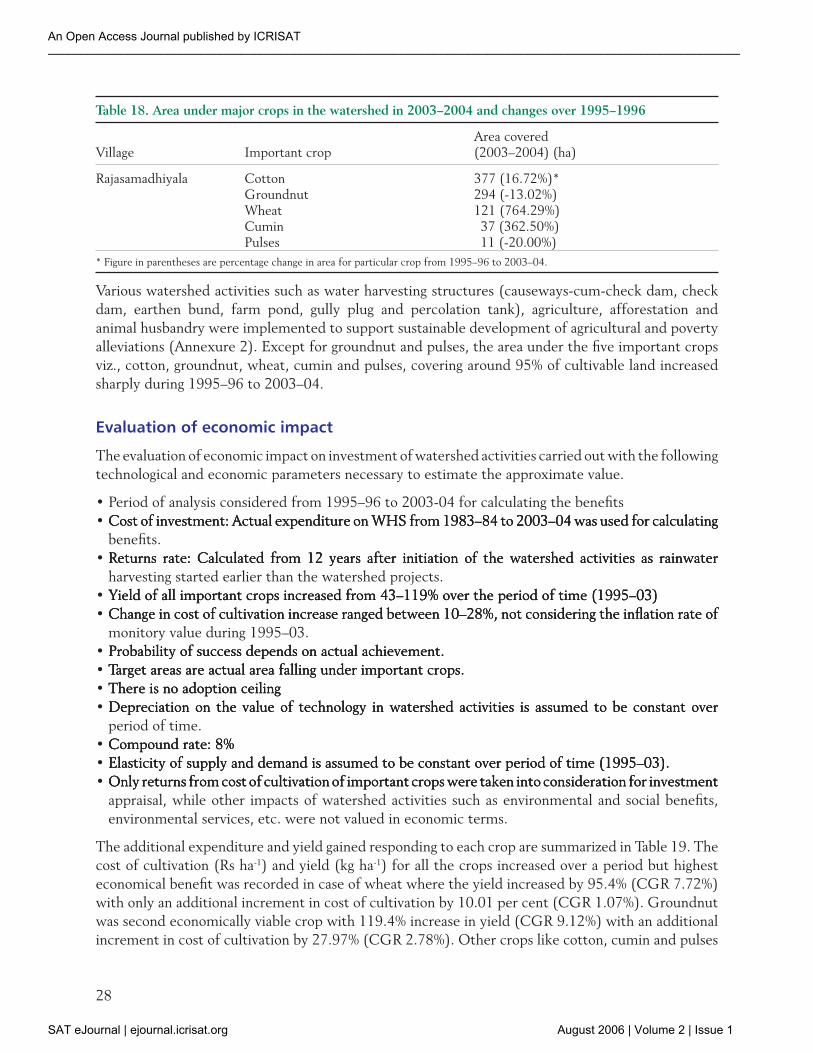
Table 18. Area under major crops in the watershed in 2003–2004 and changes over 1995–1996
Village Important cropArea covered(2003–2004) (ha)
Rajasamadhiyala CottonGroundnutWheatCuminPulses
377 (16.72%)*294 (-13.02%)121 (764.29%)37 (362.50%)11 (-20.00%)
* Figure in parentheses are percentage change in area for particular crop from 1995–96 to 2003–04.
Various watershed activities such as water harvesting structures (causeways-cum-check dam, check
dam, earthen bund, farm pond, gully plug and percolation tank), agriculture, afforestation and
animal husbandry were implemented to support sustainable development of agricultural and poverty
alleviations (Annexure 2). Except for groundnut and pulses, the area under the five important crops
viz., cotton, groundnut, wheat, cumin and pulses, covering around 95% of cultivable land increased
sharply during 1995–96 to 2003–04.
Evaluation of economic impact
The evaluation of economic impact on investment of watershed activities carried out with the following
technological and economic parameters necessary to estimate the approximate value.
• Period of analysis considered from 1995–96 to 2003-04 for calculating the benefits
• Cost of investment: Actual expenditure on WHS from 1983–84 to 2003–04 was used for calculating Cost of investment: Actual expenditure on WHS from 1983–84 to 2003–04 was used for calculatingCost of investment: Actual expenditure on WHS from 1983–84 to 2003–04 was used for calculating
benefits.
• Returns rate: Calculated from 12 years after initiation of the watershed activities as rainwater Returns rate: Calculated from 12 years after initiation of the watershed activities as rainwaterReturns rate: Calculated from 12 years after initiation of the watershed activities as rainwater
harvesting started earlier than the watershed projects.
• Yield of all important crops increased from 43–119% over the period of time (1995–03)Yield of all important crops increased from 43–119% over the period of time (1995–03)Yield of all important crops increased from 43–119% over the period of time (1995–03)
• Change in cost of cultivation increase ranged between 10–28%, not considering the inflation rate of Change in cost of cultivation increase ranged between 10–28%, not considering the inflation rate ofChange in cost of cultivation increase ranged between 10–28%, not considering the inflation rate of
monitory value during 1995–03.
• Probability of success depends on actual achievement. Probability of success depends on actual achievement.Probability of success depends on actual achievement.
• Target areas are actual area falling under important crops. Target areas are actual area falling under important crops.Target areas are actual area falling under important crops.
• There is no adoption ceiling There is no adoption ceilingThere is no adoption ceiling
• Depreciation on the value of technology in watershed activities is assumed to be constant over Depreciation on the value of technology in watershed activities is assumed to be constant overDepreciation on the value of technology in watershed activities is assumed to be constant over
period of time.
• Compound rate: 8% Compound rate: 8%Compound rate: 8%
• Elasticity of supply and demand is assumed to be constant over period of time (1995–03). Elasticity of supply and demand is assumed to be constant over period of time (1995–03).Elasticity of supply and demand is assumed to be constant over period of time (1995–03).
• Only returns from cost of cultivation of important crops were taken into consideration for investment Only returns from cost of cultivation of important crops were taken into consideration for investmentOnly returns from cost of cultivation of important crops were taken into consideration for investment
appraisal, while other impacts of watershed activities such as environmental and social benefits,
environmental services, etc. were not valued in economic terms.
The additional expenditure and yield gained responding to each crop are summarized in Table 19. The
cost of cultivation (Rs ha-1) and yield (kg ha-1) for all the crops increased over a period but highest
economical benefit was recorded in case of wheat where the yield increased by 95.4% (CGR 7.72%)
with only an additional increment in cost of cultivation by 10.01 per cent (CGR 1.07%). Groundnut
was second economically viable crop with 119.4% increase in yield (CGR 9.12%) with an additional
increment in cost of cultivation by 27.97% (CGR 2.78%). Other crops like cotton, cumin and pulses
An Open Access Journal published by ICRISAT________________________________________________________________________________________________________
SAT eJournal | ejournal.icrisat.org August 2006 | Volume 2 | Issue 1

29
were also economical, as the percentage change
in yield recorded higher compared to their
percentage change in cost of cultivation.
Considering all assumptions and other
components of the study, impact assessment
on investment was done. The pay back period
of investment was more because we calculated
the benefits using available data during 1995–
04 while investments were taken since 1983–
84. Discussions with the community indicated
that yields and area increased during 1983–95,
however details were available for 1995–04
period only.
Considering the limitation as mentioned above
we could not capture the large benefits during
1983 to 95 period due to unavailability of
baseline data. The pay back period of investment
is 8 years 5 months and 12 days while the net
present value is Rs 8993895. The internal rate of
return is 9.43% and benefit cost ratio is arrived
at 1: 1. 24. These IRR and B:C ratio values are
lower than the general watershed IRR and B:
C ratios reported by Joshi et al. 2005 from
311 case studies in India mainly because of
huge investments of 16.25 million Rs (9 folds
more) in rainwater harvesting structures than
the normal watershed programs. Secondly,
large benefits during initial period of 1983–95
when rainwater harvesting structures were
constructed could not be captured due to lack
of baseline data (Table 19).
Landless households (HH) account for
about 2% of total HH (6 landless HHs out
of total 300) in Rajasamadhiyala watershed.
The beneficiaries across different categories
ranged from 71–88%. About 84% of
landless and 88% of marginal households
benefited from various watershed activities
(Table 20).
Box 4. Empowerment andDiscipline-oriented Development
Rajasamadhiyala village and its micro-
watershed program is distinct when compared
to its surrounding villages or to other districts
of Gujarat. Its prosperity, development and
improved livelihoods attract attention. It is
the story of a charismatic leader leading his
village Rajasamadhiyala on the road to success.
Mr Hardevsinh Jadeja decided in 1978, to
sacrifice his job and took up the challenge of
developing his village. He was elected as a
sarpanch in 1978. Rajasamadhiyala was like
any other village where blind faiths prevailed,
witch doctors ruled and common people were
exploited Mr Jadeja was sure that without
discipline and empowerment, his plan for a
natural resource-based development program
would not succeed. He devised social norms
along with the respective community leaders
in the VDC. Initially some members who
were exploiting the blind faith of the illiterate
villagers challenged his plans, but with the
development of RWH structures the trigger
for development was set in and community
began appreciating his efforts. For the benefit
of all members a nominal amount was paid to
the panchayat and in due course it collected Rs
400000 net income with no outstanding dues.
Echoing the community feelings of satisfaction
Smt Bhawanaben who runs the anganwadi in
the village remarked “we have seen the changes
in the village and the services we enjoy from
the tax we pay. We enjoy having a clean village
and get enough water as long as power supply
is there”. Mr Jadeja remarked, “my methods of
operation look radical but without discipline
and adherence to rules mere investment in
RWH or watershed development would not
bring in the fruits of development. There is a
need for adopting a holistic approach including
human resources development”.
An Open Access Journal published by ICRISAT________________________________________________________________________________________________________
SAT eJournal | ejournal.icrisat.org August 2006 | Volume 2 | Issue 1

30
Table 19. Impact of watershed development programs on the yield and profitability over a period of time.
YearsDifferences*2003–1995
Percentage increase
1995–2003
Compoundgrowth rate
from 1995–2003**1995–1996 1999–2000 2003–2004
Cost of cultivation (Rs ha-1)Cotton 34120 35770 42108 7988 23.41 2.36Groundnut 15995 17430 20469 4474 27.97 2.78Wheat 22360 23350 24598 2238 10.01 1.07Cumin 16760 18010 18910 2150 12.83 1.35Pulses 17020 18315 19375 2355 13.84 1.45Total 106255 112875 125460 19205 88.05 1.86
Yield (kg ha-1)Cotton 1732 2483 2658 926 53.46 4.87Groundnut 712 1158 1562 850 119.38 9.12Wheat 1683 2832 3288 1605 95.37 7.72Cumin 717 919 1072 355 49.51 4.57Pulses 564 728 812 248 43.93 4.13Total 5408 8120 9392 3984 361.65 6.32
Net Returns (Rs ha–1)Cotton -8140 13890 30987 39127 580.68 21.59Groundnut -8875 -2955 4913 13788 255.36 10.98Wheat -13945 -4942 1706 15651 212.23 8.72Cumin 15505 27940 45410 29905 192.87 16.42Pulses -9117 -7395 -6375 2742 -30.08 -3.90Total -24572 26538 76641 56069 911.06 16.22
Cost of Production (Rs kg-1)Cotton 19.70 14.41 15.84 -3.86 -19.58 -2.39Groundnut 22.46 15.05 13.10 -9.36 -41.67 -5.81Wheat 13.29 8.25 7.48 -5.81 -43.69 -6.18Cumin 23.38 19.60 17.64 -5.74 -24.54 -3.08Pulses 30.15 25.16 23.85 -6.30 -20.91 -2.57Total 108.98 82.46 77.91 -31.07 -150.39 -3.66
* The differences are statistically significant at 5 per cent.** Linear compound growth rate.
Table 20. Households benefited at Rajasamadhiyala watershed, 2003.
HH category No. of HHsNo. of HHs
under projectNo. of HHsbenefited
% of HHs benefited at the end of Project,
2003
Marginal 132 105 92 88Small 47 38 32 84Big 115 92 65 71Landless 6 6 5 84Total 300 241 194 81
GRISERV-BAIF, 2003.
An Open Access Journal published by ICRISAT________________________________________________________________________________________________________
SAT eJournal | ejournal.icrisat.org August 2006 | Volume 2 | Issue 1

31
Similarly the beneficiaries across all communities/castes (forward, scheduled and backward) varied from
56–84% of HHs with an average of 81% of total HHs. The landless were benefited through various
watershed development activities in terms of labor employment for the construction of water harvesting
structures, as farm labor due to crop intensification and diversification (3 crops a year), dairying, collection
and selling of milk and some other micro enterprises under schemes like Swarnajayanthi Gram Swarozgar
Yojana (SGSY), viz., small shops, vegetable vendors, bicycle repair shops, etc.
Institutional development
Catalytic to watershed development in Rajasamadhiyala a number of village level institutions were
formed. The other institutions created in Rajasamadhiyala are – Village Development Committee
(VDC), Watershed Association and Committee, Self-help and User groups. These institutions played
an important role in bringing effective participation of people for successful implementation of the
watershed program.
Village development committee
The VDC was formed consisting of 11 members representing each social caste/community in the
village in the proportion of the population it represented. The committee is empowered to take
decisions in all matters of village development in general and watershed development in particular. It
has drawn sovereign authority from the villagers over the years. In the village the VDC and members
of all wards appoint the sarpanch and deputy sarpanch unlike other villages. Elderly members of
all communities represent the VDC. They ensure the implementation of VDC’s decision in their
community. In case of any conflict the VDC has greater power to resolve when compared to other
local bodies of village panchayat.
Watershed association and committee
The village is also equipped with watershed association and committee consisting of members who
directly or indirectly reside within the watershed area. The committee is registered under the Societies
Registration Act as per guideline of watershed development. The watershed association nominates 12
members for watershed committee from different groups of User Groups (UGs), Self Help Groups
(SHGs), gram panchayat, Watershed Development Team and women representatives along with
member from minority communities in the village.
Self-help and user groups
The self-help and user groups constituted as per guideline of watershed development in the village
consisting of 18–32 members. The SHG comprised of landless individuals with common or similar
sources of income such as animal husbandry, goat rearing, poultry and agriculture labor, etc. The
user groups consist of landowners who get benefits from watershed interventions such as water
harvesting structures, farm ponds, farm bunds, etc. These groups also consist of the beneficiaries
from interventions on common lands such as fodder development, plantation or protection of trees
and vegetation.
Leadership oriented development committee
The whole development of the village under the charismatic leadership of the village sarpanch –
Mr Hardevsinh Jadeja who built the institution of VDC in Rajasamadhiyala. Now though the sarpanch is
An Open Access Journal published by ICRISAT________________________________________________________________________________________________________
SAT eJournal | ejournal.icrisat.org August 2006 | Volume 2 | Issue 1

32
Mr Devashibhai Kakadia the VDC is headed by Mr Jadeja. He decides, prioritizes the work and
decides where it has to be executed. Although it appears to be an autocratic way of functioning,
all the sections of the village have benefited. The disciplinary rules and the VDC’s decisions are
adopted strictly and honestly without allowing any bias. Nobody is spared, if erred, including the
village development committee members. The commitment and selfless nature of functioning of the
committee and leadership is well accepted by the villagers in all the matters of development. The
village members have developed confidence and faith in this kind of “guided democracy”.
A very noticeable observation made during the study was – the involvement of women folk in decision
making at community level. It was observed that women participate in livelihood activities but do not
involve themselves in the community level initiatives. However women are revered in this village as
a cultural legacy
Innovative and indigenous initiatives in the watershed
Some of the following innovative indigenous practices are noted:
• Tank silt application, is a very common practice in this village. The novelty here is that they mix the
tank silt with farmyard manure (1:1 ratio) and apply it every year (Fig. 20). They even apply the
silt about 15 cm deep on shallow uncultivable lands and then cultivate it.
• Farmers pump the bore well water into open wells to soften the bore water and use for irrigation
(Fig. 21). Although farmers incur additional expense in pumping bore water into open wells, they
still prefer to this method as they receive better quality of water for irrigation.
Figure. 20. Tank silt is collected and heaped. Figure. 21. Bore water is pumped into open well and used for irrigation.
• Due to abundant water in wells most of the farmers prefer to use diesel and electric pump for
pumping (Fig. 22). This practice has been adapted to overcome power shut down problem and to
cover more area under irrigation.
An Open Access Journal published by ICRISAT________________________________________________________________________________________________________
SAT eJournal | ejournal.icrisat.org August 2006 | Volume 2 | Issue 1
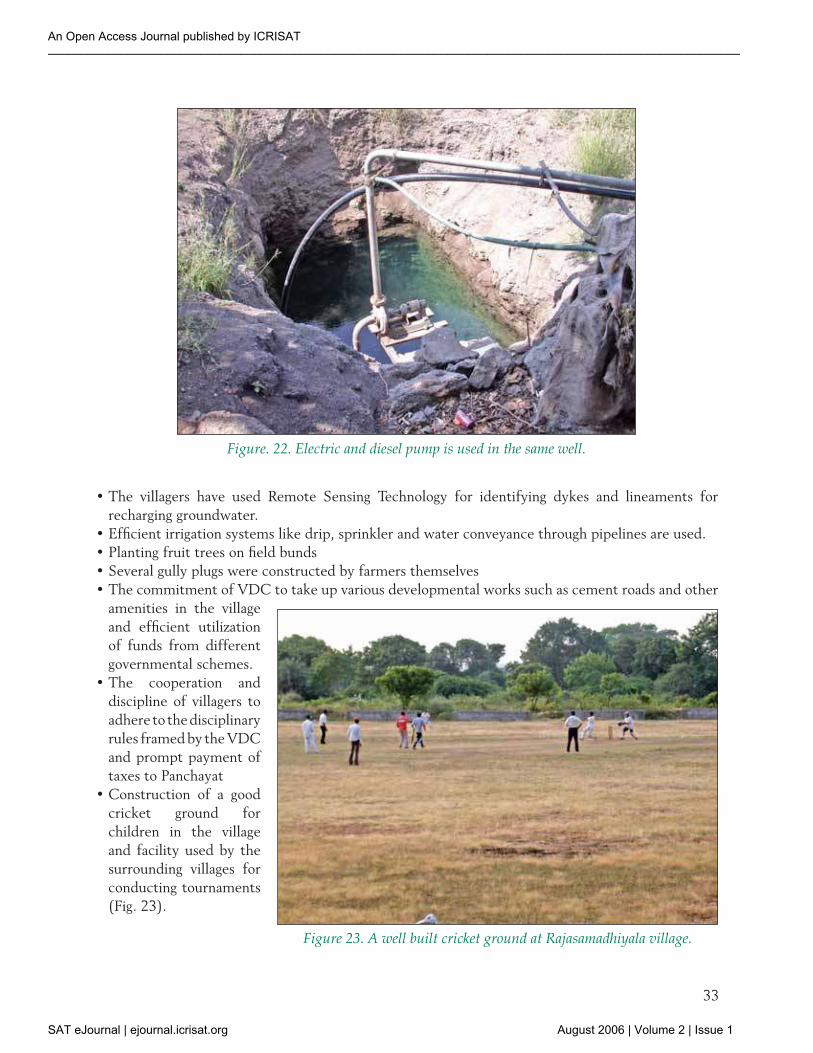
33
Figure. 22. Electric and diesel pump is used in the same well.
• The villagers have used Remote Sensing Technology for identifying dykes and lineaments for
recharging groundwater.
• Efficient irrigation systems like drip, sprinkler and water conveyance through pipelines are used.
• Planting fruit trees on field bunds
• Several gully plugs were constructed by farmers themselves
• The commitment of VDC to take up various developmental works such as cement roads and other
amenities in the village
and efficient utilization
of funds from different
governmental schemes.
• The cooperation and
discipline of villagers to
adhere to the disciplinary
rules framed by the VDC
and prompt payment of
taxes to Panchayat
• Construction of a good
cricket ground for
children in the village
and facility used by the
surrounding villages for
conducting tournaments
(Fig. 23).
Figure 23. A well built cricket ground at Rajasamadhiyala village.
An Open Access Journal published by ICRISAT________________________________________________________________________________________________________
SAT eJournal | ejournal.icrisat.org August 2006 | Volume 2 | Issue 1

34
Upstream RWH benefited downstreamvillages
Aniyala watershed
Aniyala is a village located on the downstream of
Rajasamadhiyala watershed on topo-sequence. The
watershed area is 958 ha (about 80% cultivable and 20%
waste lands) with a population of 1500 in 250 families.
Soils are medium deep (~0.6 m) and shallow (0.15-0.5
m) black soils. There are 21 water harvesting structures
of which eight structures were constructed during the
last seven years. The check dams in this watershed
were constructed after water harvesting structures
were constructed in Rajasamadhiyala. Out of the 125
open wells, 50 wells are functioning and 60 bore wells
exist in the watershed. Rainfall and crops grown here
are similar to the Rajasamadhiyala. Runoff from the
watershed drains into Aaji and Morabo streams.
Since most of the time water in the stream comes
through base flow, sedimentation through soil loss
is considerably reduced. Due to base flows water
harvesting structures get water from Rajasamadhiayala
structures and in addition catchment runoff in Aniyala
is also harvested. Farmers in this watershed stated
that the water harvesting structures constructed
in Rajasamadhiyala has benefited them in terms of
increased groundwater recharging by 25% over earlier
years. In addition to this, after constructing water
harvesting structures in their watershed, there has
been a significant improvement in the groundwater
source (about 50%) in a normal rainfall year. Water in
the structures is available up to December and wells
give a good yield upto January. The increase in the crop
production is about 25 to 30%.
Increased water availability in downstream Aniyala
village has changed the cropping pattern with high level
of crop productivity. At present increased crop yields
of cotton 2.19 t ha-1; groundnut 1.21 t ha-1; vegetables
10 t ha-1 and pigeonpea 0.55 t ha-1 are observed. The
fodder productivity is 56.55 t ha-1. The average crop
productivity of important crops during rainy season is
given in Figure 24.
With improved water and food availability, the quality and number of livestock in the village have
improved. Cross-bred cows per household are 0.6 out of which 0.4 (66.67%) are milching cows.
Box 5. All round prosperity of the villagers in downstream village
Average land holding of Aniyala is 1.6
ha per household and 60% families have
less than 2 ha and 4 ha are with 4–5
households and few have above 4 ha. The
average family size is 4 to 5 members,
boys study up to 8th standard while girls
generally study up to 10th standard and
at the age of 20 they get married. On an
average Rs 50,000 is spent on a marriage.
The village has five graduates (including
one female). About 10% households
are landless and they work as farm
labor/professional labor. The village has
5 autorickshas and 20 tractors. Every
house has electricity and 50 gobar gas
plants in the village. Each family has 1–2
milking animals, of which 60% animals
are buffaloes and 50% are improved
breeds (Jafarabadi, Murrah). Improved
crossbred cows constitue 40% of milking
animals. Buffaloes yield 13 L and cow 7
L per day. The men collect income from
milk although it is the women who take
care of the animals. Generally men are
the decision makers in this village.
An Open Access Journal published by ICRISAT________________________________________________________________________________________________________
SAT eJournal | ejournal.icrisat.org August 2006 | Volume 2 | Issue 1

35
These cows produce on an average 7 litre
milk per day. Similarly, per household, the
number of milching buffaloes increased
accounting to 0.6 (75%) out of 0.8 per
household. The average milk of buffalo is
13 litre per day. The availability of bullocks
in the village is low as 0.2 bullocks per
household were found during the time of
survey.
Increased crop productivity enhanced
the household income in the village as
well as from diversified vegetables and
fruits increased gradually parallel to
Rajasamadhiyala micro-watershed. The
initial increase in the income of farmers
had a multiplier impact on different
sources of income with an accelerator
affect, coupled with the galloping increase
in the non-agriculture income (about two
times over the period) (Fig. 25).
The higher level of water productivity
has transformed the livelihood of farmers
in the village and farmers are engaged in
agriculture as well as other allied activities.
These changes have led to declined
migration of male labour force (there is
no female labour migration). During the
survey it was seen that only 12% of total
population, of which 66% are skilled labor, migrated to nearby urban areas for better employment
opportunities. Most of the farmers (72%) were happy to get opportunities for increasing their
productivity and profitability due to improved watershed management in Rajasamadhiyala. Good
number of farmers were of the view that the potential benefits from land have not been yet been
totally harnessed and await for an integrated watershed management program to begin.
Kasturba Dham (K B Dham at Tramba)
KB Dham is a village situated further downstream to Rajasamadhiyala near the Rajkot watershed,
where the Aaji lake is situated. KB Dham has an area of 1000 ha with a population of 4000, which is
15 km from Rajkot. Soils are medium deep (0.6–0.9 m) to shallow (0.15–0.5 m) black soil. There are
three major streams converging here – Saran coming from Lakhapur, Sardhar, Rajasamadhiyala and
Aniyala, Bhand coming from Dhandia, Morabo from Padasan Rajasamadhiyala and Aniyala. There are
21 water harvesting structures, out of which 15 are large ones. In most of the structures, water stays
for about 5–6 days after 1st filling and with subsequent storms, water stays for 20–30 days. Normally
3–4 times overflows occur in a year from these structures. Check dams, which are constructed on
Saran stream, retain water for longer duration than other check dams due to the continuous base flow
in Saran stream. For example, during the field visit of team in the month of November 2004, 3 check
Figure 25. Average Income of households in the off-site village (Aniyala).
Figure 24. Average productivity of major crops in Aniyala downstream village.
An Open Access Journal published by ICRISAT________________________________________________________________________________________________________
SAT eJournal | ejournal.icrisat.org August 2006 | Volume 2 | Issue 1

36
dams in series were full of water on Saran stream upto
a length of 1.25 km long with an average depth of water
in structures of 1.8 m. The volume of water stored was
about 90900 m3.
There are around 200 open wells in the village with a
depth ranging from 50–100 ft, out of which only 85 are
functioning which are located near check dams. The
remaining 115 are defunct. Fifty wells nearer to check
dams on Saran stream have good water source, 25 wells
on check dams on Bhand stream have moderate water
source and 10 open wells in the vicinity of check dams
on Morabo stream are deeper and comparatively have
less water.
There are 525 bore wells in the village, dug before
constructing the check dams. The farmers observed
that there was good improvement in bore well water
levels after constructing the check dams.
There was about 25% improvement in the groundwater
source after the watershed program was implemented.
Farmers observed that before the massive construction
of check dams in upstream watershed Rajasamadhiyala
and Aniyala, water used to flow into the Aaji river in
a short span of time. Now after the check dams are
full, water flows to downstream through base flow
after increased groundwater rechargeability due to
percolation. This way groundwater is recharged better
and soil erosion is reduced. They also quoted an example
of sedimentation in a 40-year old check dam, which
used to get filled with silt every 2 years before the check
dams construction in Rajasamadhiayala watershed.
Now there is absolutely no siltation from upstream
watersheds. Farmers are happy and not affected by
the water harvesting structures in upstream watershed
Rajasamadhiyala. In fact this watershed has benefited in
terms of groundwater recharge through base flow from
structures in the upstream watershed and reduced
siltation in the village tanks. Farmers of KB Dham
expressed that still 8–10 check dams can be constructed
to prevent the excess runoff, which is draining into the
Aaji lake. They also opinioned that bigger check dams
(>20000 m3 capacity) are more effective compared to
smaller check dams in term of groundwater recharge
based on their observation on open wells around these
check dams. Water in structures normally stores upto
December and is available for agriculture in open wells
Box 6. Watershed development re-vived open wells in Kasturba Dham
Kasturba dham being in the vicinity of
Rajkot town villagers had good access
to bore well technologies and farmers
tried to cash on the market. Mavji bhai
Trapasiya, a farmer from the village stated
that the village had 200 open wells. Open
wells dried up due to inappropriate
land and water management practices
and overexploitation of groundwater.
Farmers started digging bore wells
increasingly reaching upto 525 bore
wells in a village of 769 households with
1000 ha area. Along with the number
of bore wells, depth of bore wells also
went on increasing. Most bore wells in
Kasturba dham are 800 + feet deep.
In spite of increased depth many bore
wells had insufficient water of poor
quality. Tea prepared with bore well
water used to get spoilt due to splitting
of milk. After observing the benefits
gained by rainwater harvesting in
Rajasamadhiyala the villagers with help
of government officials constructed 21
rainwater harvesting structures on three
streams. Impact of increased base flow
from upstream rainwater harvesting
structures was quick and visible.
Mr Mavji bhai Trapasiya is happy that
now he has good quality water in his
open well.
An Open Access Journal published by ICRISAT________________________________________________________________________________________________________
SAT eJournal | ejournal.icrisat.org August 2006 | Volume 2 | Issue 1

37
up to February-March. During summer
well water is just sufficient for domestic
and animal use. Only few farmers grow
vegetables during summer in small area
depending on water availability in their
well.
Improved water availability resulted in
cropping pattern shifting towards cash crops
with short season crops like vegetables
from perennial and long duration crops.
The average productivity of cotton is 1.69
t ha-1, groundnut 0.93 t ha–1, vegetables
10.48 t ha–1 and pigeonpea 0.55 t ha–1 in the
village (Fig. 26). Average fodder production
recorded in the watershed is 62.8 t ha–1.
Other composite impact of
increased water availability
was also realized on livestock
production. Average availability
of milching cow is 0.2 per
household while the number of
buffaloes is 1.2 per household.
The availability of bullocks is
higher i.e., 1.2 per household
in the village as compared to
Aniyala. Increased production
and availability of fodder with
better market facilities due
to proximity of Rajkot city
resulted in an increase in the
numbers of buffaloes in the village.
The multi-dimensional impact of change in productivity has increased the income of households
during the same period. The income of household increased from agriculture (from 24250 Rs to
47000 Rs y-1) by 95.88% while the income from other non-agriculture sources (from 14300 to 24000
Rs y-1) by 67.83% (Fig. 27).
Increased employment opportunities for people in the village resulted in reduced migration (8.2%)
of which 64% were skilled people migrating for better livelihoods.
Movable and non-movable assets of farmers also increased, which led to better socioeconomic status
of farmers. The perception of farmers about watershed technology is more inducive and they are keen
on adopting the strategy of watershed technologies in the village itself.
Development in these two downstream villages is attributed to the enhancement of water availability
due to watershed activities taken up in the upstream micro-watershed Rajasamadhiyala.
Figure 27. Average household income before and after watershed interventions Kasturba Dham.
Figure 26. Crop productivity in off-site villageKasturba Dham.
An Open Access Journal published by ICRISAT________________________________________________________________________________________________________
SAT eJournal | ejournal.icrisat.org August 2006 | Volume 2 | Issue 1

38
Conclusions
The study reveals that water scarcity and land degradation were the major constraints to agricultural
productivity in the village Rajasamadhiyala before implementation of watershed development
activities. Although the watershed interventions especially water harvesting structures were
initiated in the village since 1983, substantial investment in watershed activities only started from
1987–88 onwards. Perceptible changes were observed in areas under irrigation, cropping pattern
and intensity along with diversification of crops from traditional to commercial or cash crops. Over
a period of time water storage capacity increased significantly, covering more area under irrigation
and enhancing the cropping pattern, intensity and productivity of several crops. Both per capita
cultivable land and yield increased but per capita availability of produce increased drastically in
the village during the period of watershed development programs. Crop productivity in upstream
watershed Rajasamadhiyala is higher than the two downstream villages. For example, in case of
groundnut it is 29% higher than in Aniyala and 68% higher than in K B Dham. Similarly cotton
productivity is 21% higher in Rajasamadhiyala than in Aniyala and 57% higher than in KB Dham.
In Rajasamadhiyala watershed higher production is seen in some of the crops, such as vegetables,
higher by 67% and 59%, pigeonpea 53% and fodder by 40 and 26% compared to Aniyala and
KB Dham villages respectively.
A significant change was also observed in the cost of cultivation. Due to higher increment in returns
of crops the benefit:cost ratio changed from negative to positive and at present except pulse
crops other important crops have positive benefit cost ratio. Investments in watershed program
showed good net present value and internal rate of returns. Interventions in watershed significantly
improved the socioeconomic status of people, provided more employment opportunities while
maintaining good environment and soil and water balance in the watershed. In the village food,
fodder and fuel security improved sharply within a short span. Increased income from agriculture
and other allied sectors such as livestock rearing, enabled farmers to maintain a higher consumption
status and enhanced standard of living, this provided the farmers enough work opportunities in
farming.
In conclusion huge investment of 16.25 million rupees in rainwater harvesting structures which is
nine folds more than the normal watershed investments have currently benefited farmers in the
watershed as well as the farmers from the downstream villages also. Agricultural crop productivity
was increased by 119% in case of groundnut, 53% in cotton, 95% in wheat and by 50% in case of
cumin. The internal rate of return was 9.4% with the cost benefit ratio of 1: 1.24 on such a large
investment. Public investments through watershed programs in India improved water availability
in rainfed areas and increased productivity and incomes which in turn triggered private investment
in rainfed areas. However, over-exploitation of groundwater such as doubling the number of
bore wells as well as pumping hours in Rajasamadhiyala will jeopardize the development unless
suitable legal or social mechanisms for sustainable use of groundwater use are put in place by the
community.
An Open Access Journal published by ICRISAT________________________________________________________________________________________________________
SAT eJournal | ejournal.icrisat.org August 2006 | Volume 2 | Issue 1

39
References
Bantilan MCS. 1993. Research Evaluation and Impact Assessment: Framework and Strategies. Pages 73–77 in Summary Proceedings of a Workshop on Research Evaluation and Impact Assessment 13–15 Dec 1993, ICRISAT Asia Center.
GRISERV-BAIF. 2003. Watershed project evaluation indicator, Report, BAIF Research foundation, Rajkot, Gujarat.
Government of Gujarat, Rural Development Department. 2004. The Making of Rajasamadhiyala Village. Watershed Development Series 5, Rural Development Publication No. 16, Office of the Commissioner, Department of Rural Development, Block 16, Dr Jivaraj Mehta Bhavan, Gandhinagar, Gujarat.
Hemani R. 2005. (Unpublished report) Impact of Watershed Interventions on Groundwater in Rajasamadhiyala and Downstream Villages.
Joshi PK, Pangare Vasudha, Shiferaw B, Wani SP, Bouma JPangare Vasudha, Shiferaw B, Wani SP, Bouma JVasudha, Shiferaw B, Wani SP, Bouma J and Scott C. 2004. Socioeconomic and policy research on watershed management in India: Synthesis of past experiences and needs for future research. Global Theme on Agroecosystems Report no. 7. Patancheru 502 324, Andhra Pradesh, India: International Crops Research Institute for the Semi-Arid Tropics. 88 pp.
Joshi PK, Jha AK, Wani SP, Joshi Laxmi and Shiyani RL. 2005. Meta–analysis to assess impact of watershed program and people’s participation. Comprehensive Assessment Research Report 8. Sri Lanka: Comprehensive Assessment Secretariat.
Lal Rattan. 2000. Integrated Watershed Management in the Global Ecosystem. Soil and Water Conservation Society of America, CRC Press Boca Raton USA. 395 pp.pp..
PBIO 100 Lectures Notes. (1999). Lecture 40 – World Food Problems. The Undergraduate Program in Plant Biology, University of Maryland.
Rockstrom J, Barron J and Fox P. 2003. Water productivity in rainfed agriculture: Challenges and opportunities for smallholder farmers in drought-prone tropical agro ecosystems. Pages 145–162Pages 145–162 in Water Productivity in Agriculture: Limits and Opportunities for Improvement. Kijne JW, Barker R and Molden D. (eds.). CABKijne JW, Barker R and Molden D. (eds.). CABCABInternational, Wallingford, UK.
Samra JS. 1997. Status of research on watershed management. Dehradun, India: Central Soil and Water Conservation Research and Training Institute.
Secklar D, Amerasinghe U, Molden D, De Silva R and Barker R. 1998. World water demand and supply 1990 to 2025: Scenarios and issues. Research Report 19. Colombo. Sri Lanka: International Water Management Institute. 52 pp.
Shiklomanov A Igor, SHISHI (State Hydrological InstituteState Hydrological Institute, St. Petersburg) and UNESCO (United NationsUnited Nations Educational, Scientific and Cultural Organization, Paris). 1999.
Wani SP, Pathak P, Tan HM, Ramakrishna A, Singh P and Sreedevi TK. 2001. Integrated watershed management for minimizing land degradation and sustaining productivity in Asia. Pages 207–230 in Integrated Land Management Productivity in Asia, Zafar Adeel (ed.). Proceedings of Joint UNU-CAS International Workshop, 8–13 September 2001, Beijing, China.8–13 September 2001, Beijing, China.Beijing, China.
Wani SP, Pathak P, Sreedevi TK, Singh HP and Singh P. 2003. Efficient Management of Rainwater forIncreased Crop Productivity and Groundwater Recharge in Asia. Pages 199–215199–215 in Water Productivity in Agriculture: Limits and Opportunities for Improvement. Kijne W, Barker R and Molden D (eds.). CABW, Barker R and Molden D (eds.). CABBarker R and Molden D (eds.). CABR and Molden D (eds.). CAB and Molden D (eds.). CABD (eds.). CABCABCAB International, Wallingford, UK.
Wani SP, Sreedevi TK, Ramakrishna YS, Rego TJ, Ramakrishna A, Singa Rao M and Pande AB. 2004.A Consortium Approach for Sustainable Watershed Management for Increasing Productivity of Rainfed Systems: Potential and Challenges. Pages 161–171161–171 in Proceedings of National Seminar on Creativity in WaterProceedings of National Seminar on Creativity in Water Management. 27 to 28 February 2004 at Bhopal, Madhya Pradesh, India.
Wani SP and Ramakrishna YS.YS. 2005. Sustainable Management of Rainwater Through Integrated Watershed Approach for Improved Rural Livelihood. Pages 39–6039–60 in Watershed Management Challenges: Improved Productivity, Resources and Livelihoods’. Sharma Bharat R, Samra JS, Scott C and Wani SP. (eds.). IWMI, SriBharat R, Samra JS, Scott C and Wani SP. (eds.). IWMI, SriSamra JS, Scott C and Wani SP. (eds.). IWMI, SriJS, Scott C and Wani SP. (eds.). IWMI, SriScott C and Wani SP. (eds.). IWMI, SriC and Wani SP. (eds.). IWMI, Sri and Wani SP. (eds.). IWMI, SriSP. (eds.). IWMI, Sri (eds.). IWMI, Sri Lanka.
An Open Access Journal published by ICRISAT________________________________________________________________________________________________________
SAT eJournal | ejournal.icrisat.org August 2006 | Volume 2 | Issue 1

An Open Access Journal published by ICRISAT________________________________________________________________________________________________________
SAT eJournal | ejournal.icrisat.org August 2006 | Volume 2 | Issue 1

41
Annexure 1
Details of water harvesting structures at Rajasamadhiyala watershed
Type of water harvesting structure
Storagecapacity
(m3)
Unitcost
(Rs m-3) YearBenefitedarea (ha)
No. of farmers
benefited
No. ofwells
benefited
Catchmentsarea(ha)
Causeway-cum-check dam 11765 10 1999 10 3 4 16
Causeway- cum-check dam 3456 49 1998 14 5 7 7
Causeway-cum-check dam 6292 11 1997 13 5 6 9
Causeway- cum-check dam 1350 15 1994 6 7 9 2
Causeway-cum-check dam 5344 15 1999 17 4 5 7
Causeway- cum-check dam 1725 38 1998 19 7 8 3
Causeway-cum-check dam 1266 41 1998 9 5 5 2
Causeway- cum-check dam 2229 33 1998 11 6 5 4
Causeway-cum-check dam 6428 31 2000 17 7 8 9
Causeway- cum-check dam 6000 42 2003 16 6 6 12
Check dam 5063 23 1998 11 8 10 7
Check dam 15306 9 1998 21 7 9 16
Check dam 11975 21 2000 12 3 4 23
Check dam 2100 17 1996 5 3 3 4
Check dam 1350 15 1998 4 5 5 2
Check dam 1040 28 1998 9 4 4 2
Check dam 6628 15 1997 18 5 6 9
Check dam 4046 5 1998 8 3 3 6
Check dam 3642 21 1998 14 5 6 5
Check dam 1806 6 1998 3 2 2 3
Check dam 8495 12 1999 29 5 5 12
Check dam 1411 28 1998 7 4 5 3
Check dam 1548 25 1998 8 3 3 3
Earthen bund (4 No.) 7385 7 1997 4 2 2 11
Farm pond (6 No.) 4800 13 1997 9 3 4 5
Gully plug (5 No.) 1200 5 1998 2 2 2 2
Percolation tank 61200 5 1992 32 11 16 109
Percolation tank 32231 31 1987 38 5 11 50
Percolation tank 112000 14 1983 53 9 19 142
Percolation tank 110700 5 1987 42 8 8 98
Percolation tank 59497 20 1987 42 7 11 75
Percolation tank 7595 4 1997 6 2 2 12
Percolation tank 70726 11 1992 32 9 9 90
Percolation tank 26980 4 1942 28 5 7 53
Percolation tank 13210 38 1986 25 6 8 19
Percolation tank 40000 13 1987 38 6 8 52
Percolation tank 39141 31 1987 31 7 9 35
Percolation tank 132475 15 1987 67 14 24 162
Percolation tank 1056 34 1999 6 4 6 2
Percolation tank 25000 20 2002 21 8 11 35
Total storage capacity (m3) 855461 19.4*
*Average unit cost of all structures.
An Open Access Journal published by ICRISAT________________________________________________________________________________________________________
SAT eJournal | ejournal.icrisat.org August 2006 | Volume 2 | Issue 1
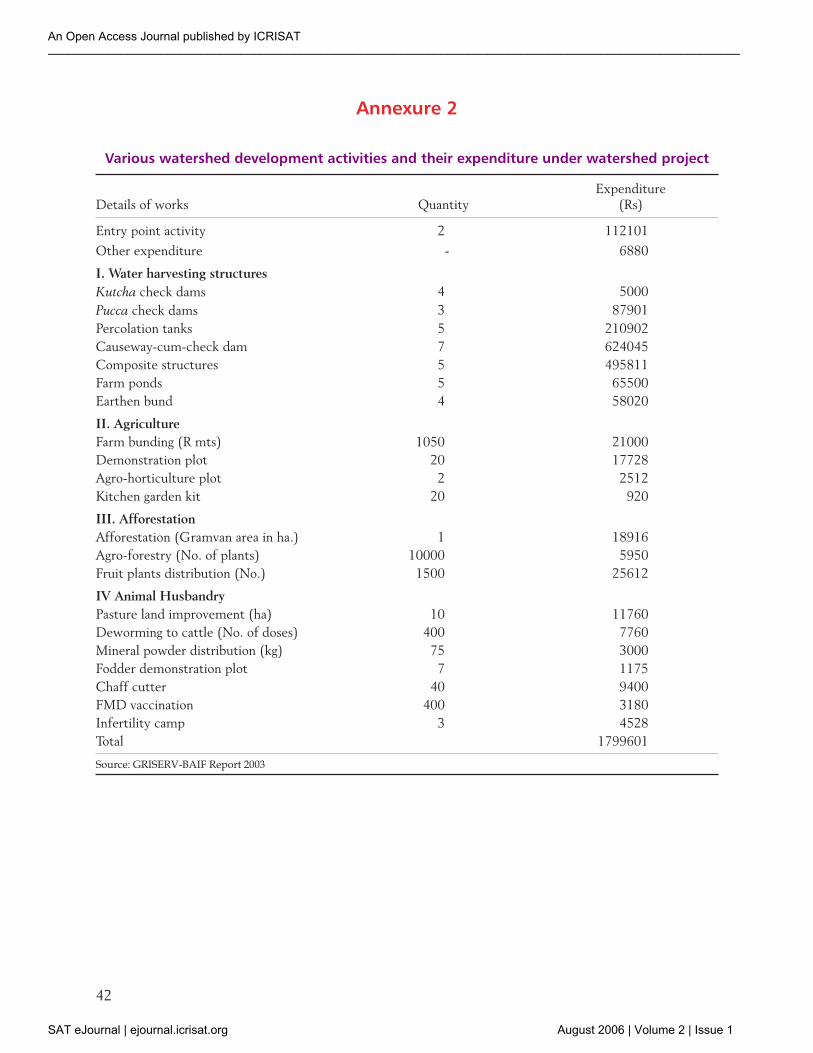
42
Annexure 2
Various watershed development activities and their expenditure under watershed project
Details of works QuantityExpenditure
(Rs)
Entry point activity 2 112101
Other expenditure - 6880
I. Water harvesting structures
Kutcha check dams 4 5000
Pucca check dams 3 87901
Percolation tanks 5 210902
Causeway-cum-check dam 7 624045
Composite structures 5 495811
Farm ponds 5 65500
Earthen bund 4 58020
II. Agriculture
Farm bunding (R mts) 1050 21000
Demonstration plot 20 17728
Agro-horticulture plot 2 2512
Kitchen garden kit 20 920
III. Afforestation
Afforestation (Gramvan area in ha.) 1 18916
Agro-forestry (No. of plants) 10000 5950
Fruit plants distribution (No.) 1500 25612
IV Animal Husbandry
Pasture land improvement (ha) 10 11760
Deworming to cattle (No. of doses) 400 7760
Mineral powder distribution (kg) 75 3000
Fodder demonstration plot 7 1175
Chaff cutter 40 9400
FMD vaccination 400 3180
Infertility camp 3 4528
Total 1799601
Source: GRISERV-BAIF Report 2003
An Open Access Journal published by ICRISAT________________________________________________________________________________________________________
SAT eJournal | ejournal.icrisat.org August 2006 | Volume 2 | Issue 1

43
Annexure 3
Change in area, productivity and yield over 1995
Crops
Change in 1999 over 1995 (%) Change in 2003 over 1995 (%)
Area Productivity Production Area Productivity Production
Rainy seasonCotton 22.60 43.36 75.76 16.72 53.46 79.12Groundnut -17.75 62.64 33.77 -13.02 119.38 90.82Jowar -28.57 17.25 -16.25 28.57 27.07 63.37Bajri 25.00 12.47 40.59 37.50 17.24 61.20Maize 22.22 17.93 44.13 55.56 37.43 113.79Vegetable 13.79 12.18 27.65 44.83 15.72 67.60Pulses -16.67 42.47 18.72 16.67 64.77 92.24Other 16.67 18.69 38.47 50.00 27.67 91.50
Postrainy seasonWheat 164.29 68.27 344.72 764.29 95.37 1588.52Cumin 112.50 28.17 172.37 362.50 49.51 591.49Pulses -40.00 17.80 -29.32 -20.00 26.70 1.36Vegetable 166.67 20.18 220.47 66.67 22.67 104.46Fodder 66.67 12.36 87.27 33.33 14.58 52.77
SummerFodder 60.00 10.85 77.36 100.00 14.68 129.36Vegetable 75.00 19.19 108.59 175.00 19.56 228.79Sugarcane 50.00 7.12 60.68 50.00 8.60 62.90Maize+g.nut 31.58 1.75 33.89 78.95 3.82 85.79Pulses+g.nut 85.71 27.77 137.28 157.14 53.20 293.95
An Open Access Journal published by ICRISAT________________________________________________________________________________________________________
SAT eJournal | ejournal.icrisat.org August 2006 | Volume 2 | Issue 1