On-farm crop trials cropping season 1994/1995. Results … · Land Use Planning for Sustainable...
96
BOT/91/001 Field Document 8 Land Use Planning for Sustainable Agricultural Development BOTSWANA ON-FARM CROP TRIALS CROPPING SEASON 1994/1995 RESULTS AND EVALUATION Food & Agriculture Republic of United Nations Organization of the Botswana Development United Nations Programme SEPTEMBER 1995
Transcript of On-farm crop trials cropping season 1994/1995. Results … · Land Use Planning for Sustainable...

BOT/91/001Field Document 8
Land Use Planning for Sustainable Agricultural Development
BOTSWANA
ON-FARM CROP TRIALS CROPPING SEASON 1994/1995
RESULTS AND EVALUATION
Food & Agriculture Republic of United NationsOrganization of the Botswana DevelopmentUnited Nations Programme
SEPTEMBER 1995

Land Use Planning for Sustainable Agricultural Development
BOTSWANA
ON-FARM CROP TRIALS CROPPING SEASON 1994/1995
RESULTS AND EVALUATION
by
R.P. Bekker
Agricultural Land Use Planner,Maun Region
with contributions from(in alphabetical order)
M. BitsangD.K. DiraP.H. GilikaM. KgaswanyaneS.P. KristensenJ. van der PolZ.D. PhillimeJ. VenemaP.S. Wijesuriya
Food & Agriculture Republic of United NationsOrganization of the Botswana DevelopmentUnited Nations Programme
SEPTEMBER 1995
BOT/91/001Field Document 8

This field document is one of a series of reports prepared during the course of theproject identified on the title page. The conclusions and recommendations in thereport are those considered appropriate at the time of its preparation. They may bemodified in the light of further knowledge gained at subsequent stages of theproject.
The definitions employed and the presentation of the material and maps in thisdocument does not imply the expression of any opinion whatsoever on the part ofthe Food and Agriculture Organization of the United Nations concerning the legalor constitutional status of any country, territory or sea area or concerning thedelimitation of frontiers.
Bekker, R.P., 1995. On-farm crop trials cropping season 1994-1995. Results andevaluation. FAO/UNDP/Government of Botswana Project B0T1911001 Land Use Planningfor Sustainable Agricultural Development. Field Document 8, 88 pp.
SUMMARY
A series of 43 on-farm crop trials was programmed in the Agricultural Regions of Central, North East, NorthWest and Southern during the cropping season 1994/1995. The main objectives of the trials were todemonstrate the scope for improvements in rainfed arable crop production to farmers through theirparticipation, to collect information on management operations and to compare trial yields with CYSLAMBpredictions.
A standard management system with local variations was adopted. Sorghum Segaolane was grown as crop,ploughing/planting was scheduled for the first occasion that a minimum of 20 mm of effective rainfall wasrecorded, from the third dekad of November onwards. Seeds were row planted at calculated target plantdensities; farmers were encouraged to carry out timely weeding and bird scaring operations. The effect of theapplication of fertilizer on grain yields and gross margins was studied.
Sod and climatic characteristics of the trial sites are described, as well as observations on managementoperations and crop development stages.
One third of the trials succeeded, while two third failed, due to unfavorable climatic conditions, unsatisfactorycrop management or insufficient supervision. From the successful dryland plots the actual yield of the tencontrol plots varied from 1 70-1290 kg/ha, while the CYSLAMB predictions ranged from 430-1070 kg/ha. Forthe twelve successful fertilized plots the achieved yields varied from 300-1010 kg/ha, against 670-1600 kg/hafor the CYSLAMB simulations, respectively.
The average grain weight per harvested head was for the control plots 26.4 g, ranging from 6.9-60 g and forthe fertilized plants 29.4 g, varying from 8.3-78 g.
If assumed, that a difference between actual and predicted yield of at least 20 % is significant, in 35 % ofthe cases no difference was observed, while in the remaining 65 % a large discrepancy occurred. Severalreasons for the discrepancy between trial yields and CYSLAMB predictions are discussed.
From the nine trials with successful control and fertilized plots, in one case the control plot yielded 41 %higher, in two cases the yield was virtually equal (2 % and 4 % discrepancy) and in 6 instances the fertilizedplot yielded on average 97 % (43 - 181) higher than the control plot.
To assess the financial viability of the executed production systems, a gross margin analysis was carried out.If the cost of on-farm labour is ignored, the ten successful control plots achieved a positive gross marginranging from Pula 58-474/ha without and from Pula 228-644/ha with government drought relief subsidy. Ifno residual effect from the fertilizer is assumed, and the costs are written off in one year, eleven trialsachieved a positive gross margin varying from Pula 9-265/ha without, and from Pula 179-435/ha with droughtrelief subsidies. Only one out of the twelve fertilized trials obtained a slightly negative gross margin. If thefertilizer costs would be divided over three years, all twelve gross margins would be positive, and range fromPula 75-341/ha without to Pula 245-511/ha with drought relief subsidies.
When comparing the dryland plots where both control and fertilized plots were harvested, the use of fertilizerdid only pay off in 22 % of the cases, if no residual effect of the fertilizer was taken into account in the grossmargin analysis. When the fertilizer costs were divided over three years (the residual effect of singlesuperphosphate fertilizer), the use of fertilizer was financially attractive in 56 % of the trials.
Finally, an evaluation of the trials is done, both from the farmers' and from the supervision's point of view,in order to identify fields for improvement, which might increase the success rate of future trials. Suggestionsare formulated for recommendations concerning importance of timeliness and accurateness of operations, areaploughed and planted per planting opportunity, target plant densities, and the use of fertilizer.

TABLE OF CONTENTS
SUMMARY
ACKNOWLEDGEMENTS vi
1 INTRODUCTION 1
1 .1 Objectives 1
1.2 Organization of the trial programme 1
1.2.1 Logistics and costs 1
1.2.2 Preparation and monitoring 2
1.2.3 Dissemination of extension messages 2
1.3 Selection and location of trial-farms 21.4 Production systems and management systems 4
2 OBSERVATIONS 5
2.1 Soil observations 5
2.2 Climatic observations 62.3 Management observations 122.4 Agronomic observations 17
RESULTS 213.1 Trial yields 213.2 CYSLAMB yields 233.3 Comparisons 24
3.3.1 Trial versus CYSLAMB yields 243.3.2 Trial versus farmers' yields 26
3.4 Gross margin analysis 27
4 EVALUATION OF TRIALS 294.1 Lessons learned from farmers' point of view 294.2 Lessons learned from supervision's point of view 30
5 CONCLUSIONS & RECOMMENDATIONS 32
APPENDIX I PREPARATION PROTOCOL 35
APPENDIX II MONITORING PROTOCOL 37
APPENDIX III CHECKLIST 38
APPENDIX IV TRIAL PROGRESS 47
APPENDIX V EXAMPLE OF A BAR-CHART 85
APPENDIX VI PHOTOGRAPHS 86

LIST OF TABLES
Table 1. Location data of trial sites 2Table 2a-e. Synoptic data 7
Table 3. Mean percentage of average rainfall in trial regions ......... . . . 8Table 4. Number of dry spells 10Table 5. Classification of first dry spells 11
Table 6. Labour time used per management operation 13Table 7. Yield figures and discrepancies control - fertilized plots ...... . 21
Table 8. Seed weight of sorghum heads 22Table 9. CYSLAMB yields and discrepancy with actual trial yields 24Table 10. Trial and farmer yields (kg/ha) and discrepancy in Southern Region 26Table 11. Costs, prices and subsidies used in the gross margin analysis 27Table 12. Gross margins in pula/ha 28
LIST OF FIGURES
Figure 1. Location map of trial sites 4Figure 2a. Recorded and average rainfall for North West and North East 9Figure 2b. Recorded and average rainfall for Central and Southern 9
Figure 3. Relationship between grain weight/head and plant density 23Figure 4a. Trial and CYSLAMB yield for control plots 25Figure 4b. Trial and CYSLAMB yield for fertilized plots 26
iv

ACKNOWLEDGEMENTS
The author wishes to express his gratitude to Messrs I. Mandevu, Senior Land UseOfficer/National Project Coordinator, and F.R. Berding, Chief Technical Advisor of LUPSADProject BOT/91 /001 for their technical support and keen interest in the trial programme.Mr E. Modiakgotla, Leader Production Systems Programme DAR Mahalapye/RegionalAgricultural Research Officer Maun is thanked for his technical advice. The assistance fromthe Ministry, provided by Mr M.N. Gabaitse, Land Resources Data Management Specialist,was highly appreciated by all ALUP teams.
Much is indebted to the ALUP teams in Francistown, Kanye, Kasane, Maun and Seroweand Mr D.K. Dira of Farming System Research Mahalapye; without their dedication andobservations this document vvould not have materialized. Indispensable vvas the assistanceto the ALUP teams of Mr A. Mathlare (Francistown), Messrs J. Kachana and J. Magibizela(Kanye), Messrs A. Gwabe and O. Kanyenvu (Maun), Messrs D. Bane, S. Kgame, and R.Kemotso (FAs FSR, Serowe), who were involved in the day-to-day monitoring of the trialsites.
On behalf of the ALUP teams all RA0s, DA0s/DASs and ADs involved, are sincerelythanked for their cooperation and interest shown in the trials and for the provision offertilizer.
Furthermore the author is grateful to the Seed Multiplication Unit of the Ministry f or thesupply of seed pockets and to the Soil Laboratory of the Department of AgriculturalResearch for kindly analyzing topsoil samples.

1 INTRODUCTION
Traditional rainfed arable crop production is a widespread economic activity in Botswana,in which approximately 75% of the population is involved on a yearly basis.
The prevailing semi-arid conditions in Botswana make arable farming an enterprise withvariable success, resulting in average grain yields of 2-4 bags/ha (150-300 kg/ha); barelyenough to sustain an average household's needs.
The National Land Suitability Map for Rainfed Crop Production shows a fairly high potentialfor the crops maize, sorghum, millet, cowpeas and groundnuts in most of the north andeast of Botswana. The yields reflected on the map have been generated with help of theCrop Yield Simulation and Lanc/ Assessment Model for Botswana (CYSLAMB). Thiscomputer model evaluates the crop performance under different management systems onselected land units typified by soil and climatic characteristics.
Simulations based on improved management operations result in considerable yieldincreases as compared to traditional management scenarios. To demonstrate innovationsto farmers and to show the strength of the model for the generation of extensionrecommendations, a set of on-farm crop trials following the CYSLAMB proposals, wascarried out during the cropping season 1994/1995.
1.1 Objectives
The trials had as main objective to show farmers the scope for improvement of rainfedarable crop production by following improved management techniques and timelyoperations, mainly based on CYSLAMB simulations. The trials were production oriented,rather than focussing on different crops and varieties or on alternative farming practices.
The second aim of the on-farm experiments was to gain more insight in rainfed arable cropproduction systems in general and in its individual management operations in particular.Through close observations of time and labour requirements and costs involved in eachmanagement operation, an impression could be obtained of the major constraints andopportunities in five agricultural regions in Botswana.
Additionally, the yield data resulting from the trials could be compared to the CYSLAMBpredicted yields and possible discrepancies could be explained.
1.2 Organization of the trial programme
1.2.1 Logistics and costs
The preparation of the trial programme was coordinated from the Land Use PlanningSection at the Ministry of Agriculture (MoA). Man power was financed through therecurrent budget. One technical assistant and a driver were seconded from MoA to theKanye and Maun offices for the duration of the cropping season.
RAOs and Farming Systems Research (FSR) financed fertilizer, while seeds were suppliedby the Seed Multiplication Unit.
Topsoil samples taken before and after the trials were analyzed by the Soil Laboratory ofthe Department of Agricultural Research (DAR) on their phosphorus content. The pre-trialsamples results formed the basis for the calculation of the height of the fertilizerapplications. The post-trial results were supposed to give an idea of the phosphorus levelsachieved by fertilizing and the amount of fertilizer uptake by the plants.
Although budgeted for by the Senior Land Use Officer of MoA, no use was made of casuallabour to assist farmers in performing operations as weeding and birdscaring. It was feltto be more valuable, to observe on-farm management decisions and labour use.
1.2.2 Preparation and monitoring
A Preparation Protocol was drafted and used as a checklist for the pre-planting activities(see Appendix I). To facilitate standardized monitoring and execution of the trials aMonitoring Protocol was compiled (see Appendix II). In addition a Checklist was used torecord climatic, management and agronomic observations (see Appendix III).
Information was collected on the following topics:
soil characteristics and rainfall datause of labour, draught power and inputsplant densities and crop growth stagesweed cover and signs of pests, diseases and deficienciesyield figures
1.2.3 Dissemination of extension messages
For each trial site two farm-walks were scheduled during the course of the growingseason, in order to acquaint as many neighbouring farmers as possible with therecommended practices and results: one 4-5 weeks (early vegetative stage) and one 14-1 5weeks (yield formation stage) after planting.
1.3 Selection and location of trial-farms
Participating farmers were generally chosen in consultation with the AgriculturalDemonstrators (AD) of the concerned Agricultural Extension Area (AEA). In the SouthernRegion (Kanye) a pre-selection of 20 farmers was made by the District Crop ProductionOfficers (CPO); the final selection was done by the ALUP team in cooperation with theADs. In Mahalapye the choice was made by Farming Systems Research (FSR).
The trial farmers were selected on basis of their labour and draught power potential,availability and state of implements, motivation and preparedness to act swiftly at the firstplanting opportunity.
Table 1 gives an overview of the location data, while Figure 1 shows the approximateposition of the trial sites. More detailed regional location maps are inserted in Appendix IV.
Table 1. Location data of trial sites
2

inolapa f arming
CODE REGION DISTRICT AEA VILLAGE
Cl North West/Kasane Chobe Kachikau Kachikau
C2 North West/Kasane Chobe Kachikau Kachikau
C3 North West/Kasane Chobe Mabele/Kavimba Kavimba
C4 North West/Kasane Chobe Mabele/Kavimba Kavimba
CS North West/Kasane Chobe Mabele/Kavimba Kavimba
C6 North West/Kasane Chobe Mabele/Kavimba Kavimba
C7 North West/Kasane Chobe Mabele/Kavimba Mabele
C8 North West/Kasane Chobe Mabele/Kavimba Mabele
C9 North West/Kasane Chobe Mabele/Kavimba Mabele *
C10 North West/Kasane Chobe Mabele/Kavimba Mabele
El North East/Francistown Masunga Makaleng Sechele
F2 North East/Francistown Masunga Siviya Siviya
F3 North East/Francistown Tonota Tonota East Tapaladipoo
F4 North East/Francistown Tutume Maitengwe Maitengwe
F5 North East/Francistown Tutume Mathangwane Mathangwane
F6 North East/Francistown Tutume Matobo Matobo
F7 North East/Francistown Tutuma Nata Nata
K1 Southern/Kanye Ngwaketse Central Lotlhakane East Gamoswana
K2 Southern/Kanye Ngwaketse Central Twsidi Ramonedi
K3 Southern/Kanye Ngwaketse North Lorthakane Lotlhakane West
K4 Southern/Kanye Ngwaketse North Manyana Manyana
K5 Southern/Kanye Ngwaketse North Moshupa South Polokwe
K6 Southern/Kanye Ngwaketse South Kanngwe Kanngwe
K7 Southern/Kanye Ng waketse South Mmathethe North Mmathethe
K8 Southern/Kanye Ngwaketse West Gasita Gasita
K9 Southern/Kanye Ngwaketse West Sese Sese
K1 0 Southern/Kanye Barolong Goodhope Mongwalale
K11 Southern/Kanye Barolong Pitsane Pitsane
M1 North West/Maun Ngamiland East Chanuga Chanuga
M2 North West/Maun Ngamiland East Chanuga Xhana
M3 North West/Maun Ngamiland East Komana Komana
M4 North West/Maun Ngamiland East Komana Nxaraga
MS North West/Maun Ngamiland East Matlapaneng Matlapaneng
M6 North West/Maun Ngamiland East Matlapaneng Matlapaneng
M7 North West/Maun Ngamiland East Shashe/Maun Thamalakarte West
M8 North West/Maun Ngamiland East Shashe/Maun Tsanakuna
M9 North West/Maun Ngamiland East Tatamoga/Makalamabedi Segoro
M 1 0 North West/Maun Nyamiland East Tatamoga/Makalamabedi Xwee
Si Central/Serowe Machaneng
i
Makwate Makwate
52 Central/Serowe Machaneng Makwate Makwate
53 Central/Serowe Mahalapye Soshong East Dihate
S4 Central/Serowe Mahalagye Soshong East Dihate
SS Central/Serowe Palapye Makoro Makoro

Figure 1. Location map of trial sites
1.4 Production systems and management systems
The on-farm crop trial programme was mainly focussing on rainfed arable crop productionsystems with sorghum var. Segaolane as crop. However, in Chobe District some trialswere set up with maize var. Kalahari Early Pearl as crop, based on the traditionalpreference of the participating farmers. Also in Chobe the opportunity was taken toconduct two trials under flood recession or molapo farming conditions with maize var.Kalahari Early Pearl as crop.
A standard management system was proposed, which at times was adapted to localcircumstances. The experiments were conducted on a field of 0.5 hectare. One half of thefield was cultivated under natural conditions (the control plot), whilst the other half wastreated with single superphosphate fertilizer, to raise available P levels to 10 ppm (thefertilized plot). In Chobe, a third plot was fertilized with 3:2:1 compound NPK fertilizer insix cases.
In principle, ploughing was done with animal draught power provided by the host farmer.The planting opportunity was identified by the ALUP and was defined by a minimum of20mm of effective rainfall in one dekad, from the dekad NOV3 onwards. Seeds, suppliedby the Seed Multiplication Unit, were planted using a row planter. The targeted plantdensity was determined by CYSLAMB, at 50,000 plants/ha in all regions except for Maun,where 15,000 plants/ha was aimed for. A thinning operation (if necessary) was carried outconcurrently with the first weeding operation. The first weeding operation was scheduledfor approximately 20 days after planting, either by hand hoe or with a cultivator; a secondoperation was carried out if considered necessary. Farmers were encouraged to minimizecrop damage by properly fencing their fields and carrying out bird scaring operations.
4

2 OBSERVATIONS
All discussions in this chapter are based on remarks and observations from the ALUPteams in Francistown, Kanye, Kasane, Maun and Serowe. The author visited the majorityof the trial sites in May 1995, in order to compare the crop performance in the differentregions. A second visit was made in August 1995 to collect final results and comments.
2.1 Soil observations
Reliability of soil analyses
Before planting, samples were taken from the topsoil of all 43 trial sites, to analyze thephosphorus content. The initial phosphorus level was used by CYSLAMB to simulate theyield of the control plots and to calculate the amount of fertilizer to use in order to reacha financial optimum level of 10 ppm on the fertilized plots. After the harvest, samples weretaken again from the topsoil of the Kanye and the Maun trial sites, in order to study theeffectiveness of the fertilizer uptake by the crop and the residual effect of fertilizer afterone cropping season.
The outcome of the soil analyses is of crucial importance for above exercises. The pre-season sample analyses showed irregular results for some of the Kanye and Kasane trials.Repeats carried out on the Kanye samples gave more realistic values. Unfortunately thepost-season samples from Kanye and Maun demonstrate such large discrepancies with thepre-season samples, that the results could not be used for further interpretation.
Erosion
Severe wind erosion and deposition affected germination, establishment and developmentof plants on several trial sites located on sandy soils in the Kanye and Maun Regions. Atthe control plot of the Gasita trial site (K8), wind erosion uprooted seedlings and re-deposited sand buried others. In addition to moisture stress, a very low plant densityresulted and the surviving plants were stunted and did not form heads. A similar situationoccurred at the Xhana (M2) site. The fertilized plot was so affected by wind erosion, thata very low plant density was obtained; the remaining plants, however, established verywell and the yield was high. The control plot on the other hand was completely coveredby a thin layer of fine sand, preventing plants to establish. Both plots of the Matlapanengtrial site M6, planted after the first identified opportunity, were affected by wind erosionand deposition to the extent, that no germination took place.
At some trial sites in the Kanye and Serowe Regions with slopes greater than 2 %, signsof sheet and rill erosion were observed, due to run-off of adjacent hill sides after relativelylarge rainfall amounts. Damage to crops, however, was limited, probably due to the lowintensity of the processes and the occurrence after plant establishment.
Workability
In the Chobe Enclave, in the Kasane Region, soils with high clay contents (up to 50 %)occur frequently. The workability of these soils formed a serious constraint for traditionalploughing/planting operations with draught animals. Many farmers relied on tractor hire forthe ploughing of their fields used for rainfed crop production (see section 2.3 Ploughing).
5
Soil burning
In the Chobe Enclave, soil burning or "Fumbawe" is frequently observed. This phenomenonmainly occurs on molapo fields, after burning of the fields to remove reeds. Due to the highorganic matter content of the topsoil, underground burning proceeds at a depth of 0-50cm. The burning is usually stopped by high floods. Signs of burning are visible on thesurface or in pits; the soil has a whitish colour and a high content of ash. The effect isdetrimental on the nutrient status of the soil. On burned soil, no effect of phosphorusfertilizer was observed, suggesting nitrogen to be the limiting factor. This hypothesis isconfirmed by the gaps in the crop stand on the burned patches of the plot fertilized withsingle superphosphate, while plants performed better (more homogeneous stand) on theburned patches in the plot fertilized with 3:2:1 compound NPK fertilizer.
Groundwater level
A rapid dropping of the groundwater level at Mabele (Kasane Region), was the cause ofthe failure of one of the molapo trial sites (C10).
Termite activity
At several trial sites in the Kanye Region past and present termite activity may haveattributed to bare patches, uneven crop stands and low yields.
2.2 Climatic observations
The term dekad is introduced to indicate a 10-day period; a dekad is identified by the firstthree letters of the month and its order in time, e.g. DEC1, meaning the period between1-10 of December. The dekad is used for rainfall totals and to indicate when certain cropmanagement operations take place.
Synoptic data
Tables 2a-e show monthly average, extreme maximum and minimum temperatures, relativehumidity, sunshine, wind speed, rainfall, evapotranspiration and frost days, based onmultiple year ranges stored in the METED database for the synoptic stations ofFrancistown, Kanye, Kasane, Mahalapye and Maun.
Rainfall data
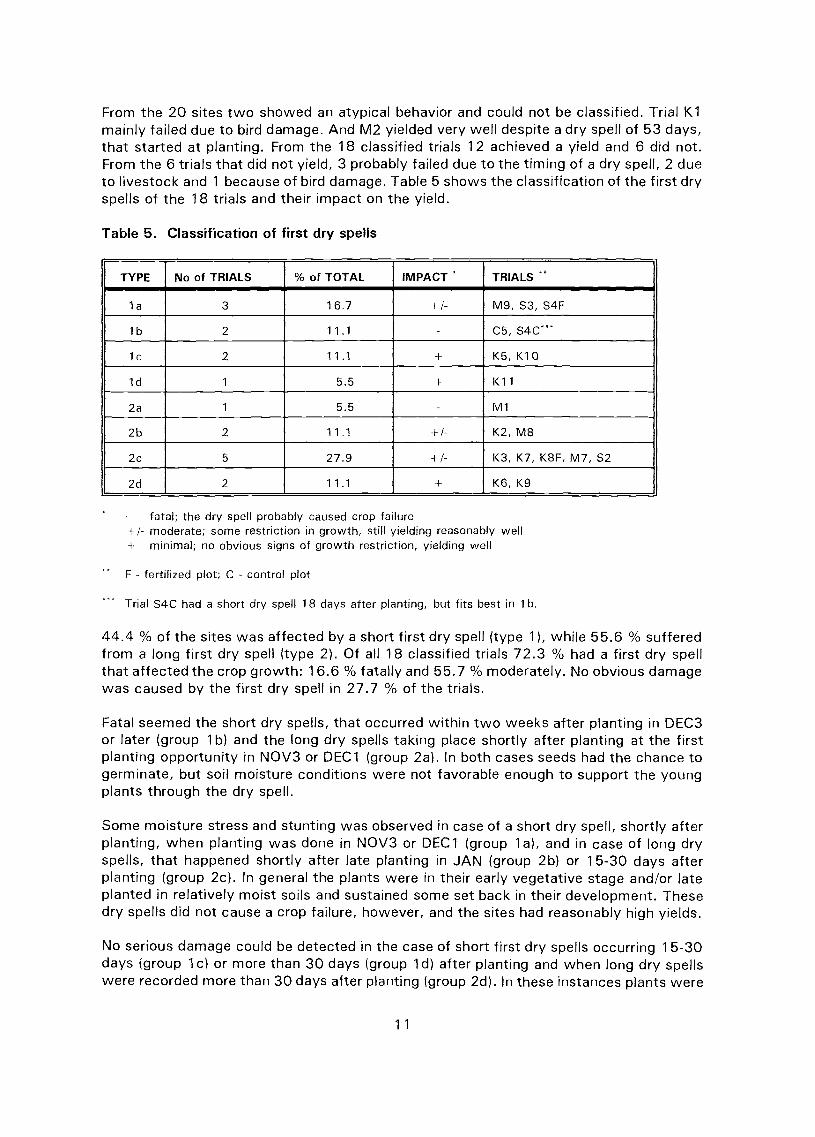
The 1994/95 rainfall season was characterized by a late start in the Southern and NorthEast Regions (first planting rains in DEC31, a slightly earlier start in Central Region andNorth West Region/Chobe (DEC1 ) and a statistically expected onset in NOV3 in the NorthWest Region around Maun. The total amount of rain received on the trial sites (from OCT1-MAY1) was in all five regions less than the long-term averages as compared to the nearestrainfall station and had an erratic distribution with one or more dry spells. Table 3 showsthe mean percentage of average rainfall per region. The area around Maun received verylittle rainfall (42 %), North East and Southern Region were slightly better off (58-59 °/0),and in Central Region and North West/Chobe a close to average rainfall season wasrecorded (84-90 %). The figures 2a and 2b show the rainfall totals of the 1994/95 seasonfor 13 well recorded trial sites, located in the 5 trial regions.
6

Table 2a-e. Synoptic data
2a. Francistown
2b. Kanye
2c. Kasane
7
STATION LONGITUDE
61 KANYE 2522 Esynoptic data interpolated based on station numbers :000month temperature ); relative
mean extreme humidity
LATITUDE
2458 S
cloud coverin octans
ELEVATION
1372
sunshinehrs/day
windkm/h
rainmm
PETmm
frostdaysper month
max min max min 08.00 14.00 20.00 08.00 14.00 20.00 air grnd
September 27.8 10.3 36.6 -2.9 51 24 33 0.0 0.0 0.0 9.6 7.8 15 148 0.3 0.2October 29.9 14.4 39.0 2.1 53 29 40 0.0 0.0 0.0 9.3 9.1 43 178 0.0 0.0November 30.4 16.2 39.1 6.2 59 34 50 0.0 0.0 0.0 8.8 8.2 67 187 0.0 0.0December 31.2 17.3 41.5 6.4 64 39 53 0.0 0.0 0.0 8.6 7.2 82 196 0.0 0.0January 31.4 18.1 41.3 8.6 67 41 56 0.0 0.0 0.0 8.5 6.9 99 187 0.0 0.0February 30.2 17.6 38.8 8.3 72 44 60 0.0 0.0 0.0 8.5 5.9 87 161 0.0 0.0March 29.3 16.1 38.3 6.3 74 45 65 0.0 0.0 0.0 8.1 5.0 72 147 0.0 0.0April 26.4 11.6 34.2 -2.3 77 41 65 0.0 0.0 0.0 8.3 4.8 40 115 0.1 0.0May 23.6 6.4 32.4 -3.8 75 34 59 0.0 0.0 0.0 9.1 5.1 12 88 0.8 0.5June 21.1 2.8 29.1 -6.6 74 30 53 0.0 0.0 0.0 8.5 4.8 6 72 5.6 11.4July 21.2 2.6 28.4 -7.8 69 28 47 0.0 0.0 0.0 9.7 5.0 3 81 5.4 10.3August 24.3 5.4 32.4 -5.9 58 24 37 0.0 0.0 0.0 9.9
yeartotal6.4
rain :
3530
110 1.9 3.7
STATION
33 FRANGISTOWN
month temperaturemean extreme
max min max mm
September 29.8 12.3 37.0 1.5October 31.5 16.2 40.2 4.0November 31.0 16.9 41.1 4.1December 30.3 18.5 39.5 8.8January 30.7 19.0 40.6 10.6February 29.5 18.2 38.4 10.5March 29.3 16.9 38.8 4.0April 27.7 13.7 35.6 4.0May 25.6 8.5 34.0 -1.0June 23.0 5.3 31.1 -4.5July 23.1 4.8 30.6 -5.0August 25.1 7.7 35.5 -4.2
LONGITUDE
2729 E
Z relativehumidity
08.00 14.00 20.00
51 2756 3259 4168 4469 4874 5072 4674 4172 3267 3470 2960 26
LATITUDE
2109 S
cloud coverin octans
08.00 14.00
0.0 0.00.0 0.00.0 0.00.0 0.00.0 0.00.0 0.00.0 0.00.0 0.00.0 0.00.0 0.00.0 0.00.0 0.0
ELEVATION
968
sunshinehrs/day
20.00
0.0 9.60.0 9.00.0 8.10.0 7.40.0 8.00.0 8.20.0 8.20.0 8.50.0 9.40.0 8.90.0 9.60.0 9.9
yeartotal
windkm/h
8.29.28.07.36.96.86.85.85.05.05.56.5
rain :
rainmm
6276090
1008359256301
460
PETmm
1621881821811801611551281078998
127
frostdaysper monthair grnd
0.0 0.60.0 0.00.0 0.00.0 0.00.0 0.00.0 0.00.0 0.00.0 0.10.0 3.03.7 12.03.3 12.00.8 4.2
,iAfION
64 KASANE
month temperaturemean extreme
max min max min
September 31.5 12.7 37.8 3.5October 32.9 16.8 38.4 7.7November 31.9 18.0 38.7 10.4December 30.0 18.1 38.1 11.8January 29.5 18.3 38.0 10.0February 29.2 18.0 36.7 10.9March 29.3 17.1 36.9 10.3April 28.6 14.0 34.3 6.2May 26.9 9.4 32.3 -0.3June 24.4 5.6 30.4 -3.9July 24.5 5.4 30.7 -2.7August 27.5 8.0 34.2 -3.4
LONGITUDE
2509 E
); relativehumidity
08.00 14.00 20.00
44 2146 2659 3674 4980 5582 5479 5174 4269 3370 3167 2854 24
LATITUDE
1749 S
cloud coverin octans
08.00 14.00
0.0 0.00.0 0.00.0 0.00.0 0.00.0 0.00.0 0.00.0 0.00.0 0.00.0 0.00.0 0.00.0 0.00.0 0.0
ELEVATION
960
sunshinehrs/day
20.00
0.0 10.40,0 9.00.0 7.90.0 7.10.0 7.30.0 7.60.0 8.10.0 8.90.0 9.50.0 9.60.0 9.80.0 10.5
yeartotal
windkm/h
5.05.74.84.23.93.94.23.83.63.73.84.5
rain :
rainmm
22270
1481591389625
3200
665
PETmm
17019117516615814515213811799
108138
frostdaysper monthair grnd
0.0 0.00.0 0.00.0 0.00.0 0.00.0 0.00.0 0.00.0 0.00.0 0.00.0 0.20.0 1.00.0 1.70.0 0.0

2d. Mahalapye
2e. Maun
Table 3. Mean percentage of average rainfall in trial regions
REGION MEAN % of AVERAGE RANGE No. of STATIONS
North West/Chobe 90 80-99 2
North East/Francistown 58 54-77 4
Southern/Kanye 59 33-90 11
North West/Maun 42 41-44 2
Central/Serowe 84 78-89 2
STATION
106 MAHALAPYE
month temperaturemean extreme
max min max min
September 29.2 12.6 37.6 1.7October 29.8 15.6 39.3 6.2November 30.4 18.0 38.6 8.6December 30.6 19.0 37.9 11.6January 30.9 19.1 40.5 12.5February 30.2 19.2 36.6 13.5March 28.6 16.6 36.5 9.8April 26.5 13.2 34.6 4.5May 24.4 8.1 33.0 1.0June 22.1 4.9 28.9 -5.4July 22.3 3.9 29.8 -4.0August 25.1 7.1 34.1 -6.0
LONGITUOE
2650 E
% relativehumidity
08.00 14.00 20.00
50 3052 3860 4760 4458 4764 5468 5464 4462 3564 4254 3355 31
LATITUDE
2307 S
cloud coverin octans
08.00 14.00
0.0 0.00.0 0.00.0 0.00.0 0.00.0 0.00.0 0.00.0 0.00.0 0.00.0 0.00.0 0.00.0 0.00.0 0.0
ELEVATION
1006
sunshinehrs/day
20.00
0.0 8.80.0 8.40.0 7.60.0 8.60.0 6.80.0 7.10.0 7.80.0 8.60.0 8.70.0 8.70.0 9.70.0 9.1
yeartotal
windkm/h
3.84.44.03.63.42.92.72.42.22.42.22.9
rain :
rainmm
8316879888368269322
468
PETmm
136159164180172149136110897280
105
frostdaysper monthair grnd
0.0 0.10.0 0.00.0 0.00.0 0.00.0 0.00.0 0.00.0 0.00.0 0.00.0 1.02.2 11.10.9 10.80.5 3.4
STAT ION LONGITUDE LATITUDE ELEVATION
130 MAUN 2325 E 1959 S 945
month temperaturemean extreme
max min max min
relativehumidity
08.00 14.00 20.00
cloud coverin octans
08.00 14.00
sunshinehrs/day
20.00
windkm/h
rainmm
PETme
frostdaysper monthair grnd
SeptemberOctoberNovemberDecemberJanuaryFebruaryMarchAprilMayJuneJulyAugust
32.2 14.8 38.6 3.934.1 18.6 41.4 9.033.0 19.4 41.7 9.432.1 19.4 40.6 8.431.6 19.5 40.0 9.231.4 18.9 37.2 10.631.3 17.8 39.5 6.229.9 15.0 35.0 4.427.5 9.6 33.0 -1.125.0 6.9 30.6 -5.825.1 6.9 31.3 -3.628.3 9.8 35.2 3.5
40 1944 2357 3269 4276 4878 4875 4270 3664 2764 2762 2552 20
0.0 0.00.0 0.00.0 0.00.0 0.00.0 0.00.0 0.00.0 0.00.0 0.00.0 0.00.0 0.00.0 0.00.0 0.0
0.0 10.10.0 9.50.0 8.60.0 8.30.0 8.00.0 8.10.0 8.50.0 9.10.0 10.00.0 9.50.0 9.80.0 10.3
yeartotal
7.88.87.76.86.05.76.05.75.55.86.16.6
rain :
3164781
10699702641
00
454
184207199193179159161140123105114147
0.0 0.00.0 0.00.0 0.00.0 0.00.0 0.00.0 0.00.0 0.00.0 0.00.0 0.20.0 7.80.0 1.70.0 0.1
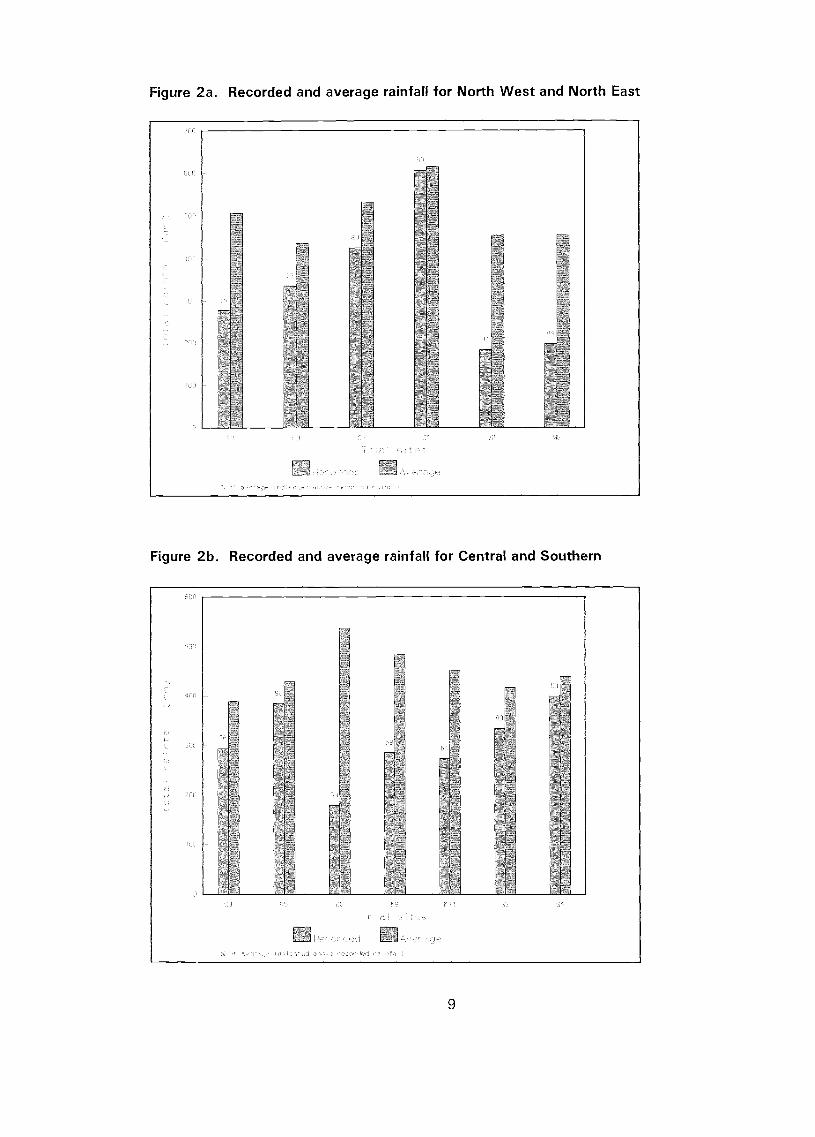
Figure 2a. Recorded and average rainfall for North West and North East
Figure 2b. Recorded and average rainfall for Central and Southern

At various places in the Southern Region a hailstorm was recorded on 06/02/95, whichtotally shredded leaves of sorghum plants. As the heads were not yet exposed, the plantsmade a full recovery and yielded well.
Dry spells
At all trial sites, one or more dry spells were recorded during the 1994/95 rainfall season.It should be remarked, that dry spells have been the cause of crop failure on those trialsites, where no germination took place or where no planting opportunity was identified.A dry spell in this study is defined as a period of at least 14 days of no or not effectiverainfall (rainfall less than the evapotranspiration). Some observations can be madeconcerning types and number of dry spells, and their effect on the grain yield. Consideredwere those trial sites, where seeds germinated, plants established, the crop growth waswell monitored and which had complete rainfall records.
19 from the 43 trial sites met the above requirements for an analysis of dry spells. Ofthree sites either the fertilized or the control plot failed due to a reason other than a dryspell (wind erosion or weeds). In one case the fertilized plot was planted 23 days earlierthan the control plot. For this analysis they were considered as two different trial sites,making a total of 20 sites.
The number of dry spells observed, varied from 1-4 all over the country. One single dryspell mainly occurred around Maun and the 4 dry spells were recorded around Mahalapye.In the majority of cases 2 or 3 dry spells were observed (see table 4).
Table 4. Number of dry spells
A classification is made of the first dry spells, as they often fall in an early stage of thecrop growth cycle, and can be most decisive for further crop development. Two maingroups were recognized according to the length of the dry spells:
short dry spells: 14-21 dayslong dry spells: 22 days or longer.
Sub-groups were distinguished based on the time of planting and the occurrence of thefirst dry spell (in days) after planting:
0-14 days after early planting in NOV3 or DEC10-14 days after late planting in DEC3 or JAN15-30 days after plantingmore than 30 days after planting
10
DRY SPELLS SITES % of TOTAL
4 20
2 10 50
3 4 20
4 2 10
From the 20 sites two showed an atypical behavior and could not be classified. Trial K1mainly failed due to bird damage. And M2 yielded very well despite a dry spell of 53 days,that started at planting. From the 18 classified trials 12 achieved a yield and 6 did not.From the 6 trials that did not yield, 3 probably failed due to the timing of a dry spell, 2 dueto livestock and 1 because of bird damage. Table 5 shows the classification of the first dryspells of the 18 trials and their impact on the yield.
Table 5. Classification of first dry spells
- fatal; the dry spell probably caused crop fa.lure+/- moderate; some restriction in growth, still yielding reasonably well+ minimal; no obvious signs of growth restriction, yielding well
" F - fertilized plot; C - control plot
Trial S4C had a short dry spell 18 days after planting, but fits best in lb.
44.4 % of the sites was affected by a short first dry spell (type 1), while 55.6 `)/0 sufferedfrom a long first dry spell (type 2). Of all 18 classified trials 72.3 `)/0 had a first dry spellthat affected the crop growth: 16.6 % fatally and 55.7 c/o moderately. No obvious damagewas caused by the first dry spell in 27.7 `)/0 of the trials.
Fatal seemed the short dry spells, that occurred within two weeks after planting in DEC3or later (group 1b) and the long dry spells taking place shortly after planting at the firstplanting opportunity in NOV3 or DEC1 (group 2a). In both cases seeds had the chance togerminate, but soil moisture conditions were not favorable enough to support the youngplants through the dry spell.
Some moisture stress and stunting was observed in case of a short dry spell, shortly afterplanting, when planting was done in NOV3 or DEC1 (group la), and in case of long dryspells, that happened shortly after late planting in JAN (group 2b) or 15-30 days afterplanting (group 2c). In general the plants were in their early vegetative stage and/or lateplanted in relatively moist soils and sustained some set back in their development. Thesedry spells did not cause a crop failure, however, and the sites had reasonably high yields.
No serious damage could be detected in the case of short first dry spells occurring 15-30days (group 1c) or more than 30 days (group 1d) after planting and when long dry spellswere recorded more than 30 days after planting (group 2d). In these instances plants were
11
TYPE No of TRIALS % of TOTAL IMPACT TRIALS
la 3 16.7 +/- M9, 53, S4F
lb 2 11.1 C5, S4C-
1 c 2 11.1 K5, K10
ld 1 5.5 K11
2a 1 5.5 - M1
2b 2 11.1 +/- K2, M8
2c 5 27.9 +/- K3, K7, K8F, M7, S2
2d 2 11.1 K6, K9

in their middle to late vegetative stage, well developed and resistant enough to stand aperiod without (sufficient) rainfall.
The impact of (second, third or fourth) dry spells (after a first dry spell of either type 1 or2) during the grain filling stage of the crop did not seem to be vital for the final yield. Atmost, a slight reduction in grain weight was found, the more dry spells occurred.
Based on the above analysis, the limited number of observations and bearing in mind, thatthe rainfall season 1994/95 was below average, no conclusions can be drawn on the idealtime of planting in order to minimize the risk of crop damage or failure due to dry spells.However, after characterizing the first dry spell, some predictions could perhaps be doneconcerning the crop performance, considering optimal crop husbandry.
2.3 Management observations
General
The cropping season 1994/95 was characterised by below average total rainfall, andconsequently low farmers' yields. Dryland maize failed nearly everywhere, while sorghum,cowpeas and melons were harvested throughout the country in amounts of 1-2 (70 kg)bags/ha. The number of farmers that obtained a yield was very low in the North WestRegion, both around Maun and in Chobe < 10 %. In Chobe the rainy season started lateand was the first planting rain used to loosen up the (relatively heavy) soils beforeploughing, hence postponing planting to the second opportunity. In the North East andCentral Regions some 50 `)/0 of the farmers achieved a yield. Rainfall was just belowaverage and other income generating activities seemed to get priority. In the SouthernRegion approximately 75 % of the f arming households harvested, despite the late start ofthe rains. Perhaps the farmers in that Region were more inclined to arable f arming and toconducting proper crop husbandry.
Draught power
Of all trial sites 85 % was ploughed with draught animals; in 72.5 % of the cases donkeyswere used and in 12.5 % oxen. A tractor was used in the remaining 15 %.
Often in Botswana, farmers give as excuse for late planting the reason that their draughtanimals are in a bad shape at the beginning of the rainy season. From the trials that wereploughed with animal draught power, it appeared that the vast majority was ploughedwithin six days after the identified planting rain. In many cases part of the farmer's ownfield was ploughed during the same period as well. It is hard to accept the argument ofweak draught power as cause for a delay in starting to plough/plant based on thisobservation. Additionally it could be stated, that grasses (fodder for the draught animals)need at least 20 days to germinate and produce some edible biomass. This would meanthat ploughing/planting should earliest be taking place some three weeks after the firstidentified planting rainfall event, which does not seem to happen in practice. It should beremarked, however, that due to the weakness of the draught animals, ploughing andplanting operations take more time in the beginning of the season, than later on.Frequently only the morning is used for ploughing/planting at the beginning of the season,leaving the animals enough time to recuperate, feed and drink. Later in the season,however, the animals are also used in the late afternoon.
12

Labour
When use is made of draught animals, the ploughing operation is often carried out by 3-4people and harrowing (if done) and planting with 3. The necessary minimum, however, is2 people for all three operations; one to control the implement and one to control thedraught animals.
Recordings show, that in the Maun trials on average 109.4 manhrs/ha was spent onfertilizing, harrowing, ploughing and planting. If the actual hours spent on these operationsis calculated for 2 people, then an average of 75.4 manhrs/ha should be spent. Assuminga working day of 6 hours (from 6 am to noon), it would take 2 people 6.3 working daysto finish one hectare. For the Kanye trials 107 manhrs/ha were used for fertilizing,ploughing and planting (against 96.9 manhrs/ha in Maun without harrowing). More timewas spent per operation (especially ploughing) in Southern Region, and calculated for 2people 93 manhrs/ha were used, which would take them 7.8 days/ha. From Serowe andKasane is reported that ploughing takes 48 manhrs/ha on average (2 people finish 0.25 hain 6 hours). See table 6 for more detailed labour hours spent per operation.
Table 6. Labour time used per management operation
All labour time used is converted to manhrs/ha
Apart from one or two lost days for looking for draught animals, the long time spent perhectare on land preparations explains the delay between the end of the rainfall event andthe day of planting. A further delay was sometimes caused by the fact, that farmers didnot work on the lands on either Friday, Saturday or Sunday, due to traditional/religiousreasons. Time was also lost due to social obligations as meetings, marriages and funerals.
It was noted in several regions that labour shortages occurred, especially in female headedhouseholds, for ploughing/harrowing/planting and in most types of households for the timeconsuming activities of weeding and birdscaring.
Fertilizing
Four farmers in the Southern Region used a planter with a mounted fertilizer hopper.Through the hopper 50 kg (corresponding to 200 kg/ha) of single superphosphate fertilizerwas applied next to the seeds and the balance was broadcasted before ploughing. At allother trial sites the fertilizer was broadcasted and ploughed in. Because of inaccurateploughing at some sites, fertilizer particles were still observed on the surface after planting.
In Chobe a standard dose of 50 kg (corresponding to 200 kg/ha) of single superphosphateand 3:2:1 were applied; no more accurate amounts could be given, due to the uncertaintyabout the phosphorus levels as a result of the soil tests.
13
REGION FERTILIZING PLOUGHING HARROWING PLANTING TOTAL
Kasane 48
Maun 8.4 63.5 12.5 25 109.4
Kanye 2 77 n/a 28 107
Serowe 48

Ploughing
Some farmers seem to believe, that they should wait with ploughing for one or two daysafter a sufficient rainfall event, in order to allow the rainwater to infiltrate and wet the soilproperly. This practice could also attribute to delayed planting (see under Labour). In theCentral Region it was observed, that the (sandy) topsoil had dried out by the time ofplanting, due to some delay in the start of ploughing.
In the Central Region on trial site S2, an experiment was done with a planter mounted ona double mouldboard plough. This combination was preferred by the farmer above thesingle mouldboard plough and single row planter, because of the time gain; only one passthrough the field is required. On the plot where the plough/planter combination was used,a poor germination and consequently gaps in the plant stand were observed. The singleplough/planted plot had a more uniform crop stand. Perhaps the difference in crop standcan be attributed to an uneven planting depth. Certainly, no harrowing could be carried outusing the combined implement.
Amongst several of the trial farmers in the Southern Region an awareness is noted aboutthe risks of shallow ploughing. This allows rainwater only to infiltrate to a certain depth,could create a pan and obstruct a deep penetration and proper development of the plantroots.
All trial plots (molapo and dryland fields) in the Chobe Enclave were situated on thefloodplain. The soils of the floodplain have a high clay content: 30-50 %. Often farmersuse the first planting rain (20-30 mm) to loosen up the topsoil. Only after the secondrainf all event ploughing/planting with animals is carried out. Ploughing of the heavy soilsbreaks the surf ace of the soils into big massive clods. Some of the farmers plough twiceor harrow to reduce the clods in size. In the Chobe Enclave four trial sites were ploughedby tractor. Generally the ploughing was inefficiently done: very superficial and often weedtufts were still left on the surface.
Harrowing
In most instances no harrowing was carried out on the trial sites in the Chobe Enclave,resulting in very irregular surfaces and uneven planting depth.
Only on the trial sites around Maun harrowing was carried out as a standard practice. Thesoils were generally sandy (Arenosols), and a smoother planting surface, relatively free ofweed tufts was achieved, as compared to farmers' fields that had not been harrowed. Theharrowing operation created a good condition for uniform planting depths.
Planting and seed rates
Planting is a crucial operation and the use of a row planter demands special care andaccurateness of the operator. Several ALUPs reported problems with the Sebele rowplanters used by the trial farmers. The main constraints were temporary blockage of theseed outlet and hence uneven seed droppings. Often grass tufts and damp soil clods weredragged along by the planter for a couple of meters, blocking the seed outlet and thusattributing to an uneven plant stand. Uneven surfaces caused by furrows, also led tovarying speed and direction of the planters, resulting in uneven seeding rates. At times,high amounts of seed were planted, e.g. seeding rates up to 40 seeds/m2 have been
14

observed, which would have resulted in a plant density of 400,000 plants/ha, if all seedswould have emerged.
DAR recommended a seeding rate of approximately 3 kg/ha in order to achieve a plantdensity of 15,000 plants/ha (for the Maun trials) and 5 kg/ha to obtain 50,000 plants/ha(for the other regions). Converted to quarter hectare trial plots, this resulted in 750gram/plot for Maun and 1250 gram/plot in Kanye. In both cases almost all farmers usedall distributed seed. Nevertheless it seemed very difficult to achieve the target plantdensities. Most trial around Maun reached plant densities below 5000 plants/ha, while inthe other regions plant densities between 15,000-30,000 plants/ha were achieved.
The DAR recommendations include a germination rate of 80 %. However, based on seedcounts, 3 kg of sorghum seed should be enough to reach a plant density of 100,000plants/ha (including 80 % germination rate). This discrepancy of 6.6 times might becaused by factors such as:
improper seedbed preparation (irregular ploughing, no harrowing), leading to unevenplanting depthplanter problems; uneven dropping of seeds, causing a competition for soil moistureof clusters of seedsno thinning operation carried out, maintaining the competition for soil moisture,restricting growth of individual plants and possibly leading to lesser grain yield perplants or failure to develop heads at allbird/insect damage to seed, just after plantingdamaged seedspoor germination potential (less than the guaranteed 80 %)
In the Chobe Enclave, the recommended Sebele row planter can not be used. Because ofthe big soil clods, the wheel of the planter does not function properly. No other row planterhas been developed so far, that is suitable for the soils in the Chobe Enclave. Most farmerspractice a type of third furrow planting by following the plough (in some cases a tractor)and drop the seeds by hand in each third furrow made by the plough. On the way back theplough covers the furrow with the next slice of soil.
The control plot of trial site S2, Makwate Central Region, was dry planted on 27-28/12/94, followed by good rains on 29/12/94.
In the majority of cases the first planting opportunity of the season was used to plant thetrial plots. Sometimes the topsoil had dried out within 4-6 days after the rainfall event andbefore ploughing was finished, so that planting had to be held up until the nextopportunity. As mentioned above, in the Chobe Enclave, planting generally took place atthe second planting opportunity due to the soil conditions.
Pest and disease control
In the Southern Region three farmers were assisted by the Plant Protection Division ofMoA with spraying against armyworm, stalk borers and corn crickets. Alphametrion wasused in knapsack sprayers. Half of the trial plots S3, Dihate Central Region, were sprayedwith "Sherpa" against bollworm by FSR. A concentration of 7.5 m1/15 I was used. Thebollworm disappeared, but no difference was observed between the treated and the nontreated sections of the plots.
15

In Maun, one trial site was sprayed with Decis ULV against aphids.
Aphid attacks were reported from most regions. They mainly occurred during the latevegetative stage and were usually washed off the plants by a good shower. In LotlhakaneWest (K3) near Kanye the trial site was not treated against aphids, and no timely rainoccurred, resulting in dying off of the first developed heads. Despite the black heads plantsdid develop some tillers with secondary heads.
Bird scaring during the crop's grain filling stage formed the farmers' main activity sinceMAR3. Where a shortage of labour occurred a large portion of heads was damaged (up to100 °/0).
Cattle entering the trial sites and severely damaging the crop was observed in a few cases.
On the molapo trial plots in the Chobe Enclave bird scaring was not necessary, becauseof the well protected maize crop. However, as fields are traditionally not fenced, damageby wildlife is a constant threat. Farmers are living on lands during the cropping season,prepared for full time vigilance.
Weeding
In general most farmers, vvhose trial crop established well, conducted a weeding operation.The first weeding operation usually took place between 30-40 days after planting and wascarried out in approximately 10 days. A second weeding operation (mainly conducted onthe Kanye trial sites, due to the use of fertilizer) happened 50-65 days after planting andtook around 1-5 days. The number of days spent on the weeding operations stronglydepended on the amount of labour available and whether the trial plots formed part of anoperation on the entire farmer's field or whether they were treated separately.
Farmers in the Chobe Enclave were reluctant to weed their fields after a poor germination.They reckoned, it was a waste of time to engage themselves in an activity, which theythought was not economically viable. The crops from those who did weed, remainedstunted (30-50 cm) for the whole season and did not yield.
Some farmers in the Southern Region were hesitant to conduct a timely weedingoperation, because as they stated, a dry spell had reduced the soil moisture and increasedthe soil temperature. The farmers explained, that weeding at that moment would damageplants, as hot soil would be pushed against them.
Another farmer near Kanye, in Sese (K9), had delayed weeding his trial plots, as he saidto protect the seedlings against wind erosion until they were a bit stronger. It seemed tohave made a positive impact on the plant establishment, because an adjacent field waspractically free of weeds, but had a very poor establishment rate.
A lack of knowledge was detected, when one farmer admitted, that she did not know thatweeds compete with crops for soil nutrients and fertilizer. She was very motivated to startweeding after obtaining this information.
The farmer in Polokwe (K5) conducted weeding with a cultivator and was enthusiasticabout the results of proper weeding.
16
Harvesting
In the Central Region and around Maun, it was observed that many sorghum growers arenot interested in small immature heads or in heads with only partially filled grains (so called"mothalane"). After approximately two weeks of harvesting mature heads, they stoppedand left the immature heads behind. In the Southern Region most farmers harvested allimmature/partially filled heads and dried and threshed them separate from the matureheads and used the grains to feed their chickens.
In the Southern Region the sorghum crop is often left to dry on the stem, out of tradition,until the first cold (winter) winds arrive to finalize the drying of the grains. Consequently,lodging may occur and some of the grain may be lost due to wind or rodent action.
At the successful molapo trial in the Chobe Enclave (C9), it was remarked that the farmerdelayed the harvest until all maize cobs had fully ripened on the stems. This was done, asthe farmer was reluctant to spend too much time in harvesting; due to probably the wayof planting, the plant stand had developed rather unevenly. Instead of harvesting themature cobs and let them dry near the hut, a crop damage of approximately 10%occurred, due to termite and other insect attacks and fungi. The obtained yield figure fromthis trial could well be underestimated, due to home consumption of green mealies by thefarm family.
2.4 Agronomic observations
Germination and plant establishment
On most trial sites in the Southern Region, 80 % of the established plants germinatedwithin 6-7 days after planting. The remaining 20 % of the seeds germinated,approximately 4-5 days after the next major rainfall event. Both groups of plantsestablished and continued developing (see Photograph 1, Appendix VI). The older plantsusually formed proper heads and yielded fully filled grains, whilst the later germinatedplants never finished their grain filling stage and ended up as "mothalane". This "secondgermination phase" was also observed around Maun and is known from the North EastRegion. Irregular planting depth and long dry spells shortly after planting might cause thisphenomenon.
At the Maun trials, germination normally took place around 10 days (7-11) after planting.At one occasion germination occurred 26 days after planting, but 5 days after a secondrainfall event of 28 mm.
From some trials in the Central Region poor germination was reported, due to a delaybetween the planting rainfall event and the actual planting. The prolonged dry spell and thehigh temperatures and the low moisture content of the topsoil may have caused the lowestablishment rates.
Those dryland farmers in the Chobe Enclave, who managed to plough and plant, had verypoor germination and crop establishment. This can be attributed to the uneven rainfalldistribution, resulting in high moisture stress during the cropping season. Farmers, whosecrop had not germinated three weeks after a dry spell in January, abandoned their fieldsand left for Kasane to look for employment.
17

Effect of fertilizer
Generally the use of fertilizer seemed to have a positive effect on plant growth in thevegetative stage. As compared to the plants on the control plots, fertilized plants wereslightly taller, had more and greener leaves and thicker stems (see Photographs 2 and 3,Appendix VI). The Photographs 2 and 3 show a clear difference in plant developmentbetween the control and the fertilized plot of the Gamoswana trial site (K1) at 26 and 60days after planting, respectively. As the fertilized plants were stronger than the non-fertilized, they were more resistant against wind erosion and dry spells. Often the fertilizedplants had developed 1-2 tillers more than the non-fertilized.
Plant stands and crop development
The trial sites in the Southern Region showed the most homogeneous plant stands. Soilpreparations and planting had been carried out well; straight rows with relatively few gaps.The extra time spent on ploughing and planting (as compared to Maun area) seems to havepaid off. In the other regions more heterogeneous plant stands have been observed, withplants in different development stages on one plot. Possible causes for this uneven plantdevelopment have been discussed above: improper land preparations, malfunctioningplanters and rainfall/soil moisture conditions.
In general the highest plant densities were achieved around Kanye. Often, however, wheretarget plant densities of approximately 30,000 plants/ha were achieved, plants had thinstems and only 2-3 tillers per plant. On trial plots with extremely low plant densitiesaround Maun, the surviving plants developed very well and generally formed 3-6 tillers perplant (see Photograph 5, Appendix VI).
It took the successful trials in all regions on average 71 days (55-87) from planting to 50% flovvering (see Photograph 6, Appendix VI). Flowering continued for approximately 10-20 days. The grain filling lasted for about 30-35 days (see Photographs 4 and 7, AppendixVI), while ripening took around 25 days.
The average length of the growing season (from planting till harvest) amounted 128 days(112-146) in all regions except Southern. There the crop was left to dry on the stems for1-1.5 month after reaching physiological maturity, resulting in an average season of 160days (150-176).
The slightly longer growing season of 128 days, than the average of 120 days for sorghumSegaolana, could have been caused by the relatively late start of the rainy season andconsequently late planting. Dry spells, moisture stress and low temperatures in June/Julymay also have led to a prolongation of the crop cycle.
Farmers in the Southern Region observed, that the amount of fully developed heads and"mothalane" depends on the rainfall situation. In a season with early rains, no "mothalane"occurs. In case of late planting, due to late rains, the optimal growing conditions areshortened and not all heads get the chance to grain fill properly, leading to a certainpercentage of "mothalane " heads (see Photograph 8, Appendix VI). Additionally a numberof secondary shoots of the main tillers may also develop "mothalane" heads. Theproportion of fully developed heads and "mothalane" was around 80 %-20 % in the1994/95 grovving season. The fully developed heads attributed on average 97 % of thegrain weight, while the "mothalane" made up for the remaining 3 %.
18

Pest and disease factors
Type and damage factors of pests and diseases vary per region and time of observation.
In the Southern Region army worm, stalk borers, corn crickets, termites, birds, baboons,rodents and cattle have been observed affecting crop yields. At Gamoswana (K1), termitesseemed to attack plants during the season and past activity (anthills) may be the cause ofpatches of poorly developed plants. Due to poor fencing cattle damaged most of the cropat the Ramonedi trial site (K2).
In Central Region minor aphid and African Bollworm infestations have been recorded onsome trial sites. Quelea (immature grains) and pigeons (ripe grains) formed a threat to theharvest on most of the Serowe trials.
Aphids, birds and livestock have been affecting some of the trials around Maun. At Segoro(M9), a promising crop failed for 100 %, due to bird damage. As the farmers' own cropshad already failed due to dry spells, motivation was lacking to carry out bird scaring on thetrial plots. At Xhana (M2), the harvested fertilized heads were approximately 10 %damaged by birds; despite bird scaring activities the remaining secondary heads wereseverely affected by birds, upto 90 % damage. Cattle ate around 75 % of the wellestablished plants on the Thamalakane West site (M7).
Sorghum plants are most prone to bird damage during the grain filling and early ripeningstages, when the grains still contain a high moisture content. Bird damage dependsgenerally on the amount of effort put into scaring. If well controlled, bird damage can bekept to a maximum of 10% of the grains of each mature sorghum head. Several methodshave been observed throughout the country: scare crows, plastic bags on the stems orcovering the heads, strings with tins around the field, and people residing in or next to thefield, scaring birds with stones, sticks or voice. Where not enough labour was available,or when other activities got priority, considerable damage occurred; observations showed80-100% of the grains on individual heads had been picked towards the end of theripening time.
Only early planted crops (NOV3-DEC3) could possibly ripen before the beginning of April,generally the start of the quelea infestations. But in a poor rainfall year like the 1994/95season, an additional hazard is formed by local birds (like pigeons), which attack crops assoon as seeds have formed, due to the lack of seed bearing grasses and berry formingshrubs in the surrounding bush.
Molapo farming
Two trials were conducted under the molapo (flood recession) farming system at Mabelein the Chobe Enclave. The two fields were adjacent to each other, situated in a riverchannel. Trial site C9 was located in the lowest part of the channel, where the plots of siteC10 were positioned slightly higher on a bank of the channel.
Both farmers ploughed and planted in the dekade SEP2. Due to the higher position of siteC10 and a fast drop of the groundwater table, crop establishment was very poor andfinally the trial failed.
19

Trial C9 had a good establishment rate and plants developed well. The plants at thefertilized plots looked stronger and were slightly taller than those on the control plot. Thefertilized plots had a higher weed burden than the control. The dominant weed wasSesbania bispinosa, a leguminous weed. When uprooted, it was noticed that the roots ofthe weed plants on both fertilized plots showed more nitrogen fixating nodules than thoseof the control plot. The fertilized plants flowered two weeks earlier than the control plot.On average one cob was formed per plant.
During the last two months of the crop cycle, a humid micro climate established on thetrial sites due to the prolific growth of the leguminous weed. Most of the cobs wereaffected by insects and fungi. The infestation resulted on the fertilized plots in a grain lossof approximately 40-50 %; on the control plot the loss was somewhat lower 30-40 %.Harvesting was done in the dekad FEB1/95.
20

3 RESULTS
3.1 Trial yields
In total 43 on-farm trials were programmed for the 1994/95 cropping season. Of this total14 trials (33 `)/0) were successful and 29 (67 %) failed. The three main reasons for failurewere: - climate 5 trials (11%)
farmer 15 trials (35%)superv s on 9 trials (21%)
No identified timely planting opportunity and dry spells were the main adverse climaticreasons for trial cancellation or failure. Shortage of labour, slow preparation for theploughing season, negligence and other activities (cattle, building, social obligations)attributed to farmers missing the first planting opportunity or carrying out improper crophusbandry, leading to sub-optimal crop yields or even failure. Logistical and communicationproblems of the supervising teams have led to missed planting opportunities, wrongfertilizer applications or mixtures of Segaolane seeds and local varieties, making trial resultsunsuitable for comparison.
The yield figures for the successful trials are reflected in Table 7. Trial C9 in Mabele wasconducted under molapo farming conditions and with two types of fertilizer. The controlplot yielded 1770 kg/ha of maize, while the plot treated with 3:2:1 compound NPKfertilizer yielded 42 % higher (2520 kg/ha) and the single superphosphate plot harvested55 % higher than the control (2750 kg/ha).
Table 7. Yield figures and discrepancies control - fertilized plots
21
CODE REGION VILLAGE YIELD (kg/ha) DIFFERENCE%
CONTROL SSP
C9 North West/Chobe Mabele 1770 2750 + 55
K3 Southern Lotlhakane West 210 300 + 43
K5 Southern Polokwe 270 760 + 181
K6 Southern Kanngwe 460 1010 + 120
K7 Southern Mmathethe 170 350 + 106
K8 Southern Gasita failed 480
K9 Southern Sese 660 670 + 2
K10 Southern Mongwalale 470 870 + 85
K11 Southern Pitsane 1290 760 - 41
M2 North West/Maun Xhana failed 590
M8 North West/Maun Tsanakuna 560 failed
S2 Central Makwate 700 730 + 4
S3 Central Dihate 670 1000 + 49
S4 Central Dihate failed 670
SSP - single superphosphate molapo farming

Of the 10 dryland trials with successful control plots, the yields vary from 170-1290kg/ha, while the range for the 12 fertilized plots is 300-1010 kg/ha.
Nine of the above thirteen dryland sites, had both successful control and fertilized plots.In one instance (K11), the control plot yielded considerably more (41 %) than the fertilizedplot. In section 3.3.1 possible explanations for the deviating outcome of this trial are given.In two cases (K9 and S2), both control and fertilized plots yielded almost the same; thefertilized yields were 2 % and 4 % higher, respectively. On the remaining six sites (K3, K5,K6, K7, K10 and S3), the fertilized plot yielded significantly higher than the control plot;on average 97 %, ranging from 43-181 %.
The results from the Southern Region trials K5, K7, K9, K10 and K11 included fullydeveloped grains and "nnothalane". The harvested "nnothalane" varied from 1-48 kg/ha andcontributed 0.6-4.7 % to the control plot yields and 0.3-7.2 % to the fertilized yields,respectively. The highest amounts of "mothalane" were recorded in Sese (K9): 31 kg/ha(4.7 %) on the control plot and 48 kg/ha (7.2 %) on the fertilized plot.
It is suspected, that the yields from the Serowe trials are underestimated, since earlyharvested and immature heads have not been included. In addition, the used scale seemedto give rather round figures.
From the trials around Kanye, Maun and Serowe the average seed weight of harvestedmature heads has been recorded (see Table 8). The average seed weight of heads of non-fertilized plants was 26.4 g, varying from 6.9-60 g and of fertilized plants 29.4 g, rangingfrom 8.3-78 g. "Mothalane" in the Southern Region produced on average 8 g of seed perhead.
Table 8. Seed weight of sorghum heads
SSP - single superphosphate
22
CODE REGION VILLAGE GRAIN WEIGHT/HEAD (gram)
CONTROL SSP
K3 Southern Lotlhakane West 8.0 8.3
K5 Southern Polokwe 24.7 32.5
K6 Southern Kanngwe 25.8 31.8
K7 Southern Mmathethe 6.9 10.3
K8 Southern Gasita failed 16.4
K9 Southern Sese 46.4 34.2
K10 Southern Mongwalale 17.8 38.5
K11 Southern Pitsane 29.6 23.9
M2 North West/Maun Xhana failed 78.0
M8 North West/Maun Tsanakuna 60.0 failed
S2 Centra'l Makwate 19.8 19.1
S3 Central Dihate 25.0 24.2
S4 Central Dihate failed 35.1
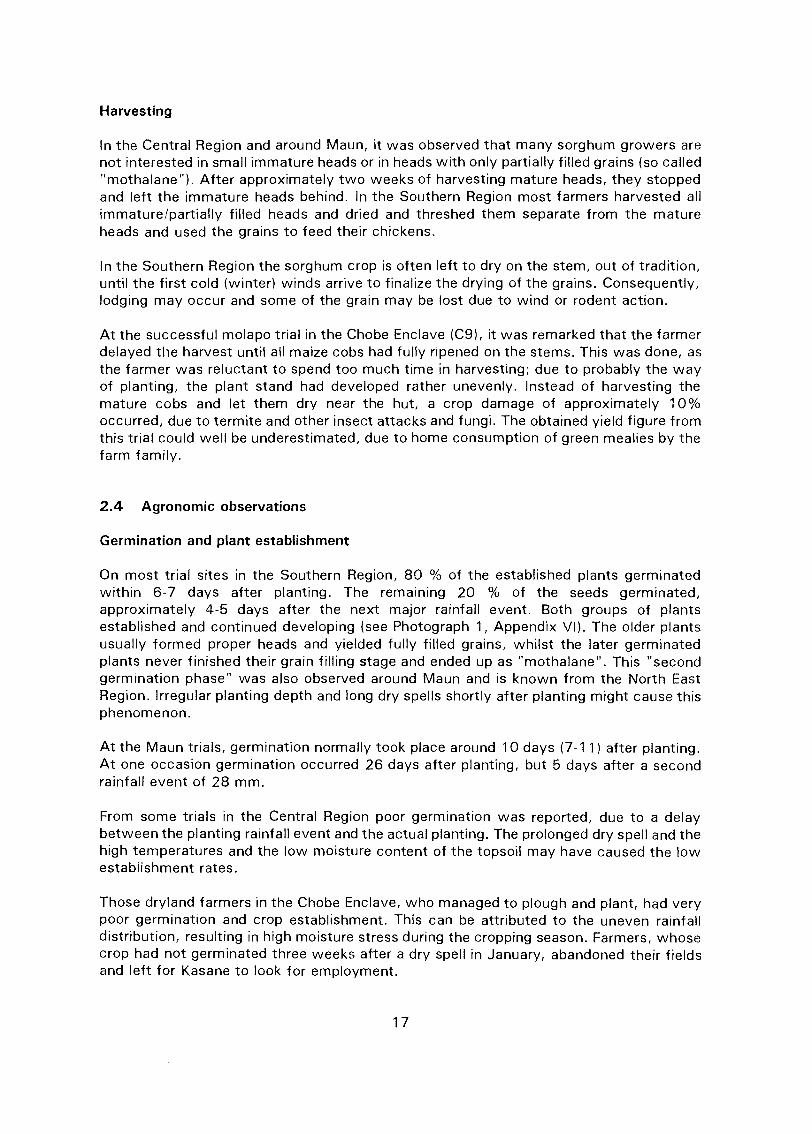
The relationship between grain weight of harvested heads and actual plant density isdepicted in Figure 3, for both control and fertilized plots. Although based on very fewobservations, a downward trend seems to exist in the grain weight/head with increasingplant density in the results of the control plots. On the other hand, the results of thefertilized plots show no obvious relationship between grain weight/head and plant density.
Figure 3. Relationship between grain weight/head and plant density
CONTROL FERTILIZED
3.2 CYSLAMB yields
The CYSLAMB simulations were based on trial observations as reflected in Appendix IV.Where a raingauge was placed on trial sites, recorded rainfall data were used. If no siterecords were kept, data from the nearest rainfall station were used instead. For synopticdata reference was made to the nearest synoptic station.
On most trial sites a soil pit was described and often (topsoil) samples were taken andanalyzed. The necessary soil characteristics to run CYSLAMB are: textural class, drainageclass, effective soil depth, available water holding capacity.
The simulated management factors are the dates of planting and the first weedingoperation, the plant density and the weed infestation rate.
The predicted yields for the successful trials and the discrepancy with the actuallyachieved yields are shown in Table 9. Under rainfed conditions, the CYSLAMB simulationsfor the control plots vary from 430-1070 kg/ha; for the fertilized plots the CYSLAMByields range from 670-1600 kg/ha. Due to the unreliable soil analysis, only the controlsituation of molapo trial C9 could be simulated (a phosphorus content of 6 ppm has beentaken).
The simulated yields under fertilized circumstances are on average 89 % (35-126) higherthan the simulations for the control plots.
23

Table 9. CYSLAMB yields and discrepancy with actual trial yields
24
CODE PREDICTED YIELD (kg/ha) and DISCREPANCY (%)
CONTROL SSP *
09 2340 - 24 % nia n/a
K3 560 - 63 % 1190 - 75 %
K5 960 -72 % 1330 -43 %
K6 430 + 7 % 970 + 4 %
K7 1070 -84 % 1440 -76 %
K8 failed failed 920 - 48 %
K9 710 - 7 % 1470 - 54 %
K10 760 - 38 % 1600 - 46 %
Kll 440 + 191% 990 - 23 %
M2 failed failed 670 - 12 %
M8 500 + 12 % failed failed
S2 810 - 14 % 1280 -43 %
S3 710 - 6 % 1320 - 24 %
S4 failed failed 810 - 17 %
SSP - single superphosphate molapo farming
NB: The discrepancy columns reflect the trial yields (see Table 7): e.g. a discrepancy of- 38 `)/0, means the actual yield was 38 % less than the by CYSLAMB predicted yield.
3.3 Comparisons
3.3.1 Trial versus CYSLAMB yields
The achieved trial yields are generally lower than the simulated CYSLAMB yields. From allcomparisons of the control plots, in 73 % of the cases the actual yield was less than theCYSLAMB yield; the discrepancy varies from 6-84 %. On 27 % of the control plots, theachieved yield was higher than the CYSLAMB prediction; the discrepancy varies between7-191 % (see Figure 4a). From the fertilized plots, 92 % yielded lower and 8 % higherthan the CYSLAMB simulations; the ranges of differences were 12-76 % less and 4 %more, respectively (see Figure 4b).
It is assumed, that 20 % difference between actual and simulated yield can beconsidered as significant. In that case, from all 23 comparisons, both control and fertilized,35 % is not significantly different; 65 %, however, shows a large discrepancy.
A number of reasons for sub-optimal crop yields, and hence for the discrepancy betweenactual and predicted yields can be mentioned, derived from the management andagronomic observations described in the sections 2.3 and 2.4.:
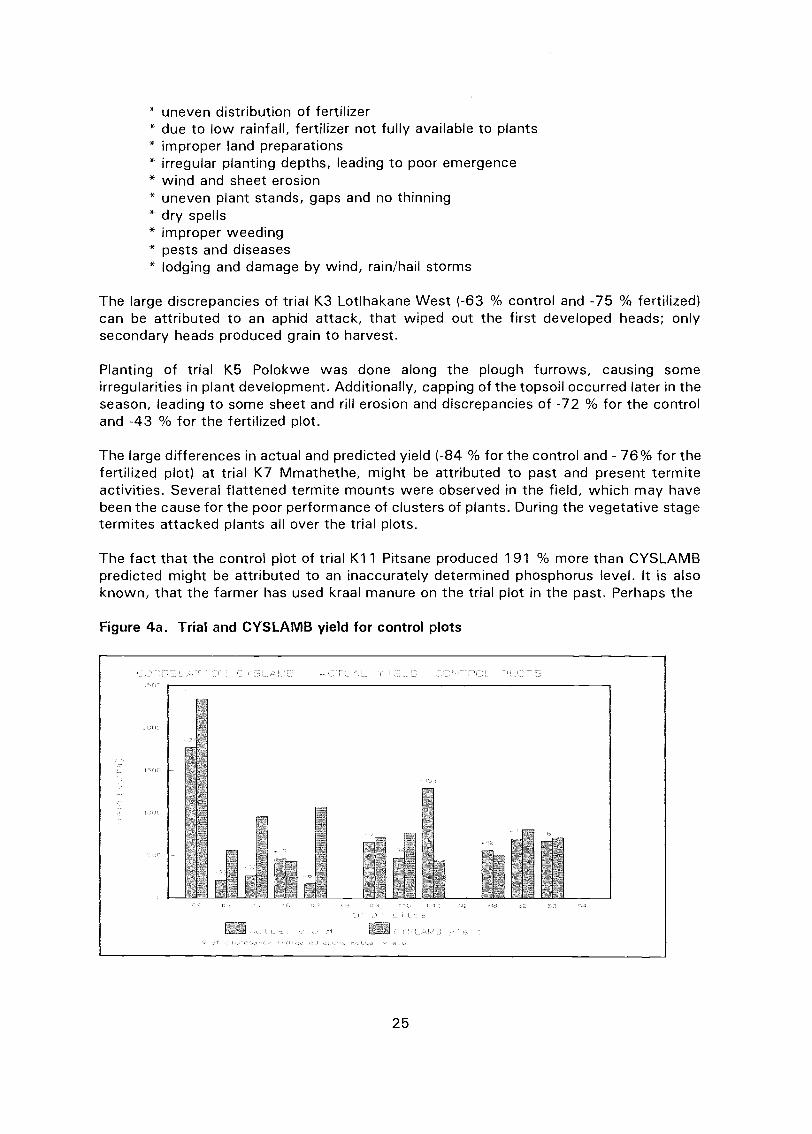
uneven distribution of fertilizerdue to low rainfall, fertilizer not fully available to plantsimproper land preparationsirregular planting depths, leading to poor emergencewind and sheet erosionuneven plant stands, gaps and no thinningdry spellsimproper weedingpests and diseaseslodging and damage by wind, rain/hail storms
The large discrepancies of trial K3 Lotlhakane West (-63 % control and -75 % fertilized)can be attributed to an aphid attack, that wiped out the first developed heads; onlysecondary heads produced grain to harvest.
Planting of trial K5 Polokwe was done along the plough furrows, causing someirregularities in plant development. Additionally, capping of the topsoil occurred later in theseason, leading to some sheet and rill erosion and discrepancies of -72 % for the controland -43 % for the fertilized plot.
The large differences in actual and predicted yield (-84 % for the control and - 76% for thefertilized plot) at trial K7 Mmathethe, might be attributed to past and present termiteactivities. Several flattened termite mounts were observed in the field, which may havebeen the cause for the poor performance of clusters of plants. During the vegetative stagetermites attacked plants all over the trial plots.
The fact that the control plot of trial K11 Pitsane produced 191 % more than CYSLAMBpredicted might be attributed to an inaccurately determined phosphorus level. It is alsoknown, that the farmer has used kraal manure on the trial plot in the past. Perhaps the
Figure 4a. Trial and CYSLAMB yield for control plots
LI
25

nutrient status of especially the control plot is much more favorable than simulated byCYSLAMB. The relatively low yield of the fertilized plot is probably caused by shallowploughing and subsequently the formation of a pan at approximately 20-30 cm below thesurface. This observation is supported by a high germination rate and a promising earlyvegetative stage, but a further hampering of the plant development, due to shallow rootpenetration. The result of the fertilizer trial was 23 % less than the CYSLAMB prediction.
Both control and fertilized yields of trial K6 Kanngwe show a very good correlation withthe CYSLAMB prediction: the trial yields were 7 % (control) and 4 % (fertilized) higherthan the CYSLAMB simulations.
Figure 4b. Trial and CYSLAMB yield for fertilized plots
I -1
3.3.2 Trial versus farmers' yields
In most regions no yield data was collected of farmers' yields. Either different varieties ofsorghum or a mixture of crops were planted, or farmers' crop had failed. In the SouthernRegion most of the trial farmers grew sorghum Segaolane as monocrop on their own fieldsand managed to obtain a yield (see Table 10). In all but one cases, the trial control plotsyielded higher than the farmers' own fields. The positive differences vary between 17-625%. The main reasons for the better performance of the trial plots is caused by proper crophusbandry. Labour shortage resulted often in improper weeding and birdscaring on thesometimes large farmers' fields, while enough attention was paid to the small trial plots.
Table 10. Trial and farmer yields (kg/ha) and discrepancy in Southern Region
26
SITE K3 K5 K6,
K7 K9 K10 K11
farmer 180 220 260 220 100 160 600
control 210 270 460 170 660 460 1290
% + 17 % + 23 % + 77 % - 23 % + 625 % + 188 % + 115 %

3.4 Gross margin analysis
It is difficult to obtain a clear picture of the use of all available household labour. In someinstances a competition between arable farming and other (income generating) activitieswas observed, like livestock rearing and building. Unless known what the financial returnsof rainfed cropping are, nothing can be said about its feasibility.
The financial evaluation of the successful trials has been done through a gross marginanalysis, which compared input costs with the value of the produce. On the cost side ofthe equation, the cost of seed and fertilizer was taken into account. It can be debated,whether farm labour for land preparations, weeding and birdscaring should be included inthe gross margin analysis. Initially farm labour was excluded from the calculations. Theeffect of Drought Relief Subsidies for ploughing and row planting on the gross margin hasbeen compared; see Table 11 for the parameters of the gross margin analysis per region.
Table 11. Costs, prices and subsidies used in the gross margin analysis
SSP - single superphosphateDRS - drought relief subsidy
The results of the gross margin analysis are shown in Table 12. If no farm labour is takeninto consideration in the analysis, the 10 successful control plots of the dryland trialsachieved a positive gross margin varying from Pula 58-474/ha without and from Pula 228-644/ha including drought relief subsidies. If Pula 150/ha for farm labour was accountedfor, 3 out of the 10 control plots would have resulted in a negative gross margin.
When the fertilizer costs are written off in one year and no farm labour is considered, 1out of the 12 fertilized dryland plots would have had a slightly negative gross margin. Theother 11 obtained a positive gross margin, varying from Pula 9-265/ha without, to Pula1 79-435/ha with drought relief subsidies. Assuming Pula 150/ha is included for farmlabour, 9 out of the 12 fertilized plots would have had a negative gross margin.
A factor complicating the comparison of crop performance is the risk of crop failure, whichshould be studied over a range of years. From the scheduled trials for the 1 994/9 5cropping season 67 % failed (see also section 3.1). The costs and efforts put into thesefailed trials have not been returned. On the fertilized trial plots a residual effect might stillbe seen the next two seasons.
If the cost of fertilizer is divided over three years in order to simulate the residual effect,the gross margins of the 12 successful fertilized plots would be all positive, varying fromP75-341/ha without, to P245-511/ha including drought relief subsidies.
27
Costs, prices and subsidies KANYE,
N1AUN/KASANE SEROWE,
seed P/kg 2.50 2.50 2.50
SSP. P/50 kg3:2:1 P/50 kg
27.50 28.5534.95
28.55
labour P/ha 150.00 150.00 150.00
BAMB producer price '94/95 P/kg 0.34 0.45 0.38
DRS - ploughing P/ha- row planting P/ha
120.0050.00
120.0050.00
120.0050.00

Table 12. Gross margins in pula/ha
GM - gross margin DRS - drought re ief subsidyGM - SSP/3, gross margin assuming a residual effect of 3 year, dividing fertilizer costs by 3 (without/with DRS)molapo farming
It is considered, that a difference of 20 % or more in gross margin between the controland fertilized plots is significant. When comparing the 9 trials with both successful controland fertilized plots (see columns 2 and 4 of Table 11), the use of fertilizer written off inone season would pay off in 22 % of the cases. In another 22 % no considerabledifference is obtained and in 56 % of the cases the use of fertilizer is not profitable.
lf, however, the cost of fertilizer is spread over three years (the residual effect), in 56 %of the trials the fertilized plot has a significantly better gross margin than the control plot.In 22 % no significant difference is achieved and in the remaining 22 % the fertilizer wasnot lucrative.
At the molapo farming trial in Mabele (C9) two types of fertilizer were tested. The grossmargins of the single superphosphate plot have been included in Table 12. The grossmargins for the plot treated with 3:2:1 compound NPK fertilizer turned out approximately10 % lower: Pula 993/ha without and Pula 1163/ha with drought relief subsidies. If thefertilizer costs are spread over 3 years, the gross margins are Pula 1086/ha excluding andPula 1256/ha including drought relief. The use of the compound fertilizer did not prove tobe more successful than the use of single superphosphate. The yield of the former wasslightly lower (not significantly) and the costs slightly higher, resulting in a somewhatlower gross margin.
28
CODE CONTROL FERTILIZED (single superphosphate)
GM GM + DRS ' GM GM + DRS GM - SSP/3 GM - SSP/3 + DRS
C9 795 965 1122 1292 1198 1368
K3 72 242 19 189 75 245
K5 91 261 147 317 222 392
K6 158 328 178 348 289 459
K7 58 228 9 179 83 253
K8 failed failed - 3 167 108 278
K9 226 396 62 232 174 344
K10 158 328 103 273 233 403
K11 474 644 92 262 203 373
M2 failed failed 108 278 212 382
M8 251 421 failed failed failed failed
S2 265 435 145 315 232 402
S3 253 423 265 435 341 511
S4 failed failed 139 309 215 385

4 EVALUATION OF TRIALS
4.1 Lessons learned fronn farmers' point of view
Based on observations discussed in section 2.3 some general constraints met by groupsof trial farmers can be listed:
poor preparation for cropping seasonlabour shortages, especially in female headed householdsdependence on tractors for ploughing, making operations not flexibleproblems with plantersnot conducting of thinning operation (tradition or labour problem)negligence in fence maintenance, causing damage by livestock
From the management observations, the draught power argument (animals too weak toplough after the first rains) can be refuted. Most of the trial farmers managed to ploughand plant the trial plots within six days after the first planting rainfall event. In thebeginning of the season, draught animals are only used during the morning. They canrecuperate in the afternoon. In some cases draught animals are already used for ploughingof molapo fields as early as September.
Taking account of the large amount of manhrs/ha spent on fertilizing, ploughing, harrowingand planting, future trial plots should be reduced in size. To achieve timely completion ofoperations, instead of the 1/4 hectare plots, 1/8 hectare plots should be used. However,the 1/4 hectare plots showed clearly what the farmers' main constraints were.
Specific problems, based on confusion, inexperience or local traditions were the following:
wrong fertilizer dosage givenmixture of distributed seeds and local varieties usedother occupations more important than arable farmingfirst planting rain in Chobe Enclave used for loosening up of topsoil; secondconsiderable shower used for ploughing/planting; farmers consider season as failed,if no shower of 50 mm or more has fallen by the end of December
On initiative of the CPO and the DAO in Ngwaketse North a Farm Walk was organized onthe Polokwe trial site (K5) in April. Around 40 farmers mainly from the Moshupa Southextension area turned up. Although most of the innovations tested during the on-farm trialswere known, it appeared very motivating to the farmers participating in the walk, to seethe results with their own eyes and discuss with the farmer responsible for the site. Asimilar positive response was received from the participants to the Farmers' Day, held inMay on the same trial site. Approximately 100 people from all extension areas in theNgwaketse North District attended the event.
The ALUP team in Kanye conducted end-of-season interviews with those eight farmers,who participated in the trials and obtained a harvest. The following section is based on thefarmers' impressions of the trials. Five of the eight respondents were of the opinion, thatthe sorghum Segaolane had yielded poorly this past season, mainly due to the late startof the rains and the consequently late planting date in combination with the low rainfallamounts received. In addition wind erosion, bird damage, rodent and aphid attacks werementioned as hazards, that influenced the crop yield. Three of the eight interviewed
29

farmers considered the yield as medium high.
The farmer at Lotlhakane West (K3) blamed the two dry spells, which occurred at thebeginning and at the end of the vegetative stage for the moderate yield. Most farmersmentioned insufficient labour for proper weeding and birdscaring on their own fields as acause for partial failure. Fields of upto 15 ha were ploughed and planted with sorghum.The trial plots were generally given priority, when it came to conducting timely and propercrop husbandry activities.
When asked, which management operation was the most difficult to perform well, sevenout of the eight farmers answered: bird (and baboon) scaring. It is the most timeconsuming activity, because it requires a continuous presence in the field during daytime,from dawn to dusk. One farmer at Mmathethe (K7) did not consider birdscaring as thatcomplicated. He had made a device, consisting of strings with cans filled with pebblesaround the sides of his field, which would rattle when the strings were pulled. As damagedue to birds was very limited on most trial sites, credit should be given to the farmers'efforts.
In response to the question, which management operation conducted for the trials wasconsidered the most important to obtain a good yield, the farmers in Polokvve (K5) andSese (K9) mentioned proper weeding. In Polokwe, weeding with a cultivator had virtuallyeliminated all weeds on the plots.
The farmer in Lotlhakane West (K3) stated that no results of improved managementoperations could be noticed the past season, due to the insufficient rainfall. His fieldreceived 76 % of the average rainfall amount and suffered from two dry spells.
The farmers were finally asked, if they would adopt any of the improved managementoperations in their production system next year. All eight declared that they would try tofertilize (a part of) their own field, as they has appreciated the yield increase on thefertilized plots. Six farmers intend to buy inorganic fertilizer and two would use kraalmanure, as they could probably not afford the purchase single superphosphate. The othermanagement operations (row planting, weeding and birdscaring) were all carried out on thefarmers' own fields as well as on the trial plots the past season. Either a labour shortageor too high a hectarage under cultivation must have caused inefficient crop husbandry onthe farmers' fields and most farmers have the intention to improve this situation nextseason.
4.2 Lessons learned from supervision's point of view
From all 43 scheduled on-farm trials, 21 % failed due to poor supervision and 35 % dueto unfortunate farmers' decisions. The latter group could maybe have been reduced bymore extension and discussions with the concerned farmers. In future, the high failure ratecan perhaps be limited with help of the following reflections.
The main constraint in the execution of the trial program was a lack of logistical support.For proper farmer preparation and monitoring each trial region should have been providedwith a motivated and well qualified Technical Officer with a vehicle and driver at his/herdisposal. The past season this situation was created in Kanye and Maun. From these twostations the most detailed observations were collected. To prevent mistakes and to be able
30
to act swiftly, when necessary, two visits of each trial site per week are an absoluteminimum.
On several occasions fertilizing did not take place according to the specifications, plantingwas done when topsoil moisture was too low, or where the distributed seed was mixedwith local varieties, or fertilized and control plant heads were not separated at harvest. Thefinal results of these sites could not be compared to properly conducted trials and this typeof failure is basically due to insufficient supervision.
Although some flexibility should be allowed, depending on local conditions, it should betried to follow one method for the measurement of plant densities, weed cover andharvesting and yield calculation and presentation for all trial sites in the program.
In the Chobe Enclave the choice of crop was left to the farmers. Almost all opted formaize, which failed on all dryland trials. In order to use a more drought resistant crop andto facilitate countrywide comparison of results, it is advisable to use sorghum in the ChobeEnclave in future trials.
The Kasane ALUP team felt, that too much time was spent in travelling to and from trialsites for a relatively short time of observations. Their suggestion was to reduce the numberof participating farmers, and increase the number of plots and experiments per farmer.
The Preparation and Monitoring Protocols (Appendix I and II) served their purpose of to-dolists well. The Checklist (see Appendix III) to record trial and farmers' activities was founda bit too elaborate and time consuming to fill out at each visit to a trial site. This despitethe fact, that the lessons learned from the comparison of the farmers' performance on thetrial sites and on their own field were very valuable. Experience has proven, that the moretime spent on data collection, the more conclusions could be drawn concerning farmers'constraints. Unfortunately, the collected agronomic data (concerning timing of the differentcrop growth stages) are rather poor. There is no factual basis to give recommendations forthe validation of CYSLAMB in that respect.
The scheduled farm walks (two at each trial sites) were a bit too ambitious. In the firstplace, a farm walk should offer the farmers new developments, secondly budgets shouldbe available to organize meals for the participants and thirdly the logistics should be inplace for the organization of the events (e.g. transport of farmers). As not all conditionscould be met in many trial sites this season, more effort should be made in future toconvey trial results first hand to neighbouring farmers' households. Certainly one farm walkat each successful trial site should be scheduled and could perhaps be combined with afield day or farm walk organized in the same Extension Area by the AD or the CPO.
The post-season interviews as conducted in the Southern Region should be standardizedand carried out at all trial sites in future.
31

5 CONCLUSIONS & RECOMMENDATIONS
The concluding remarks presented here must be appreciated in the framework within,which they were achieved. Firstly they are based on the results of only one trial season.Secondly, that season was generally characterized by poor to moderate rainfall, both interms of quantity and in distribution over the season. The intention of this chapter is toshare the experiences obtained and to formulate suggestions for possible (regional) setsof extension recommendations for the improvement of the rainfed arable crop productionin Botswana.
Land preparations
From the observations in Kanye and Maun it appears, that a lot of time is spent on theoperations fertilizing, ploughing, harrowing and planting: 107 and 109.4 manhrs/harespectively. Converted in working days of six hours, this corresponds for two people to7.8 and 6.3 days/ha. When too much time is spent on the land preparations, the topsoilmoisture decreases and consequently a poor germination results or the plantingopportunity is missed altogether. Timeliness of operations is crucial and the most optimalways should be found to make use of the available soil moisture as soon after the rainfallevent as possible. Several alternatives can be thought of:
better preparation of implements and draught animals before the cropping seasonthe use of two spans of draught animals, in order to be able to alternate them andto carry out operations in the morning and in the late afternoona reduction of the time used for land preparations through the use of (small)mechanized draught powerconcentration on a small hectarage per planting opportunityspreading of operations
At each planting opportunity, farmers should concentrate on a small area; for the timebeing 0.5 ha seems to be a portion of land, that can well be managed with draught animalswithin 3-4 days. In future a relationship should be established between the amount andthe timing of rainfall, potential evapotranspiration and soil moisture, and the correspondingmaximum hectarage to plough and plant per agro-ecological region.
Especially on sandy soils a spreading of the land preparation operations could be carriedout. In the North Western Region, certainly around Maun, CYSLAMB identifies the firstplanting opportunity in NOV3 or DEC1 in approximately 80 % of the years. Operations asfertilizing and ploughing can be started from NOV2 onwards. Immediately after the firstplanting opportunity fields can be harrowed, followed by planting, thus gaining valuabletime and creating optimal conditions for germination and plant establishment.
The option of dry "ploughing/planting" on sandy soils brings all operations forward,including planting, and creates more flexibility to the farmer. This method of ploughing andplanting before the first planting rain is practiced all over the country, but at a very limitedscale. By ploughing, possible weeds should die and do not re-emerge during the dry periodbefore the first planting rain. If seeds are planted evenly at approximately 10 cm below thesurface, they should withstand the high topsoil temperatures and germinate after the firstrainfall event of at least 20 mm. Planting done from NOV2 onwards, will provide the seedsoptimal advantage of the rain of the first planting opportunity of the season. Planting tooearly (before NOV2) might lead to crop failure due to a lack of soil moisture.
32
In any case, farmers should try to utilize the first planting opportunity of the season,normally occurring in NOV3 or in December. Germination and early vegetative stage shouldthen take place in December, providing the plants with the best protection against dryspells in January and February, and hence creating the highest chance for good survivalrates and reasonable yields.
It is recommended, that more research should be done on the functioning of row planters,in order to minimize the occurrence of uneven plant stands.
Crop development
Although the trials aimed for plant densities of 15,000 plants/ha around Maun and 50,000plants/ha in the other regions, considerably lower plant densities were achieved. The usedseeding rates conformed to the recommendations of the Department of AgriculturalResearch. However, low germination rates were observed, due to various reasons (seesection 2.3 Planting and seed rates).
In general, it is recommended to keep plant densities low (possibly 10,000-30,000plants/ha). Even in below average rainfall years, plants in a small population will have thechance to develop properly and produce large heads and consequently a high grain weightper head or per plant. It is imperative to strive for a homogeneous plant stand. An evenrow spacing and in-row plant spacing will reduce competition for available soil moisture.Accurateness in planting, and where necessary a thinning operation, should be carried out.Even to achieve low plant densities, enough seed should be used to compensate for lossesduring planting and germination. The 10 kg seed pockets/ha, distributed under the droughtrelief scheme, seem too much, but must be based on similar experiences.
It was observed, that plants from the plots with the highest plant densities, developed thelowest number of tillers. For the control plots the grain weight from harvested headsdecreased with increasing plant populations. An extreme example occurred on trial siteXhane (M2), where a plant density of only 1700 plants/ha was achieved, and a mean of3-6 tillers developed per plant, yielding on average 78 g/head.
All trials that yielded well ( > 450 kg/ha, corresponding to 6.5 (70kg) bags), received aminimum amount of 20 mm of rain during the establishment phase of the crop. This tenday period just after germination, seems to be crucial for the crop development. Whenestablished well, the small plants are more resistant to possible dry spells.
A simple classification of first dry spells of the season was made (see section 2.2). Theanalysis made was too superficial to advise the best time of planting for the limitation ofcrop damage or failure due to dry spells. Dry spells can not be avoided, as they areinherent to agro-ecological conditions in Botswana. Farmers can only try to minimize theimpact of dry spells on their crop yield by a good preparation, swift action andconcentration on small areas per planting opportunity. After characterization of the firstdry spell, a prediction could perhaps be made concerning the final crop performance,indicating which crop management operations are still advisable.
Considering the low to average rainfall received during the trial season, the use of singlesuperphosphate fertilizer was rather successful. From the nine trial sites, where bothcontrol and fertilized plots reached harvest stage, in six instances the fertilized plot yieldedhigher than the control. The average yield increase due to fertilizer use was 97 %, ranging
33

from 43-181 %. In two cases the fertilized and the control yield did not significantly differ;the fertilized yield was 2 % and 4 % higher respectively. At one trial, however, the controlplot yielded 41 % higher than the fertilized. To investigate the financial viability of the usedproduction systems, a gross margin analysis was carried out. When assuming a differencein gross margin of 20 % as significant, fertilizer use would be attractive in 22 % of thecases, when paid off in one year. In another 22 % no financial difference is achieved andin 56 % fertilizer is not profitable. If,, however, the cost of fertilizer is spread over threeyears (assuming a residual effect), in 56 % of the trials the fertilized plot has a significantlybetter gross margin than the control plot. In 22 % no significant difference is achieved andin the remaining 22 % the fertilizer did not pay off.
For proper plant development, effective and timely weeding and bird scaring are highlyrecommended. Weeding with a cultivator proved to be successful, as in some instancesdelayed weeding to protect seedlings against wind erosion seemed important. Extensionefforts should be increased concerning the explanation of the relationship between fertilizerand increased weed growth. More attention should be given to the development of birdscaring techniques (like at the Mmathethe trial, K7) in order to alleviate this important taskfor farmers.
After swift action, spraying by the Plant Protection Division against several insects hasproven to be effective. It is recommended, that farmers contact this Division as soon aspest or diseases have been observed. On the other hand, insecticides and pesticides shouldbe made more widely available to the farming community through government or privateoutlets, so that timely action can be undertaken by farmers themselves and the relianceon government officers can be decreased.
As traditionally grain yields in Botswana are low, it can be recommended to harvest"mothalane" heads, which in the Southern Region formed up to 7.2 `)/0 of the yield.
The yields achieved on the successful control plots in the Southern Region are in 6 out ofthe 7 cases higher than the yields of the farmers' fields. The positive differences vary from17-625 %. The main reasons for the better performance of the trial plots must be soughtin better crop husbandry. Labour shortage resulted often in improper weeding andbirdscaring on the sometimes large farmers' fields, while enough attention was paid to thesmall trial plots.
For a more sound correlation of trial yields and CYSLAMB predictions, it is imperative tohave proper soil analysis results. An effort should be made to achieve a higher degree ofreliability in soil laboratory output in Botswana.
Despite the poor to moderate rainfall season and the high amount of crop failure and notrealized trials, certainly in the Southern Region the main objective of the trials (to showfarmers the scope for improvement) has been met. The recommendations as generated byCYSLAMB regarding timing of operations and the use of fertilizer can be adopted bymotivated and meticulous farmers. Not all the obtained yield figures can be used for thevalidation of the program, due to the impact of not modeled factors on the yield. The trialsdefinitely provided more insight in rainfed cropping in general and in individual managementoperations in particular. Future trials are recommended, especially to collect data undermore favorable rainfall conditions. Future trials may bridge gaps between farmers on theone hand and researchers and policy makers on the other, in order to jointly increaseoutputs of the arable crop production sector in Botswana.
34

APPENDIX I PREPARATION PROTOCOL
ON-FARM CROP TRIALS - SEASON 1994/1995
PREPARATION PROTOCOL
Consultation of concerned officers in Extension and Research (RAO, DAO, DAS, AD, CPO, RARO andothers)
Selection of farmers in cooperation with ADcriteria: - access to draught power, implements and labour
- prepared to experiment- representative
Selection of trial sitescriteria: - 1/2 hectare sites
- plots for fertilized and control on similar positions(altitude, slope and soil types)
Check, if applicable, the condition of the fence of the field and encourage farmer to take appropriateaction, where necessary
Verify cultivation history of the trial sites (crops grovvn, rotation, fertilizer use)
Take soil samples of the top 25 cm for routine analyses (including pH, N, P,
Run CYSLAMB with following parameters set: - rainfall 20 mm or- soil moisture 20 mm- phosphorus rate as analyzed- phosphorus rate of 10 ppm
in order to simulate: - optimal planting date- optimal plant density- optimal time of weeding (30-50 days after planting)
Calculation of phosphorus application rate for fertilized plots.Use Single Superphosphate (SSP) fertilizer and raise initial phosphorus level to 10 ppm.Use following table and formula to calculate the amount of fertilizer required:
bulk densities (in gm/cc): Arenosol 1.50 - 1.55Luvisol ferric 1.50 - 1.65
light 1.45 - 1.55heavy 1,40 - 1.50
Calcisol 1.55 - 1.70Vertisol 1.00 - 1.30Gleysol 1.10
formula: kg P needed = 2.5 x 10⁶ x bulk density x portion of hectare / 106kg single superphosphate needed = kg P needed x 100/10.5 to raise the phosphorus levelof the topsoil of the trial plot with 1 ppm
(N.B. for topsoil is taken 2.5 dm, 106 is surface of 1 ha in dm2, portion of hectare is the surface ofthe fertilized plot, P content of single superphosphate is 10.5 %)
For Arenosols and Luvisols an application of 35 kg SSP corresponds with 1 ppm increase in P level.
Set out trial plots: - two 1/4 hectare plots, preferably 50x50 m per siteone plot fertilized, one control
- mark corners with (white) pegs
Install a rain gauge close to the trial site and instruct AD/farmer/TO how to record
35

Distribute seeds and fertilizer to participating ADs
Collect and prepare draught animals
Inspect, prepare, organize implements: plough, chains, harnesses, planter, harrow, cultivator
Organize access to threshing machine and scale
Identify the planting opportunity after 20 mm of effective rainfall in a given decade.
N.B.: Daily falls greater than the potential evapotranspiration (PET) are considered effective andsummed. As soon as the total effective rainfall in a dekad exceeds 20 mm, planting can take place.Farmers should be informed and mobilized ! The average dekadal PET values can be retrievedfrom the synoptic station databases in CYSLAMB.
Broadcasting of fertilizer by the farmer under supervision
Ploughing and harrowing (uf required)
Planting in rows, as closely to the required optimal plant density as possible
36

APPENDIX II MONITORING PROTOCOL
ON-FARM CROP TRIALS - SEASON 1994/1995
MONITORING PROTOCOL
Recording of rainfall as soon as rain gauge has been installed
Make a sketch map of the trial sites depicting topography, possible soil differences, number of rowsand location of fertilized and control plots for observations on crop performance
Make a rough estimate of the plant density and do observations on the homogeneity of the crop stand(show possible irregularities on the sketch map), 4 vveeks after planting
Mind replanting/gap filling by farmers; if signaled try to eradicate plants and/or map concerned spots
Estimate the weed coverage (% ground cover) just before weeding
Conduct a thinning operation, to reach the optimal plant density, concurrently with a first weedingoperation at the optimal time of weeding (simulated with CYSLAMB)
Estimate the exact plant density, three weeks after the first weeding operation, by counting thenumber of plants in randomly chosen, 2m long sections of 10 rows
Estimate the weed coverage (% ground cover) three weeks after the first weedingoperation
Make observations of: - infestation of pest/diseases, including rate of affected plants- nutrient deficiencies- dry spells, flooding/ponding water, hail/night frost (number of days)
Contact Plant Protection Unit and spray appropriate chemical, when more than 20-30% of plantsaffected by pest/decease
Organize possibly two farm walks; one 4-5 weeks and one 14-15 weeks after planting. All farmersfrom the extension area, where the trial is taking place, should be invited.
Conduct a second weeding operation, if considered necessary, 4-5 weeks after the first weedingoperation
Organize bird scaring activities for approximately 4 weeks during week 11-15 after planting
Harvest after 120 days all cobs/heads of plants in randomly chosen, 2m long sections of 10 rows.Count total number of plants and cobs/heads harvested and observe cob/head quality and grain filling.
When maize, dry at ADs office for 2-3 weeks
Threshing
Weighing and yield calculation
Comparison of achieved yield with CYSLAMB results, using actual (field) plant density
37

APPENDIX III CHECKLIST
38

1. Make a sketch map of field- Show location of .t.:,:rJ1 plots in field
mention landmarks to identify location of plots (dince from identifiahl,:.
fenceposts
to
corners,
etc).
Iwi:cat'e
which
plG
tis
fertilized,
direction of North. Show which ,iirectn rows arh
2,
Show "high" and "low" areas in tield and diffen
in soiltype (sandy
loamy, etc) on the map.
COMMENTS:
1NSrRUCTIONS: The following observatios
Hul
.dbe done at visits to trials:
EVERY VISIT: I) Check rainfall records,
ir
hat falmer is d.
:::Trec-
recording and figures are r.e'
hIe and
into:
RAINTALL SHEET (p3)
2) Record management opere,
sf
LABOUR CALFD
(p,7)
DRAUGHT PUNIR CALENDAR (p,
11)
use of INPUTS (p.12)
an,1 CI-OP OBSERVATIONS (p.13)
Make cor:lents about quality of work, special problems expressed
3. Make a rough estimate of plant density of crop JUST BEFORE WEEDING and
by farmer,
farmers opinion about trials,
,..omparison with own
show possible uneven density on sketch map (do 4
2m sections in each plot,
crop, etc., in the section "comments" at
k.::ttom of relevant
see page 5 for instructions).
pages.
In case of any attacks by pests and diseases: fill in CROP
OBSERVATIONS
(p.13)
and advice supervisor
immediatelly,
so
proper action may be taken.
Estirate
if
farmer
needs
assistance
for
weeding
and
birdscaring.
AT APPROXIMATELLY 30 DAYS AFTER PLANTING:
Measure percentage ground cover by weeds, record in WEED
COVER (1)
(p.4).
Estimate plant density, indicate on sketch map (p.2) and
determine if thinning is required to achieve optimal plant
density.
AT 50 DAYS AFTER PLANTING:
Measure plant density, record in PLANT DENSITY (p.5)
AT 60 DAYS AFTER PLANTING:
Measure percentage ground cover by weeds, record in WEED
COVER
(2)
(p.6).
Estimate
if
second weeding operation
is
necessary.
Note
if
this might conflict with other work by
farmer.
AT 90 DAIS AFTER PLANTING:
Take soil sample from both plots. Samples should be taken
FROM PLANT ROWS.
AT APPROXIMATELLY 120 DAYS
10) Measure yiel3
!m plots and record in
AESSMLN'i
(p.15 and 16).
SITE:
DATE:
FARMERS NAME:
TRIAL PLOT SIZES:
HA
P-CONTENT IN SOIL:
PPM
FERTILIZER TYPE:
FERTILIZER/HA:
KG/HA
FERTILIZER AMOUNT USED:
KG
NUMBER OF ROWS:
FERTILIZED PLOT/
NON-FERTILIZED PLOT
INSTRUCTIONS:

2 22
2 24
25
26
27
2 29
30
TOTAL
RA
INFA
LL
SH
EE
T
SITE:
INSTRUCTIONS: If farmer keeps rainfall records: transfer data from his/her
record to rainfall sheet, after assesing if it is correct. If you do reading:
enter figure. If no data available: contact nearest AD and obtain figure.
11.1
1111
1111
1111
1111
1111
1111
1111
1111
1111
1111
1111
MM
IN
imill
1111
1111
1111
1M11
1111
1111
1111
1111
1111
1111
1111
1111
0111
1111
1111
11=
1111
1111
1111
1111
1=11
1111
1111
101
1111
1=11
1111
1111
1111
1111
1111
1111
1111
1111
1111
1111
1111
1111
1111
1111
1111
1111
M11
1111
1111
1111
=11
1=11
1111
1111
1111
1111
1
1111
1111
1=11
=11
1111
1111
1111
1111
1111
1111
11M
1111
1111
1=1
1111
1111
1111
1111
1111
1111
1111
1111
1111
1011
1111
1111
1111
1111
1111
EIN
1111
1111
1111
1111
1111
1111
1111
1111
1111
1111
1111
=11
1111
11E
1111
111
M11
1111
1111
1111
0111
1=11
1111
1111
1111
1111
1111
1111
1111
1111
1011
1111
1111
1111
1111
1111
1111
1111
1111
1111
11=
1111
1111
1111
1111
1101
M11
1111
1111
1111
1111
1111
1111
11=
1111
1111
1111
1111
1111
1111
1111
1110
1M
IIIIII
IIIN
IIIIIM
1111
1111
1111
1111
1111
1111
1111
1111
1111
1111
1111
111
1111
1111
1111
1111
1111
1111
1111
1111
1111
1111
1=11
1111
1111
1111
1111
1111
1111
1111
1111
1=M
1111
1111
1111
1111
111=
1111
1111
11E
1111
11N
INN
IIIIII
NIE
N11
1111
1111
1111
1111
1111
1111
1111
1111
1111
1=11
1111
1111
1111
1111
1111
1111
1110
1111
1111
1111
1111
1111
1111
1111
1111
1111
1111
1111
1101
1111
1111
1111
1111
1111
1111
1111
1111
1111
111
1111
1111
1111
1111
1111
1111
1111
1111
1111
1111
1111
1111
1111
1111
1111
1111
1111
1111
1111
1111
1111
1111
11=
1111
=11
1111
1111
1111
111
1111
1111
1111
1111
1111
1110
1111
1111
1111
1111
11=
1111
1111
1111
1111
1111
1111
1111
1111
1111
1111
1111
1111
1111
1111
1111
1111
1111
111
M11
1111
1111
1111
1111
1111
1111
1111
1111
1111
1111
1111
1111
1111
111
1111
11=
1111
1111
1111
1111
0111
1111
11=
1111
1111
1111
1111
1111
1111
111=
1111
1111
1111
1111
1111
1111
1111
1=M
1111
1111
1111
111
1111
1111
1111
=11
1111
1111
1111
1011
1111
1111
1111
1111
0111
1111
1111
1111
1111
1111
1111
1.11
1111
1111
1111
1111
1111
1111
1111
1111
1111
11
10
20
DATE
OCT
NOV
DEC
JAN
FEB
MAR
APR
MAY
WE
ED
CO
VE
R (
1)
SITE:
INSTRUCTION: Estimate percentage weed cover using 10 quadrats JUST BEFORE
WEEDING
(Approx.
30
days after planting).
Use the
following method to
identify the rows to sample: Count the total number of rows in a plot, divide
by three, and sample each row representing a third of the width (eg. in case
of 66 rows, sample between row number 22 and 23 from both borders (66/3=22).
Sample distance:
- 19 m in case of 100 m long plots and 9 m in case
of 50 m long plots
Place first quadrat:
- 4.5 m from the end.
DATE:
Quadrat number
2 3 4 5 6 7 8 9 10 Percentage ground
cover (mean)
Percentage groundcover by weeds in quadrat
Fertilized plot
Non-fertilized plot
2)
If weed cover is very uneven in plots,
make sketch of
different areas (indícate average weed cover in each area in %)
2) SKETCH OF PLOTS WITH AREAS OF DIFFERENT % WEED COVER
CunTs: (any dominant weeds, very noxious weeds....):

SITE:
DATE:
INSTRUCTIONS: Count the number of live plants in 10 sections each measuring
2m in each plot
TH
RE
E W
EE
KS
AFT
ER
WE
ED
ING
.Count the number of plants in 5
2m long sections in two rows and record below. Use the following method to
identify the rows to sample: Count the total number of rows in a plot, divide
by three, and sample each row representing a third of the width (eg. in case
of 66 rows, sample on row number 22 from both borders (66/3=22).
Sample first 2111 section:
-4 m from the end.
Section number
2 4 5 6 7 9 10
Total no. of plants
Plot length
Plot width
Rows sampled (eg.
number 22 and 44)
No. of rows
Plant density (mean)
Number of plants in section
Fertilized plot
Non-fertilized plot
70MMENTS (evenness of plant density, reasons, etc):
SITE:
DATE:
INSTRUCTION: Estimate percentage weed cover using 10 quadrats 4
WE
EK
S A
FTE
RW
EE
DIN
G(Approx.
60 days after planting).
Use the
following method to
identify the rows to sample: Count the total number of rows in a plot, divide
by three, and sample each row representing a third of the width (eg. in case
of 66 rows, sample between row number 22 and 23 from both borders (66/3=22).
Sample distance:
- 19 m in case of 100 m long plots and 9 m in case
of 50 m long plots
2)
If weed cover is very uneven in plots,
make sketch of
different areas (indicate average weed cover in each area in %)
2)
SKETCH OF PLOTS WITH AREAS OF DIFFERENT % WEED COVER
COMMENTS:
(any dominant weeds, very noxious weeds....):
Quadrat number
Percentage groundcover by weeds in quadrat
Fertilized plot
Non-fertilized plot
2 4 5 6 7 9 10 Percentage ground
cover (mean)
PLA
NT
DE
NSI
TY
WE
ED
CO
VE
R (
2)
Sample distance:
- 18 m in case of 100 m long plots and 8 m in case
of 50 m long plots
Place first quadrat:
- 4.5 m from the end.

1. T
RIA
L P
LO
TS
LAB
OU
R C
ALE
ND
AR
SIT
E:
CO
MM
EN
TS:
LAB
OU
R C
ALE
ND
AR
(co
ntin
ued)
2. F
IEL
D
CO
MM
EN
TS:
ACTIVITY
Period(s):
Area
Time spent on
Record dates
(ha)
activity. Record
in hours or half
or full days
L bour force used
Household
Hired
age no. e pen-
se
gen-
de
PLOUGHING11111111111111111111
FERTILIZING11
1111
.111
1111
1111
111
1111
1111
1111
1111
1111
1111
1111
1PLANTING
WT
1111
1111
11.1
1111
1111
1BIRDSCARINGM
aIl
l11
1111
1111
OTHER:
IIIIII
IIIIIM
IIIIII
IOTHER:
1111
1111
1111
1111
HARVESTINGIIM
IIIIII
IIIIII
MIII
IIIIII
I
ACTIVITY
Period(s):
Record dates
Area
(ha)
Time spent on
activity. Record
in hours or half
or full days
Labour force used
Household
Hired
name
age no. expen-
se
age gen-
der
P OUGHING
F RTILIZING
PLANTING
WEEDING
ethod:
BIRDSCARING
OTHER:
OTHER:
RSTING

EXAMPLE OF
SKETCH MAP OF FIELD SHOWING WHEN OPERATIONS TOOK PLACE
IN
DIFFERENT PARTS OF FIELD.
COMMENTS:
A0B
(,,,,
CA
LMO
R A
ntic
.,INSTRUCTIONS: Show on sketch map when
activities took place at different
areas of field (see example on
following page).
COMMENTS:
ield)
plough:1.11-3.11.94
planting:7.11.94
1
weeding:1.12.94
4
plough:
planting:
weeding:
other:
plough:2.1-7.1.95
planting:10.1.95
2
weeding:15.2.95
other:
plough:
planting:
weeding:
other:
_
plough:
planting:
weeding:
other:
trial
plots
plough:
planting:
weeding:
other:
6
Area 1:
Ha (approx.)
Crop:
Area 2:
Ha (approx.)
Crop:
Area 3:
Ha (approx.)
Crop:
Area 4:
Ha (approx.)
Crop:
Area 5:
Ha (approx.)
Crop:
Area 6:
Ha (approx.)
Crop:
Area 1:
2 Ha (approx.)
Crop:MAIZE
Area 2:
1 Ha (approx.)
Crop:MAIZE
Area 3:
1 Ha (approx.)
Crop:COWPEA
Area 4:
0.5 Ha (approx.)
Crop:SORGHUM
Area 5:
3 Ha (approx.)
Crop:SORGHUM
Area 6:
0.5 Ha (approx.)
Crop:SUNFLOWER
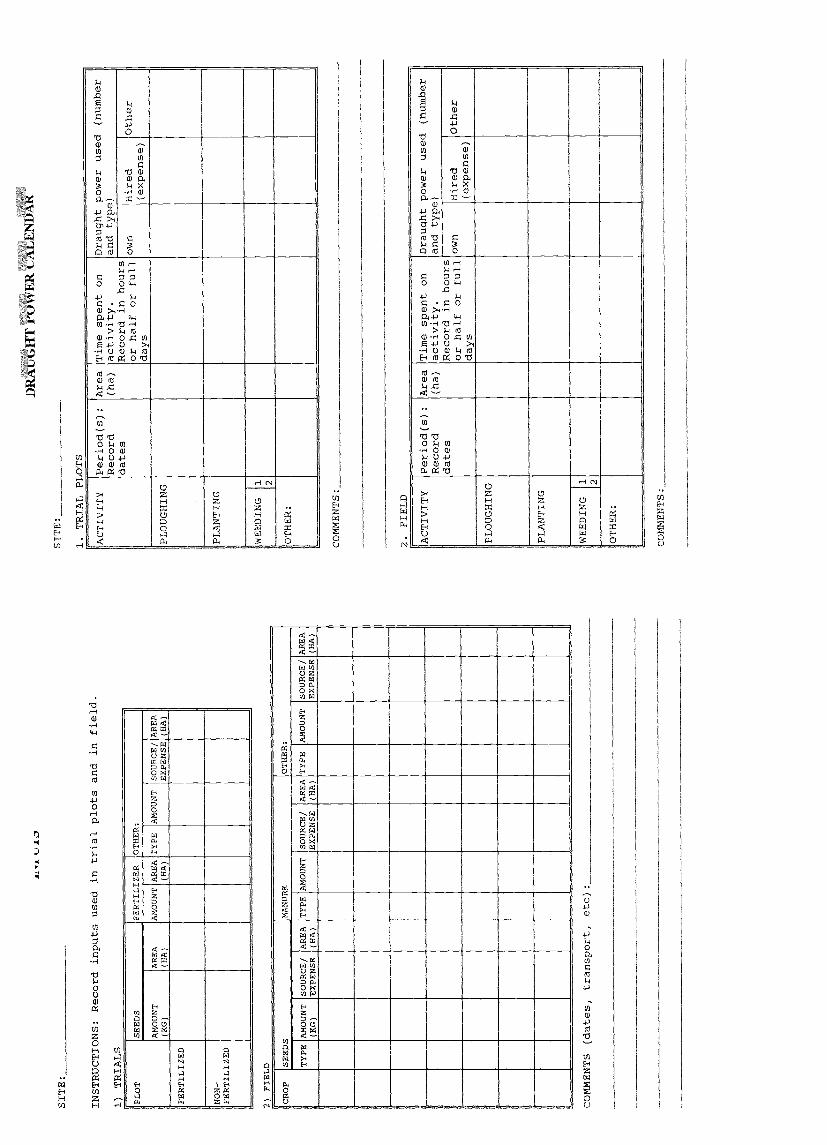
SITE:
INSTRUCTIONS: Record inputs used in trial plots and in field.
ITRIALS
2FIELD
COMMENTS (dates, transport, etc):
SITE:
OTS
.FIELD
DR
A u
kJ-
HT
vl'E
R uALENDAR
COMMENTS:
COMMENTS:
ACTIVITY
Period(s):
Record
dates
Area
(ha)
Time spent on
activity,
Record in hours
or half or full
days
Draught power used (number
and type)
own
Hired
(expense)
Other
PLOUGHING
PLANTING
WEEDING
I 2
OTHER:
P OT
S EDS
FERTILIZER
OTHER:
AMOUNT
(KG)
AREA
(HA)
AMOUNT AREA
(HA)
TYPE AMOUNT SOURCE/
EXPENSEAREA
(HA)
F RTILIZE
NON-
FERTILIZED
CROP
SEEDS
MANURE
OTHER:
TYPE AMOUNT
(KG)
SOURCE/
EXPENSE
AREA
(HA)
TYPE AMOUNT SOURCE/
EXPENSE
AREA
(HA)
TYPE AMOUNT SOURCE/
EXPENSEAREA
(HA)
ACTIVITY
Period(s):
Record
dates
Area
(ha)
Time spent on
activity,
Record in hours
or half or full
days
Draught power used (number
and type)
own
Hired
(expense)
Other
PLOUGHING
PLANTING
WEEDING
1 2
OTHER:
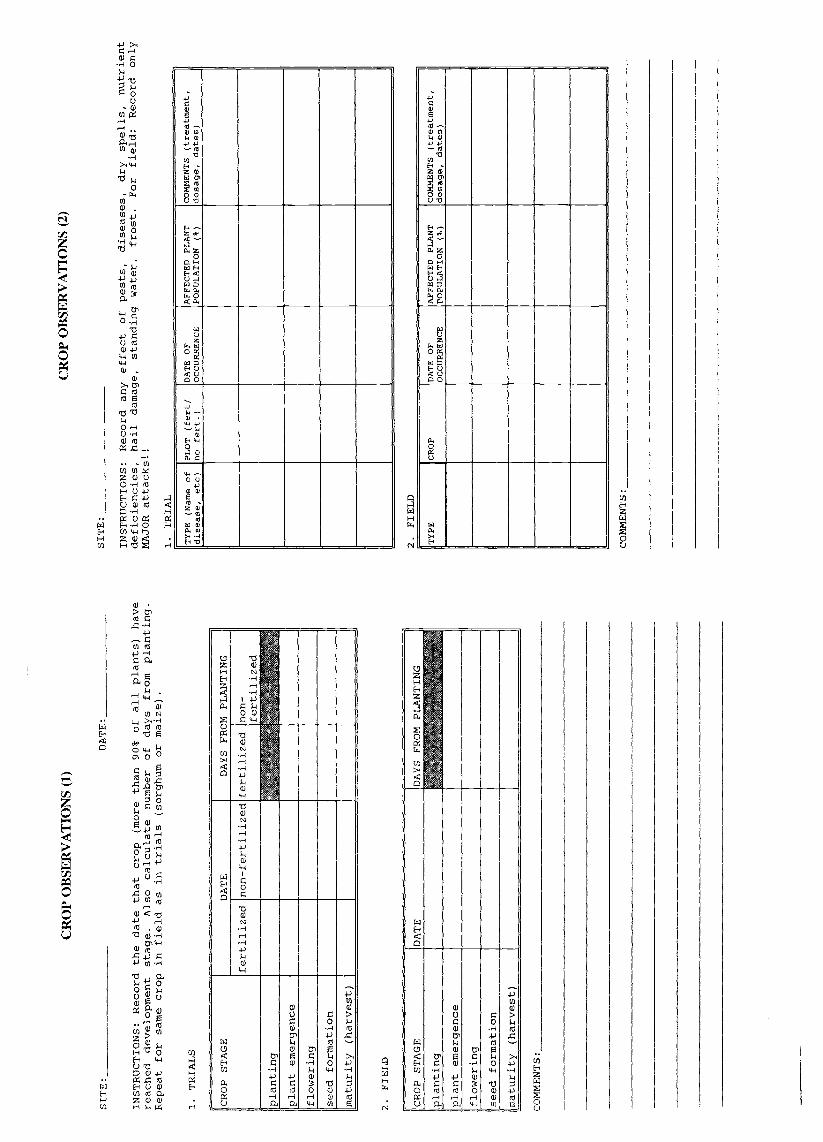
I. TRIALS
2. FIELD
COMMENTS:
2. FIELD
COMMENTS:
TYPE (Name of
disease, etc)
PLOT (fert/
no fert.)
DATE OF
OCCURRENCE
AFFECTED PLANT
POPULATION (%)
COMMENTS (treatment,
dosage, dates)
CROP STAGE
DATE
DAYS FROM PLANTING
ertilized non-fertilized fertilized non-
fertilized
p anting
p ant emerge ce
flowering
se d formation
maturity (harvest)
CROP STAGE
DATE
DAYS FROM PLANTING
planting
plant emergence
flowering
seed formation
maturity (harvest)
TYPE
CROP
DATE OF
OCCURRENCE
AFFECTED PLANT
POPULATION (%)
COMMENTS (treatment,
dosage, dates)
SITE:
DATE:
SITE:
INSTRUCTIONS: Record any effect of pests, diseases, dry spells, nutrient
INSTRUCTIONS: Record the date that crop (more than 90% of all plants) have
deficiencies, hail damage, standing water,
frost. For field: Record only
reached development stage. Also calculate number of days from planting.
MAJOR attacks!!
Repeat for same crop in field as in trials (sorghum or maize).
I. TRIAL
CR
OP
OB
SER
VA
TIO
NS
(I)
CR
OP
OB
SER
VA
TIO
NS
(2)

FERTILIZED PLOT
.NON-FERTILIZED PLOTHA
RV
EST
ASS
ESS
ME
NT
(co
ntin
ued)
HA
RV
EST
ASS
ESS
ME
NT
)KMENTS:
sITE:
HARVEST DATE:
THRESHING DATE:
INSTRUCTIONS: Select 10 quadrats for harvesting using same method as
for
plant density measurements. Repeat for both plots.
The harvest assessment includes recording: total number of main sorghum
plants (excluding tillers) alive within each quadrant, the number of these
plants which have produced grain (excluding tillers)
and average plant
height. Average plant height is for productive plants in the quadrats only
and is based on visual assessment of average height to main panicles.
All sorghum heads or signs of heads within the quadrant are counted. They
are recorded in the table on the next page as follows:
Ready for harvest: Heads which are present and ready for harvest
Immature heads: Heads which are still immature but which could still
be harvested later. Immature heads which will not reach maturity during
the season should be ignored.
Grazed/picked heads:
Heads which are missing and stalk or
panicle
showing signs of feeding by livestock or birds. Partially damaged heads
should be treated as heads Ready for harvest.
All heads that are ready for harvest are cut and put in a sack. Labeling
on sack should include sita, plot (fertilized/non-fertilized)
and date. Weigh
the sack empty and record weight. Weigh sack+heads and record weight. Leave
heads to dry, if needed, before threshing. Fill in table below with data.
When heads are at a threshing moisture, they should be threshed and
gra'
weighted. Follow the same procedure as with heads (weigh the sack empty a
record weight.
Weigh
sack+grain
and record weight).
Immediately
att
weighing the threshed grains, 2 samples should be sealed in moisture pro,
containers (if short transport distance: sealed plastic bags) and sent to tt
staff in charge of trials for moisture determination.
COMMENTS:
uadrant
0Sorghum plants
Sorghum heads
Total
plants
Productive
plants
Plant
height
Ready for
harvest
Immature
heads
Grazed/picked
heads
o-
tiadrant
7Sorghum plants
Sorghum heads
Total
plants
Productive
plants
Plant
height
Ready for
harvest
Immature
heads
Grazed/picked
heads
0
f
Yield estimate data
Fertilized plot
non-fertilized plot
Empty sack weight
Weight of sack + heads
harvested from 10
quadrats
Empty sack weight
Weight of sack + grain
harvested from 10
quadrats
Grain moisture (%)
-

APPENDIX IV TRIAL PROGRESS
The soil analysis results for the CEC, Ca, Mg, K and Na levels are expressed in the unit cmol + /kg. The pHresults for the Chobe, Francistown and Serowe trials are expressed as pH-CaCl2, while for the Kanye and Mauntrials the pH-H20 results are given.
NORTH WEST REGION / CHOBE
Trial sites:
Cl KachikauC2 KachikauC3 KavimbaC4 KavimbaC5 KavimbaC6 KavimbaC7 MabeleC8 MabeleC9 MabeleCl O Mabele
Kasan
c,d"6C9-C1 0
C1 'C3-C4-05-C2
CHOBE
47

48
TRIAL SITE CS Kavimba Cl Kachikau
SYNOPTIC STATION Kasane Kasane
RAINFALL STATION Kavímba Kachikau
yearly average 614 mm 532 mm
01 Dec 19
I
20
02 Dec 1.6 2
09 Dec 1.5
11 Dec 2.1 10
22 Dec 30
23 Dec 2
24 Dec 5
28 Dec 10
29 Dec 28 21
30 Dec 19
31 Dec 21 2
09 Jan 20.5
10 Jan 14
12 Jan 15
13 Jan 25.5 29
19 Jan 5
27 Jan 11
31 Jan 1
03 Feb
04 Feb 10 6
05 Feb 3
06 Feb
09 Feb 7
11 Feb 10
12 Feb 6
13 Feb 4
14 Feb 18.5 10
19 Feb 8
20 Feb
22 Feb 28.5 11
23 Feb 20 7
27 Mar 150.5 100
28 Mar 120
29 Mar 15
02 Apr 65 60
10 Apr
25 Apr 2
26 Apr 1
23 May 30
TOTAL 606.7 425
% of AVERAGE 99 % 80 %

Cl
KA
CH
IKA
U
plot
siz
e: 0
.25
haso
iltyp
e: L
uvi-S
tagn
ic P
haeo
zem
AW
HC
: unk
now
nfe
rtili
zer
type
1;
fert
ilize
r ty
pe 2
:
tops
oil a
naly
sis
cont
rol p
lot:
c op
:so
rghu
m S
egao
lane
resu
lt:T
rial f
aile
d,
Far
mer
fert
ilize
d pl
ots
in th
e de
kad
JAN
1/9
5 an
d pl
ough
ed th
e sa
me
deka
d w
ith h
is o
wn
donk
eys.
He
incu
rred
a d
elay
in p
lant
ing
(don
e in
dek
ad J
AN
2/95
), d
ue to
rep
air
of th
e ro
w p
lant
er. A
slig
htm
isun
ders
tand
ing
with
the
AD
cau
sed
the
dela
y in
rep
air.
Fin
ally
the
crop
did
not
est
ablis
h.
C2
KA
CH
1KA
U
plot
siz
e: 0
.25
haso
iltyp
e: S
odi-L
uvic
Cal
ciso
lA
WH
C: u
nkno
vvn
fert
ilize
r ty
pe 1
:fe
rtili
zer
type
2:
tops
oil a
naly
sis
cont
rol p
lot:
crop
:so
rghu
m S
egao
lane
resu
lt:T
rial f
aile
d.
The
plo
ts w
ere
fert
ilize
d in
the
deka
d JA
N 1
/95.
Far
mer
was
del
ayed
in p
loug
hing
/pla
ntin
g, b
ecau
se s
heha
d to
wai
t for
a h
ired
trac
tor
until
JA
N2/
95. G
erm
inat
ion
was
ver
y po
or. T
he tr
ial p
lots
wer
e lo
cate
d on
a so
dic
soil;
sal
t was
obs
erve
d on
the
surf
ace.
Mr
H. L
unge
raA
LDE
P m
odel
II
slop
e 0-
1°U
TM
pos
ition
: 231
067E
799
4856
N
Pho
spho
rus
cont
ent t
opso
il: 2
ppm
sing
le s
uper
phos
phat
eap
plic
atio
n ra
te: 2
00 k
g/ha
3:2:
1ap
plic
atio
n ra
te: 2
00 k
g/ha
Ms
A. M
otlh
oka
ALD
EP
mod
el I
slop
e: 0
-10
UT
M p
ositi
on: 2
3371
0E 7
9908
94N
Pho
spho
rus
cont
ent t
opso
il: 1
ppm
sing
le s
uper
phos
phat
eap
plic
atio
n ra
te: 2
00 k
g/ha
3:2:
1ap
plic
atio
n ra
te: 2
00 k
g/ha
C3
KA
VIM
BA
plot
siz
e: 0
.25
haso
iltyp
e: S
tagn
ic L
uvis
olA
WH
C: u
nkno
wn
fert
ilize
r ty
pe 1
:
tops
o I a
naly
sis
cont
rol p
lot:
c op
:m
aize
Kal
ahar
i Ear
ly P
earl
resu
lt:T
rial f
aile
d.
The
plo
ts w
ere
fert
ilize
d an
d pl
ough
ed b
y a
hire
d tr
acto
r in
the
deka
d D
EC
1/94
. Plo
ughi
ng to
ok p
lace
that
early
, bec
ause
the
farm
er h
ad b
ooke
d th
e tr
acto
r fo
r th
at d
ekad
. Pla
ntin
g w
as d
one
stra
ight
afte
rpl
ough
ing
in th
e sa
me
deka
d. G
erm
inat
ion
was
poo
r an
d pl
ants
stu
nted
; the
plo
ts w
ere
wee
ded,
but
no
harv
est w
as o
btai
ned.
C4
KA
VIM
BA
plot
siz
e: 0
.25
haso
iltyp
e: S
tagn
ic L
uvis
olA
WH
C: u
nkno
wn
fert
ilize
r ty
pe 1
:f e
rtili
zer
type
2:
tops
oil a
naly
sis
cont
rol p
lot:
Mr
G. L
ekok
oto
ALD
EP
mod
el II
I
slop
e: 0
-1°
UT
M p
ositi
on: 2
4268
7E 7
9992
27N
Pho
spho
rus
cont
ent t
opso
l7
ppm
sing
le s
uper
phos
phat
eap
plic
a o
rate
: 200
kg/
ha
Ms
E. M
azun
gaA
LDE
P m
odel
I
slop
e; 0
-1°
LEF
M p
oson
: 243
141E
799
8249
N
Pho
spho
rus
cont
ent t
opso
il: 9
ppm
sing
le s
uper
phos
phat
eap
plic
atio
n ra
te: 2
00 k
g/ha
3:2:
1ap
plic
at o
n ra
te: 2
00 k
g/ha
c op
:m
aize
Kal
ahar
i Ear
ly P
earl
resu
lt:T
rial f
aile
d.
The
plo
ts w
ere
fert
ilize
d an
d pl
ough
ed b
y a
hire
d tr
acto
r in
the
deka
d D
EC
3/94
. Far
mer
did
not
pla
nt; s
heab
ando
ned
her
field
and
wen
t to
Kas
ane
beca
use
of s
ocia
l circ
umst
ance
s.
pH-C
aCI,
org
CC
EC
Ca
Mg
KN
a
4.1
2.1
24.2
423
.93.
690.
280.
96
pH-C
aCl2
org
CC
EC
Ca
Mg
KN
a
7,1
0.9
5.92
15.1
61.
250.
360.
20
pH-C
aCI,
org
CC
EC
Ca
Mg
KN
a
7.2
0.4
3,24
9.9
1.06
0.77
0.44
pH-C
aCI,
org
CC
EC
Ca
Mg
KN
a
7.0
0.9
4.16
177.
62.
070.
320.
12
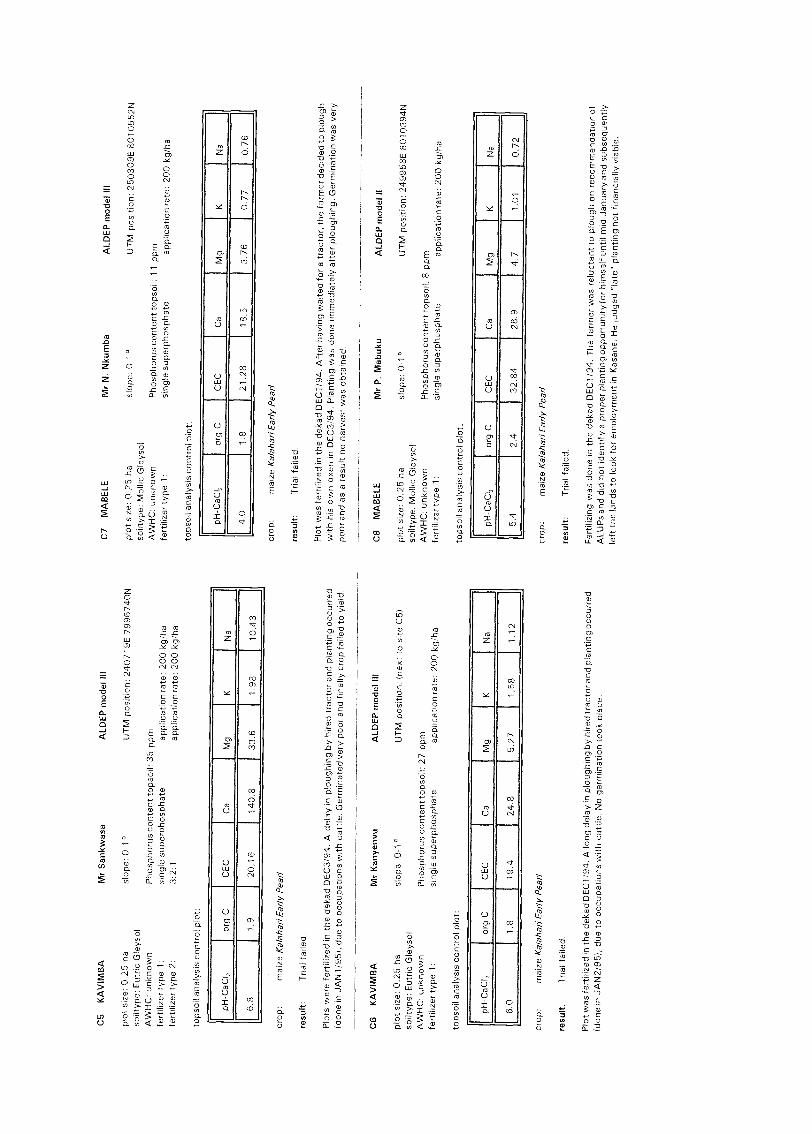
plot
siz
e: 0
.25
haso
iltyp
e: E
utric
Gle
ysol
AW
HC
: unk
now
nfe
rtili
zer
type
1:
fert
ilize
r ty
pe 2
:
tops
oil a
naly
sis
cont
rol p
lot:
crop
:m
aize
Ka
ahar
i Ear
ly P
earl
resu
lt:T
rial f
aile
d_
Plo
ts w
ere
fert
ilize
d in
the
deka
d D
EC
3194
. A d
elay
in p
loug
hing
by
hire
d tr
acto
r an
d pl
antin
g oc
curr
ed(d
one
in J
AN
1/9
5), d
ue to
occ
upat
ions
with
cat
tle. G
erm
inat
ed v
ery
poor
and
fina
lly c
rop
faile
d to
yie
ld.
tops
oil a
naly
s s
cont
rol p
lot:
crop
:m
aize
Kal
ahar
i Ear
ly P
earl
resu
lt:T
rial f
aile
d.
Plo
t vva
s fe
rtili
zed
in th
e de
kadD
EC
1/94
. A lo
ng d
elay
in p
loug
hing
by
hire
d tr
acto
r an
d pl
antin
g oc
curr
ed(d
one
in J
AN
2/95
), d
ue to
occ
upat
ions
with
cat
tle. N
o ge
rmin
atio
n to
ok p
lace
,
plot
siz
e: 0
.25
haso
iltyp
e: M
ollie
Gle
ysal
AW
HC
: unk
now
nfe
rtili
zer
type
1:
tops
o I a
naly
sis
cont
rol p
lot:
crop
:m
aize
Kal
ahar
i Ear
ly P
earl
resu
lt:T
rial f
aile
d.
Plo
t was
fert
ilize
d in
the
deka
d D
EC
1/94
. Afte
r ha
ving
wai
ted
for
a tr
acto
r, th
e fa
rmer
dec
ided
to p
loug
hw
ith h
is o
wn
oxen
in D
EC
3/94
. Pla
ntin
g w
as d
one
imm
edia
tely
afte
r pl
ough
ing.
Ger
min
atio
nw
as v
ery
poor
and
as
a re
sult
no h
arve
st w
as o
btai
ned.
tops
oil a
naly
sis
cont
rol p
lot:
c op
:m
aize
Kal
ahar
i Ear
ly P
earl
resu
lt:T
rial f
aile
d.
Fer
tiliz
ing
was
don
e in
the
deka
d D
EC
1/94
. The
farm
er w
as r
eluc
tant
to p
loug
hon
rec
omm
enda
tion
ofA
LUP
s an
d di
d no
t ide
ntify
a p
rope
r pl
antin
g op
port
unity
for
him
self
until
mid
Jan
uary
and
sub
sequ
ently
left
the
land
s to
look
for
empl
oym
ent i
n K
asan
e. H
e ju
dged
"la
te"
plan
ting
not f
inan
cial
ly v
iabl
e.
pH-C
aCI,
org
CC
EC
Ca
Mg
KN
a
4.0
1.8
21.2
818
.53.
760.
770.
76
pH-C
aCI,
org
CC
EC
Ca
Mg
KN
a
6.8
1.9
20.1
614
0.8
33.6
1.98
10.4
3
pH-C
aCl2
org
CC
EC
Ca
Mg
KN
a
6.0
1.8
19.4
24.8
5.27
1.58
1.12
pH-C
a C
I,or
g C
CE
CC
aM
gK
Na
5.4
2.4
32.8
428
.94,
71.
010.
72
C5
KA
VIM
BA
Mr
San
kwas
aA
LDE
P m
odel
Ill
C7
MA
BE
LEM
r N
. Nku
mba
ALD
EP
mod
el Il
l
plot
siz
e: 0
.25
hasl
ope:
0-1
°U
TM
pos
ition
: (ne
xt to
5/te
C5)
plot
siz
e: 0
.25
hasl
ope:
0-1
°U
TM
pos
ition
: 249
958E
801
0394
Nso
iltyp
e: E
utric
Gle
ysol
soilt
ype:
Mol
lic G
leys
olA
WH
C: u
nkno
wn
Pho
spho
rus
cont
ent t
opso
il; 2
7 pp
mA
WH
C: u
nkno
wn
Pho
spho
rus
cont
ent t
opso
il: 8
ppm
fert
ilize
r ty
pe 1
:si
ngle
sup
erph
osph
ate
appl
icon
rat
e: 2
00 k
g/ha
fert
ilize
r ty
pe 1
:si
ngle
sup
erph
osph
ate
appl
ica
o ra
te 2
00 k
g/ha
slop
e: 0
-1°
UT
M p
ositi
on: 2
4071
9E 7
9967
40N
Pho
spho
rus
cont
ent t
opso
il: 3
5 pp
msi
ngle
sup
erph
osph
ate
appl
icat
ion
rate
: 200
kg/
ha3:
2:1
appl
icat
ion
rate
: 200
kg/
ha
slop
e: 0
-1'
UT
M p
ositi
on: 2
5030
9E 8
0105
52N
Pho
spho
rus
cont
ent t
opso
il: 1
1 pp
msi
ngle
sup
erph
osph
ate
appl
icat
ion
rate
: 200
kg/
ha
C6
KA
VIM
BA
Mr
Kan
yenv
uA
LDE
P m
odel
Ill
C8
MA
BE
LEM
r P
. Mab
uku
ALD
EP
mod
el II

plot
siz
e: 0
,25
haso
iltyp
e: M
ollic
Gle
ysol
AV
VH
C: 1
30 m
m/m
fert
ilize
r ty
pe 1
:fe
rtili
zer
type
2:
tops
oil a
naly
sis
cont
rol p
lot:
top
soil
text
ure:
fin
crop
:m
aize
Kal
ahar
i Ear
ly P
earl
fert
ilize
d pl
ot 1
:fe
rtili
zed
plot
2:
cont
rol p
lot:
slop
e: 0
-2°
UT
M p
osih
o24
8433
E 8
0076
06N
Pho
spho
rus
cont
ent t
opso
6 pp
msi
ngle
sup
erph
osph
ate
appl
icat
ion
rate
: 200
kg/
ha3:
2:1
appl
icat
ion
rate
: 200
kg/
ha
drai
nage
: im
perf
ectly
num
ber
of r
ows:
55
num
ber
of r
ows:
42
num
ber
of r
ows:
51
soil
dept
h: 1
00 +
cm
plan
t den
s ty
: 41,
800
p1/h
apl
ant d
ensi
ty: 2
9,40
0 pl
/ha
plan
t den
sity
: 24,
500
p1/h
a
plot
siz
e: 0
.25
haso
iltyp
e: M
ollic
Gle
ysol
AW
HC
: unk
now
nfe
rtili
zer
type
1:
fert
ilize
r ty
pe 2
:
tops
oil a
naly
sis
cont
rol p
lot:
crop
:m
aize
Kal
ahar
i Ear
ly P
earl
resu
lt:T
rial f
a le
d.
Fer
tiliz
ing
was
don
e in
the
deka
d S
EP
1194
. Far
mer
cou
ld o
nly
plou
gh/p
lant
with
his
ow
n ox
en, o
ne w
eek
afte
r fe
rtili
zing
(S
EP
2/94
), d
ue to
the
oblig
ator
y va
ccin
atio
n ag
ains
t F&
MD
of h
is o
xen.
The
ani
mal
s vv
ere
not a
llow
ed to
do
any
heav
y ph
ysic
al la
bour
for
two
wee
ks a
fter
the
jab.
PH
-Caa
,or
g C
CE
CC
aM
gK
Na
4,7
3.4
37.4
427
.44.
510.
810.
96
pH-C
a C
I,or
g C
CE
CC
aM
gK
Na
5.8
1.8
20.3
622
.53.
890.
650.
88
C9
MA
BE
LEM
s E
. Chi
swan
iso
ALD
EP
mod
el Il
lC
10 M
AB
ELE
Mr
M. S
amos
ojo
ALD
EP
mod
el II
I
mol
apo
farm
inq
tria
lm
olap
o fa
rmin
g tr
ial
yiel
d fe
rtili
zed
plot
1: 2
750
kg/h
aA
s th
e fa
rmer
's fi
eld
was
situ
ated
on
the
slop
e of
a c
hann
el a
nd s
ince
the
grou
nd w
ater
tabl
e dr
oppe
dqu
ickl
y, g
erm
inat
ion
vvas
ver
y po
or a
nd n
o yi
eld
was
ach
ieve
d.yi
eld
fert
ilize
d pl
ot 2
: 252
0 kg
/ha
yiel
d co
ntro
l plo
t:17
70 k
g/ha
CY
SLA
MB
pre
dict
ion:
234
0 kg
/ha
Far
mer
fert
ilize
d in
SE
P1/
94 a
nd p
loug
hed/
plan
ted
with
ow
n ox
en in
SE
P2/
94. T
he p
lant
s in
the
two
fert
ilize
d pl
ots
deve
lope
d be
tter,
than
thos
e fr
om th
e co
ntro
l plo
t. T
he fe
rtili
zed
plot
s, h
owev
er, w
ere
mor
e in
fest
ed w
ith w
eeds
. The
mai
n w
eed
was
Ses
bani
a bi
spin
osa,
a le
gum
inou
s w
eed.
Whe
n th
e w
eed
was
upr
oote
d, it
vva
s ob
serv
ed th
at th
e ro
ots
of th
e w
eed
plan
ts o
n bo
th fe
rtili
zed
plot
s ha
d m
ore
nitr
ogen
fixa
ting
nodu
les
than
thos
e of
the
cont
rol p
lot.
The
fer
lized
pla
nts
flovv
ered
2 w
eeks
ear
lier
than
the
cont
rol p
lot.
On
aver
age
one
cob
was
form
ed p
erpl
ant.
Dur
ing
the
last
two
mon
ths
quite
a lo
t of i
nsec
ts w
ere
foun
d an
d at
har
vest
mos
t of t
he c
obs
wer
eaf
fect
ed. T
he in
fest
atio
n re
sulte
d on
the
fert
ilize
d pl
ots
in a
yie
ld lo
ss o
f app
roxi
mat
ely
40-5
0 %
; on
the
cont
rol p
lot i
t was
som
ewha
t lov
ver
30-4
0 %
, Har
vest
ing
was
don
e in
the
deka
d F
EB
1/95
.
slop
e: 2
'U
TM
pos
ition
248
433E
800
7606
N
Pho
spho
rus
cont
ent t
opso
il: 6
ppm
sing
le s
uper
phos
phat
eap
plic
at o
n ra
te: 2
00 k
g/ha
3:2:
1ap
plic
at o
n ra
te: 2
00 k
g/ha

NORTH EAST REGION / FRANCISTOWN
Trial sites:
Fi SecheleF2 SiviyaF3 TapaladipooF4 MaitengweF5 MathangwaneF6 MatoboF7 Nata
TUTU ME
0F7
FRANCISTOWNMAS GA
oF1
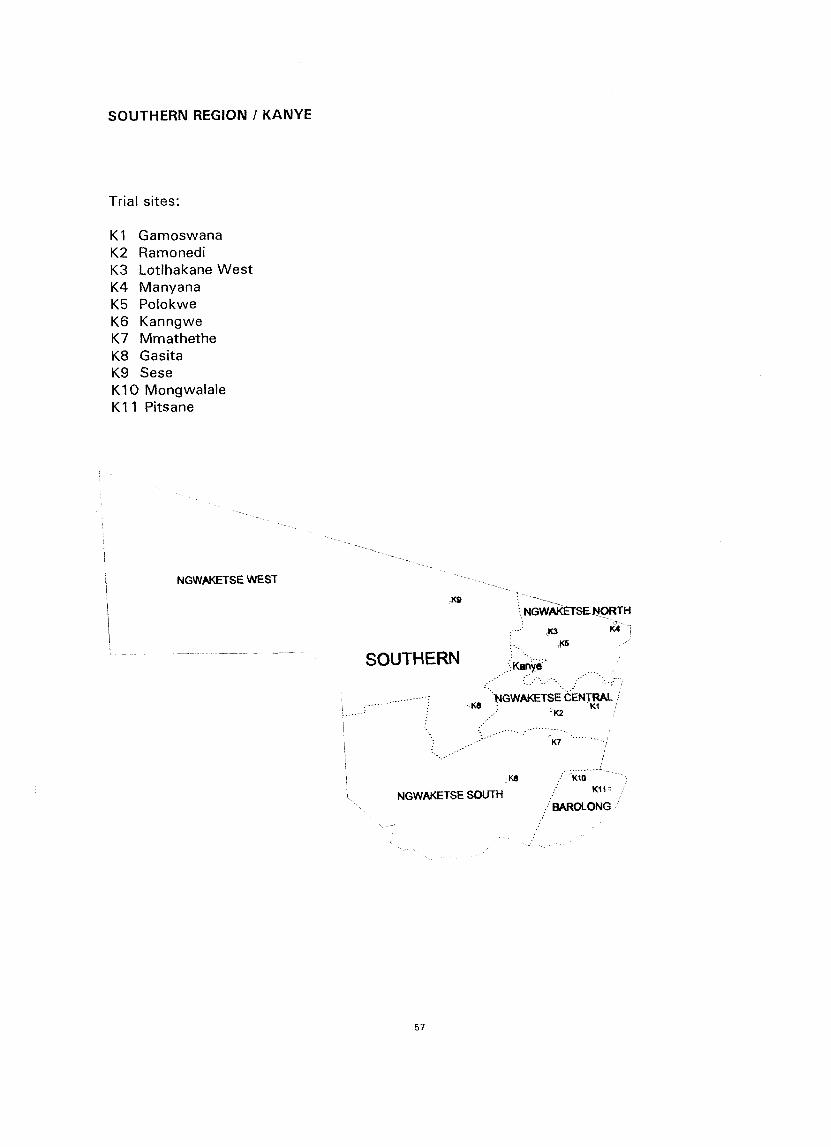
SOUTHERN REGION / KANYE
Trial sites:
K1 GamoswanaK2 RamonediK3 Lotlhakane WestK4 ManyanaK5 PolokweK6 KanngweK7 MmathetheK8 GasitaK9 SeseK10 MongwalaleK11 Pitsane
NGWAKETSE YVEST
SOUTHERN
.NGWAKETSE CENTRAL-Ke
",:.- "
Kl---------
Pco
NGWAKETSE SOUTHI3AROLONG
-
\.NGWMETSE NORTH
,K3 4-1105

Rainfall data trial sites
53
TRIAL SITE F1 Sechele F2 Siviya F3 Tapaladipoo F6 Matobo
SYNOPTIC STATION Francistown Francistown Francistown Francistown
RAINFALL STATION Tshesebe Tshesebe Tonota Tuturne
yearly average 506 mm 506 mm 436 mm 520 mm
31 Oct 2
01 Nov 11.3 6.3
21 Nov 3.1 17.3
23 Nov 7.8
30 Nov 6 4
01 Dec 1.6
08 Dec 10 21
10 Dec 11.5 10.5
19 Dec 12
20 Dec 3.1
23 Dec 8.1 6.2
25 Dec 15.8 17 10 31.6
26 Dec 13 8
27 Dec 1.2
28 Dec 10 5
09 Jan 10
10 Jan 11
11 Jan
12 Jan 2.5 17
13 Jan 5,5
14 Jan 50
15 Jan 5 67.2
16 Jan 70.9 10 58
30 Jan 12
16 Feb 27
18 Feb 9.5 12 18.9
19 Feb 45.3 35 24 6,5
20 Feb a 27 40
21 Feb 8 5 50 49.7
22 Feb 6
28 Feb 28
18 Mar 38
20 Mar 15
21 Mar 10
22 Mar 8

continued:
54
23 Mar 25
24 Mar 10
25 Mar 15.9
26 Mar 11.4 7.5
27 Mar 5.5 3.5
28 Mar 4.6
29 Mar 4
30 Mar 5 10.3
31 Mar 17
03 Mayi
TOTAL 278.1 272 336 287
% of AVERAGE 55 % 54 % 77 % 55 %
TRIAL SITE F1 Sechele F2 Siviya F3 Tapaladipoo F6 Matobo

resu
lt:T
he r
esul
ts a
re n
ot s
uita
ble
for
com
paris
on, d
ue to
diff
eren
t soi
l typ
es o
f the
plo
ts a
nd a
mix
ture
of s
eeds
.
The
farm
er o
wns
a p
loug
h, b
ut p
loug
hing
was
don
e by
hire
d tr
acto
r, a
fter
broa
dcas
t ng
of s
eed
in th
ede
kad
NO
V3.
A m
ixtu
re o
f var
ietie
s w
as p
lant
ed: r
ed s
orgh
um 7
5 %
, whi
te h
airy
sor
ghum
15
%,
Seg
aola
ne 1
0 %
, mai
ze a
nda
few
mel
ons.
The
ach
ieve
d pl
ant d
ensi
ty is
app
roxi
mat
ely
30,0
00 p
lant
s/ha
; the
cro
p st
and
unev
en w
ith m
any
gaps
.T
he r
ed s
orgh
um p
lant
s w
ere
1.00
-1.4
0m h
igh,
with
2-3
tille
rs p
er p
lant
and
med
ium
to la
rge
mat
urin
ghe
ads;
bird
dam
age
1%. S
egao
lane
pla
nts
are
stun
ted
< 1
.00m
and
thin
, in
grai
n fil
ling
stag
e.
CO
NT
RO
L P
LOT
Bro
adca
sted
and
plo
ughe
d by
hire
d tr
acto
r in
NO
V3.
Als
o a
mix
ture
of s
eeds
, and
sim
ilar
plan
t den
sity
as o
n fe
rtili
zed
plot
; pla
nts
in g
ener
al ta
ller,
bet
ter
deve
lope
d, p
roba
bly
due
to th
e lig
hter
text
ured
soi
l.
fert
ilize
d pl
ot p
lant
den
sity
:11
,000
pl/h
aco
ntro
l plo
t pla
nt d
ensi
ty:
unkn
own
resu
lt:D
ue to
a m
ixtu
re o
f var
ietie
s, g
reat
cau
tion
is r
equ
red
with
the
inte
rpre
at o
n of
the
resu
lts.
Plo
ughi
ng w
as d
one
on 2
4-25
/12/
94 w
ith a
spa
n of
4 d
onke
ys. N
o ha
rrow
ing
oper
atio
n w
as c
arrie
d ou
t.P
lant
ing
was
don
e w
ith 1
don
key
on 2
8/12
/94.
Fer
tiliz
er w
as a
pplie
d as
a to
p dr
essi
ng o
n 07
/01/
95. A
wee
ding
ope
ratio
n w
as c
ondu
cted
4-5
wee
ks a
tter
plan
ting.
visi
t 15/
05/9
5
FE
RT
ILIZ
ED
PLO
T
A m
ixtu
re o
f var
ietie
s w
as o
bser
ved:
sor
ghum
Seg
aola
ne fo
rmed
70
% o
f the
pla
nt s
tand
, whi
te h
airy
sorg
hum
30
%. T
op h
alf o
f fie
ld h
ad a
n ev
en a
nd r
athe
r ho
mog
eneo
us p
lant
sta
nd; t
he m
ajor
ity o
f the
plan
ts w
as 1
.20-
1.50
m h
igh,
thin
ste
ms
and
few
tille
rs. P
lant
s w
ere
in g
rain
filli
ng to
rip
enin
g st
age,
with
med
ium
siz
ed h
eads
. Bot
tom
hal
f of f
ield
had
a p
oor
stan
d; p
lant
s st
unte
d an
d th
inly
ste
mm
ed, p
erha
psdu
e to
sha
llow
soi
l. N
o bi
rd p
robl
em. H
arve
stin
g w
as d
one
arou
nd b
egin
ning
of J
une.
CO
NT
RO
L P
LOT
Plo
t was
infe
sted
by
arm
y w
orm
; in
orde
r to
con
trol
the
pest
, the
farm
er d
ecid
ed to
plo
ugh
the
plot
. The
spre
adin
g of
pes
t was
sto
pped
, but
the
cont
rol p
lot w
as n
ot r
epla
nted
.
pH-C
aCl2
org
CC
EC
Ca
Mg
KN
a
4.0
0.03
1.98
1.29
0.43
0.69
0.09
pH-C
aCI,
org
CC
EC
Ca
Mg
KN
a
4.9
0.4
54.0
11.
611.
111.
506.
48
F1
SE
CH
ELE
Ms.
K.K
. Sec
hele
ALD
EP
mod
el II
F2
SIV
IYA
Mr.
Lam
eck
Bac
hech
eA
LDE
P m
odel
I
visi
t 15/
05/9
5F
ertil
ized
plo
t:so
rghu
m S
egao
lane
- 10
5 kg
/ha
sorg
hum
loca
l var
iety
-45
kg/
ha
FE
RT
ILIZ
ED
PLO
TC
ontr
ol p
lot:
faile
d
plot
siz
e: 0
.5 h
asl
ope:
1°
UT
M p
ositi
on: 5
3708
0E 7
7059
66N
soil
type
fert
ilize
d pl
ot: V
ertis
olA
WH
C: u
nkno
wn
Pho
spho
rus
cont
ent t
opso
il: 7
ppm
fert
ilize
r ty
pe:
sing
le s
uper
phos
phat
eap
plic
atio
n ra
te: 5
0 kg
/ha
soil
type
con
trol
plo
t: C
hrom
ic L
uvis
ol, p
etric
pha
seA
WH
C: u
nkno
wn
Pho
spho
rus
cont
ent t
opso
il: u
nkno
wn
tops
o I a
naly
sis
cont
rol p
lot:
plot
siz
e: 0
.5 h
asl
ope:
1-2
°U
TM
pos
ition
: 568
445E
769
3539
Nso
iltyp
e: C
ambi
c A
reno
sol
AW
HC
: 65
mm
/mP
hosp
horu
s co
nten
t top
soil:
4 p
pmfe
rtili
zer
type
:si
ngle
sup
erph
osph
ate
appl
icat
ion
rate
: 50
kg/h
a
tops
oil a
naly
sis
cont
rol p
lot:

F3
TA
PA
LAD
IPO
O
plot
siz
e: 0
.5 h
aso
iltyp
e: C
hrom
ic L
uvis
olA
WH
C: u
nkno
wn
fert
ilize
r ty
pe:
tops
oil a
naly
sis
cont
rol p
lot:
F4
MA
ITE
NG
WE
resu
lt:N
o pl
antin
g op
port
unity
was
iden
tifie
d an
d no
plo
ughi
ng w
as d
one.
Tria
l was
te m
nat
ed.
Mr.
Dan
iel F
ranc
isA
LDE
P m
odel
slop
e 1°
UT
M p
ositi
on: 5
6064
0E 7
6143
13N
Pho
spho
rus
cont
ent t
opso
il: 7
ppm
sing
le s
uper
phos
phat
eap
plic
atio
n ra
te: 5
0 kg
/ha
resu
lt:T
he r
esul
ts a
re n
ot s
uita
ble
f or
com
paris
on, d
ue to
the
use
of lo
cal v
arie
ties.
visi
t 16/
05/9
5
Plo
ts tr
acto
r pl
ough
ed a
nd r
owpl
ante
d m
uch
late
r IJ
AN
21 th
an fa
rmer
's fi
eld
INO
V31
; far
mer
not
too
inte
rest
ed. P
oor
germ
inat
ion,
no
wee
ding
nor
bird
scar
ing
done
. Une
ven
plan
t sta
nds.
100
% lo
cal r
edso
rghu
m v
arie
ty u
sed;
wee
d co
ver
appr
oxim
atel
y 40
%.
Far
mer
spe
nt ti
me
on b
irdsc
arin
g on
his
ow
n fie
ld a
nd n
egle
cted
tria
l plo
ts, r
esul
ting
in a
ppro
xim
atel
y 10
% b
ird d
amag
e on
hea
ds o
f tria
l plo
ts.
Far
mer
's fi
eld
look
ed v
ery
un fo
rm, r
elat
ivel
y hi
gh p
lant
den
sity
30,
000
+ ,
with
thin
ste
mm
ed p
lant
s;al
read
y ha
rves
ted.
FE
RT
ILIZ
ED
PLO
T
Uni
form
pla
nt h
eigh
t of 1
.30m
; pla
nts
that
ger
min
ated
are
med
ium
-wel
l dev
elop
ed a
nd h
avin
g up
to 6
tille
rs; h
eads
med
ium
to la
rge
for
the
varie
ty a
nd m
atur
ing.
CO
NT
RO
L P
LOT
Pla
nts
slig
htly
less
dev
elop
ed th
an fe
rtili
zed
plot
.
The
tota
l yie
ld o
btai
ned
from
bot
h th
e fe
rtili
zed
and
the
cont
rol p
lot w
as a
ppro
xim
atel
y 12
0 kg
/ha
red
sorg
hum
.
F5
MA
TH
AN
GW
AN
E
resu
lt:T
his
tria
l was
sup
pose
d to
hav
e be
en c
arrie
d ou
t und
er s
uper
visi
on o
f the
Dep
artm
ent o
fA
gric
ultu
ral R
esea
rch;
ho
wav
er, f
ertil
izer
was
not
ava
ilabl
e in
tim
e an
d he
nce
no p
loug
hing
has
been
und
erta
ken.
The
tria
l was
term
inat
ed.
F6
MA
TO
BO
plot
siz
e: 1
ha
soilt
ype:
unk
now
nA
WH
C: u
nkno
wn
fert
ilize
r ty
pe:
Mr.
Fad
zani
Mm
usi
ALD
EP
mod
el I
slop
e: 1
0U
TM
pos
ition
: 511
125E
772
4278
N
Pho
spho
rus
cont
ent t
opso
il: u
nkno
wn
sing
le s
uper
phos
phat
eap
plic
at o
n ra
te: 2
5 kg
/ha
Thi
s tr
ial w
as c
arrie
d ou
t and
mon
itore
d by
the
Dep
artm
ent o
f Agr
icul
tura
l Res
earc
h F
ranc
isto
wn,
whi
chal
so p
rovi
ded
the
farm
er w
ith a
row
pla
nter
. By
mis
take
all
fert
ilize
r w
as a
pplie
d on
1 h
a, in
clud
ing
both
the
fert
ilize
d an
d th
e co
ntro
l plo
t. H
ence
no
cont
rol p
lot o
n th
is tr
ial s
ite. T
he tr
ial w
as p
lant
ed w
ith r
edso
rghu
m, l
ocal
var
iety
(pr
obab
ly b
e so
rghu
m 8
01in
Jan
uary
199
5. N
o ha
rrow
ing
was
don
e, b
ut a
wee
ding
oper
atio
n w
as c
ondu
cted
.No
bird
pro
blem
s oc
curr
ed. A
lread
y ha
rves
ted
by M
ay 1
5th,
so
site
not
vis
ited.
The
yie
ld o
f red
sor
ghum
am
ount
ed 4
0.5
kg/h
a.
F7
NA
TA
tops
oil a
naly
sis
cont
rol p
lot:
resu
lt:T
he fe
rtili
zer
was
not
ava
ilabl
e in
tim
e an
d no
pla
ntin
g op
port
uni y
was
iden
tifie
d in
tim
e, s
ono
plo
ughi
ng to
ok p
lace
. The
tria
l was
term
inat
ed.
pH-C
aC12
org
CC
EC
Ca
Mg
KN
a
5.2
0.09
9.9
7.32
1.16
0.65
0.08
pH-C
aCI,
org
CC
EC
Ca
Mg
KN
a
6.3
0.1
5.53
4.44
0.75
0.89
0.08
fert
ilize
d pl
ot p
lant
den
sity
:10
,000
pi/h
are
sult:
Res
ults
not
sui
tabl
ef o
r co
mpa
rison
, due
to w
rong
fert
ilize
r ap
plic
atio
nand
use
of l
ocal
var
iety
.
cont
rol p
lot p
lant
den
sity
:5,
000
pl/h
a

Rainfall data trial sites K1-K6
58
TRIAL SITE K1 Gamoswana K2 Ramonedi K3 Lotlhakane K4 Manyana K5 Polokwe K6 Kanngwe
SYNOPTIC STATION Kanye Konya Kanye Kanye Kanye Konya
RAINFALL STATION Kanye Pelotshetla Moshupa Moshupa Polokyve Pelorsherla
yearly average 490 mm 537 mm 389 mm 389 mm 429 mm 537 mmr
23 Oct
28 Oct 2
03 Nov 4.5 7 5
05 Nov 20
06 Nov
12 Nov 5 7
13 Nov 10
05 Dec 2
07 Dec 4.4 10 10
08 Dec 10 5 2 4
09 Dec 4 15
10 Dec 4
15 Dec 4
18 Dec 1 7
23 Dec 2
24 Dec 34
26 Dec 13 30 44
27 Dec 18 10 60 22
28 Dec 3 8.5
31 Dec 2 6
01 Jan 10
03 Jan 7
08 Jan 12
11 Jan
12 Jan 12 6 20
13 Jan 20 36 20
14 Jan 2 3 14
15 Jan 14 4.5 7
18 Jan 5
29 Jan 21
31 Jan 18 24 25 30
02 Feb 32
03 Feb 4
05 Feb 7
22 Feb 20
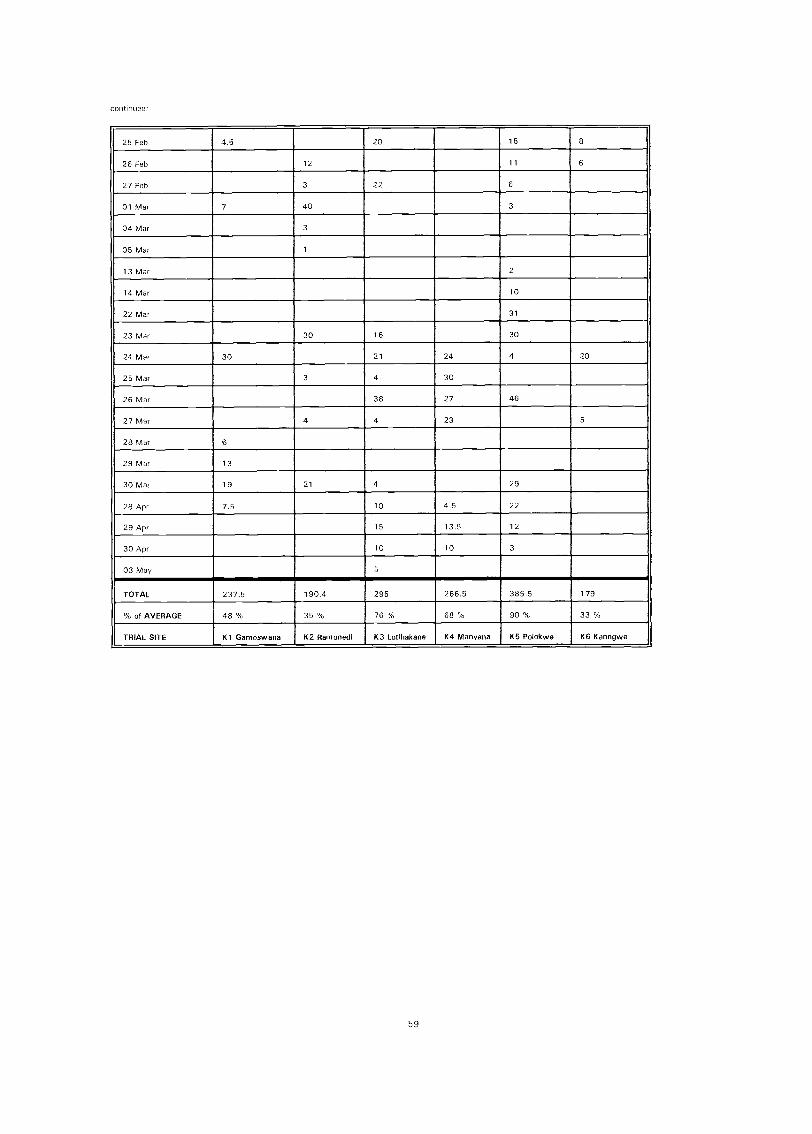
continued:
59
25 Feb 4.5 20 15 8
26 Feb 12 11 6
27 Feb 3 22 6
01 Mar 7 40
04 Mar
05 Mar
13 Mar 2
14 Mar 10
22 Mar 31
23 Mar 30 16 30
24 Mar 30 21 24 4 20
25 Mar 3 4 30
26 Mar 38 27 46
27 Mar 4 4 23 5
28 Mar 6
29 Mar 13
30 Mar 19 21 4 29
28 Apr 7.5 10 4.5 22
29 Apr 15 13.5 12
30 Apr 10 10
03 May 5
TOTAL 237.5 190.4 295 266.5 385.5 179
% of AVERAGE 48 % 35 % 76 % 68 % 90 % 33 °A,
TRIAL SITE K1 Gamoswana K2 Ramonedi K3 Lotlhakane K4 Manyana K5 Polokwe K6 Kanngwe

Rainfall data trial sites K7-K11
60
TRIAL SITE K7 Mmathethe 1(8 Gasita 1(9 Sese K10 Mongwalale K11 Pitsane
SYNOPTIC STATION Kanye Kanye Kanye Kanye Kanye
RAINFALL STATION Pelotshetle Jwaneng Jvvaneng Pitsane Pitsane
yearly average 537 mm 485 mm 485 mm 452 mm 452 mm
27 Oct 6 8
28 Oct
29 Oct 2
02 Nov 4
03 Nov
04 Nov 2
05 Nov
06 Nov 1 6
10 Nov 3 7
12 Nov 3 9
13 Nov 3 4
05 Dec 4 15
08 Dec 2 11
09 Dec
10 Dec 10 2
17 Dec 5 22
18 Doc 13 6
23 DOC 6
24 Dec 3
26 Dec 28 20
27 Dec 20 22.5 19
28 Dec 2
29 Dec 5 10 10
31 Dec 15 4
07 Jan 2
08 Jan 1 2
09 Jan 4
11 Jan 6 5
12 Jan 2 28 10 5
13 Jan 7 10
14 Jan 31 9 3 4
15 Jan 3 30 13 4 11
16 Jan 3 10
17 Jan
24 Jan 3.5

continued:
61
25 Jan
26 Jan 6
31 Jan 24 28 32 32 24
02 Feb 5 5
07 Feb 30
08 Feb 10
09 Feb 4
18 Feb 22
20 Feb 4
26 teb 18 24 12
28 feb 18
01 Mar 52 11 62 9
06 Mar 6 4.5 26
08 Mar
10 Mar 5 8
11 Mar
23 Mar 12 24 20
24 Mar 14 6 34 10 21
25 Mar 2
26 Mar 5 4
27 Mar 23 36
28 Mar 11 5
30 Mar 12 20 4
31 Mar 2 40
07 Apr 9
08 Apr 5
21 Apr 3 11
27 Apr 9
28 Apr 5
30 Apr 11
01 May 5
02 May
04 May 5
05 May
TOTAL 270 243 286.5
,
352 274
% of AVERAGE 50 % 50 % 59 % 78 % 61 %
TRIAL SITE K7 Mmathethe K8 Gasita K9 Sese K10 Mongwalale K 11 Pitsane

resu
lt:T
rial f
aile
d.
Plo
ughi
ng p
oorly
don
e by
trac
tor
on 0
4/01
/95
afte
r 52
mm
of r
ain
on 2
6-2E
3/12
/94,
lea
v ng
big
rid
ges
and
furr
ows.
Sub
sequ
ently
, pla
ntin
g do
ne o
n 06
/01/
95, n
ot v
ery
stra
ight
and
with
a w
ide
row
spa
cing
,re
sulti
ng in
rel
ativ
ely
low
pla
nt d
ensi
ties.
Ger
min
atio
n w
as e
ven
and
plan
t dev
elop
men
t qui
te g
ood
at th
ebe
ginn
ing.
The
fert
ilize
d pl
ants
look
ed g
reen
er, b
igge
r an
d m
ore
adva
nced
than
the
plan
ts in
the
cont
rol
plot
. Esp
ecia
lly in
the
fert
ilize
d pl
ot, o
val s
hape
d, b
are
patc
hes
enco
unte
red,
The
farm
er g
ave
diffe
renc
esin
soi
l as
reas
on, p
ossi
blyc
ause
d by
a h
igh
term
ite a
ctiv
ity o
n th
e ba
te p
atch
es. T
erm
ites
seem
ed to
hav
eat
tack
ed p
lant
s. In
gen
eral
the
crop
look
ed h
ealth
y, b
ut s
tart
ed s
uffe
ring
from
moi
stur
e st
ress
afte
r30
/01/
95. T
he w
eed
cove
r w
as lo
w a
nd a
wee
ding
ope
ratio
n to
ok o
nly
a fe
w d
ays.
Cro
p fin
ally
atta
cked
by b
irds,
lead
ing
to a
100
% d
amag
e of
80
% o
f the
(m
atur
e) h
eads
; onl
y 20
°A
of t
he h
eads
wer
eha
rves
ted
as "
mot
hala
ne".
resu
lt:T
rial f
aile
d.
Cat
tle a
nd h
ouse
con
stru
ctio
n to
ok m
ost o
f the
farm
ers
time.
The
farm
er m
isse
d th
e fir
st p
lant
ing
oppo
rtun
ity. P
oor
plot
fenc
e al
low
ed c
attle
to e
nter
and
dam
age
crop
.
visi
t 04/
05/9
5
Tria
l plo
ts p
lant
ed in
dek
ad J
AN
3. P
lant
sta
nds
poor
; no
obvi
ous
diff
eren
ce b
etw
een
fert
ilize
d an
d co
ntro
lpl
ants
; pla
nts
80 c
m h
igh.
Wee
d co
vera
ge a
ppro
xim
atel
y 15
%, n
o w
eedi
ng o
pera
tion
carr
ied
out.
Pla
nts
with
thin
ste
ms,
sor
ne ti
llerin
g oc
curr
ed. P
lant
s in
gra
in fi
lling
sta
ge; b
ird p
robl
em (
not t
aken
car
e of
). D
ueto
farm
ers
negl
igen
ce n
o ha
rves
t was
ach
ieve
d.
pH-H
20E
Cor
g C
CE
CC
aM
gK
Na
PB
Sca
rbo
6.5
0.1
0.8
8.6
4.4
1.4
0.8
0.0
774.
8
pH-H
pE
Cor
g C
CE
CC
aM
gK
Na
PB
Sca
rbo
6.9
0.0
0,5
5.1
3.5
0.4
0.3
0.0
820.
0
K1
GA
IVIO
SW
AN
AM
rs M
. Mod
utlw
aA
LDE
P m
odel
I1(
2R
AM
ON
ED
IM
r Le
kau
Sel
ebal
eng
ALD
ER
mod
el
plot
siz
e: 0
.25
hasl
ope:
1°
UT
M p
os io
n: 3
4803
6E 7
2202
30N
plot
siz
e: 0
.25
hasl
ope
1°U
TM
pos
ition
: 328
616E
721
6714
N
soilt
ype:
Chr
omic
Luv
isol
soilt
ype:
Pet
ri-C
hrom
ic L
uvis
olA
WH
C: 1
40 m
m/m
Pho
spho
rus
cont
ent t
opso
il: 1
.5 p
pmA
WH
C: 1
40 m
m/m
Pho
spho
rus
cont
ent t
opso
il: 1
.1 p
pm
fert
ilize
r ty
pe:
sing
le s
uper
phos
phat
eap
plic
atio
n ra
te: 2
99 k
g/ha
fert
ilize
r ty
pe:
sing
le s
uper
phos
phat
eap
plic
atio
n ra
te: 3
12 k
g/ha
tops
I ana
lysi
s co
ntro
l plo
t:to
psoi
l ana
lys
s co
ntro
l plo
t:
fert
ilize
d pl
ot:
num
ber
of r
ows:
24
plan
t den
sity
: 20,
100
pl/h
afe
rtili
zed
plot
:nu
mbe
r of
row
s: 5
8pl
ant d
ensi
ty: 1
3,00
0 pl
/ha
cont
rol p
lot:
num
ber
of r
ows:
18
plan
t den
sity
; 16,
900
pl/h
aco
ntro
l plo
t:nu
mbe
r of
row
s: 5
8pl
ant d
ensi
ty: 1
1,60
0 pl
/ha
top
soil
text
ure:
med
ium
drai
nage
: wel
l dra
ined
soil
dept
h: 1
00 +
cm
top
soil
text
ure:
med
ium
drai
nage
: wel
l dra
ined
soil
dept
h: 8
0 cm

tops
oil a
naly
sis
cont
rol p
lot:
plan
t den
sity
: 16,
900
pl/h
apl
ant d
ensi
ty: 2
0,40
0 pl
/ha
CY
SLA
MB
pre
dict
ion:
119
0 kg
/ha
CY
SLA
MB
pre
dict
ion:
560
kg/h
a
Fie
ld lo
cate
d ad
jace
nt to
a s
teep
slo
pe; o
nly
a fe
w s
gns
of w
ater
ero
s on
in th
e fie
ld. F
irst p
lant
ed in
deka
d N
OV
1 an
d no
ger
min
atio
n oc
curr
ed; a
dry
spe
ll of
4-5
wee
ks fo
llow
ed a
nd r
epla
ntin
g vv
as d
one
on11
/01/
95,
Fer
tiliz
er n
ot e
very
whe
re p
loug
hed
in w
ell;
it w
as o
bser
ved
on th
e su
rfac
e at
pla
ces.
See
ds d
ropp
edun
even
ly fr
om p
lant
er.
A p
ortio
n of
the
cont
rol p
lot i
s lo
cate
d in
a d
epre
ssio
n, c
olle
ctin
g ru
n-of
f fro
m m
ost o
f the
fiel
d. P
lant
slo
oked
bet
ter
ther
e th
an in
oth
er p
arts
of t
he p
lot.
How
ever
, a c
lear
diff
eren
ce b
etw
een
fert
ilize
d an
dco
ntro
l pla
nts
has
been
not
iced
all
the
time,
with
f er
tiliz
ed p
lant
s lo
okin
g gr
eene
r, b
igge
r an
d fu
rthe
rde
velo
pedt
han
cont
rol p
lot p
lant
s. T
iller
ing
star
ted
whe
n pl
ants
wer
e on
ly 1
0 cm
hig
h; fl
ower
ing
occu
rred
in s
ome
case
s w
hen
plan
ts w
ere
only
20-
30 c
m,
visi
t 04/
05/9
5
Rat
her
unev
en p
lant
sta
nds;
con
trol
plo
t pla
nts
wer
e sl
ight
ly s
hort
er a
nd h
ad th
inne
r st
ems
than
fert
ilize
dpl
ot. O
n av
erag
e 2-
3 til
lers
per
pla
nt; f
ertil
ized
pla
nts
seem
ed to
be
affe
cted
mor
e se
vere
ly b
y ar
my
wor
mth
an c
ontr
ol p
lant
s. A
phid
s ge
nera
lly a
ttack
ed fi
rst t
iller
s, w
hich
wer
e dy
ing
and
blac
k at
the
time
of th
evi
sit.
New
tille
rs d
evel
oped
late
r; m
ostly
flow
erin
g no
w, s
ome
grai
n fil
ling
occu
rred
and
pro
babl
yha
rves
ted
as ''
mot
hala
ne".
Low
yie
lds
wer
e ac
hiev
ed, d
ue to
aph
d in
fest
atio
n an
d sm
all d
evel
oped
sec
onda
ry a
nd te
rtia
ry h
eads
.
tops
o I a
naly
sis
cont
rol p
lat:
resu
lt:T
r al
faile
d, d
ue to
the
use
of a
loca
l var
iety
.
Plo
ughi
ng w
as d
one
on 0
8/01
/95
afte
r 60
mm
of r
ain
on 2
8/12
/94
and
plan
ting
was
furt
her
dela
yed
until
16/0
1/95
. The
farm
er c
laim
ed th
e pl
ante
r w
as v
vron
gly
adju
sted
and
all
the
seed
s po
ured
out
in b
ig h
eaps
,w
hich
was
con
firm
ed a
t ger
min
atio
n. T
he fa
rmer
than
rep
loug
hed
and
repl
ante
d Io
n 26
/01/
951
the
tria
lpl
ots,
usi
ng a
loca
l sor
ghum
var
iety
. Ger
min
atio
n oc
curr
ed 6
day
s la
ter
on 0
2/02
/95.
pH-H
20E
Cor
g C
CE
CC
aM
gK
Na
PB
Sca
rbo
6.5
0.0
1.2
83.
51.
80.
20.
271
0.0
pH-H
20E
Cor
g C
GE
CC
aM
gK
Na
PB
Sca
rbo
6.0
0.0
0.8
7.9
0.3
0.8
0.6
0.0
220.
0
K3
Lotlh
akan
e W
ES
TM
r K
gari
Dife
mo
ALD
EP
mod
el I
K4
MA
NY
AN
AM
r K
gole
go L
etlo
leA
LDE
P m
odel
II
plot
siz
e: 0
.125
ha
slop
e: 3
°U
TM
po
o32
7953
E 7
2546
75N
plot
siz
e: 0
.25
hasl
ope:
1°
UT
M p
oson
: 362
000E
726
0000
N
soilt
ype:
Chr
omic
Luv
isol
soilt
ype:
Rho
oll-C
hrom
ic L
uvis
ol
AW
HC
: 140
mm
/mP
hosp
horu
s co
nten
t top
soil:
1.7
ppm
AV
VH
C: 1
30 m
m/m
Pho
spho
rus
cont
ent t
opso
il: 1
.2 p
pm
fert
ilize
r ty
pe:
sing
le s
uper
phos
phat
eap
plic
a io
n ra
te: 2
91 k
g/ha
fert
ilize
r ty
pe:
sing
le s
uper
phos
phat
eap
plic
atio
n ra
te: 3
08 k
g/ha
top
soil
text
ure:
med
ium
drai
nage
: wel
l dra
ined
soil
dept
h: 1
00 +
cm
top
soil
text
ure:
med
ium
drai
nage
: wel
l dra
ined
soil
dept
h: 1
00+
cm
fert
ilize
d pl
ot:
num
ber
of r
ows:
32
cont
rol p
lot:
num
ber
of r
ows:
30
yiel
d fe
rtili
zed
plot
:30
0 kg
/ha
yiel
d co
ntro
l plo
t:21
0 kg
/ha

K5
PO
LOK
WE
plot
siz
e: 0
.25
haso
iltyp
e: A
reni
-Fer
AW
HC
: 60
mm
/mfe
rtili
zer
type
;
tops
oil a
naly
sis
cont
rol p
lot:
Mr
and
Mrs
Mog
oros
i Kgo
piso
ALD
EP
mod
el II
slop
e: 2
°U
TM
Po
ion:
358
0E 7
2485
54N
Dis
tric
Reg
osol P
hosp
horu
s co
nten
t top
soil:
3.6
ppm
sing
le s
uper
phos
phat
eap
plic
atio
n ra
te: 2
24 k
g/ha
and
only
one
med
ium
siz
ed h
ead
was
form
ed p
er p
lant
. Mos
t hea
ds m
ere
in g
rain
filli
ng a
nd r
ipen
ing
stag
es. B
ird s
carin
g do
ne b
y th
e fa
rmer
, was
so
far
effe
ctiv
e; a
ll he
ads
had
a m
axim
um o
f 5 %
dam
age.
Bird
scar
ing
stay
ed e
ffect
ive
until
har
vest
ing;
the
bird
dam
age
did
not i
ncre
ase.
At h
arve
st, t
he p
lant
s on
the
fert
ilize
d pl
ot w
ere
talle
r th
an th
e co
ntro
l plo
t.
pH-H
,0E
Cor
g C
CE
CC
aM
gK
Na
PB
Sca
rbo
6.0
0.0
0.4
1.9
0.3
0.0
0.2
0.0
260.
0
top
soil
text
ure:
coa
rse
drai
nage
: wel
l dra
ined
soil
dept
h: 6
0 cm
fert
ilize
d pl
ot:
num
ber
of r
ows:
33
plan
t den
sity
: 16,
500
pl/h
aco
ntro
l plo
t:nu
mbe
r of
row
s: 3
3pl
ant d
ensi
ty: 1
4,40
0 pl
/ha
yiel
d fe
rtili
zed
plot
:76
0 kg
/ha
CY
SLA
MB
pre
dict
ion:
133
0 kg
/ha
yiel
d co
ntro
l plo
t:27
0 kg
/ha
CY
SLA
MB
pre
dict
ion:
960
kg/h
a
Fie
ld lo
cate
d on
foot
slop
es o
f Pol
ok w
e H
ills,
slo
ping
tow
ards
the
Nor
th, w
ith e
vide
nce
of s
heet
and
rill
eros
ion.
The
tria
l plo
ts w
ere
loca
ted
in a
flat
par
t of t
he fi
eld.
The
soi
l is
loam
y an
d ca
ppin
g oc
curr
ed la
ter
in th
e se
ason
. The
farm
er w
as n
ot a
ble
to r
espo
nd a
s qu
ickl
y as
oth
ers
to th
e fir
st p
lant
ing
oppo
rtun
ity(4
4 m
m o
n 26
/12/
94).
Plo
ughi
ng (
with
8 o
xen)
and
pla
ntin
g w
ere
dela
yed
for
abou
t 14
days
(11
/01/
95an
d 12
/01/
95 r
espe
ctiv
ely)
. The
farm
er p
lant
ed a
long
plo
ugh
furr
ows,
whi
ch r
educ
ed a
ccur
acy,
mak
ing
row
dis
tanc
e un
nece
ssar
ilyw
ide
(1-1
.40
m).
The
larg
e ro
w s
paci
ng a
ffect
ed th
e pl
ant d
ensi
ty, w
hich
was
rela
tivel
y lo
w.
A c
lear
diff
eren
cein
pla
nt d
evel
opm
ent b
etw
een
fert
ilize
d an
d co
ntro
l plo
t was
obs
erve
d:fe
rtili
zed
plan
tslo
oked
gre
ener
, big
ger
and
furt
her
in d
evel
opm
ent t
han
cont
rol p
lant
s.W
hen
requ
este
d to
sta
rt w
eedi
ng, t
he fa
rmer
was
rel
ucta
nt a
t the
tim
e, a
s a
dry
spel
l had
red
uced
the
soil
moi
stur
e an
d in
crea
sed
the
soil
tem
pera
ture
. The
farm
er e
xpla
ined
, tha
t wee
ding
at t
hat m
omen
tvv
ould
dam
age
plan
ts if
hot
soi
l was
pus
hed
agai
nst p
lant
s. S
he w
as u
naw
are
of th
e fa
ct, t
hat w
eeds
sis
oco
nsum
e fe
rtili
zer,
and
was
ver
y m
otiv
ated
whe
n to
ld th
at w
eeds
com
pete
with
the
crop
s fo
r nu
trie
nts
(thi
s m
ight
be
a ge
nera
l kno
wle
dgeg
ap, v
vhic
h co
uld
expl
ain
the
low
rat
e of
ado
ptio
n of
fert
ilize
r am
ongs
tfa
rmer
s). W
eedi
ng w
as d
one
with
hoe
and
cul
tivat
or a
nd w
as e
ffici
ent (
06/0
3/95
). T
he u
se o
f the
culti
vato
r w
as fa
cilit
ated
by
the
wid
e ro
w s
paci
ng. T
he P
lant
Pro
tect
ion
Div
isio
n sp
raye
d ag
ains
t cor
ncr
icke
ts a
nd a
rmy
wor
m o
n 13
/04/
95, u
sing
alp
ham
etrio
n.
visi
t 04/
05/9
5
On
27/0
4/95
a h
ails
torm
occ
urre
d, w
hich
cau
sed
hard
ly a
ny d
amag
e to
the
crop
. Pla
nts
on th
e fe
rtili
zed
plot
look
ed s
light
ly b
ette
r th
an th
e co
ntro
l plo
t: m
ore
leav
es a
nd th
icke
r st
ems.
The
cro
p st
and
on th
eco
ntro
l plo
t vva
s ra
ther
ope
n. P
lant
s on
bot
h pl
ots
wer
e so
mew
hat s
tunt
ed, a
ppro
xim
atel
y 1
m h
igh.
Moi
stur
e st
ress
mus
t hav
e oc
curr
ed d
urin
g th
e ve
geta
tive
stag
e, b
ecau
se h
ardl
y an
y til
lerin
g ob
serv
ed

The
farm
er c
arrie
d ou
t an
early
plo
ughi
ng o
pera
tion
to lo
osen
the
soil,
on
half
of b
oth
tria
l plo
ts. P
loug
hing
was
don
e on
13/
12/9
4 af
ter
15 m
m o
f rai
n on
09/
12/9
4. P
loug
hing
was
poo
rly d
one
and
a lo
t of s
tove
rw
as le
ft on
the
surf
ace
. The
tops
oil w
as o
nly
moi
st e
noug
h fo
r pl
antin
g on
30/
12/9
4, a
fter
a ra
infa
ll ev
ent
of 2
2 m
m o
n 27
/12/
94. G
erm
inat
ion
took
pla
ce 7
day
s af
ter
plan
ting.
A fe
rtili
zer
hopp
er m
ount
ed o
n th
e pl
ante
r w
as u
sed,
whi
ch in
itial
ly d
id n
ot fu
nctio
n w
ell,
and
fert
ilize
rw
as s
pille
d th
roug
h cr
acks
and
was
vis
ible
on
the
surf
ace
at th
e st
art o
f som
e of
the
row
s.
Pla
nt d
evel
opm
ent w
as fa
irly
unev
en, w
ith p
lant
s in
diff
eren
t sta
ges
of d
evel
opm
ent.
Thi
s an
d qu
iteun
even
in-r
ow p
lant
spa
cing
s m
ay b
e at
trib
uted
to p
oor
plan
ting:
see
ds d
ropp
ed in
gro
ups
or n
ot a
t all
over
a fe
w m
eter
s, a
nd ir
regu
lar
plan
ting
dept
hs o
ccur
red.
Une
ven
germ
inat
ion
of s
eeds
duo
to d
iffer
ent
soil
moi
stur
e an
d te
mpe
ratu
re c
ondi
tions
res
ulte
d fr
om p
lant
ing
at ir
regu
lar
dept
hs. A
firs
t ger
min
atio
nw
as o
bser
ved
afte
r 54
mm
of r
ain
on 1
1-13
/01/
95; a
sec
ond
germ
inat
ion
phas
e w
as n
oted
afte
r 30
mm
of r
ain
on 3
0/01
/95.
The
farm
er e
xpla
ined
the
unev
en in
-row
pla
nt s
paci
ngsa
s a
resu
lt of
moi
stur
e st
ress
,w
hich
kill
ed s
eedl
ings
whi
ch h
ad a
ctua
lly g
erm
inat
ed in
the
gaps
. The
dea
d se
edlin
gs h
ave
sinc
e be
ensw
ept a
way
by
win
d an
d w
ater
ero
sion
. Thi
s ex
plan
atio
n se
ems
quite
like
ly, b
ecau
se o
f the
dry
spe
llsin
Jan
uary
of 2
wee
ks a
nd in
Feb
ruar
y of
3 w
eeks
.
The
wee
d bu
rden
was
less
in th
e no
n-fe
rtili
zed
plot
12-
3 %
), th
an in
the
fert
ilize
d pl
ot 1
10 %
at p
lace
s).
The
farm
er s
tart
ed w
eedi
ng 3
0 da
ys a
fter
plan
ting
on 0
1/02
/95
and
finis
hed
the
first
ope
ratio
n on
10/0
2/95
. A s
econ
d w
eedi
ng o
pera
tion
was
con
duct
ed fr
om 0
1-07
/03/
95. T
he fa
rmer
hire
d la
bour
tow
eed
his
own
field
. Fin
ally
, a v
ery
even
rip
enin
g w
as o
bser
ved;
pla
nts
had
larg
e he
ads
and
only
1 %
of
',Ile
ne"
was
har
vest
ed.
A m
otiv
ated
farm
er, w
ho li
ves
next
to h
is fi
eld.
He
has
part
icip
ated
in th
e N
atio
nal T
illag
e T
rials
and
inA
Ds
varie
ty e
xper
imen
ts. N
o ra
infa
ll re
ceiv
ed in
Nov
embe
r; h
e on
ly r
ecor
ded
20 m
m o
n 27
/12/
94. H
epl
ough
ed a
nd p
lant
ed s
oon
here
afte
r on
02/
01/9
5 an
d 04
/01/
95, r
espe
ctiv
ely.
The
5 d
ays
betw
een
rain
fall
and
plou
ghin
g w
ere
spen
t on
wor
king
on
his
own
field
. Ger
min
atio
n w
as q
uite
eve
n an
d to
ok p
lace
14 d
ays
afte
r pl
antin
g. T
his
may
be
attr
ibut
ed to
a lo
w s
oil m
oist
ure
cont
ent,
as th
e ne
xt s
ubst
antia
lra
infa
ll ev
ent w
as 3
1 m
m o
n 14
/01/
95. T
his
rain
see
ms
to h
ave
trig
gere
d ge
rmin
atio
n on
18/
01/9
5.
Fer
tiliz
ed p
lant
s lo
oked
gre
ener
, big
ger
and
mor
e ad
vanc
ed in
dev
elop
men
t tha
n th
e co
ntro
l pla
nts
thro
ugho
ut. T
he fi
rst w
eedi
ng o
pera
tion
was
fini
shed
on
18/0
2/95
, 45
days
afte
r pl
antin
g. T
he fa
rmer
was
hes
itant
to w
eed
too
early
, whe
n th
e so
il w
as d
ry a
nd th
e te
mpe
ratu
re h
igh,
in o
rder
to a
void
scor
chin
g pl
ants
with
hot
soi
l. S
o a
few
mor
e sh
ower
s w
ere
awai
ted.
The
wee
d bu
rden
was
hig
her
in th
efe
rtili
zed
plot
, pro
babl
y du
e to
the
use
of fe
rtili
zer
and
a se
cond
wee
ding
ope
ratio
n w
as d
eem
ed n
eces
sary
and
cond
ucte
d fr
om 0
4-11
/03/
95.
Aro
und
09/0
3/95
a b
ig d
iff e
renc
es in
cro
p st
and
had
deve
lope
d. E
spec
ially
in th
e fe
rtili
zed
plot
, pat
ches
of p
lant
s in
dep
ress
ions
wer
e st
unte
d an
d un
der
moi
stur
e st
ress
. The
farm
er a
ttrib
uted
this
to d
iffer
ence
sin
soi
l typ
e.T
he P
lant
Pro
tect
ion
Div
isio
n sp
raye
d th
e tr
ial p
lots
and
the
farm
er's
fiel
d ag
ains
t cor
n cr
icke
ts a
nd a
rmy
wor
m w
ith a
lpha
met
rion
on 0
2104
/95.
visi
t 04/
05/9
5
The
fert
ilize
d pl
ants
wer
e hi
gher
(ap
prox
imat
ely
1.0
m)
and
had
thic
ker
stem
s th
an th
e co
ntro
l plo
t (pl
ants
60-8
0 cm
hig
h). T
he fe
rtili
zed
plan
ts h
ad d
evel
oped
on
aver
age
two
tille
rs p
er p
lant
. Bird
pro
blem
s w
ere
still
lim
ited
13 %
dam
age)
and
con
trol
led
by s
trin
gs w
ith e
mpt
y tin
s fil
led
with
peb
bles
.
pH-I
-120
EC
org
CC
EC
Ca
Mg
KN
aP
BS
carb
o
6.2
i0.
00.
33
1.7
0.5
0.3
0.0
183
0.0
K6
KA
NN
GW
EM
r K
eele
diw
e K
osiw
eA
LDE
P m
odel
IIK
7 M
MA
TH
ET
HE
Mr
Nga
ka K
gotla
etsh
oA
LDE
P m
odel
I
top
soil
text
ure:
coa
rse
drai
nage
: wel
l dra
ined
soil
dept
h: 6
0 cm
top
soil
text
ure:
coa
rse
drai
nage
: wel
l dra
ined
soil
dept
h: 6
0 cm
fert
ilize
d pl
ot:
num
ber
of r
ows:
61
plan
t den
sity
: 24,
400
pi/h
afe
rtili
zed
plot
:nu
mbe
r of
row
s: 5
9pl
ant d
ensi
ty: 2
9,50
0 pl
/ha
cont
rol p
lot:
num
ber
of r
ows:
53
plan
t den
sity
: 13,
600
pl/h
aco
ntro
l plo
t:nu
mbe
r of
row
s: 5
9pl
ant d
ensi
ty: 3
0,00
0 pl
/ha
yiel
d fe
rtili
zed
plot
:10
10 k
g/ha
CY
SLA
MB
pre
dict
ion:
970
kg/
hayi
eld
fert
ilize
d pl
ot:
350
kg/h
eC
YS
LAM
B p
redi
ctio
n: 1
440
kg/h
a
yiel
d co
ntro
l plo
t:46
0 kg
/ha
CY
SLA
IVIB
pre
dict
ion:
430
kg/
hayi
eld
cont
rol p
lot:
170
kg/h
aC
YS
LAM
B p
redi
ctio
n: 1
070
kg/h
a
plot
siz
e: 0
.25
hasl
ope:
10
UT
M p
ositi
on: 3
2769
2E 7
2035
58N
soilt
ype:
Are
ni-F
erri-
Dys
tric
Reg
osol
AW
HC
: 60
mm
/mP
hosp
horu
s co
nten
t top
soil:
4.0
ppm
fert
ilize
r ty
pe:
sing
le s
uper
phos
phat
eap
plic
atio
n ra
te: 2
10 k
g/ha
tops
oil a
naly
sis
cont
rol p
lot:
plot
siz
e: 0
.25
hasl
ope:
0-1
°U
TM
pos
ition
: 304
750E
718
1760
Nso
iltyp
e: C
hrom
ic L
uvis
olA
WH
C: 6
0 m
m/m
Pho
spho
rus
cont
ent t
opso
il: 0
.7 p
pmfe
rtili
zer
type
:si
ngle
sup
erph
osph
ate
appl
icat
ion
rate
: 325
kg/
ha
tops
oil a
naly
sis
cont
rol p
lot:
pH-H
PE
Cor
g C
CE
CI
Ca
Mg
Na
IP
BS
carb
o
5.5
0.0
0.3
1.8
0.5
0.1
0.2
0.0
440.
0

tops
oil a
naly
sis
cont
rol p
lot:
The
farm
er h
as b
een
livin
g on
the
field
sin
ce th
e st
art o
f the
cro
ppin
g se
ason
. The
fiel
d is
ver
y sa
ndy
and
win
d er
osio
n w
as a
rna
jor
cons
trai
nt. P
loug
hing
was
don
e fr
om 3
0/12
/94-
03/0
1195
, fol
low
ing
a ra
infa
llev
ent o
f 22
mm
on
26/1
2/94
. The
tops
oil m
oist
ure
cont
ent w
as to
o lo
w fo
r pl
antin
g. P
lant
ing
was
done
on 1
4/01
/95,
follo
win
g a
34 m
m o
f rai
n on
11-
12/0
1/95
. Ger
min
atio
n w
as r
ecor
ded
on20
/01/
95, 6
day
s
atte
r pl
antin
g.
A d
ry s
pell
of 2
1 da
ys in
com
bina
tion
with
win
d er
osio
n w
as d
etrim
enta
l to
plan
t gro
wth
. See
dlin
gs w
ere
burie
d un
der
sand
, soi
l tem
pera
ture
s in
crea
sed
and
root
s w
ere
expo
sed;
mos
t pla
nts
in th
e co
ntro
l plo
tdi
ed a
nd w
ere
swep
t a v
va y
by
the
win
d, c
ausi
ng a
ver
y lo
w p
lant
den
sity
. On
01/0
2/95
win
d de
posi
tion
mad
e th
e pl
ot lo
ok n
ot p
loug
hed.
The
f ew
sur
vivi
ng p
lant
s vv
ere
behi
nd in
dev
elop
men
t in
com
paris
on to
the
plan
ts o
n th
e fe
rtili
zed
plot
, vvh
ich
seem
ed to
hav
e be
en s
tren
gthe
ned
by th
e fe
rtili
zer.
The
surv
ival
rate
in th
e fe
rtili
zed
plot
was
4 ti
mes
as
high
as
on th
e co
ntro
l plo
t. C
attle
ent
ered
the
field
and
dam
aged
appr
oxim
atel
y 12
.5 %
of t
he p
lant
a.
tops
oil a
naly
sis
cont
rol p
lot:
The
farm
er li
ves
next
to th
e fie
ld; t
he tr
ial p
lots
are
loca
ted
on th
e ed
ge o
f a p
an w
ith a
pet
roca
lcic
horiz
on a
t app
roxi
mat
ely
80 c
m. P
loug
hing
/pla
ntin
gwas
don
e on
29-
30/1
2/94
, im
med
iate
lyaf
ter
a ra
infa
llev
ent o
f 29
mm
on
27-3
0/12
/94.
Win
d er
osio
n an
d de
posi
tion
was
sev
ere,
and
mad
e th
e fie
ld lo
ok n
otpl
ough
ed. T
he w
eed
cove
r (c
ompa
red
to o
ther
tria
ls in
Sou
ther
n R
egio
n/ w
as h
igh
and
amou
nted
8 %
on
the
fert
ilize
d an
d 5
% o
n th
e co
ntro
l plo
t. T
he m
ost d
omin
ant w
eeds
wer
e C
ynod
on d
acty
lon
(in p
atch
es,
clea
rly b
enef
ittin
g fr
om fe
rtili
zer)
, Hel
iotr
opiu
m s
teud
neri
I" w
hite
head
") a
nd s
ome
Tyl
osem
a es
cule
nrim
("m
oram
a be
an"l.
The
farm
er d
id a
goo
d fir
st w
eedi
ng jo
b fr
om 0
1-14
/02/
95 a
nd c
ondu
cted
a s
econ
dop
erat
ion
from
13-
23/0
3/95
. The
tria
l site
was
onl
y cu
ltiva
ted
durin
g th
e cr
oppi
ng s
easo
n 19
92/9
3,w
hich
cou
ld e
xpla
in th
e hi
gh w
eed
burd
en. T
he fa
rmer
had
del
ayed
wee
ding
, to
prot
ect t
he s
eedl
ings
agai
nst w
ind
eros
ion.
An
adja
cent
fiel
d, w
hich
was
wee
ded
earli
er, w
as p
ract
ical
ly fr
ee o
f wee
ds, b
ut h
adve
ry p
oor
germ
inat
ionl
esta
blis
hmen
trat
es, d
ue to
win
d er
osio
n. D
ue to
the
wee
d pr
essu
re, o
pen
patc
hes
vver
e ob
serv
ed in
bot
h fe
rtili
zed
and
cont
rol p
lots
. How
ever
, a c
lear
diff
eren
ce b
etw
een
fert
ilize
d an
dco
ntro
l pla
nts
was
not
iced
all
the
time,
with
f er
tiliz
ed p
lant
s lo
okin
g gr
eene
r, b
igge
r an
d fu
rthe
r de
velo
ped
than
the
cont
rol p
lot p
lant
s. T
he p
lant
den
sity
of t
he fe
rtili
zed
plot
vva
s hi
gher
, tha
n th
at o
f the
con
trol
plot
.
visi
t 04/
05/9
5
The
fert
ilize
d pl
ants
vve
re 1
-1.6
0 m
hig
h, w
ere
slig
htly
bet
ter
deve
lope
d an
d ha
d th
icke
r st
ems
than
the
cont
rol p
lant
s. A
n av
erag
e of
3 ti
llers
had
dev
elop
ed p
er p
lant
on
the
fert
ilize
d pl
ot a
nd o
ccas
iona
llytil
lerin
g oc
curr
ed o
n co
ntro
l plo
t. F
ertil
ized
hea
ds w
ere
med
ium
-larg
e, fl
ower
ing,
gra
in fi
lling
and
som
erip
enin
g. C
ontr
ol p
lant
s ha
d m
ediu
m s
ize
head
s, a
nd w
ere
flow
erin
g to
gra
in fi
lling
. Som
e co
rn c
ricke
tsw
ere
obse
rved
, but
they
cau
sed
min
imal
dam
age
to th
e de
velo
ped
head
s. A
lthou
gh th
is s
ite r
ecei
ved
alo
w a
mou
nt o
f tot
al r
ainf
all (
59 %
of t
he a
vera
ge),
a r
elat
ivel
y go
od y
ield
was
ach
ieve
d. T
wo
phen
omen
am
ay h
ave
play
ed a
rol
e: d
ueto
the
slop
e of
the
field
som
e ru
n-on
may
hav
e oc
curr
ed a
nd th
e co
mbi
natio
nof
a s
andy
soi
l tex
ture
and
a p
etro
-cal
cic
horiz
on m
ay h
ave
kept
soi
l moi
stur
e lo
nger
ava
ilabl
e fo
r th
e pl
ant
root
s.pH-H
20E
Cor
g C
CE
CC
aM
gK
Na
PB
Sca
rbo
8.2
0.1
0.7
14.7
16.1
¡0.6
0.2
0.0
>10
00.
0
pH-F
120
EC
org
CC
EC
Ca
Mg
KN
aP
BS
carb
o
6.8
0.0
0.3
21.
60.
00,
10.
085
1.9
K8
GA
SIT
AM
r R
. Tau
nyan
aA
LDE
P m
odel
IIK
9S
ES
EM
r Jo
hn S
eam
okw
ena
ALD
EP
mod
el I
plot
siz
e: 0
.25
hasl
ope:
1°
UT
M p
ositi
on: 2
8668
3E 7
2199
96N
plot
siz
e: 0
.25
hasl
ope:
2°
UT
M p
ositi
on: 2
7865
7E 7
2715
26N
soilt
ype:
Luv
ic A
reno
sol
soilt
ype:
Are
ni-P
etric
Cal
ciso
l
AV
VH
C: 7
0 m
m/m
Pho
spho
rus
cont
ent t
opso
il: 0
.6 p
pmA
WH
C: 7
0 m
m/m
Pho
spho
rus
cont
ent t
opso
il: 1
,5 p
pm
fert
ilize
r ty
pe:
sing
le s
uper
phos
phat
eap
plic
atio
n ra
te: 3
29 k
g/ha
fert
ilize
r ty
pe:
sing
le s
uper
phos
phat
eap
plic
atio
n ra
te: 2
99 k
g/ha
top
soil
text
ure:
coa
rse
drai
nage
: s, e
xc.
soil
dept
h: 7
0 cm
top
soil
text
ure:
coa
rse
drai
nage
: wel
l dra
ined
soil
dept
h: 8
5 cm
fert
ilize
d pl
ot:
num
ber
of r
ows:
47
plan
t den
sity
: 12,
600
pi/h
afe
rtili
zed
plot
:nu
mbe
r of
row
s: 4
7pl
ant d
ensi
ty: 1
9,20
0 pi
/ha
cont
rol p
lot:
num
ber
of r
ows:
47
plan
t den
sity
: 3,6
00 p
i/ha
cont
rol p
lot:
num
ber
of r
ows;
47
plan
t den
sity
: 15,
400
pl/h
a
yiel
d fe
rtili
zed
plot
:48
0 kg
/ha
CY
SLA
MB
pre
dict
ion:
920
kg/
hayi
eld
fert
ilize
d pl
ot:
670
kg/h
aC
YS
LAM
B p
redi
ctio
n: 1
470
kg/h
a
yiel
d co
ntro
l plo
t:fa
iled
CY
SLA
MB
pre
dict
ion:
440
kg/
hayi
eld
cont
rol p
lot:
660
kg/h
aC
YS
LAM
B p
redi
ctio
n:71
0 kg
/ha

K10
MO
NG
WA
LALE
plot
siz
e: 0
.25
haso
iltyp
e: F
erric
Luv
isol
AW
HC
: 130
mm
/mfe
rtili
zer
type
:
tops
oil a
naly
sis
cont
rol p
lot:
The
fiel
d is
situ
ated
app
roxi
mat
ely
1-2
km a
way
from
the
farm
er's
hou
se. P
loug
hing
was
don
e fr
om31
/12/
94-0
5/01
/95
afte
r a
rain
fall
even
t of 4
3 m
m d
urin
g 26
-30/
12/9
4. D
ue to
the
poor
con
ditio
n of
the
donk
eys
and
the
fact
that
the
farm
er p
loug
hed
a la
rger
are
a th
an ju
st th
e tr
ial p
lots
, plo
ughi
ng to
ok 6
days
. Ger
min
atio
n oc
curr
ed 6
day
s af
ter
plan
ting
and
plan
t dev
elop
men
t was
rel
ativ
ely
even
. Ini
tially
the
fert
ilize
d pl
ants
look
ed b
ette
r, la
ter
a hi
gh w
eed
burd
en a
nd p
ossi
bly
a di
ffere
ncei
n so
il ty
pe s
low
ed d
own
the
deve
lopm
ent i
n th
e fe
rtili
zed
plot
. Pla
nts
in th
e co
ntro
l plo
t wer
e lo
okin
g m
ore
heal
thy
and
the
plan
tst
and
was
den
ser.
Thi
s pi
ctur
e ch
ange
d af
ter
a w
eedi
ng o
pera
tion
was
con
duct
ed;th
e m
ain
wee
d in
the
fert
ilize
d pl
ot, w
ithat
pla
ces
a gr
ound
cov
er o
f 10
% w
as C
ynod
on d
acty
lon.
On
06/0
3/95
the
plan
ts o
f the
fert
ilize
d pl
otlo
oked
mor
e de
velo
ped
than
the
cont
rol p
lot.
visi
t 04/
05/9
6
The
fert
ilize
d pl
anta
wer
e 0.
80-1
.20
m h
igh,
and
had
dev
elop
ed 2
-4 ti
llers
per
pla
nt. T
he h
eads
wer
e w
ell
form
ed, s
ome
wer
e 30
-40
cm lo
ng; t
he m
ajor
ity w
as fl
ower
ing
and
grai
n fil
ling,
som
e rip
enin
g. O
n th
eco
ntro
l plo
t, pl
ants
wer
e sl
ight
ly th
inne
r, 6
0-80
cm
hig
h, le
ss w
ell d
evel
oped
and
har
dly
any
tille
ring
occu
rred
. Bird
sca
ring
by th
e fa
rmer
see
med
effe
ctiv
e, n
o da
mag
e w
as n
otic
ed.
K11
PIT
SA
NE
plot
siz
e: 0
.25
haso
iltyp
e: F
erric
Luv
isol
AW
HC
: 130
mm
/mfe
rtili
zer
type
:
tops
oil e
naiy
sis
cont
rol p
lot:
Mr
Pet
rus
Chi
diA
LDE
P m
odel
II
slop
e: 1
°U
TM
pos
ition
: 357
174E
717
7028
N
Pho
spho
rus
cont
ent t
opso
il: 1
.3 p
pmsi
ngle
sup
erph
osph
ate
appl
icat
on
rate
: 303
kg/
ha
The
fiel
d is
wel
l fen
ced,
abo
ut 2
km
from
the
farm
er's
hou
se. T
he fa
rmer
trad
ition
ally
use
s co
mpo
st. H
epl
ough
ed b
oth
plot
s on
24/
12/9
4 in
the
first
pla
ntin
g op
port
unity
, afte
r a
rain
fall
even
t of 2
2 m
m o
n16
/12/
94. P
loug
hing
and
pla
ntin
g to
ok a
whi
le, a
s do
nkey
s w
ere
wea
k (a
nd th
e fa
rmer
, who
is V
DC
chai
rman
, was
aw
ay fo
r m
eetin
gs).
Initi
ally
ger
min
atio
n an
d pl
ant d
evel
opm
ent l
ooke
d ve
ry e
ven.
Lat
er,
the
fert
ilize
d pl
anta
look
ed g
reen
er, b
igge
r an
d m
ore
deve
lope
d th
an c
ontr
ol g
roup
. A h
ails
torm
on
06/0
2/95
tota
lly s
hred
ded
leav
es o
f pla
nts,
but
they
rec
over
ed. F
ortu
nate
lyth
e he
ads
wer
e no
t dam
aged
,as
they
wer
e no
t yet
exp
osed
al t
he ti
me.
A n
umbe
r of
bar
e pa
tche
s in
the
fert
ilize
d pl
ot r
educ
ed th
epl
ant d
ensi
ty a
nd fr
om 2
1/02
/95
the
plan
ts in
the
cont
rol p
lot l
ooke
d m
ore
heal
thy.
The
farm
er a
ttrib
uted
the
bare
pat
ches
to s
oil d
iffer
ence
sand
to p
oor
plou
ghin
g, w
hich
he
wou
ld h
ave
liked
to d
o tw
ice
in th
ose
area
s. H
e se
emed
to n
otic
e th
e sa
me
diffe
renc
es e
very
yea
r.
An
aphi
d at
tack
was
con
trol
led
by r
ain
and
the
hail
stor
m. T
he tr
ial p
lots
and
the
farm
er's
fiel
d w
ere
spra
yed
agai
nst s
talk
bor
ers.
Thi
s op
erat
ion
was
car
ried
by 2
peo
ple
from
the
Pla
nt P
rote
ctio
n D
ivis
ion,
usin
g kn
apsa
ck s
pray
ers
and
alph
amet
rion
at a
con
cent
ratio
n of
1:1
000
(120
m1/
1201
). B
irds
beca
me
a
maj
or p
robl
em a
s fr
om 0
1/03
/95,
esp
ecia
lly s
ince
the
farm
er's
cro
p w
as o
ne o
f the
firs
t in
the
area
tore
ach
the
grai
n fil
ling
stag
e. T
he fa
rmer
, how
ever
, was
not
abl
e to
ded
icat
e al
l his
tim
e to
bird
scar
ing,
due
to o
ther
com
rnitm
ents
.
visi
t 04/
05/9
5
The
fert
ilize
d pl
ants
look
ed w
orse
than
con
trol
gro
up; 8
0 cm
hig
h an
d 4-
5 til
lers
per
pla
nt. T
he h
eads
wer
e gr
ain
fillin
g an
d rip
enin
g. O
n th
e co
ntro
l plo
t, th
e pl
ants
look
ed v
ery
heal
thy,
var
ying
in h
eigh
t fro
m60
/100
-150
cm
and
hav
ing
3-4
tille
rs p
er p
lant
. The
y de
velo
ped
med
ium
siz
ed h
eads
of 2
5-35
cm, o
fw
hich
90
% w
as r
ipen
ing.
The
yie
ld o
f the
fert
ilize
d pl
ot s
eem
s to
be
seve
rely
affe
cted
by
the
poor
pla
nt d
evel
opm
ent o
n th
e ba
repa
tche
s.pH-H
pE
Cor
g C
CE
CC
aM
gK
Na
PB
Sca
rbo
6.6
0.0
0.7
5.6
2.4
0.8
0.8
0.0
710.
0
pH-I
-120
EC
org
CC
EC
Ca
Mg
KN
aP
BS
carb
o
6.7
0.0
0.6
9.2
2.2
1.3
1.2
0.0
821.
9
top
soil
text
ure:
med
ium
drai
nage
: wel
l dra
ined
soil
dept
h: 6
0 cm
top
so I
text
ure:
med
ium
drai
nage
: wel
l dra
ined
soil
dept
h: 6
0 cm
fert
ilize
d pl
ot:
num
ber
of r
ows:
56
plan
t den
sity
: 26,
000
pi/h
afe
rtili
zed
plot
:nu
mbe
r of
row
s: 2
6pl
ant d
ensi
ty: 1
5,60
0 pi
/ha
cont
rol p
lot:
num
ber
of r
ows:
56
plan
t den
sity
: 33,
600
pl/h
aco
ntro
l plo
t:nu
mbe
r of
row
s: 2
6pl
ant d
ensi
ty: 3
3,30
0 pl
/ha
yiel
d fe
rtili
zed
plot
:87
0 kg
/ha
CY
SLA
M8
pred
ictio
n: 1
600
kg/h
ayi
eld
fert
ilize
d pl
ot:
760
kg/h
aC
YS
LAM
B p
redi
ctio
n: 9
90 k
g/ha
yiel
d co
ntro
l plo
t:47
0 kg
/ha
CY
SLA
MB
pre
dict
ion:
760
kg/
hayi
eld
cont
rol p
lot:
1290
kg/
haC
YS
LAM
B p
redi
ctio
n: 4
40 k
g/ha
Mrs
Keb
oets
e M
osea
ALD
EP
mod
el I
slop
e: 1
°U
TM
pos
ition
: 337
792E
718
4398
N
Pho
spho
rus
cont
ent t
opso
0.2
ppm
sing
le s
uper
phos
phat
eap
plic
on r
ate:
342
kg/
ha
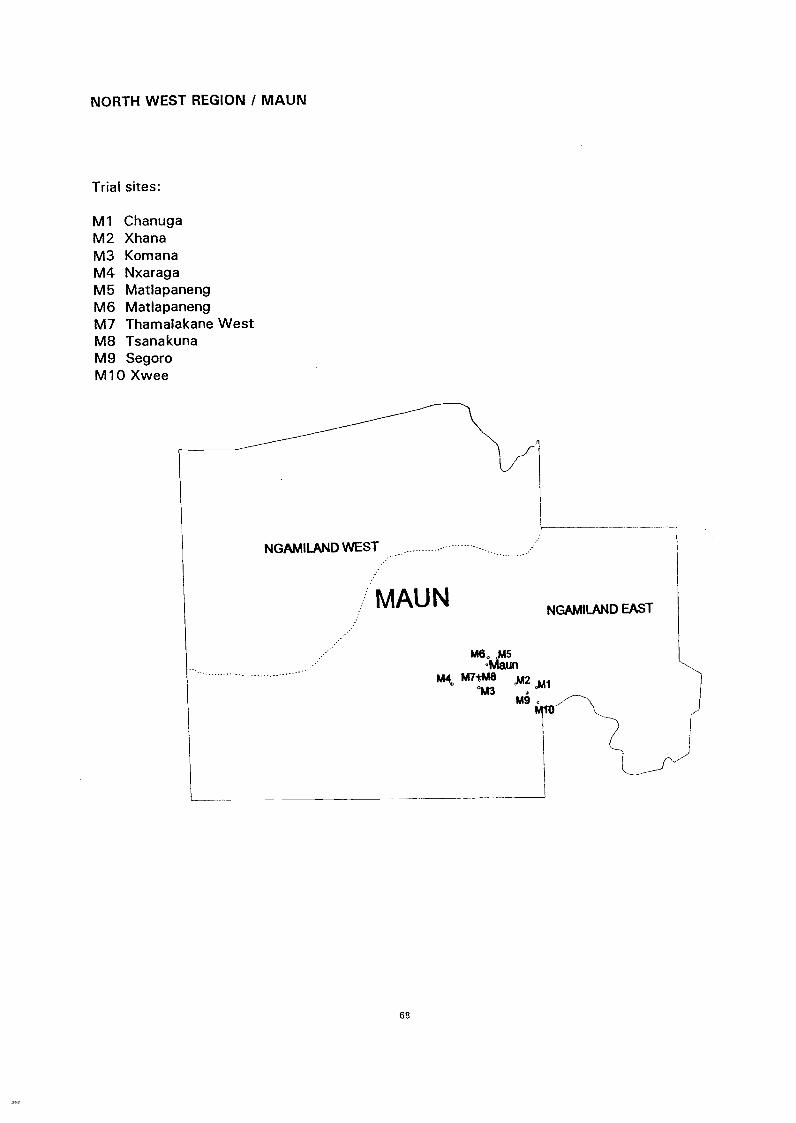
NORTH WEST REGION / MAUN
Trial sites:
M1 ChanugaM2 XhanaM3 KomanaM4 NxaragaM5 MatlapanengM6 MatlapanengM7 Thamalakane WestM8 TsanakunaM9 SegoroM10 Xwee
68

Rainfall data trial sites M2, M7-M9
69
TRIAL SITE M2 Xnana M7 Thamalakane M8 Tsanakuna M9 Segoro
SYNOPTIC STATION Maun Maun Maun Maun
RAINFALL STATION Maun Maun Maun Maun
yearly average 454 mm 454 mm 454 mm 454 mm
01 Nov 1 7 10
02 Nov 10
16 Nov 4 21 12
17 Nov 20 6 15
18 Nov 10
20 Nov 5
21 Nov 1
23 Nov 2
28 Nov 30 3 9
29 Nov 10 7
30 Nov 8 2 14 12
01 Dec 2
27 Dec 10
28 Dec 18
12 Jan 6 10 8
14 Jan 5 10
17 Jan 24 25
18 Jan 13
27 Jan 5
30 Jan 9
02 Feb 9 10 16 3
05 Feb 5 4
08 Feb 6
10 Feb 3 38 41
21 Feb 28 22
23 Feb 2
22 Mar 18
23 Mar 4 20 30 8
24 Mar 1 2
26 Mar 1 2
27 Mar 16 2 2 75
29 Mar 11 1 13
30 Mar 16 14 7
TOTAL 184 171 198 254
% of AVERAGE 41 % 38 % 44% 56 %

Ml C
HA
NU
GA
plot
siz
e: 0
.25
haso
iltyp
e: L
uvic
Are
noso
lA
WH
C: 6
5 m
m/m
fert
ilize
r ty
pe:
tops
oil a
naly
sis
cont
rol p
lot:
Mr.
Gaa
tadi
we
Mod
ise
ALD
EP
mod
el II
slop
e: 0
.5'
UT
M p
ositi
on: 7
7798
7E 7
7719
45N
Pho
spho
rus
cont
ent t
opso
il. 2
.0 p
pmsi
ngle
sup
erph
osph
ate
appl
cat
ion
rate
: 280
kg/
ha
resu
lt:T
rial f
a le
d,
visi
t 31/
10/9
4
A r
aing
auge
was
inst
alle
d; d
onke
ys (
5) a
nd c
attle
(5)
wer
e on
the
field
.
visi
t 02/
12/9
4
34 m
m o
f rai
n on
28-
30/1
1/94
; fer
izin
g do
ne o
n 02
/12/
94; p
loug
hing
sta
rted
on
02/1
2/94
.
vis'
17/
01/9
5
Som
e se
eds
germ
nat
ed s
hort
ly a
fter
plan
ting;
pla
nts
10 c
m h
igh.
Sta
rt o
f sec
ond,
mor
e ge
nera
l,ge
rmin
atio
n ph
ase:
pla
nts
appr
oxim
atel
y 0.
5 cm
hig
h.C
owpe
as p
lant
ed o
n 02
/12/
95 o
n th
e fa
rmer
's o
wn
field
ger
min
ated
wel
l; m
aize
pla
nted
06/
12/9
4re
ache
d 10
-20
cm, b
ut d
ied
afte
r a
dry
spel
l of 3
wee
ks.
visi
t 31/
01/9
5
Ger
min
atio
n on
bot
h pl
ots
poor
, aro
und
20 %
; pla
nt s
tand
s lo
okin
g po
or, n
ot m
uch
diffe
renc
e in
pla
ntde
nsity
bet
wee
n fe
rtili
zed
and
cont
rol p
lot.
Pla
nts
on fe
rtili
zed
plot
slig
htly
talle
r. S
ome
darn
age
by s
mal
lan
telo
pes.
Bot
h th
e fe
rtili
zed
and
the
cont
rol p
lot h
ave
9 %
gro
und
cove
r of
wee
ds (
Trib
ulus
terr
estr
is,
Com
mel
ina
beng
hale
nsis
,Gis
ekia
pha
rnac
eoid
esan
d "d
elel
e", a
kin
d of
veg
etab
le).
visi
t 14/
02/9
5
Goa
ts h
ave
dam
aged
70
% o
f cro
p; th
e re
st w
as s
ever
ely
moi
stur
e st
ress
ed. T
he w
eed
cove
r w
as u
pto
M2
XH
AN
A
plot
siz
e: 0
.25
haso
iltyp
e: H
aplic
Are
noso
lA
WH
C: 6
5 m
m/m
fert
ilize
r ty
pe:
tops
oil a
naly
sis
cont
rol p
lot:
yiel
d fe
rtili
zed
plot
:10
0 he
ads
(max
10%
dam
aged
) -
7.8
kg; s
eedw
eigh
t 1 h
ead
78 g
ram
1 he
ad (
unda
mag
ed)
wei
ghs
78 x
10/
986
.5 g
ram
3 he
ads/
plan
t x 1
700
plan
ts/h
a =
441
.15
kg/h
a 16
.3 b
ags)
4 he
ads/
plan
t x 1
700
plan
ts/h
a =
588
.2 k
g/ha
18.
4 ba
gs)
CY
SLA
MB
pre
dict
ion:
670
kg/
ha
yiel
d co
ntro
l plo
t:fa
led
In o
rder
to c
ompa
re th
e tr
ial y
ield
vvi
th a
CY
SLA
MB
s m
ulat
ion,
the
yiel
d of
the
dam
aged
hea
ds w
asco
nver
ted
into
und
amag
ed w
eigh
t and
an
aver
age
of 4
hea
ds p
er p
lant
was
take
n.
visi
t 25/
10/9
4
A r
aing
auge
was
inst
alle
d,
visi
t 02/
12/9
4
48 m
m o
f rai
n on
28-
30/1
1/94
; far
mer
rea
dy to
sta
rt; t
he T
echn
ical
Offi
cer
judg
ed th
e so
il to
o w
et a
ndm
ade
the
farm
er w
ait;
fert
ilizi
ng w
as d
one
on 0
1/12
/94;
plo
ughi
ng s
tart
ed o
n 02
/12/
94.
visi
t 28/
12/9
4
Poo
r ge
rmin
atio
n du
e to
the
depo
sit o
f 5 c
m o
f san
d bl
own
on th
e pl
ots.
On
the
cont
rol p
lots
onl
y a
few
plan
ts w
ere
obse
rved
, whi
le th
e fe
rtili
zed
plot
had
a s
light
ly h
ighe
r pl
ant d
ensi
ty w
ith w
ell l
ooki
ng p
lant
s,
The
sec
tion
of th
e fa
rmer
's fi
eld
plan
ted
arou
nd 0
1/12
/94
with
sor
ghum
"go
ose-
neck
" va
e y
(sh
ort
25 %
. No
mor
e su
bsta
ntia
l rai
nf a
ll re
ceiv
ed in
the
follo
win
g w
eeks
, hen
ce p
lant
s w
ilted
and
tria
l fai
led.
stem
med
, 90
day
varie
ty),
mill
et a
nd m
elon
s lo
oked
mor
e un
iform
and
hig
her
plan
t den
sity
.
pH-H
20E
Cor
g C
CE
CC
aM
gK
Na
PB
Sca
rbo
7.0
0.1
0.8
4.0
1.7
0.6
0.5
0.1
721.
0
pH-H
pE
Cor
g C
CE
CC
aM
gK
Na
PB
Sca
rbo
7.5
0.1
0.3
1.8
1,3
0.3
0.2
0.0
>10
03.
8
top
soil
text
ure:
coa
rse
drai
nage
: wel
l dra
ined
soil
dept
h: 1
00+
cm
top
soil
text
ure:
coa
rse
drai
nage
: s. e
xc.
soil
dept
h: 1
00 +
cm
fert
ilize
d pl
ot:
num
ber
of r
ows:
66
plan
t den
sity
: 2,0
00 p
l/ha
fert
ilize
d pl
ot:
num
ber
of r
ows:
57
plan
t den
sity
: 1,7
00 p
l/ha
cont
rol p
lot:
num
ber
of r
ows:
66
plan
t den
sity
; 2,1
50 p
l/ha
cont
rol p
lot:
num
ber
of r
ows:
57
plan
t den
sity
:15
0 pl
/ha
Mr.
Seg
otsa
Mak
hiA
LDE
P m
odel
II
slop
e: 0
°U
TM
pos
ition
: 795
629E
776
8639
N
Pho
spho
rus
cont
ent t
opso
I: 2
.2 p
pmsi
ngle
sup
erph
osph
ate
appl
ica
on r
ate:
273
kg/
ha

visi
t 31/
01/9
5
Pla
nts
on th
e fe
rtili
zed
plot
look
ed h
ealth
y, v
aryi
ng in
hei
ght f
rom
15-
55 c
m. S
ome
leav
es a
ffect
ed b
ypo
ssib
ly a
n in
sect
eat
ing
the
chlo
roph
yll o
f the
leav
es, l
eavi
ng d
ry ti
ssue
beh
ind.
Plo
t had
a 3
°/.
wee
dco
ver;
mai
nly
mel
on ty
pe w
eeds
. Con
trol
is a
mer
e fa
ilure
; ver
y fe
w p
lant
of 1
0-20
cm
.
visi
t 09/
02/9
5
Far
mer
's lo
cal s
orgh
um v
arie
ty is
flow
erin
g.
visi
t 20/
02/9
5
Pla
nts
appr
oxim
atel
y 1
m h
igh,
look
ing
heal
thy,
abu
ndan
t till
erin
g. A
roun
d 40
% s
tart
ed to
flow
er.
visi
t 06/
03/9
5
90 %
of p
lant
s flo
enng
on
21/0
2/95
. Fer
tiliz
ed p
lot h
ad 3
0 %
wee
d co
ver,
whi
le th
e co
ntro
l plo
t had
20 %
wee
d co
ver.
visi
t 23/
03/9
5
Hea
ds g
rain
filli
ng; b
ird p
robl
em s
ince
14/
03/9
5. F
arm
er's
wife
and
chi
ldre
n tr
ied
to d
o bi
rd s
carin
g fr
om6a
m to
6pm
, but
had
als
o ot
her
hous
ehol
d du
ties
to fu
lfill,
v si
t 02/
12/9
4
visi
t 28/
03/9
5
Fer
tiliz
ed p
lot:
plan
ts a
re a
bout
1.2
0 m
hig
h, h
eads
are
larg
e (la
rges
t of a
ll tr
ial s
ites
visi
ted)
, 10
%da
mag
ed b
y bi
rds.
App
roxi
mat
ely
20 %
of t
he h
eads
are
rip
enin
g, g
rain
s no
t milk
y an
yrno
re a
nd le
sspr
one
to b
ird d
amag
e.
v si
t 07/
04/9
5
Des
pite
the
bird
sca
ring
effo
rts,
50
% o
f the
pla
nts
for
100
% d
amag
ed, A
s re
ason
for
the
influ
x of
loca
lsp
ecie
s (n
o qu
elea
s) g
iven
by
farm
er's
wife
was
the
shor
tage
of f
low
erin
g gr
asse
s an
d be
rry-
form
ing
shru
bs (
like
Gre
wia
and
Ziz
iphu
s) a
roun
d th
e fie
ld th
is y
ear,
due
to th
e lo
w r
ainf
all.
The
farm
er's
wife
had
star
ted
harv
estin
g an
d dr
ying
mat
ure
head
s (w
ith 1
0 %
bird
dam
aged
) fr
om tr
ial p
lot o
n 04
/04/
95. A
nav
erag
e of
4 h
eads
per
pla
nt is
cou
nted
. Gra
in fi
lling
and
rip
enin
g st
ill c
ontin
ued
for
the
late
r fo
rmed
head
s.
M3
KO
MA
NA
plot
siz
e: 0
.25
haso
iltyp
e: H
aplic
Are
noso
lA
WH
C: 6
5 m
m/m
fert
ilize
r ty
pe:
tops
oil a
naly
sis
cont
rol p
lat:
22 m
m o
f rai
n on
28-
30/1
1/94
; the
farm
er h
ad to
be
loca
ted
in M
aun
by th
e A
D.
visi
t 05/
12/9
4
The
farm
er w
as o
n th
e la
nds,
look
ing
for
his
donk
eys
at th
e tim
e of
the
visi
t. H
e fe
rtili
zed
on 1
3/12
/94
and
plou
ghed
from
13-
15/1
2/94
. The
soi
l moi
stur
e co
nditi
ons
wer
e un
favo
rabl
e fo
r pl
antin
g, s
o th
e ne
xtop
port
unity
had
to b
e aw
aite
d.
visi
t 18/
01/9
5
19 m
m o
f rai
n on
12-
13/0
1/95
; the
farm
er h
arro
wed
with
Aca
cia
tree
on
13/0
1/95
and
pla
nted
on
14/0
1/95
.
visi
t 31/
01/9
5
visi
t 20/
04/9
5A
lthou
gh 7
8 m
m o
f rai
n be
twee
n 12
/01-
10/0
2/95
no
germ
inat
ion
took
pla
ce a
nd th
e tr
ial f
aile
d. N
oge
rmin
atio
n to
ok p
lace
on
the
farm
er's
ow
n fie
ld e
ither
. The
trai
l plo
ts w
ere
cove
red
by 3
% o
f wee
ds.
Ear
lier
ripen
ed h
eads
sev
erel
y da
mag
ed b
y bi
rds,
upt
o 10
0 %
. Las
t hea
ds s
till g
rain
filli
ng a
nd r
ipen
ing.
Bird
s se
em le
ss a
ctiv
e at
the
time
of th
is v
isit;
they
see
med
to h
ave
spre
ad. H
arve
sted
and
drie
d (1
0 %
dam
aged
) he
ads
wer
e ke
pt in
a d
rum
, and
wer
e th
resh
ed o
n 22
/04/
95,
pH-H
PE
Cor
g C
CE
CC
aM
gK
Na
PB
Sca
rbo
6.8
0.1
0.4
2.8
2.0
0.3
0.3
0.1
960.
0
top
sod
text
ure:
coa
rse
drai
nage
: s. e
xc.
soil
dept
h: 1
00*
cm
resu
lt:T
rial f
aile
d.
visi
t 01/
11/9
4
A r
a ng
auge
was
inst
alle
d.
Mr,
Loa
bo J
ohan
nes
ALD
EP
mod
el II
slop
e: 4
-5°
UT
M p
ositi
on: 7
4566
6E 7
7736
43N
Pho
spho
rus
cont
ent t
opso
i6.
0 pp
msi
ngle
sup
erph
osph
ate
appl
icat
ion
rate
: 210
kg/
ha

M4
NX
AR
AG
A
plot
siz
e: 0
.25
haso
iltyp
e: H
aplic
Are
noso
lA
WH
C: 6
5 m
m/m
fert
ilize
r ty
pe:
top
soil
text
ure:
coa
rse
resu
lt:T
rial t
erm
tnat
ed.
visi
t 24/
10l9
4
Ms.
Ren
osi M
otsa
mai
ALD
EP
mod
el I
slop
e: 1
°U
TM
pos
iton:
723
320E
777
3022
N
Pho
spho
rus
cont
ent t
opso
il: 4
.6 p
pmsi
ngle
sup
erph
osph
ate
appl
icat
ion
rate
89 k
g/ha
tops
oil a
naly
sis
cont
rol p
lot:
resu
lt:T
rial t
erm
inat
ed.
vis
02/1
2/94
21 m
m o
f rai
n on
28-
30/1
1/94
; far
mer
was
rel
ucta
nt to
sta
rt.
visi
t 06/
1219
4
Far
mer
was
org
aniz
ing
donk
eys
to b
orro
w; h
e di
d no
t man
age
in ti
me
and
faile
d to
ben
efit
from
this
firs
tF
emal
e he
aded
hou
seho
ld. A
rai
ngau
ge w
as in
stal
led;
don
keys
wer
e on
the
field
. The
tria
l plo
ts w
ere
plan
ting
oppo
rtun
ity,
plou
ghed
with
hire
d la
bour
on
12-1
4/12
/94.
drai
ne;
s. e
xc.
soil
dept
h: 1
00cm
20 m
m o
f rai
n on
12/
01/9
5; th
e ch
ildre
n w
ent b
ack
to s
choo
l, th
e si
ster
of t
he fa
rmer
was
bre
ast f
eedi
ng,
so s
he h
ired
two
man
to p
loug
h he
r ow
n fie
ld.
Har
row
ing
was
don
e by
hire
d la
bour
on
18-1
9/01
/95;
the
AD
judg
ed th
e so
I m
oist
ure
as to
o lo
w a
ndad
vise
d fa
rmer
not
to p
loug
h an
d pl
ant (
this
aga
inst
the
inst
ruct
ions
of t
he A
LUP
team
), N
o pl
antin
gop
port
unity
occ
urre
d an
ymor
e be
fore
the
end
of J
anua
ry, s
o th
e tr
ial w
as te
rmin
ated
.
M5
MA
TLA
PA
NE
NG
plot
siz
e: 0
.25
haso
iltyp
e: H
aplic
Luv
isol
AW
HC
: 72.
5 m
m/m
fert
ilize
r ty
pe:
visi
t 26/
10/9
4
A r
aing
auge
was
inst
alle
d.
visi
t 18/
01/9
5vi
sit 1
8/01
/95
Mr.
Sel
awe
Saw
ete
ALD
EP
mod
el
slop
e: 1
-2°
UT
M p
ositi
on: 7
6243
4E 7
7938
44N
Pho
spho
rus
cont
ent t
opso
il: 9
.2 p
pmsi
ngle
sup
erph
osph
ate
appl
ica
on r
ate:
28
kg/h
a
Alth
ough
aw
aitin
g en
ough
rai
nfal
l, fa
rmer
hire
d tw
o m
en to
plo
ugh
a pa
rt o
f his
ow
n fie
ld a
nd th
e tw
otr
ial p
lots
on
16-1
8/01
/95.
No
plan
ting
oppo
rtun
ity o
ccur
red
anym
ore
befo
re e
nd o
f Jan
uary
, so
the
tria
lw
as te
rmin
ated
.
pH-H
20E
Cor
g C
CE
CC
aM
gK
Na
PB
Sca
rbo
5.8
0.1
1.7
3.8
2.6
0.3
0,2
0.0
821.
0

M6
MA
TLA
PA
NE
NG
plot
siz
e: 0
.25
haso
iltyp
e: H
aplic
Are
noso
lA
WH
C: 6
5 m
mim
fert
ilize
r ty
pe:
tops
o I a
naly
sis
cont
rol p
lot:
top
soil
text
ure:
coa
rse
resu
lt:T
rial f
aile
d.
v si
t 26/
10/9
4
A w
as r
aing
auge
inst
alle
d.
visi
t 02/
12/9
4
drai
nage
: s. e
xc.
soil
dept
h: 1
00+
cm
22 m
m o
f rai
n on
29-
30/1
1/94
; the
farm
er s
tart
ed lo
okin
g fo
r hi
s do
nkey
s on
01/
12/9
4; fo
und
four
on
02/1
2/94
and
fert
ilize
d on
02/
12/9
4. H
e pl
ough
ed fr
om 0
4-07
/12/
94, h
arro
wed
on
08/1
2/94
and
pla
nted
on 0
9/12
/94.
v si
t 18/
01/9
5
No
germ
inat
ion
had
occu
rred
; mod
erat
e w
ind
eros
on
and
depo
sitio
n ob
serv
ed o
n th
e tr
ial p
o s
. The
farm
er h
ad n
ot p
loug
hed
yet o
n hi
s ow
n fie
ld.
visi
t 31/
01/9
5
The
tria
l plo
ts w
ere
cove
red
by a
thin
laye
r of
san
d (a
ppro
x m
atel
y 5
cm);
no
germ
inat
ion;
wee
d co
ver
10 %
. Tria
l fai
led.
Por
tion
of fa
rmer
s fie
ld p
loug
hed
by tr
acto
r, n
o ge
rmin
atio
n ob
serv
ed th
ere
eith
er.
M7
TH
AM
ALA
KA
NE
WE
ST
plot
siz
e: 0
.25
haso
iityp
e: H
aplic
Are
noso
lA
WH
C: 6
5 m
m/m
fert
ilize
r ty
pe:
tops
oil a
naly
sis
cont
rol p
lot:
top
soil
text
ure:
coa
rse
fert
ilize
d pl
ot:
cont
rol p
lot:
resu
lt:T
rial f
aile
d.
visi
t 09/
12/9
4
Ms.
S. D
ikol
eA
LDE
P m
odel
I
slop
e: 1
-2°
UT
M p
o'o
n: 7
4658
9E 7
7756
99N
Pho
spho
rus
cont
ent t
opso
il: 1
.2 p
pmsi
ngle
sup
erph
osph
ate
appl
icat
ion
rate
: 308
kg/
ha
Fem
ale
head
ed h
ouse
hold
.Aw
aitin
gsuf
fic e
ntra
n, t
he fa
rmer
did
fert
ilize
on
06/1
2/94
and
the
plot
s vv
ere
plou
ghed
from
07-
09/1
2/95
by
her
sons
.
vis
18/0
1195
24 m
m o
f rai
n on
17/
01/9
5; h
arro
win
g w
as d
one
on 1
8-19
/01/
95 a
nd p
lant
ing
on 2
0/01
/95.
visi
t 31/
01/9
5
Ger
min
atio
n to
ok p
lace
on
27/0
1/95
. Pla
nts
2-6
cm h
igh
and
look
ing
reas
onab
le.W
eed
cove
r w
as 1
%.
Cow
peas
on
the
tria
l of t
he C
rop
Pro
duct
ion
Offi
cer
(CP
O)
had
not y
et g
erm
inat
ed, w
hils
t the
y w
ere
plan
ted
a da
y af
ter
our
tria
l. F
arm
er's
sor
ghum
, pla
nted
bef
ore
Chr
istm
as, w
as s
ever
ely
moi
stur
e st
ress
ed.
visi
t 14/
02/9
5
Pla
nts
look
ed h
ealth
y on
bot
h pl
ots,
but
slig
htly
sm
alle
r on
the
fert
ilize
d pl
ot; m
aybe
due
to la
tera
lsu
bsur
face
flow
of w
ater
from
fert
ilize
d to
con
trol
plo
t (si
tuat
ed s
light
ly lo
wer
). W
eed
cove
r w
as 3
0 °/
ii;a
wee
ding
ope
ratio
n w
as c
ondu
cted
on
13,1
5-16
/02/
95.
Far
mer
's s
orgh
um a
nd b
eans
see
med
rec
over
ed fr
om m
oist
ure
stre
ss, a
nd lo
oked
wel
l; ho
wev
er, w
eed
cove
r 60
°hi
. Cow
pea
tria
l of t
he C
PO
ger
min
ated
on
07/0
2/95
, the
pla
nts
wer
e w
ell e
stab
lishe
d.
visi
t 20/
02/9
5
Pla
nts
appr
oxim
atel
y 20
cm
hig
h, m
oder
atel
y m
oist
ure
stre
ssed
and
si g
htly
affe
cted
by
aph
ds.
pH-H
20E
Cor
g C
CE
CC
aM
gK
Na
PB
Sca
rbo
7.0
0.1
0.5
3.2
1.7
0.4
0.2
0.0
720.
0
pH-H
20E
Cor
g C
CE
CC
aM
gK
Na
PB
Sca
rbo
6.2
0.0
0.3
2.6
1.6
0.3
0.2
0.0
814.
8
Mr.
Kad
isa
Kad
isa
ALD
EP
mod
el II
slop
e: 1
-2°
UT
M p
ositi
on: 7
5438
6E 7
7943
90N
Pho
spho
rus
cont
ent t
opso
3.0
ppm
sing
le s
uper
phos
phat
eap
plic
atio
n ra
te: 2
45 k
g/ha
drai
nage
: s. e
xc.
soil
dept
h: 1
00 +
cm
num
ber
of r
ows:
56
plan
t den
sity
: 3,9
50 p
l/ha
num
ber
of r
ows:
56
plan
t den
sity
: 4,1
50 p
l/ha

visi
t 28/
03/9
5
Live
stoc
k ha
d en
tere
d th
e fie
ld a
nd d
amag
ed tr
ial c
rops
for
appr
oxim
atel
y75
%. T
he p
lant
s on
the
cont
rol
plot
wer
e ap
prox
imat
ely
70 c
m h
igh
and
look
ed a
ffect
ed b
y lo
ng d
ry s
pell;
wee
d co
ver
of 1
5 %
. The
fert
ilize
d pl
ot h
ad m
any
gaps
, pla
nts
wer
e 70
cm
hig
h, a
nd a
ffect
ed b
y dr
y sp
ell;
wee
d co
ver
35 %
.
visi
t 10/
04/9
5
The
rem
aini
ng p
lant
s di
d no
t sur
vive
the
long
dry
spe
ll of
6 w
eeks
and
the
aphi
d at
tack
. Tria
l fai
led.
Far
mer
's o
vvn
crop
die
d as
vve
ll,
yiel
d co
ntro
l plo
t:20
0 he
ads
(not
dam
aged
) -
12 k
g; s
eedw
eigh
t 1he
ad 6
0 gr
am1.
5 he
ads/
plan
t x 3
700
plan
ts/h
a =
333
kg/
ha 1
4.8
bags
)2
head
s/pl
ant x
370
0 pl
ants
/ha
= 4
44 k
g/ha
(6.
3 ba
gs)
2.5
head
s/pl
ant x
370
0 pl
ants
/ha
= 5
55 k
g/ha
17.
9 ba
gs)
3he
ads/
plan
t x 3
700
plan
ts/h
a66
6 kg
/ha
(9.5
bag
s)
CY
SLA
MB
pre
dict
ion:
500
kg/
ha
In o
rder
to c
ompa
re th
e tr
ial y
ield
with
a C
YS
LAM
B s
imul
atio
n an
ave
rage
of 2
.5 h
eads
per
pla
nt v
vas
take
n.
visi
t 01/
11/9
4
A r
aing
auge
inst
alle
d; s
oil s
light
ly m
oist
at 2
5 cm
afte
r fe
w m
m o
f rai
n on
31/
10/9
4.
visi
t 11/
11/9
4
Cyn
odon
dac
tylo
n ge
rmin
ated
and
spr
eadi
ng o
ver
fert
ilize
d pl
ot a
nd p
artly
ove
r co
ntro
l plo
t.
visi
t 02/
12/9
4
19 m
m o
f rai
n on
29-
30/1
1/94
; the
farm
er w
as lo
okin
g fo
r th
e la
st d
onke
y; fe
rtili
zing
don
e on
02/
1219
4.
visi
t 09/
12/9
4
Far
mer
fini
shed
plo
ughi
ng; h
owev
er, s
oil m
oist
ure
too
low
for
plan
ting
and
the
next
pla
ntin
g op
port
unity
had
to b
e aw
aite
d. P
loug
hing
fini
shed
late
due
to o
ther
occ
upat
ions
(lo
okin
g fo
r ca
ttle,
bui
ldin
g hu
t, in
tow
n). T
he fa
rmer
use
d A
caci
a m
ellif
era
to h
arro
w th
e fie
ld a
nd to
red
uce
the
wee
d co
ver
betw
een
08/1
2-20
/12;
94.
pH-H
PE
Cor
g C
CE
CC
aM
gK
Na
PB
Sca
rbo
6.3
0.0
0.3
3.0
5.5
0.5
0.3
0.0
>10
00.
0
top
Soi
l tex
ture
: coa
rse
drai
nage
: s. e
xc.
soil
dept
h: 1
00 +
cm
fert
ilize
d pl
ot:
num
ber
of r
ows:
32
plan
t den
sity
:10
0 p1
/ha
cont
rol p
lot:
num
ber
of r
ows:
32
plan
t den
sity
: 3,7
00 p
l/ha
yiel
d fe
rtili
zed
plot
:fa
iled.
M8
TS
AN
AK
UN
AM
r. B
. Keb
idits
we
ALD
EP
mod
el II
plot
siz
e: 0
.25
hasl
ope:
2°
UT
M p
ositi
on: 7
4802
1E 7
7783
24N
soilt
ype:
Hap
lic A
reno
soi
AW
HC
: 65
mm
/mP
hosp
horu
s co
nten
t top
soil:
3.5
ppm
fert
ilize
r ty
pe:
sing
le s
uper
phos
phat
eap
plic
ion
rate
: 227
.5 k
g/ha
tops
oil a
naly
sis
cont
rol p
lot:

visi
t 18/
01/9
5
25 m
m o
f rai
n on
17/
01/9
5; th
e fa
rmer
bro
adca
sted
mai
ze a
nd p
loug
hed
his
own
field
on
18/0
1/95
. He
did
not h
ave
time
for
the
tria
l plo
ts.
visi
t 31/
01/9
5
Har
row
ing
done
on
26/0
1/95
and
pla
ntin
g on
27/
01/9
5, 1
0 da
ys a
fter
effe
ctiv
e ra
infa
llev
ent.
The
aver
age
row
spa
cing
was
1.6
0 m
(pr
obab
ly, f
arm
er w
ante
d to
fini
sh q
uick
ly).
Cyn
odon
dac
tylo
n fo
rms
seve
re p
robl
em o
n fe
rtili
zed
plot
and
mod
erat
e pr
oble
m o
n th
e co
ntro
l plo
t.
visi
t 14/
02/9
5
Apa
rt fr
om C
ynod
on d
acty
lon
prob
lem
(co
verin
g 25
% o
f con
trol
plo
t and
60
% o
f fer
flize
d pl
ot)
germ
inat
ion
and
esta
blis
hmen
tOK
, pla
nts
upto
8 c
m h
igh
and
rela
tivel
y ev
enly
spa
ced.
visi
t 28/
03/9
5
Aro
und
90%
of t
he p
lant
s w
ere
flow
erin
g; p
lant
s lo
oked
rem
arka
bly
wel
l afte
r a d
ry s
pell
of 6
wee
ks,
slig
htly
stu
nted
, app
roxi
mat
ely
80 c
m. F
arm
er's
wife
did
con
duct
a w
eedi
ng o
pera
tion
of th
ree
days
betw
een
03-0
7/03
/95
and
cont
rolle
d th
e C
ynod
on d
acty
lon
arou
nd th
e pl
ants
on
the
cont
rol p
lot.
On
the
fert
ilize
d pl
ot, h
owev
er, o
nly
a fe
w p
lant
s w
ere
left.
The
farm
er's
ow
n m
aize
faile
d, a
nd h
is s
orgh
umlo
oked
ver
y th
in, w
hile
the
cow
peas
wer
e do
ing
wel
l.
visi
t 19/
04/9
5
Gra
in fi
lling
had
sta
rted
on
11/0
4/95
, no
bird
pro
blem
s so
far.
visi
t 10/
05/9
5
Far
mer
's w
ife r
esid
ing
in s
helte
r on
the
field
for
bird
sca
ring.
On
the
fert
ilize
d pl
ot o
nly
a fe
w s
tron
g pl
ants
with
3-4
tille
rs le
ft; h
eads
med
ium
siz
ed, g
rain
filli
ng a
nd r
ipen
ing.
The
pla
nts
on th
e co
ntro
l plo
t had
a
unifo
rm h
eigh
t of 1
.20-
1.40
m, l
ooke
d he
alth
y, o
n av
erag
e 2-
3 til
lers
/pla
nt h
ad d
evel
oped
and
ofte
na
seco
ndar
y he
ad a
t one
of t
he th
ree
tille
rs. H
eads
gra
in fi
lling
and
rip
enin
g. L
arge
gap
s in
the
stan
d,du
eto
une
ven
germ
inat
ion.
Whe
re p
lant
s w
ere
clos
e to
eac
h ot
her,
onl
y on
e til
ler
had
deve
lope
d an
d th
est
ems
stay
ed th
in. T
he p
lant
s lo
oked
bet
ter
deve
lope
d th
an th
ose
on th
e fa
rmer
's o
wn
field
. Har
dly
any
bird
dam
age
(1-3
%)
obse
rved
.
visi
t 23/
05/9
5
Mat
ure
head
s w
ere
harv
este
d on
19/
05/9
5 an
d w
ere
drie
d on
rac
k of
f the
gro
und
inco
ne s
hape
d pi
leco
vere
d by
gra
ss o
n th
e tim
e of
this
vis
it. T
he h
arve
sted
hea
ds fr
om th
e fe
rtili
zed
and
cont
rol p
lot
wer
em
ixed
; as
only
a fe
w fe
rtili
zed
head
s w
ere
harv
este
d an
d no
obv
ious
diff
eren
cew
as o
bser
ved
betw
een
the
cont
rol a
nd th
e fe
rtili
zed
head
s, th
e yi
eld
figur
e w
as n
ot s
erio
usly
affe
cted
. Sev
eral
hea
dsw
ere
still
ripen
ing,
a s
light
dam
age
by c
attle
and
bird
s w
as o
bser
ved
(1-3
%).
M9
SE
GO
RD
plot
siz
e: 0
.25
haso
iltyp
e: H
aplic
Are
noso
lA
WH
C: 6
5 m
m/m
fert
ilize
r ty
pe:
tops
oil a
naly
sis
cont
rol p
lot:
Mr.
Fan
abi S
asa
ALD
EP
mod
el II
slop
e: 3
-4°
UT
M p
ositi
on: 7
8749
6E 7
7642
04N
Pho
spho
rus
cont
ent t
opso
il: 4
ppm
sing
le s
uper
phos
phat
eap
plic
atio
n ra
te: 2
45 k
g/ha
resu
lt:T
rial f
aile
d.
visi
t 31/
10/9
4
A r
aing
auge
was
inst
alle
d.
visi
t 11/
11/9
4
Cyn
odon
dac
tylo
n ge
rm n
ated
and
was
spr
eadi
ng o
ver
the
fert
ilize
d pl
ot.
visi
t 02/
12/9
4
26 m
m o
f rai
n on
28-
30/1
1/94
; fer
tiliz
ing
was
don
e on
02/
12/9
4; p
loug
hing
star
ted
on 0
2/12
/94.
visi
t 18/
01/9
5
Ger
min
atio
n on
03/
01/9
5, 2
6 da
ys a
fter
plan
ting
and
5 da
ys a
fter
two
rain
fall
even
ts o
f 28
mm
in to
tal.
Ger
min
atio
n se
emed
to b
e sl
ight
ly b
ette
r on
the
fert
ilize
d pl
ot, t
han
on th
e co
ntro
l plo
t. A
wee
ding
oper
atio
n w
as s
tart
ed b
y th
e fa
rmer
's w
ife o
n 11
/01/
95 a
nd c
arrie
d on
in s
mal
l por
tions
over
15
days
15
even
ts)
until
bot
h pl
ots
wer
e fin
ishe
d.
v si
t 31/
01/9
5
Pla
nts
on b
oth
plot
s w
ere
reas
onab
ly w
ell e
stab
lishe
d. C
ynod
on d
acty
lon
beco
min
ga
prob
lem
on
the
fert
ilize
d pl
ot; m
any
term
ites
arou
nd th
e ro
ots
of th
e pl
ants
as
vvel
l.
pH-H
z0E
Cor
g C
CE
CC
aM
gK
Na
PB
Sca
rbo
6.6
0.1
0.6
1.6
1.3
0.2
0.3
0.1
>10
0
top
soil
text
ure:
coa
rse
drai
nage
: s. e
xc.
soil
dept
h: 1
00 +
cm
fert
ilize
d pl
ot:
plan
t den
sity
: 2,1
00 p
liha
cont
rol p
lot:
plan
t den
sity
: 2,2
50 p
liha

visi
t 14/
02/9
5
The
pla
nts
wer
e 50
-70
cm h
igh,
slig
htly
moi
stur
e st
ress
ed; n
o ob
viou
s di
ffere
nce
betv
veen
fert
ilize
d an
dco
ntro
l plo
t. M
ajor
ity o
f pla
nts
tille
ring
prof
usel
y: u
pto
6-8
tille
rs p
er p
lant
. Aph
ids
affe
ctin
g ap
prox
imat
ely
85 %
of t
he c
rop
on th
e tr
ial p
lots
. The
farm
er's
cow
peas
nex
t to
the
tria
l plo
ts lo
oked
wel
l dev
elop
ed,
but w
ere
for
appr
oxim
atel
y 25
% a
ffect
ed b
y ap
hids
. A s
pray
ing
oper
atio
n w
as c
ondu
cted
(in
clud
ing
farm
ers
co w
peas
) w
ith k
naps
ack
spra
yer
by th
e P
lant
Pro
tect
ion
Div
isio
n on
16/
02/9
5; th
e ch
emic
al u
sed
was
Dec
is (
Ultr
a Lo
w V
olum
e) w
ith a
rat
e of
12
I/ha.
visi
t 20/
02/9
5
The
spr
ayin
g w
as e
ffect
ive,
pla
nts
look
ed m
ore
heal
thy,
but
stil
l som
e m
oist
ure
stre
ss. H
eads
wer
ede
velo
ping
.
visi
t 28/
03/9
5
Aro
und
90 %
of t
he p
lant
s w
ere
flow
erin
g on
06/
03/9
5. S
ever
e m
oist
ure
stre
ss fo
r 5-
6 w
eeks
. Pla
nts
80-1
00 c
m h
igh
and
upto
8 h
eads
per
pla
nt w
ere
obse
rved
Ion
aver
age
4-5
head
s pe
r pl
ant)
. At t
he ti
me
of th
e vi
sit 8
0 %
of h
eads
wer
e gr
ain
fillin
g an
d bi
rds
form
a pr
oble
m. T
he p
lant
sta
nd o
f the
con
trol
plo
tis
slig
htly
mor
e un
iform
than
the
fert
ilize
d pl
ot (
may
be d
ue to
Cyn
odon
dac
tylo
n in
fert
ilize
d pl
ot).
On
f arm
er's
ow
n fie
ld a
ll cr
ops
faile
d, e
xcep
t the
cov
vpea
s, w
hich
wer
e st
ill lo
okin
g go
od a
nd in
the
grai
nfil
ling
stag
e.
vis
t 07/
04/9
5
M10
XW
EE
plot
siz
e: 0
.25
haso
iltyp
e: H
aplic
Are
noso
lA
WH
C: 6
5 m
m/m
fert
ilize
r ty
pe:
tops
oil a
naly
s s
cont
rol p
lot:
37 m
m o
f rai
n on
28-
30/1
1/94
; the
farm
er w
aite
d fo
r he
r ch
ildre
n to
fini
sh s
choo
l on
02/1
2/94
to a
ssis
tF
arm
er's
fam
ily w
as n
ot ïn
tere
sted
in b
irdsc
arin
g fo
r th
e tr
ials
plo
ts o
nly;
the
crop
100
% d
amag
ed b
yhe
r in
deb
ushi
ng p
art o
f fie
ld.
bird
s. T
rial f
aile
d.vi
sit 0
8/12
/95
Far
mer
and
chi
ldre
n de
bush
ed tr
ial p
lots
on
03-0
4,06
/12/
94. F
ertil
izin
g w
as d
one
on 0
5/12
/94
and
plou
ghin
g fr
om 0
6-08
/12/
94. S
oil m
oist
ure
at th
e tim
e of
the
visi
t too
lovv
for
plan
ting,
so
plan
ting
oppo
rtun
ity m
isse
d,
By
the
end
of J
anua
ry n
ot e
noug
h ra
in fo
r a
plan
ting
oppo
rtun
ity h
ad b
een
reco
rded
, so
tria
l was
term
inat
ed.
Ms.
T. S
ejak
gom
oA
LDE
P m
odel
Ill
slop
e: 0
°U
TM
pos
ition
: 798
478E
775
3829
N
Pho
spho
rus
cont
ent t
opso
il: 3
,5 p
pmsi
ngle
sup
erph
osph
ate
appl
icat
ion
rate
: 227
.5 k
g/ha
pH-H
20E
Cor
g C
CE
CC
aM
gK
Na
PB
Sca
rbo
6.2
0.0
0.2
1.9
0.9
0.3
0.1
0.0
680.
5
top
soil
text
ure:
coa
rse
drai
nage
: s. e
xc,
soll
d pt
h 10
0+ c
m
resu
lt:T
rial t
erm
inat
ed.
visi
t 31/
10/9
4
Fem
ale
head
ed h
ouse
hold
. A r
a ng
auge
was
inst
alle
d,
visi
t 02/
12/9
4
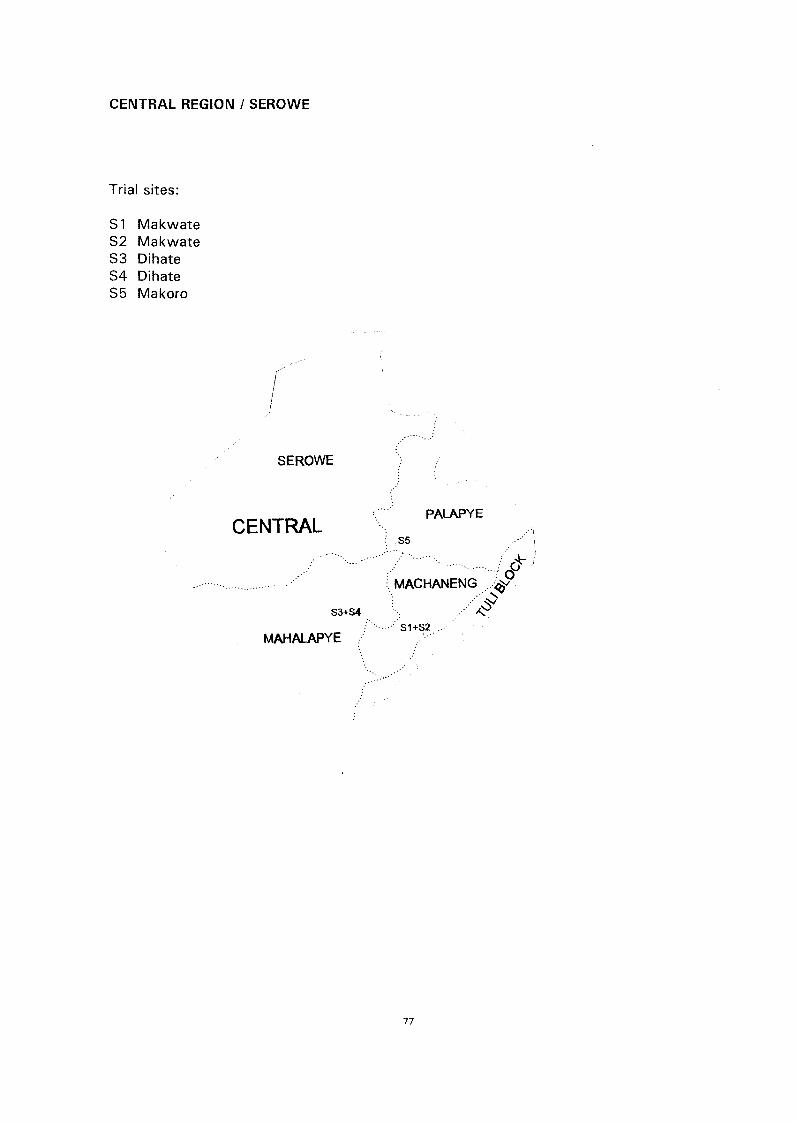
CENTRAL REGION / SEROWE
Trial sites:
Si MakwateS2 MakwateS3 DihateS4 DihateS5 Makoro
SEROWE
CENTRALS5
S3+S4
MAHALAPYE
77
PALAPYE

Rainfall data trial sites S1/2, S314, S5
78
TRIAL SITE S1 /S2 Makwate 531S4 Dihate S5 Makoro
SYNOPTIC STATION Mahalapye Mahalapye Mahalapye
RAINFALL STATION Machaneng Kalamare Palapye
yearly average 417 mm 439 mm 403 mm
15 Oct 9.3 5.7
16 Oct 7.1 14
24 Oct 3
02 Nov
03 Nov 6.6 21.1 11
04 Nov 2
08 Nov 1.5
12 Nov 5.6 20
13 Nov 9
17 Nov 16 42 7
18 Nov 8 22
24 Nov 4
30 Nov 0.6 14 5
01 Dec 3.3 9 16
09 Dec 11 0.3
10 Dec 29.8 10 30
11 Dec 9
28 Dec 12.3 14
29 Dec 18
03 Jan 12
09 Jan 10
10 Jan 11
13 Jan 18 30
14 Jan 12
15 Jan 4
16 Jan 5 7
03 Feb 20
10 Feb 10
18 Feb 70 5
19 Feb 60
20 Feb 1.5 100+ 100+
21 Feb 30
14 Mar 3 9
24 Mar 26 24 40
25 Mar 4 1.5 20

continued:
79
26 Mar 27.5
27 Mar 30
28 Mar 1.4
31 Mar 26 20
10 Apr 6 6.1
TOTAL 323.2 391.3-i-
,
442.7+
% of AVERAGE 78 % 89 % 110 %
TRIAL SITE S1/S2 Makwate S3/S4 Dihate SS Makoro

Si
MA
KW
AT
E
plot
siz
e: 0
,33
haso
iltyp
e: C
hrom
ic L
uvis
olA
WH
C: 1
10 m
m/m
fert
ilize
r ty
pe:
tops
o I a
naly
sis
cont
rol p
lot:
Mr.
Pet
er G
arab
aits
evi
s5/
03/9
5
slop
e: 0
-1°
UT
M p
ositi
on: 5
3140
0E 7
4254
00N
The
var
iety
pla
nted
is n
ot S
egao
lane
, but
the
"goo
sene
ck"
or "
Rai
gap"
. The
farm
erha
d us
ed th
edi
strib
uted
Seg
ao/a
nese
eds
som
ewhe
re e
lse.
No
wee
ds, f
ew w
ater
mel
on in
the
field
. No
pest
s ob
serv
ed.
Pho
spho
rus
cont
ent t
opso
il: 3
ppm
sing
le s
uper
phos
phat
eap
plic
atio
n ra
te: 5
0 kg
/ha
vis
12/0
4/95
Cro
p w
as s
till i
n a
good
con
ditio
n; th
e m
ajor
ity o
f pla
nts
had
not y
et m
atur
ed. N
o m
ajor
pes
ts o
bser
ved.
Far
mer
had
pic
ked
fevv
hea
ds o
f pla
nts,
whi
ch w
ere
lyin
g on
the
grou
nd. T
hese
hea
ds a
rest
ored
on
a
plat
form
und
er a
tree
.pH
-CaC
I,or
g C
CE
CC
aM
gK
Na
5.0
0.3
4.0
2.2
1.0
0.3
0.04
top
soil
text
ure:
coa
rse
drai
nage
: wel
l dra
ined
soil
dept
h: 8
0 cm
fert
ilize
d pl
ot:
plan
t den
sity
: 16,
000
pl/h
aco
ntro
l plo
t:pl
ant d
ensi
ty:
6,70
0 pl
/ha
resu
lt:B
ecau
se o
f mis
take
s w
ith fe
rtili
zer
and
varie
ty, t
his
tria
l is
not s
uita
ble
for
furt
her
anal
ysis
.
vis
14/1
1/94
Initi
ally
thre
e tr
ial p
lots
wer
e la
id o
ut: 1
for
the
supe
rpho
spha
tefe
rtili
zer,
1 fo
r a
kraa
l man
ure
appl
icat
ion
and
a co
ntro
l plo
t. D
ue to
tran
spor
t pro
blem
s, th
e kr
aal m
anur
e co
uld
not b
e ap
plie
d in
tim
e, s
oth
e id
ea
was
left.
The
farm
er li
ves
in M
ak w
ate,
and
has
a (
sum
mer
) ho
mes
tead
nea
r th
e fie
ld. N
o ac
tivity
yet
on
14/1
1/94
.
Rai
ngau
ge in
stal
led
prev
ious
ly, b
ut n
o re
cord
ing
at s
ite s
o fa
r.
visi
t 14/
12/9
4
By
acci
dent
50
kg s
uper
phos
phat
e di
strib
uted
ove
r 1
ha, i
nclu
ding
the
two
tria
l plo
tsof
0.3
3 ha
, The
plot
s w
ere
plou
ghed
on
13/1
2194
with
a d
oubl
e m
ould
boar
d pl
ough
and
don
keys
. At t
he ti
me
of th
e vi
sit
plan
ting
had
not b
een
done
yet
, will
sta
rt p
lant
ing
on 1
5/12
/94.
The
re a
re n
o tr
acto
rsav
aila
ble
in th
e
area
; the
y ha
ve le
ft be
caus
e of
the
late
rai
ns.
visi
t 18/
01/9
5
The
farm
er o
wns
asp
an o
f mul
os a
nd h
arne
ss. T
he tv
vo fe
rtili
zed
plot
s w
ere
plan
ted
on 1
4-.1
5/12
/94;
the
cont
rol p
lot w
as p
lant
ed o
n 27
-28/
12/9
4, d
ue to
the
lovv
soi
l moi
stur
e co
nten
t mid
Dec
embe
r, a
new
show
er h
ad to
be
awai
ted.
The
pla
nt d
ensi
ty w
as r
elat
ivel
y lo
w, a
nd a
poo
r al
ignm
ent o
f row
s w
asob
serv
ed. T
he p
lots
had
alre
ady
been
wee
ded.
visi
t 15/
02/9
5
Pla
nts
at k
nee-
heig
ht a
nd in
fairl
y go
od c
ondi
tion;
pat
ches
of t
he fi
eld
show
edm
oist
ure
stre
ss; P
lant
sun
even
ly d
istr
ibut
ed li
n-ro
w c
lust
ers)
, few
pla
nts
vver
e flo
wer
ng,
Few
pla
nts
wer
e af
fect
ed b
yaph
ids.

yiel
d fe
rtili
zed
plot
:73
0 kg
/ha
CY
SLA
MB
pre
dict
ion:
128
0 kg
/ha
yiel
d co
ntro
l plo
t:70
0 kg
/ha
CY
SLA
MB
pre
dict
ion:
810
kg/h
a
visi
t 14/
11/9
4
Initi
ally
thre
e tr
ial p
lots
wer
e la
id o
ut: 1
for
the
supe
rpho
spha
tefe
rtili
zer,
1 fo
r a
kraa
l man
ure
appl
icat
ion
and
a co
ntro
l plo
t. D
ue to
tran
spor
t pro
blem
s, th
e kr
aal m
anur
e co
uld
not b
e ap
plie
d in
tim
e,so
the
idea
was
left.
The
farm
er li
ves
in M
akvv
ate,
and
has
a (
sum
mer
) ho
mes
tead
nea
r fie
ld. H
ew
as p
rese
nt a
t the
fiel
d on
14/1
1/94
and
rea
dy to
plo
ugh
vvith
the
first
rai
n. H
e liv
es a
t lan
ds m
ost o
f the
tim
e. H
e us
ed d
onke
ys fo
rpl
ough
ing.
Som
e fe
rtili
zer
was
app
lied
on th
e tr
ial s
ite 5
yea
rs a
go (
gift
from
MoA
). R
aing
auge
inst
alle
dpr
evio
usly
, but
no
reco
rdin
g at
site
so
far.
visi
t 14/
12/9
4
Fer
tiliz
ed p
lot w
as p
loug
hed
on 1
3-14
/12/
94, f
irst w
ith a
sin
gle
mou
ldbo
ard
plou
gh a
nd s
ingl
e pl
ante
r,la
ter
with
a d
oubl
e m
ould
boar
d pl
ough
/pla
nter
. Plo
ughi
ng w
as d
one
at a
ppro
xim
atel
y 7
cm d
eep.
The
tops
oil w
as a
lread
y dr
y, c
ompa
cted
and
cru
sted
, mor
e so
than
soi
ls o
f oth
er tr
ial s
ites.
visi
t 18/
01/9
5
The
fert
ilize
d pl
ot w
as c
hara
cter
ized
by
a m
oder
ate
plan
t den
sity
with
man
y ga
ps. T
hear
ea p
lant
ed w
ithth
e S
ebel
e si
ngle
row
plan
ter
had
a hi
gher
pla
nt d
ensi
ty th
an th
e ar
e pl
ante
d w
ith th
e do
uble
mou
ldbo
ard
plou
gh/p
lant
er.F
ew w
eeds
wer
e ob
serv
ed. T
he c
ontr
ol p
lot w
as p
lant
ed o
n 27
-28/
12/9
4, d
ue to
low
soi
lm
oist
ure
cont
ent,
henc
e a
the
next
sho
vver
had
to b
e aw
aite
d. T
he c
ontr
ol p
lot s
how
eda
som
ewha
tbe
tter
stan
d th
an th
e fe
rtili
zed
plot
.
The
fert
ilize
d pl
ot lo
oked
slig
htly
bet
ter
than
the
cont
rol p
lot (
the
plan
tsvv
ere
slig
htly
hig
her
on th
efe
rtili
zed
plot
). M
ost p
lant
s re
ache
d kn
ee-h
eigh
t and
sho
wed
sig
ns o
f slig
ht m
oist
ure
stre
ss. R
oth
plot
sw
ere
free
of w
eeds
(w
eede
d on
06-
10/0
2/95
). M
any
gaps
and
in-r
ow c
lust
ers
obse
rved
. Far
mer
ackn
owle
dged
, tha
t pla
nter
ofte
n go
t blo
cked
.
The
sor
ghum
(lo
cal v
arie
ty "
goos
enec
k" o
r "R
aigo
p")
plan
ted
at la
ter
date
(ar
ound
05/0
1/95
) ad
jace
ntto
tria
l site
look
ed b
ette
r th
an S
egao
lane
on
the
tria
l site
s. T
he fa
rmer
had
als
oa
good
sin
gle
stan
ds o
fco
wpe
a, ju
go b
ean
and
tepa
ry b
ean.
Cow
pea
vvas
a g
ood
inte
r-cr
op, b
ecau
se o
f its
spr
eadi
ngna
ture
,
visi
t 15/
03/9
5
Cro
p ha
d do
ne r
elat
ivel
y w
ell s
ince
15/
02/9
5. F
evv
Afr
ican
Bol
lvvo
rm o
bser
ved.
The
dev
elop
edhe
ads
wer
esm
all,
due
to th
e m
oist
ure
stre
ss b
efor
e 19
/02/
95. N
o (v
isua
l) di
ffere
nces
bet
wee
n fe
rtili
zed
and
cont
rol
plot
to b
e se
en. N
one
of th
e pl
ants
wer
e rip
e ye
t; so
me
wer
e on
ly fo
rmin
g he
ads.
The
plot
s w
ere
free
of
wee
ds.
Jugo
bean
and
cow
pea
wer
e do
ing
very
wel
l in
the
adja
cent
plo
t. A
lso
the
mai
zelo
oked
pro
mis
ing,
cons
ider
ing
the
low
rai
nfal
l rec
eive
d th
is s
easo
n,
visi
t 12/
04/9
5
Cro
p ke
pt p
erfo
rmin
g w
ell a
nd w
as a
bout
1.5
0 cm
hig
h. A
few
pla
nts
wer
e at
tack
ed b
y pi
geon
s (r
ipe
grai
ns);
als
o da
mag
e by
que
lea
(imm
atur
e gr
ains
) w
as o
bser
ved.
Wee
ds c
over
eda
few
per
cent
;w
ater
mel
on p
lant
ed o
n th
e tr
ial p
lots
. Min
or o
ccur
renc
e of
bol
lwor
m o
bser
ved,
pH-C
aa,
org
CC
EC
Ca
Mg
KN
a
4.9
0.3
4.0
2.0
1.0
0.3
0.04
S2
MA
KW
AT
EM
r, O
gom
odits
e M
artin
visi
t 15/
02/9
5
plot
siz
e: 0
.33
hasl
ope:
0-1
°U
TM
pos
ition
: 531
400E
742
5400
Nso
iltyp
e: C
hrom
ic L
uvis
olA
WH
C: 1
15 m
m/m
Pho
spho
rus
cont
ent t
opso
il: 2
ppm
fert
ilize
r ty
pe:
sing
le s
uper
phos
phat
eap
plic
a on
rat
e: 2
30 k
g/ha
(to
8 p
pnn)
tops
oil a
naly
sis
cont
rol p
lot:
top
soil
text
ure:
med
ium
drai
nage
: wel
l dra
ned
soil
dept
h: 1
00 +
cm
fert
ilize
d pl
ot:
plan
t den
sity
: 22,
300
pl/h
aco
ntro
l plo
t:pl
ant d
ensi
ty: 2
4,70
0 pl
/ha

fert
ilize
d pl
ot:
cont
rol p
lot:
yiel
d fe
rtili
zed
plot
:
yiel
d co
ntro
l plo
t:
visi
t 14/
11/9
4
plan
t den
sity
: 31,
300
pllh
apl
ant d
ensi
ty: 2
8,00
0 pl
/ha
1000
kg/
haC
YS
LAM
B p
redi
ctio
n: 1
320
kg/h
a
670
kg/h
aC
YS
LAM
B p
redi
ctio
n:71
0 kg
/ha
The
farm
er li
ves
in S
osho
ng a
nd h
as a
(su
mm
er)
hom
este
ad n
ear
his
field
. No
activ
ityye
t on
14/1
1/94
,de
spite
goo
d ra
ins
and
soil
moi
st u
p to
a d
epth
of 1
00 c
m.
Firs
t pla
ntin
g op
port
unity
on
03/1
1/94
; per
haps
som
ewha
t ear
ly. S
pars
e gr
een
wee
ds in
farm
er's
fiel
d.W
eek-
old
gras
reg
row
th in
the
surr
ound
ing
area
.
No
ra n
rec
ord
ng a
t tria
l site
. Far
mer
ow
ns a
trac
tor
and
a pl
ante
r.
visi
t 14/
12/9
4
Bot
h pl
ots
wer
e pl
ough
ed b
y tr
acto
r on
05/
12/9
4 an
d pl
ante
d on
08/
12/9
4. C
rop
just
em
erge
d.
visi
t 18/
01/9
5
Som
e th
inni
ng w
as c
arrie
d ou
t on
11/0
1/95
. Man
y ga
ps in
the
row
s (d
ue to
poo
r pl
antin
g); t
he p
lant
sw
ere
appr
oxim
atel
y 30
cm
hig
h. T
he g
row
th in
the
fert
ilize
d pl
ot lo
oked
bet
ter
than
in th
e co
ntro
l plo
t.A
wee
d co
unt w
as c
arrie
d ou
t in
both
plo
ts; t
he m
ain
wee
d w
as U
roch
loa
spp.
, agr
ass
and
easy
tore
mov
e. T
he fa
rmer
was
adv
ised
to w
eed.
visi
t 15/
02/9
5
A r
easo
nabl
epla
nt s
tand
vva
s ob
serv
ed, b
ut n
o pr
oper
thin
ning
was
don
e: m
any
in-r
ow c
lust
ers
and g
aps.
50 %
of t
he p
lant
s w
as fl
ower
ing;
nea
rly a
ll pl
ants
wer
e af
fect
ed b
y ap
hids
. Slig
ht m
oist
ure
stre
ssvv
asob
serv
ed. F
ew w
eeds
12
%I.
Not
muc
h di
ffere
nce
to b
e se
en b
etw
een
the
fert
ilize
d an
d th
e co
ntro
l plo
t.
No
(vis
ual)
diffe
renc
ebet
wee
n th
e fe
rtili
zed
and
the
cont
rol p
lot o
bser
ved.
Rai
n of
mid
Feb
ruar
yw
ashe
da
way
the
aphi
ds. B
oth
plot
s at
tack
ed b
y A
fric
an B
ollw
orm
; als
o fe
w c
orn
cric
kets
see
n. S
ome
head
sw
ere
read
y fo
r ha
rves
ting.
Few
wee
ds (
mai
nly
Ses
amum
ala
tum
, "w
ild s
esam
um")
obs
erve
d. S
igns
of s
heet
and
rill e
rosi
on in
the
field
, cau
sed
by th
e he
avy
rain
from
mid
Feb
ruar
y.
visi
t 12/
04/9
5
Hal
f of e
ach
plot
was
spr
ayed
by
FS
R a
gain
st B
ollw
orm
on
20/0
3/95
with
"S
herp
a"co
ncen
trat
ion
7.5
m11
15 I.
No
notic
eabl
e di
ffere
nce
betw
een
spra
yed
and
not s
pray
ed s
ectio
ns o
bser
ved;
the
Bol
lwor
m h
addi
sapp
eare
d th
roug
hout
. The
cro
p co
ntin
ued
to d
o w
ell,
and
was
alm
ost m
atur
e. S
ome
stal
ksha
d fa
llen
dow
n be
caus
e of
str
ong
win
d. S
ome
atta
ck b
y pi
geon
s an
d qu
elea
obs
erve
d. T
he w
eed
cove
r w
as a
few
perc
ent.
The
farm
er w
as tr
ying
to fi
ght a
obn
oxio
us w
eed
(Ses
amum
ala
tum
) by
pul
ling
itup
and
colle
ctin
g it
in p
iles.
visi
t 16/
05/9
5
On
the
tria
l plo
ts s
orgh
um w
as m
ixed
with
mel
ons;
the
plan
t den
sity
of t
he s
orgh
um a
mou
nted
on b
oth
fert
ilize
d an
d co
ntro
l plo
t app
roxi
mat
ely
30,0
00 p
lant
e/ha
; the
mel
ons
reac
hed
an a
ppro
xim
ate
dens
ityof
5,0
00/h
a.
The
pla
nt s
tand
on
the
fert
ilize
d pl
ot v
vas
rath
er h
omog
eneo
us, t
he p
lant
sw
ere
1.10
-1.3
0 hi
gh, t
hinl
yst
emm
ed, a
nd u
pto
3 til
lers
had
dev
elop
ed (
mai
nly
1 th
ough
). T
he p
lant
s on
the
cont
rol p
lot
wer
e sl
ight
lyth
inne
r an
d lo
wer
than
the
fert
ilize
d pl
ants
, onl
y 1
tille
r ha
d de
velo
ped.
The
mai
n m
atur
e he
ads
wer
eha
rves
ted
in A
PR
3; th
e ha
rves
ted
head
s w
ere
med
ium
-larg
e, a
ndw
ere
dryi
ng a
t the
tim
e of
the
visi
t.S
ome
3 %
bird
dam
age
was
don
e to
the
harv
este
d he
ads;
the
smal
l im
mat
ure
seco
nd a
ndth
ird h
eads
wer
e le
ft by
the
farm
er; t
hey
vver
e no
t wor
th th
e ef
fort
to h
arve
st.
pH-C
aCI,
org
CC
EC
Ca
Mg
KN
a
4.5
0,3
2.8
1.0
0.5
0.2
0.04
S3
DIH
AT
EM
r. K
otam
e B
atla
ngvi
s5/
03/9
5
plot
siz
e: 0
.5 h
asl
ope:
2°
UT
M p
o i
on: 4
5560
0E 7
4407
00N
soilt
ype;
Chr
omic
Luv
isol
AW
HC
: 105
mm
/mP
hosp
horu
s co
nten
t top
soil:
1 p
pmfe
rtili
zer
type
:si
ngle
sup
erph
osph
ate
appl
icat
ion
rate
: 200
kg/
ha (
to 6
ppm
)
tops
oil a
naly
sis
cont
rol p
lot:
top
so I
text
ure:
coa
rse
drai
nage
: wel
l dra
ined
soil
dept
h: 1
00+
cm

The
site
was
situ
ated
on
the
foot
slop
e, li
able
to s
heet
ero
sion
; con
tour
was
plo
ughi
ng d
one,
In a
nad
jace
nt fi
eld,
pre
viou
sly
expe
rimen
ts w
ere
carr
ied
out w
ith b
road
rid
ging
alo
ng th
e co
ntou
r an
d m
aize
prod
uctio
n; lo
cally
rill
s ha
d br
oken
thro
ugh
the
ridge
s.
The
farm
er li
ves
in S
osho
ng a
nd h
as a
(su
mm
er)
hom
este
ad n
ear
his
field
. No
act v
ity y
et o
n 14
/11/
94,
desp
ite g
ood
rain
s an
d so
il m
oist
up
to a
dep
th o
f 100
cm
.F
irst p
lant
ing
oppo
rtun
ity o
n 03
/11/
94; p
erha
ps s
omew
hat e
arly
. Spa
rse
gree
n w
eeds
obs
erve
d in
the
farm
er's
fiel
d. V
Vee
k-ol
d gr
as r
egro
wth
in s
urro
undi
ng a
rea.
Far
mer
ow
ns d
onke
ys a
nd a
plo
ugh-
plan
ter.
visi
t 12/
12/9
4
The
fert
ilize
d pl
ot w
as p
loug
hed
and
plan
ted
on 0
5-06
112/
94, E
mer
genc
e to
ok p
lace
on
14/1
2/94
.
visi
t 18/
01/9
5
The
con
trol
plo
t was
plo
ugh-
plan
ted
on 2
8-29
/12/
94, d
ue to
the
low
soi
l moi
stur
e in
mid
Dec
embe
r, a
new
sho
wer
had
to b
e a
wai
ted,
Ver
y fe
w p
lant
s ha
d em
erge
d. A
few
wee
ds w
ere
obse
rved
: Uro
chlo
asp
p an
d T
ribu(
us te
rres
tris
("m
oset
lho"
).
On
the
fert
ilize
d pl
ot a
ver
y lo
w p
lant
den
sity
and
man
y ga
ps w
ere
foun
d. T
he fa
rmer
was
adv
ised
to fi
llin
the
gaps
. Fev
v w
eeds
wer
e ob
serv
ed.
The
fert
ilize
d pl
ot w
as w
eede
d on
05/
03/9
5. A
few
pla
nts
wer
e at
tack
ed b
y th
e A
fric
an B
ollw
orm
, A fe
whe
ads
wer
e re
ady
for
harv
estin
g.
visi
t 12/
04/9
5
pH-C
aCl2
org
CC
EC
Ca
Mg
KN
a
4.8
0.4
3.3
1.1
0.6
0.3
0.04
S4
DIH
AT
EM
r. M
polo
king
Les
ele
visi
t 15/
0219
5
plot
siz
e: 0
,5 h
asl
ope:
2°
UT
M p
ositi
on: 4
5560
0E 7
4407
00N
The
farm
er w
as a
t the
cat
tle p
ost,
and
did
not s
eem
ver
y in
tere
sted
in c
ropp
ing
(any
mor
e).
soilt
ype:
Chr
omic
Luv
sol
Pla
nts
wer
e 1
m h
igh
and
flow
erin
g on
the
fert
ilize
d pl
ot. M
ost p
lant
s w
ere
affe
cted
by
aphi
ds. W
eed
AW
HC
: 105
mm
/mP
hosp
horu
s co
nten
t top
soil:
1 p
pmco
vere
d ap
prox
imat
ely
5 %
. The
pla
nt d
ensi
ty w
as a
roun
d 15
,000
pla
nts/
ha, b
ut m
any
in-r
ow g
aps
and
fert
ilize
r ty
pe:
sing
le s
uper
phos
phat
eap
p ca
tionr
ate:
200
kg/
ha (
to 6
ppm
)cl
uste
rs w
ere
seen
. The
con
trol
plo
t was
a c
ompl
ete
failu
re.
tops
oil a
naly
sis
cont
rol p
lot:
vis
15/0
3/95
top
5ml
text
ure:
coa
rse
drai
nage
: wel
l dra
ned
soil
dept
h: 1
00+
cm
Con
side
rabl
e da
mag
e w
as d
one
by p
igeo
ns a
nd q
uele
a. A
few
sca
recr
ows
wer
e er
ecte
d, b
ut th
ey d
id n
otse
em v
ery
effe
ctiv
e.T
he B
oliw
orm
had
dis
appe
ared
.A fe
w p
lant
s ha
d fa
llen
on th
e gr
ound
. A p
ortio
n of
fert
ilize
d pl
ot:
plan
t den
sity
bef
ore
hinn
ing:
14,
000
pl/h
afie
ld w
as w
ell w
eede
d, th
e re
mai
ning
par
t was
cov
ered
by
man
y gr
asse
s (u
p to
20
%);
the
cont
rol p
lot
was
cov
ered
by
Ses
amum
ala
tum
.yi
eld
fert
ilize
d pl
ot:
670
kg/h
aC
YS
LAM
B p
redi
ctio
n: 8
10 k
g/ha
visi
t 16/
05/9
5yi
eld
cont
rol p
lot:
fa le
d
On
the
fert
ilize
d pl
ot, s
orgh
um w
as m
ixed
with
mel
ons;
the
plan
ts w
ere
stun
ted
and
poor
ly d
evel
oped
.vi
sit 1
4/11
/94
Har
vest
ed h
eads
, med
ium
siz
ed a
nd <
3 %
bird
dam
age,
wer
e dr
ied
at th
e tim
e of
the
visi
t.
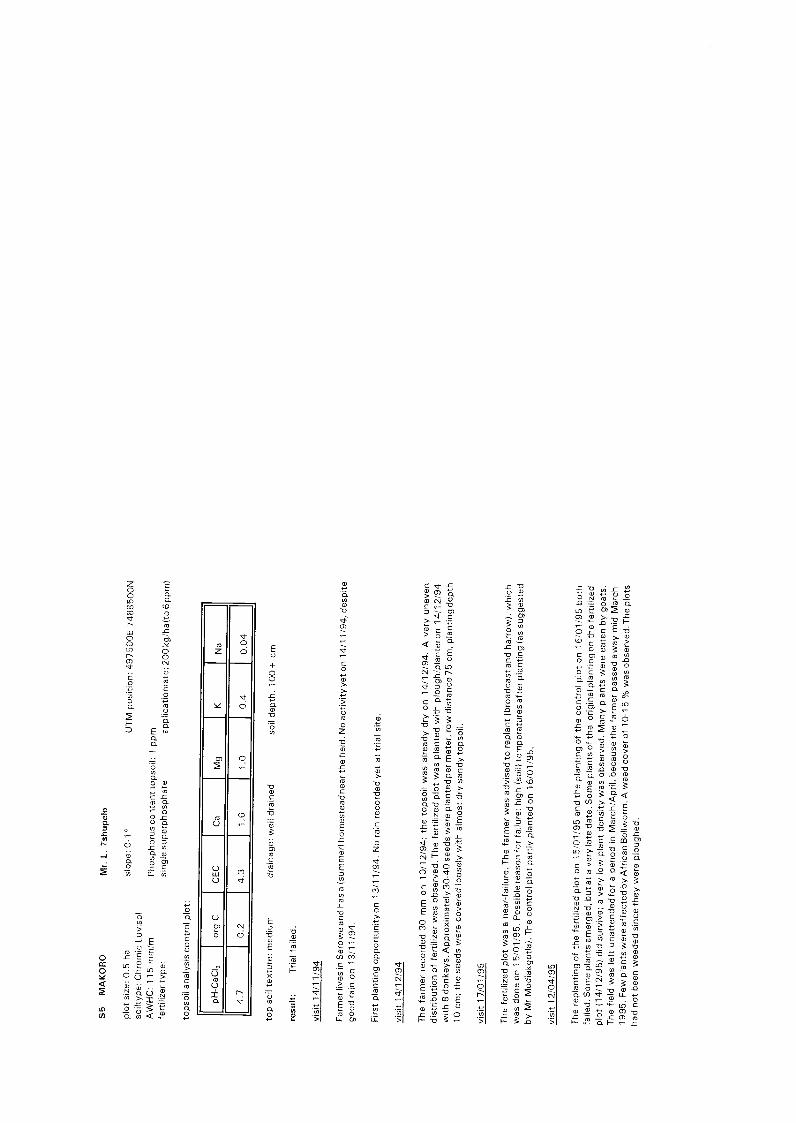
S5
MA
KO
RO
Mr.
L. T
shup
elo
plot
siz
e: 0
,5 h
aso
iltyp
e: C
hrom
ic L
uvis
olA
WF
IC: 1
15 m
m/m
fert
ilize
r ty
pe;
tops
oil a
naly
sis
cont
rol p
lot:
pH-C
aCI,
org
CC
EC
Ca
Mg
KN
a
4,7
0.2
4.3
1.6
1.0
0.4
0.04
top
soil
text
ure:
med
ium
dna
ge: w
ell d
rain
edso
il de
pth:
100
+ c
m
resu
lt:T
rial f
aile
d.
visi
t 14/
11/9
4
Far
mer
live
s in
Ser
owe
and
has
a (s
umm
er)
hom
este
adne
ar th
e fie
ld. N
o ac
tivity
yet
on 1
4/11
/94,
des
pite
good
rai
n on
13/
11/9
4.
Firs
t pla
ntin
g op
port
unity
on
13/1
1/94
. No
rain
rec
orde
d ye
t at t
rial s
i te
visi
t 14/
12/9
4
The
farm
er r
ecor
ded
30 m
m o
n 10
/12/
94; t
he to
psoi
l was
alre
ady
dry
on 1
4/12
/94.
Ave
ry u
neve
ndi
strib
utio
n of
fert
ilize
r w
as o
bser
ved.
The
fert
ilize
d pl
ot w
as p
lant
ed w
ith p
loug
h/pl
ante
ron
14/
12/9
4w
ith 8
don
keys
. App
roxi
mat
ely
30-4
0 se
eds
wer
e pl
ante
d pe
r m
eter
, row
dis
tanc
e 75
cm, p
lant
ing
dept
h10
cm
; the
see
ds w
ere
cove
red
loos
ely
with
alm
ost d
ry s
andy
tops
oil.
visi
t 17/
01/9
5
The
fert
ilize
d pl
ot w
as a
nea
r-fa
ilure
. The
farm
er w
as a
dvis
ed to
rep
lant
(br
oadc
ast a
nd h
arro
w),
whi
chw
as d
one
on 1
5/01
/95.
Pos
sibl
e re
ason
for
failu
re: h
igh
(soi
l) te
mpe
ratu
res
afte
r pl
antin
g (a
s su
gges
ted
by M
r M
odia
kgot
la).
The
con
trol
plo
t par
tly p
lant
ed o
n 16
/01/
95.
vis'
12/
04/9
5
The
rep
lant
ing
of th
e fe
rtili
zed
plot
on
15/0
1/95
and
the
plan
ting
of th
e co
ntro
l plo
ton
16/
01/9
5 bo
thfa
iled.
Som
e pl
ants
em
erge
d, b
ut a
t a v
ery
late
dat
e. S
ome
plan
ts o
f the
orig
inal
pla
ntin
gon
the
fert
ilize
dpl
ot 1
14/1
2/95
1 di
d su
rviv
e; a
ver
y lo
w p
lant
den
sity
was
obs
erve
d. M
any
plan
tsw
ere
eate
n by
goa
ts.
The
fiel
d w
as le
ft un
atte
nded
f or
a p
erio
d in
Mar
ch/A
pril,
bec
ause
the
farm
er p
asse
daw
ay m
id M
arch
1995
. Few
pla
nts
wer
e af
fect
ed b
y A
fric
an B
ollw
orm
, A w
eed
cove
r of
10-
15 %
vvas
obs
erve
d. T
he p
lots
had
not b
een
wee
ded
sinc
e th
ey w
ere
plou
ghed
.
slop
e: 0
-10
UT
M p
ositi
on: 4
9750
0E 7
4885
00N
Pho
spho
rus
cont
ent t
opso
il: 1
ppm
sing
le s
uper
phos
phat
ea
pplic
atio
nrat
e: 2
00 k
g/ha
(to
6 p
pm)

APPENDIX V EXAMPLE OF A BAR-CHART
An easy way of monitoring and comparing the progress of several trial sites is a bar-chart like the following:

2
FE
OS
1842
2214
873
8,73
1
3
ES
tEtE
E
PL.
P -
days
atte
r pl
antin
g (u
nder
opt
ima
circ
umst
ance
s),
pIou
gIon
gM
ania
g
S S
8 8
El .
8 8
8 8
f
3,5
BS
23E
6.6.
6633
.38
E
7003
1127
881
82
EE
135
.2-
3=11
I 181T
éT
W-
G -
stab
lishr
nerk
v_ye
geta
bse'
LL6T
im1
F -
flow
erin
gyi
eld
form
ato
Wee
ding
inis
carin
gge
rmin
ahoh
zoj
7140
DIS
TR
ICT
LOC
AT
ION
CO
DE
FA
RM
ER
NG
W.V
Ves
tS
eso
K9
Who
See
mok
won
a
NG
W.W
est
Gas
itaK
8
NG
W.N
oeM
Man
yana
K4
Kgo
!ego
Let
ole
NG
W N
orth
Loth
laka
ne W
K3
Kga
n D
eern
o
NO
W N
orth
PoI
okw
eK
5K
gom
so
NG
W.C
erar
alG
amos
wan
eK
1M
enem
/an°
Mod
utlw
a
NG
W.C
entr
aIT
wrd
,K
2Le
kau
Sel
ebal
eng
NO
W.S
outh
Kan
ngw
eK
6K
eele
diw
e K
osiw
e
NG
W.S
outh
Mrn
athe
the
N. K
7N
gaka
Kge
taet
sho
hare
Iong
Mon
gwaI
ale
K10
ISeb
oets
e M
osca
B.7
-601
1gP
ftane
Kll
Pet
rus
Chy
di
99
0E
l111
,1,7
9101
01/..
/.21.
.24.
'.2.7
a o
1011
12
13 1
4 IS
16
17 /0
192
32/ 2
2 23
24 Z
5282
733
2830
12
3 4
5 6
7 6
0 10
1/ 1
2 13
14
1518
17
18 1
0 27
2 21
22
2324
25 2
B .7
:St 2
320
12
3 4
5 e
7 0
0 10
11
12 1
3 14
0013
7838
1N
OW
0E61
SE
CO
DE
G3
8186
FE
WF
E82
32N
io
11ez
. iS
7=-7
roil'
f TT
1-1
WW
/IWW
iiWW
vy-
jyyj
_i
3 41
5
151
0 41
11
5,3
TT
-F
T I,
'
9 10
11 1
2131
4151
6171
8 19
2621
222
3242
526
L8.3
7: '
22 4
ser
e a
10i,
i2O
S18
19O
S31
1310
2425
1027
OS
3010
12
3456
7 8
9 1
011
1213
1415
1617
It .8
0211
5352
4OS
2835
Z10
351
2345
45 6
7 8
R 1
0111
2R
0688
6 pe
r
264V
0B55
.B77
al, .
7.-i
nCr,
TI-
1111
2a5
7
193
170

APPENDIX VI PHOTOGRAPHS
Photograph 1. Trial site K5 Polokwe date: 13/02/95
Two different germination phases and plant development stages. The two big plants in themiddle germinated on 18/01/95, while the small seedlings left and right germinated on09/02/95, following a rainfall event of 32 mm on 02/02/95.
Photograph 2. Trial site K1 Gamoswana date: 01/02/95
The fertilized plot in the background (right; bigger plants, darker green) and the control plotin the front (left). The plants are in the early vegetative stage, 26 days after planting.
Photograph 3. Trial site K1 Gamoswana date: 06/03/95
The fertilized plot in background (bigger plants, denser crop stand), and the control plotin the front (smaller plants, gaps in the rows). The plants are in the late vegetative stage,60 days after planting.
Photograph 4. Trial site K6 Kanngwe date: 05/05/95
Crop in the grain filling stage, 95 days after planting. The plants of the fertilized plot are1 25-1 50 cm high and have developed 1-3 tillers.
Photograph 5. Trial site M2 Xhana date: 23/02/95
Crop in flowering stage, 77 days after planting. The high number of tillers (4 are floweringand 2 more may develop later) is attributed to the low plant density (1700 plants/ha).
Photograph 6. Trial site Kll Pitsane date: 03/03/95
Flowering head, 64 days after planting. The plant is prone to bird attacks for approximatelythe next 30-45 days, during the grain filling and the early ripening stages.
Photograph 7. Trial site K10 Mongwalale date: 06/04/95
Grain filling stage, 90 days after planting. Secondary heads develop on the main stem,with noticeably smaller heads.
Photograph 8. Trial site K9 Sese date: 29/06/95
Harvest, 176 days after planting. The farmers let the heads dry on the stem, hence thetime between harvest and date of physiological maturity. The grain weight per head is onaverage 34 g for fully developed heads and 8 g for "mothalane".
86

'''.1kz.,-7,",.;,.ok i i,
":, ,.. !;,,,,,.. .i 1 , ,., . '
r ' i ''', Avl4 ;'''' .."-'t * ' ' e' ".".
',i. .4* tlf i i ' t ' 4) ',.6,4' t .,.. 1, t ' Ir4 4 ,. ' J '
. '',,ot Y ' i ' '...... ' / $ '' ,, 7." ..'
,, ! ,- tz. ,,' t' , A
J
,
^
r
8 7
77.4 r 414 , '071
^'' ' 7 74"4,7P 4
,, 4
4:r
7 4 ;.
41
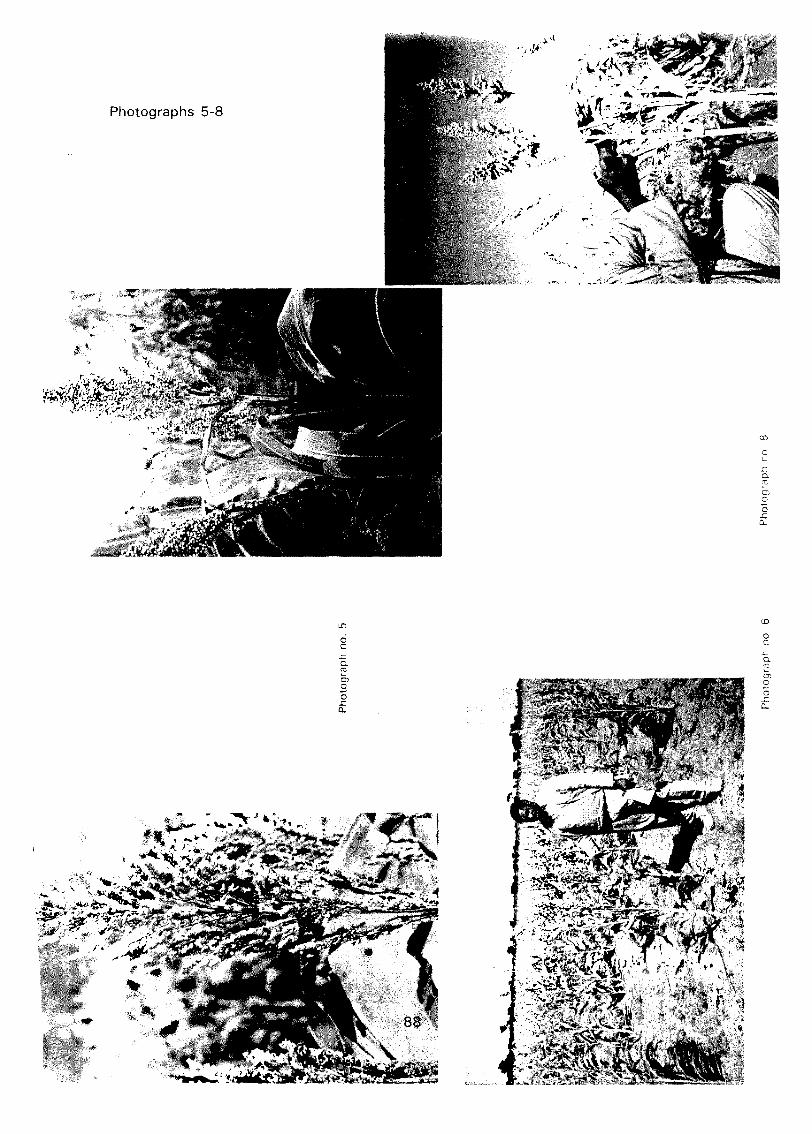
Photographs 5-8
,14
40. as.kir( 57;
t
Jo"- lefrHe.
o