On Experimental Facilities to Assist Modeling of Elastic ...
12
Proceedings of the 2009 ASEE Gulf-Southwest Annual Conference Baylor University Copyright ©2009, American Society for Engineering Education Session TA4-3 On Experimental Facilities to Assist Modeling of Elastic Behavior of Carbon Nanotube Polymer Composites : Review and Analysis of Literature B.S. Sathyanarayana, M.N. Srinivasan and X. Fan Mechanical Engineering Department Lamar University, Beaumont, TX 77710 Abstract This paper gives an account of the importance of interfacial properties affecting the elastic behavior of polymer-CNT nanocomposites and the experimental facilities that one needed to assess the properties. These experimentally determined properties are required to develop analytical models to predict realistic elastic behavior of polymer-CNT nanocomposites. Keywords: Carbon nanotubes, Polymer nanocomposites, Interface properties Introduction Carbon nanotubes (CNTs), discovered by Iijima in 1991 1 , are allotropes of carbon with a nanostructure that can have a length-to-diameter ratio greater than 1,000,000. These cylindrical carbon molecules have novel properties that make them potentially useful in many applications in nanotechnology, electronics, optics and other fields of materials science. They exhibit extraordinary strength and unique electrical properties, and are efficient conductors of heat. Inorganic nanotubes have also been synthesized. Nanotubes are members of the fullerene structural family, which also includes the spherical buckyballs. The cylindrical nanotube usually has at least one end capped with a hemisphere of the buckyball structure. Nanotubes are categorized as single walled nanotubes (SWNTs) and multiwalled nanotubes (MWNTs). Single-walled carbon nanotubes: Most single-walled nanotubes (SWNT) have a diameter of close to 1 nm, with a tube length that can be many thousands of times longer. The structure of a SWNT can be conceptualized by wrapping a one- atom-thick layer of graphite called graphene into a seamless cylinder. The way the graphene sheet is wrapped is represented by a pair of indices (n, m) called the chiral vector. The integers n and m denote the number of unit vectors along two directions in the honeycomb crystal lattice of graphene. If m=0, the nanotubes are called "zigzag". If n=m, the nanotubes are called "armchair". Otherwise, they are called “chiral”. In chiral nanotubes, the sheet is rolled up in a direction that differs from a symmetry axis and the equivalent atoms of each unit cell are aligned on a spiral. Multi-walled carbon nanotubes Multi-walled nanotubes (MWNT) consist of multiple layers of graphite rolled in on themselves to form a tube shape. There are two models which can be used to describe the structures of multi-walled nanotubes.
Transcript of On Experimental Facilities to Assist Modeling of Elastic ...
Proceedings of the 2009 ASEE Gulf-Southwest Annual Conference Baylor University
Copyright ©2009, American Society for Engineering Education
Session TA4-3
On Experimental Facilities to Assist Modeling of Elastic Behavior of Carbon Nanotube Polymer Composites : Review and Analysis
of Literature
B.S. Sathyanarayana, M.N. Srinivasan and X. Fan
Mechanical Engineering Department Lamar University, Beaumont, TX 77710
Abstract
This paper gives an account of the importance of interfacial properties affecting the elastic behavior of polymer-CNT nanocomposites and the experimental facilities that one needed to assess the properties. These experimentally determined properties are required to develop analytical models to predict realistic elastic behavior of polymer-CNT nanocomposites.
Keywords: Carbon nanotubes, Polymer nanocomposites, Interface properties
Introduction
Carbon nanotubes (CNTs), discovered by Iijima in 19911, are allotropes of carbon with a nanostructure that can have a length-to-diameter ratio greater than 1,000,000. These cylindrical carbon molecules have novel properties that make them potentially useful in many applications in nanotechnology, electronics, optics and other fields of materials science. They exhibit extraordinary strength and unique electrical properties, and are efficient conductors of heat. Inorganic nanotubes have also been synthesized. Nanotubes are members of the fullerene structural family, which also includes the spherical buckyballs. The cylindrical nanotube usually has at least one end capped with a hemisphere of the buckyball structure. Nanotubes are categorized as single walled nanotubes (SWNTs) and multiwalled nanotubes (MWNTs). Single-walled carbon nanotubes: Most single-walled nanotubes (SWNT) have a diameter of close to 1 nm, with a tube length that can be many thousands of times longer. The structure of a SWNT can be conceptualized by wrapping a one-atom-thick layer of graphite called graphene into a seamless cylinder. The way the graphene sheet is wrapped is represented by a pair of indices (n, m) called the chiral vector. The integers n and m denote the number of unit vectors along two directions in the honeycomb crystal lattice of graphene. If m=0, the nanotubes are called "zigzag". If n=m, the nanotubes are called "armchair". Otherwise, they are called “chiral”. In chiral nanotubes, the sheet is rolled up in a direction that differs from a symmetry axis and the equivalent atoms of each unit cell are aligned on a spiral.
Multi-walled carbon nanotubes Multi-walled nanotubes (MWNT) consist of multiple layers of graphite rolled in on themselves to form a tube shape. There are two models which can be used to describe the structures of multi-walled nanotubes.
Proceedings of the 2009 ASEE Gulf-Southwest Annual Conference Baylor University
Copyright ©2009, American Society for Engineering Education
In the Russian Doll model, sheets of graphite are arranged in concentric cylinders, e.g. a (0, 8) single-walled nanotube (SWNT) within a larger (0, 10) single-walled nanotube. In the Parchment model, a single sheet of graphite is rolled in around itself, resembling a scroll of parchment or a rolled up newspaper. The interlayer distance in multi-walled nanotubes is close to the distance between graphene layers in graphite, approximately 3.3 Å (330 pm).
Mechanical Properties
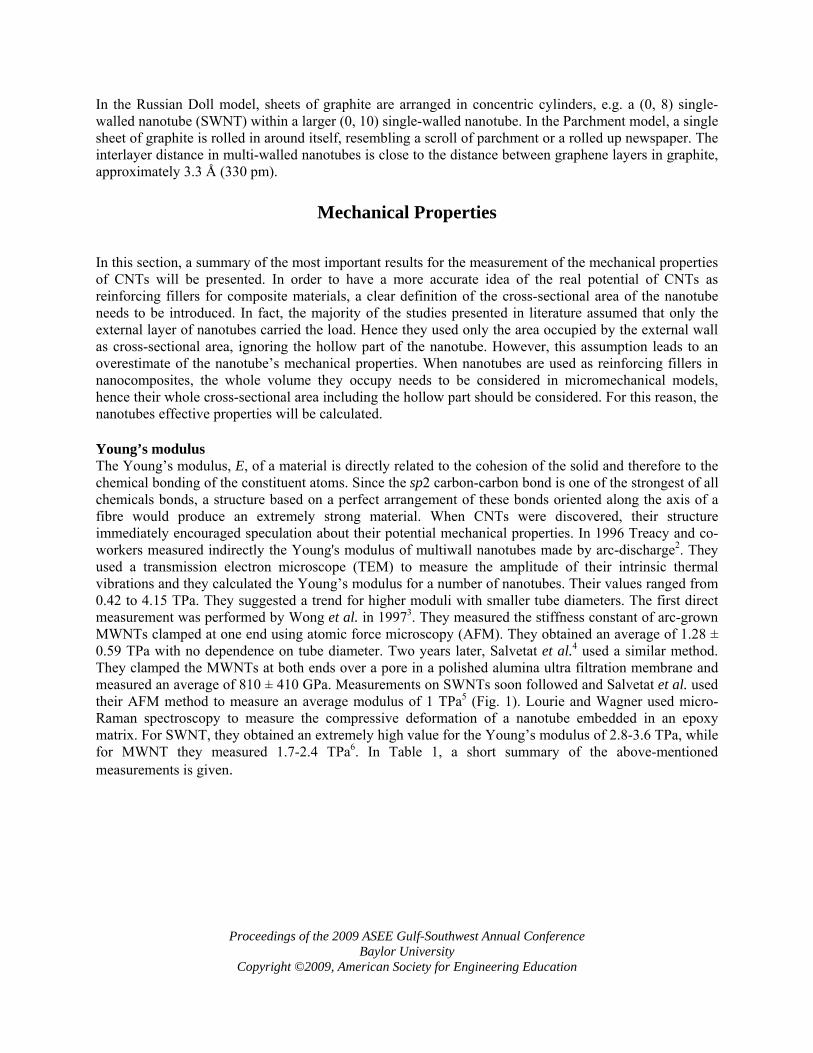
In this section, a summary of the most important results for the measurement of the mechanical properties of CNTs will be presented. In order to have a more accurate idea of the real potential of CNTs as reinforcing fillers for composite materials, a clear definition of the cross-sectional area of the nanotube needs to be introduced. In fact, the majority of the studies presented in literature assumed that only the external layer of nanotubes carried the load. Hence they used only the area occupied by the external wall as cross-sectional area, ignoring the hollow part of the nanotube. However, this assumption leads to an overestimate of the nanotube’s mechanical properties. When nanotubes are used as reinforcing fillers in nanocomposites, the whole volume they occupy needs to be considered in micromechanical models, hence their whole cross-sectional area including the hollow part should be considered. For this reason, the nanotubes effective properties will be calculated. Young’s modulus The Young’s modulus, E, of a material is directly related to the cohesion of the solid and therefore to the chemical bonding of the constituent atoms. Since the sp2 carbon-carbon bond is one of the strongest of all chemicals bonds, a structure based on a perfect arrangement of these bonds oriented along the axis of a fibre would produce an extremely strong material. When CNTs were discovered, their structure immediately encouraged speculation about their potential mechanical properties. In 1996 Treacy and co-workers measured indirectly the Young's modulus of multiwall nanotubes made by arc-discharge2. They used a transmission electron microscope (TEM) to measure the amplitude of their intrinsic thermal vibrations and they calculated the Young’s modulus for a number of nanotubes. Their values ranged from 0.42 to 4.15 TPa. They suggested a trend for higher moduli with smaller tube diameters. The first direct measurement was performed by Wong et al. in 19973. They measured the stiffness constant of arc-grown MWNTs clamped at one end using atomic force microscopy (AFM). They obtained an average of 1.28 ± 0.59 TPa with no dependence on tube diameter. Two years later, Salvetat et al.4 used a similar method. They clamped the MWNTs at both ends over a pore in a polished alumina ultra filtration membrane and measured an average of 810 ± 410 GPa. Measurements on SWNTs soon followed and Salvetat et al. used their AFM method to measure an average modulus of 1 TPa5 (Fig. 1). Lourie and Wagner used micro-Raman spectroscopy to measure the compressive deformation of a nanotube embedded in an epoxy matrix. For SWNT, they obtained an extremely high value for the Young’s modulus of 2.8-3.6 TPa, while for MWNT they measured 1.7-2.4 TPa6. In Table 1, a short summary of the above-mentioned measurements is given.
Proceedings of the 2009 ASEE Gulf-Southwest Annual Conference Baylor University
Copyright ©2009, American Society for Engineering Education
Figure.1. (a) AFM image of a SWNT rope adhered to the polished alumina ultra filtration membrane, with a portion bridging the pore of the membrane. (b) Schematic of the measurement: the AFM is used to apply a load to the nanobeam and to determine directly the resulting direction5.
Table 1, Experimental values of Young’s modulus for CNTs.
Method Type of CNT Young’s modulus Comments
Amplitude of thermal vibration2
MWNTs 0.41-4.15Tpa Higher moduli for smaller tube
diameters Beam-bending via
AFM5 SWNTs ≈1 TPa for d=3nm,
decreasing to< 0.1 Gpa for larger
diameter
Estimated shear moduli Of SWNT bundle in the order
of 1GPa Beam-bending via
AFM4 MWNTs CVD:≈ 10≈50 GPa
Arc: 810+or- 410 GPa
Order of magnitude increase after
annealing Compressive
deformation with micro-Raman spectroscopy6
SWNTs and MWNTs
2.8-3.6 TPa SWNTs 1.7-2.4 TPa
MWNTs
E of SWNTs was derived from a
concentric cylinder model for thermal
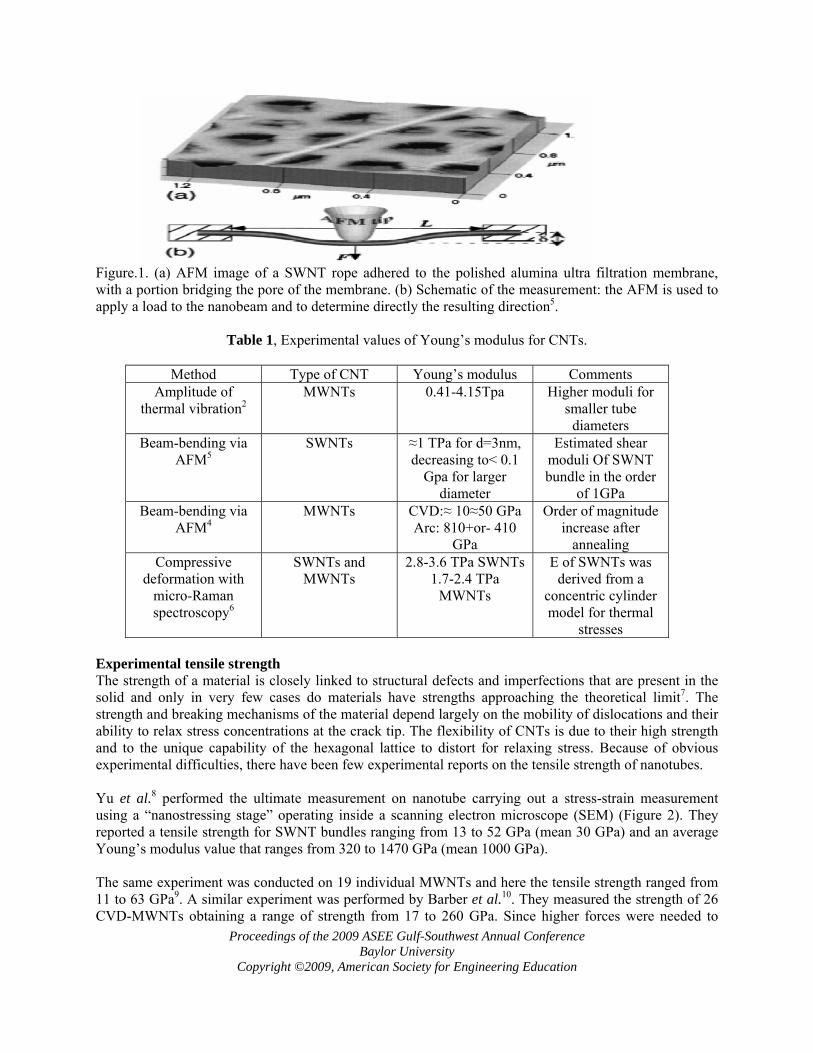
stresses Experimental tensile strength The strength of a material is closely linked to structural defects and imperfections that are present in the solid and only in very few cases do materials have strengths approaching the theoretical limit7. The strength and breaking mechanisms of the material depend largely on the mobility of dislocations and their ability to relax stress concentrations at the crack tip. The flexibility of CNTs is due to their high strength and to the unique capability of the hexagonal lattice to distort for relaxing stress. Because of obvious experimental difficulties, there have been few experimental reports on the tensile strength of nanotubes. Yu et al.8 performed the ultimate measurement on nanotube carrying out a stress-strain measurement using a “nanostressing stage” operating inside a scanning electron microscope (SEM) (Figure 2). They reported a tensile strength for SWNT bundles ranging from 13 to 52 GPa (mean 30 GPa) and an average Young’s modulus value that ranges from 320 to 1470 GPa (mean 1000 GPa). The same experiment was conducted on 19 individual MWNTs and here the tensile strength ranged from 11 to 63 GPa9. A similar experiment was performed by Barber et al.10. They measured the strength of 26 CVD-MWNTs obtaining a range of strength from 17 to 260 GPa. Since higher forces were needed to
Proceedings of the 2009 ASEE Gulf-Southwest Annual Conference Baylor University
Copyright ©2009, American Society for Engineering Education
break nanotubes with more irregular tube wall structure, it was concluded that the strengthening mechanism was due to the interaction between the walls of the nanotubes. An indirect way to estimate the tensile strength of nanotubes is to use the load transferred by embedding the CNTs in matrix material. Wagner et al. reported a tensile strength of 55 GPa11. These results are far from the theoretical value previously calculated and also from theoretical predictions by Yakobson et al. using MD simulations12, where they report a tensile strength of 150 GPa. In Table 2, a short summary of the above-mentioned measurements is given.
Figure.2. SEM images showing a SWNT rope tensile-loading experiment, before and after the SWNT rope was broken8
Table.2, Experimental Values of tensile strength for CNTs
Method Type of CNT Tensile strength Comments
Nano-tensile test via AFM8
SWNT bundle 13-52 GPa Only the perimeter of the ropes is
thought to carry the load
Nano-tensile test Via AFM9
Arc-grown MWNTs 11-63 GPa The outer layer is used to calculate the cross-sectional area
Nano-tensile test Via AFM10
CVD-grown MWNTs
17-260 GPa Higher breaking force for more
Proceedings of the 2009 ASEE Gulf-Southwest Annual Conference Baylor University
Copyright ©2009, American Society for Engineering Education
irregular tube wall structure
Stress-induced fragmentation11
Arc-grown MWNTs 55 GPa Stress transfer efficiency at least
one order of magnitude larger than conventional
fibre based composites
From the data available to date, it can be concluded that nanotubes show an extraordinary performance compared to graphite or Kevlar fibers, and stainless steel as the nanotubes are at least 100 times stronger than steel, but only one-sixth as heavy.
Polymer-matrix Nanocomposites
One of the most intriguing applications of Carbon Nanotube is the polymer/CNT nanocomposites. Because of their high mechanical strength, aspect ratio and modulus, carbon nanotubes (CNTs) are being considered as nanoscale fibers to enhance the performance of polymer composite materials. Polymers such as epoxy, thermoplastics, gels, as well as poly methyl methacrylate (PMMA) have been used as the matrix. The conductivity, strength, elasticity, toughness, and durability of formed composites may all be substantially improved by the addition of nanotubes. To assess the feasibility and advantages of using polymer nanocomposites, issues such as the basic principle of reinforcement of polymers by SWNTs, the fracture process, as well as the nanotube-polymer interfacial properties (wetting, stress transfer, and adhesion), need to be examined thoroughly and resolved. One of the most difficult problems in the physics of polymer nanocomposites is the measurement of the extent and efficiency of stress transfer through the interface between nanotubes and matrix. The importance of this parameter rests on the fact that, in the polymer nanocomposites of the future, particularly efficient matrix-to-nanotube stress transfer will be essential to take advantage of the very high Young’s modulus and strength of the nanotubes. Also, the very high aspect ratio of nanotubes (length/diameter ~ μm/nm) implies that, very large interfacial areas are available for stress transfer, much more so than in micron-size fiber composites. In the latter traditional systems, the matrix-fiber stress transfer mechanism is relatively well described by classical composite elasticity models, with much additional insight (regarding stress profiles and interfacial stress transfer ability) provided by micro-Raman spectroscopy. The interfacial chemistry in these traditional micro-scale systems is also well understood. By contrast, there has only been speculation as to whether the strength of the interface between SWNTs and polymers is significant at all, and experimental methods for its measurement are only in an initial stage. To determine that strength in a direct experimental way is a challenging task because of the technical difficulties involved in the manipulation of nanoscale objects. Some key questions and challenges are: • Is there evidence of adequate wetting of nanotubes by polymers (wetting is a necessary, but not sufficient, condition for good adhesion)? • Is there evidence of stress transfer and what are the expected values? • What experimental techniques can be developed to measure interfacial strength and adhesion at the nanoscale? • What are the possible molecular mechanisms for nanotube-polymer adhesion?
Proceedings of the 2009 ASEE Gulf-Southwest Annual Conference Baylor University
Copyright ©2009, American Society for Engineering Education
It is likely that the wetting ability and the interfacial strength are functions of the nanotube geometry, such as wall thickness and possibly chirality, and of the (physical) chemistry of the external graphene surface. Evidence for nanotube-polymer wetting in the literature is limited, but is quite convincing. Good wetting/coating of MWNTs by polyhydroxyaminoether and by polypyrroles have been observed. Using transmission electron microscopy (TEM), (Wagner and collaborators) have provided evidence of wetting of SWNT ropes by epoxy and of MWNT by isotactic polypropylene and polyethylene glycol (PEG). Additionally, a Wilhelmy force balance method has been used to determine the external wetting angles of SWNTs with PEG and glycol13. As to the issue of stress transfer, adhesion, and interfacial strength, several results are available, focusing mainly on polymethyl methacrylate-, polystyrene-, and epoxy containing MWNTs and SWNTs. The principal author will utilize the interfacial properties obtained by different experiments to complete a finite element model that will be used to predict the elastic behavior of carbon nanotube polymer composites.
Characterization of polymer nanocomposites to determine their interfacial properties
The experimental methods have used one or more of the equipments described below to obtain information on the interfacial characteristics of carbon nanotube polymer composites. Scanning Probe Microscopes Scanning probe microscopes are a family of microscopes that have the following modes of operation: scanning tunneling microscopy (STM), atomic force microscopy (AFM), magnetic force microscopy (MFM), electric force microscopy (EFM), tunneling AFM (TUNA), current sensing AFM (CSAFM) magnetic resonance force microscopy (MRFM), electron spin resonance STM (ESR-STM), near field scanning optical microscopy (NSOM), and others. In all cases a small probe is scanned in close proximity to or in contact with a sample. Depending on the technique different aspects of the sample can be interrogated. STM uses an atomically sharp Pt or W probe in close proximity to a conductive sample under bais to record the tunneling current between the sample and the probe. AFM, MFM, EFM, TUNA and CSAFM use a MEMS based probe positioned in the near field to record the topography, magnetic field, electric field and tunneling current and current flow respectively. Spectroscopic data can be recorded in the advanced techniques such as MRFM and ESR-STM. NSOM also uses a MEMS based probe but can collect optical and spectroscopic data simultaneously.
Proceedings of the 2009 ASEE Gulf-Southwest Annual Conference Baylor University
Copyright ©2009, American Society for Engineering Education
Atomic Force Microscope
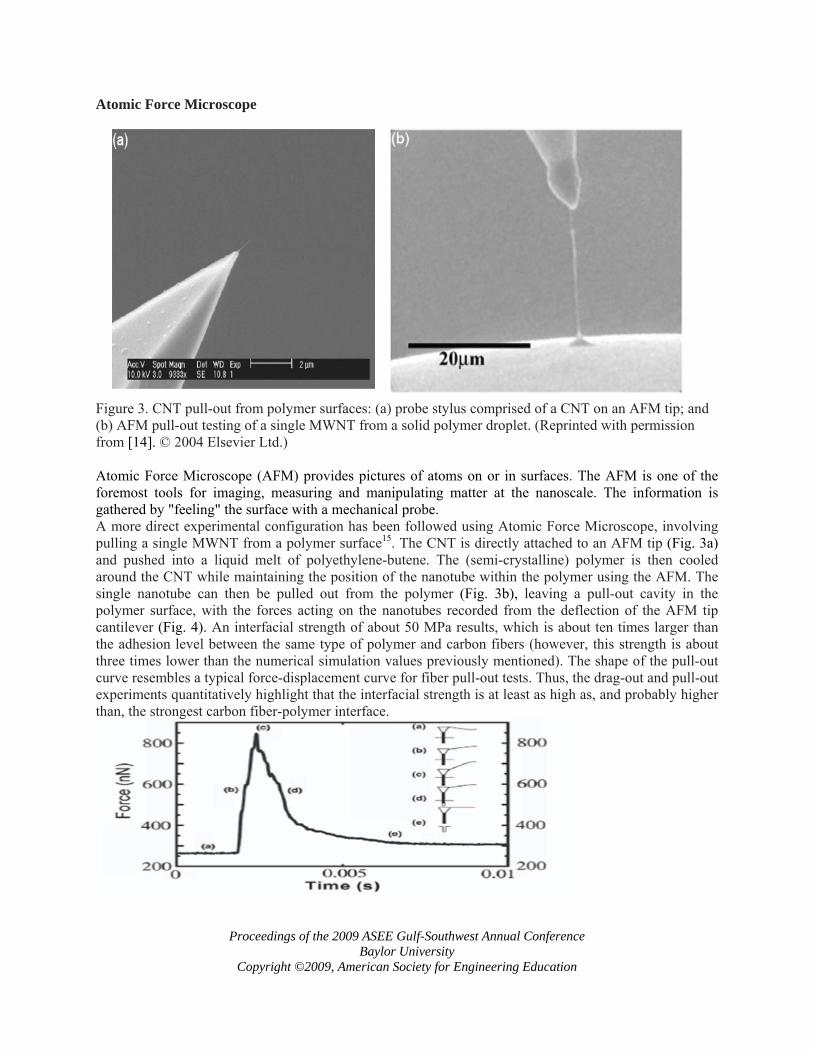
Figure 3. CNT pull-out from polymer surfaces: (a) probe stylus comprised of a CNT on an AFM tip; and (b) AFM pull-out testing of a single MWNT from a solid polymer droplet. (Reprinted with permission from [14]. © 2004 Elsevier Ltd.) Atomic Force Microscope (AFM) provides pictures of atoms on or in surfaces. The AFM is one of the foremost tools for imaging, measuring and manipulating matter at the nanoscale. The information is gathered by "feeling" the surface with a mechanical probe. A more direct experimental configuration has been followed using Atomic Force Microscope, involving pulling a single MWNT from a polymer surface15. The CNT is directly attached to an AFM tip (Fig. 3a) and pushed into a liquid melt of polyethylene-butene. The (semi-crystalline) polymer is then cooled around the CNT while maintaining the position of the nanotube within the polymer using the AFM. The single nanotube can then be pulled out from the polymer (Fig. 3b), leaving a pull-out cavity in the polymer surface, with the forces acting on the nanotubes recorded from the deflection of the AFM tip cantilever (Fig. 4). An interfacial strength of about 50 MPa results, which is about ten times larger than the adhesion level between the same type of polymer and carbon fibers (however, this strength is about three times lower than the numerical simulation values previously mentioned). The shape of the pull-out curve resembles a typical force-displacement curve for fiber pull-out tests. Thus, the drag-out and pull-out experiments quantitatively highlight that the interfacial strength is at least as high as, and probably higher than, the strongest carbon fiber-polymer interface.
Proceedings of the 2009 ASEE Gulf-Southwest Annual Conference Baylor University
Copyright ©2009, American Society for Engineering Education
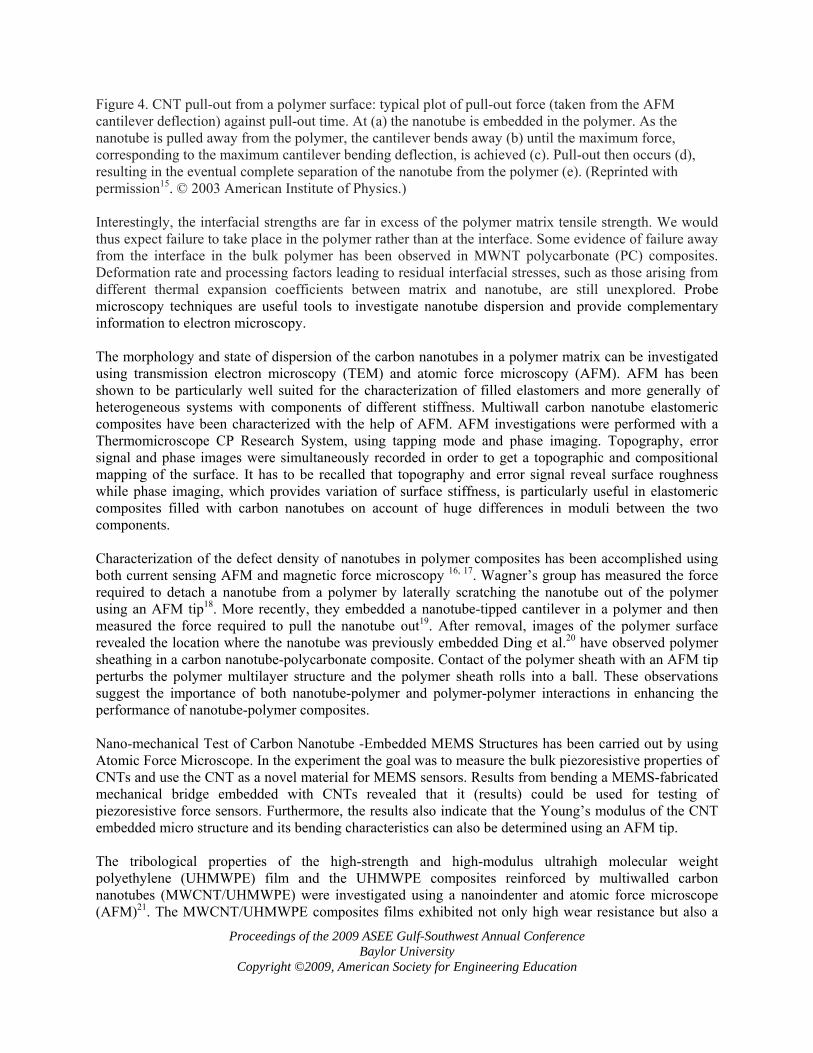
Figure 4. CNT pull-out from a polymer surface: typical plot of pull-out force (taken from the AFM cantilever deflection) against pull-out time. At (a) the nanotube is embedded in the polymer. As the nanotube is pulled away from the polymer, the cantilever bends away (b) until the maximum force, corresponding to the maximum cantilever bending deflection, is achieved (c). Pull-out then occurs (d), resulting in the eventual complete separation of the nanotube from the polymer (e). (Reprinted with permission15. © 2003 American Institute of Physics.) Interestingly, the interfacial strengths are far in excess of the polymer matrix tensile strength. We would thus expect failure to take place in the polymer rather than at the interface. Some evidence of failure away from the interface in the bulk polymer has been observed in MWNT polycarbonate (PC) composites. Deformation rate and processing factors leading to residual interfacial stresses, such as those arising from different thermal expansion coefficients between matrix and nanotube, are still unexplored. Probe microscopy techniques are useful tools to investigate nanotube dispersion and provide complementary information to electron microscopy. The morphology and state of dispersion of the carbon nanotubes in a polymer matrix can be investigated using transmission electron microscopy (TEM) and atomic force microscopy (AFM). AFM has been shown to be particularly well suited for the characterization of filled elastomers and more generally of heterogeneous systems with components of different stiffness. Multiwall carbon nanotube elastomeric composites have been characterized with the help of AFM. AFM investigations were performed with a Thermomicroscope CP Research System, using tapping mode and phase imaging. Topography, error signal and phase images were simultaneously recorded in order to get a topographic and compositional mapping of the surface. It has to be recalled that topography and error signal reveal surface roughness while phase imaging, which provides variation of surface stiffness, is particularly useful in elastomeric composites filled with carbon nanotubes on account of huge differences in moduli between the two components. Characterization of the defect density of nanotubes in polymer composites has been accomplished using both current sensing AFM and magnetic force microscopy 16, 17. Wagner’s group has measured the force required to detach a nanotube from a polymer by laterally scratching the nanotube out of the polymer using an AFM tip18. More recently, they embedded a nanotube-tipped cantilever in a polymer and then measured the force required to pull the nanotube out19. After removal, images of the polymer surface revealed the location where the nanotube was previously embedded Ding et al.20 have observed polymer sheathing in a carbon nanotube-polycarbonate composite. Contact of the polymer sheath with an AFM tip perturbs the polymer multilayer structure and the polymer sheath rolls into a ball. These observations suggest the importance of both nanotube-polymer and polymer-polymer interactions in enhancing the performance of nanotube-polymer composites. Nano-mechanical Test of Carbon Nanotube -Embedded MEMS Structures has been carried out by using Atomic Force Microscope. In the experiment the goal was to measure the bulk piezoresistive properties of CNTs and use the CNT as a novel material for MEMS sensors. Results from bending a MEMS-fabricated mechanical bridge embedded with CNTs revealed that it (results) could be used for testing of piezoresistive force sensors. Furthermore, the results also indicate that the Young’s modulus of the CNT embedded micro structure and its bending characteristics can also be determined using an AFM tip. The tribological properties of the high-strength and high-modulus ultrahigh molecular weight polyethylene (UHMWPE) film and the UHMWPE composites reinforced by multiwalled carbon nanotubes (MWCNT/UHMWPE) were investigated using a nanoindenter and atomic force microscope (AFM)21. The MWCNT/UHMWPE composites films exhibited not only high wear resistance but also a
Proceedings of the 2009 ASEE Gulf-Southwest Annual Conference Baylor University
Copyright ©2009, American Society for Engineering Education
low friction coefficient compared to the pure UHMWPE films. The high wear resistance was attributed to the formation of the new microstructure in the composites due to the addition of MWCNTs. Transmission Electron Microscopy Transmission electron microscopes use a much more intense electron beam when compared to the beam used in Scanning Electron Microscopes (SEM). These can be in the range of 200 – 300 keV for most commercial instruments. The collection of the SE, BSE, Auger electrons and x-rays can be achieved just as in SEM, but in addition the electron beam that passes entirely through the sample can be collected generating a transmission electron image. These electrons can be filtered based on how much energy was lost to the sample allowing for an additional spectroscopic technique. The scanning and transmission electron microscopes use of an electron beam to image a sample is a much higher resolution technique compared to optical microscopy, due to the much smaller characteristic wavelength of the electrons compared to the wavelength of visible photons. TEM, being the highest resolution technique is typically capable of imaging samples up to atomic resolution.
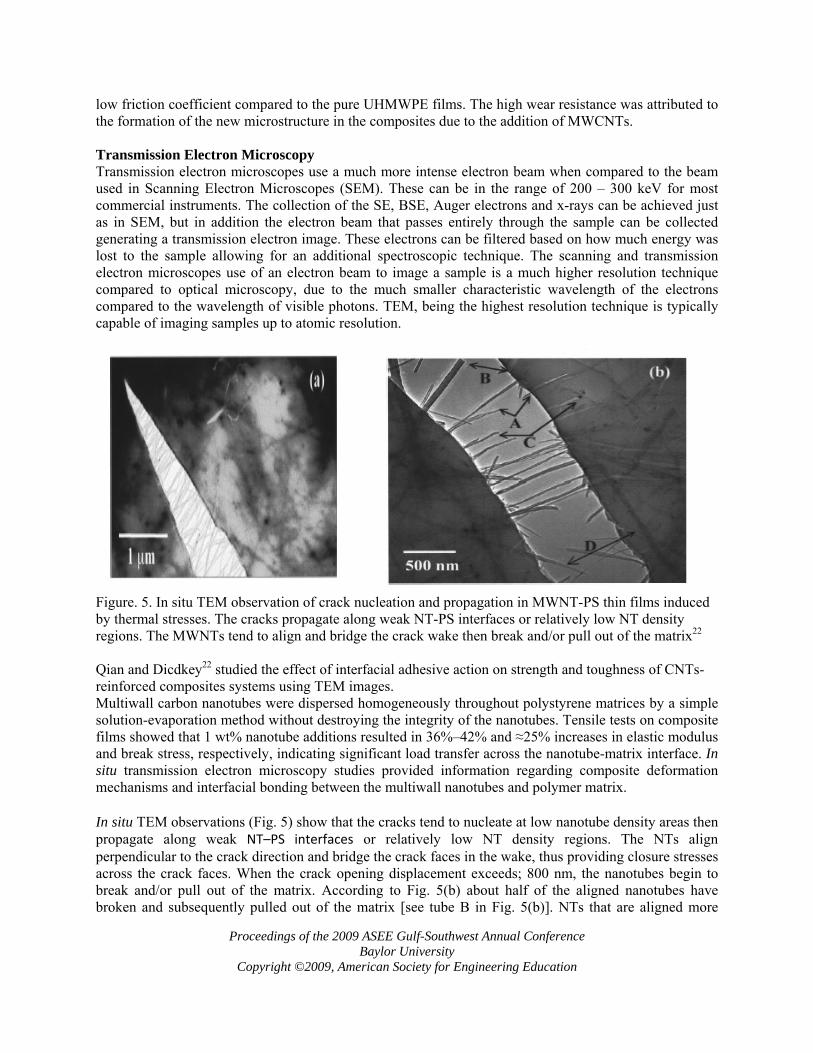
Figure. 5. In situ TEM observation of crack nucleation and propagation in MWNT-PS thin films induced by thermal stresses. The cracks propagate along weak NT-PS interfaces or relatively low NT density regions. The MWNTs tend to align and bridge the crack wake then break and/or pull out of the matrix22 Qian and Dicdkey22 studied the effect of interfacial adhesive action on strength and toughness of CNTs-reinforced composites systems using TEM images. Multiwall carbon nanotubes were dispersed homogeneously throughout polystyrene matrices by a simple solution-evaporation method without destroying the integrity of the nanotubes. Tensile tests on composite films showed that 1 wt% nanotube additions resulted in 36%–42% and ≈25% increases in elastic modulus and break stress, respectively, indicating significant load transfer across the nanotube-matrix interface. In situ transmission electron microscopy studies provided information regarding composite deformation mechanisms and interfacial bonding between the multiwall nanotubes and polymer matrix. In situ TEM observations (Fig. 5) show that the cracks tend to nucleate at low nanotube density areas then propagate along weak NT–PS interfaces or relatively low NT density regions. The NTs align perpendicular to the crack direction and bridge the crack faces in the wake, thus providing closure stresses across the crack faces. When the crack opening displacement exceeds; 800 nm, the nanotubes begin to break and/or pull out of the matrix. According to Fig. 5(b) about half of the aligned nanotubes have broken and subsequently pulled out of the matrix [see tube B in Fig. 5(b)]. NTs that are aligned more
Proceedings of the 2009 ASEE Gulf-Southwest Annual Conference Baylor University
Copyright ©2009, American Society for Engineering Education
parallel to the crack propagation direction tend to break between the crack faces rather than in the matrix [see tube D in Fig. 5(b)]. Some tubes have broken at obvious defects, such as tube C in Fig. 5(b) which has broken at the Fe catalyst particle. Annealing the NTs at high temperatures (>2200 °C) can be used to remove the Fe catalyst inclusions and other defects and potentially increase the strength of the NTs and the composites derived from them. TEM has been used to give site specific morphology and d-spacing in polymer-layered silicate nanocomposite (PLSNs) 23. It has also been used to demonstrate nanotube dispersion and orientation in CNT/polymer nanocomposite. One such study has been performed by Dondero and Gorga24. Their study involved determining the Morphological and mechanical properties of carbon nanotube/polymer composites via melt compounding. There they used transmission electron microscope to demonstrate nanotube dispersion and orientation. X-ray photoelectron spectroscopy (XPS) X-ray photoelectron spectroscopy (XPS) is a quantitative spectroscopic technique that measures the elemental composition, empirical formula, chemical state and electronic state of the elements that exist within a material. XPS spectra are obtained by irradiating a material with a beam of aluminium or magnesium X-rays while simultaneously measuring the kinetic energy (KE) and number of electrons that escape from the top 1 to 10 nm of the material being analyzed. XPS requires ultra-high vacuum (UHV) conditions.It has been used for investigating the elemental composition and the associated chemical bonding states of the near-surface region of epoxy/single-walled carbon nanotube (SWNT) nanocomposites. Scanning Electron Microscope A scanning electron microscope employs the use of high-energy electrons, rather than photons, to image a surface. The sample must have a moderate electrical conductivity and be stable in a high vacuum environment. Some new environmental scanning electron microscopes can handle low vacuum and high efficiency in-lens detectors can handle low conductivity samples, but for the most part conductivity and high vacuum stability are requirement. The primary electron beam is scanned over the surface generating secondary electrons (SE), backscattered electrons (BSE), and Auger electrons, in addition to x-rays. The Auger electrons and x-rays can be collected to give spectroscopic or chemical identification. The secondary electrons are collected to generate the topographical images. BSE are used generate maps based on atomic number. As the primary beam is scanned its position is mapped with respect to the number of SE, BSE, Auger electrons and x-rays recorded at their respective detectors. The SEM is used on the composite surface and cross-section to determine bulk dispersion.
If additional information is required beyond the degree of dispersion, then direct imaging of the nanotubes by TEM yields information on the size and packing of individual bundles. The use of FE-SEM over conventional SEM is not necessary to assess the dispersion, but it can be beneficial for composites with limited conductivity or samples susceptible to significant beam damage.
Summary
This paper briefly describes carbon nanotubes and CNT polymer composites, their properties and importance. This is followed by the explanation on the interfacial properties and their importance in determining the elastic properties of CNT nanocomposites. Also, facilities required to determine these interfacial properties have been discussed. From the information, it can be stated that though experiments with the help of available facilities have been able to better understand the behavior of CNT composites, the physics of interactions between CNT and its surrounding matrix material in such nano-composites has
Proceedings of the 2009 ASEE Gulf-Southwest Annual Conference Baylor University
Copyright ©2009, American Society for Engineering Education
yet to be better elucidated and methods for determining the parameters controlling interfacial characteristics such as interfacial shear stress, are still challenging.
References
1. Monthioux, M, Kuznetsov, V.L., 2006, "Who should be given the credit for the discovery of carbon
nanotubes?”, Carbon, , p 44, http://www.cemes.fr/fichpdf/guesteditorial.pdf 2. Treacy, M. M. J., Ebbesen, T. W., Gibson, L. M., 1996, Nature., Vol.381, p.678. 3. Wong, E. W., Sheehan, P. E., Lieber, C. M., Science. 1997, Vol. 277, p.1971. 4. Salvetat, J.P., Kulik, A. J., Bonard, J.M., Briggs, D., Stockli, T., Metenier, K., Bonnamy, N. A.,Beguin,
F.,Burnham, N. A., Forro, L., 1999,Adv. Mater., Vol.11, p.161. 5. Salvetat, J.P.; Andrew, G.; Briggs, D.; Bonard, J.M., Basca, R. R., Kulik, A. J., 1999, Phys. Rev. Lett.,
Vol.82, p.944. 6. Lourie, O., Wagner, H. D., 1998, J. Mater. Res., Vol. 13, p.2418. 7. Kelly, A., MacMillan, N. H., 1988, Strong Solids, Oxford Science Publications, Clarendon Press, Oxford 8. Yu, M. F., Files, B. S., Arepalli, S., and Ruoff R. S., 2000, Phys. Rev. Lett., Vol. 84, p.5552. 9. Yu, M. F., Lourie, O., Dyer, M. J., Moloni, K., Kelly, T. F., Ruoff, R. S., 2000,Science. Vol. 287, p.637 10. Barber, A., Andrews, R., Schadler, L. S., Wagner, H. D., 2005,Appl. Phys. Lett, Vol. 87, pp.203,1061. 11. Wagner, H. D., Lourie, O., Feldman, Y., Tenne, R. 1998, Appl. Phys. Lett., Vol.72, p.188. 12. Yakobson, B. I.., Avouris, P., 2001, Topics in Applied Physics, Vol. 80, p.287. 13. Barber, A. H., et al., 2004, Phys. Rev. Lett., Vol. 92, pp.186,1031 14. Barber, A. H., et al., 2004,Compos. Sci. Technol., Vol. 64, p. 2283 15. Barber, A. H., et al., 2003,Appl. Phys. Lett., Vol. 82, p.4140 16. Li, J., Stevens, R., Delzeit, L., Ng, H.T., Cassell, A., Han, J., Meyyappan, M., “ Electronic properties of
multiwalled carbon nanotubes in an embedded vertical array”, 2002,Applied Physics Letters, Vol.81, pp. 910,911,912.
17. Lillehei, P.T., Park,C., Rouse, J.H. Siochi, E.J., “Imaging Carbon Nanotubes in High Performance Polymer Composites via Magnetic Force Microscopy”, 2002,Nano Letters, Vol. 2, pp.827,828,829.
18. Cooper, C.A., Cohen, S.R., Barber, A.H., Wagner, H.D., 2002, “Detachment of nanotubes from a polymer matrix”, Applied Physics Letters , Vol. 81, pp.3873,3874,3875.
19. Barber,A.H., Cohen, S.R., Wagner,H.D., 2003, “Measurement of carbon nanotube-polymer interfacial strength”, Applied Physics Letters, Vol. 82; pp.4140,4141,4142
20. Ding, W., Eitan, A., Fisher, F.T., Chen, X., Dikin, D.A., Andrews, R., Brinson, L.C., Schadler, L., Ruoff, R.L., “Direct Observation of Polymer Sheathing in Carbon Nanotube-Polycarbonate Composites”, 2003,Nano Letters, Vol. 3, pp.1593-97.
21. Wei, Z., Zhao,Y., Ruan, S.L., Gao, P., and T. Yu, T.X., 2006, Surf. Interface Anal., Vol. 38, 883–886. 22. Qian, D., Dickey, E.C., Andrews, R., and Rantell, T., 2000, Appl. Phys. Lett., Vol.76, p.20 23. Morgan, A.B., Gilman, J.W., “Characterization of Polymer-Layered Silicate (Clay) Nanocomposites by Transmission Electron
Microscopy and X-Ray Diffraction: A Comparative Study”, 2003, J. Applied Polymer Science, Vol..87, pp. 1329-1338 24. Dondero W.E, and Gorga R.E ., 2006, Journal of Polymer Science Part B: Polymer Physics, Vol. 44, pp 864-878
B. S. SATHYANARAYANA Mr. Sathyanarayana is a student of Master of Engineering Science in Mechanical Engineering at Lamar University. Presently, he is working on a thesis in the field of Nanotechnology, with specialization in the field of Carbon Nanotube Polymer Composites. MALUR N. SRINIVASAN Dr. Srinivasan currently serves as a Professor of Mechanical Engineering at Lamar University in Beaumont, Texas. His teaching and research interests are in the materials and manufacturing area, including design-led materials and
Proceedings of the 2009 ASEE Gulf-Southwest Annual Conference Baylor University
Copyright ©2009, American Society for Engineering Education
manufacturing process selection, preparation and consolidation of nanomaterials and quality improvement in manufactured products. Dr. Srinivasan is a registered professional engineer in the State of Texas. XUEJUN FAN Dr. Xuejun Fan is an Associate Professor in the Department of Mechanical Engineering at Lamar University, Beaumont, Texas. His current research interests lie in the areas of reliability and mechanics in micro- and nano- electronics and packaging, multi-scale material modeling and experiments for integrated small scale structures.


![Experimental characterization of meso-scale deformation ...Deformation region Reference Polycrystalline (ice) Numerical 230 6.13 Linear elastic [13] Polycrystalline (copper) Numerical](https://static.fdocuments.us/doc/165x107/60deaa56f9a3fa7ea40f40c5/experimental-characterization-of-meso-scale-deformation-deformation-region-reference.jpg)