
On Demographics, Growth and Investing Society Oklahoma...• 25% maximum tax rate on qualified ......
45
On Demographics, Growth and Investing When the structural collides with the cyclical CFA Society Oklahoma D. Harris Kere, CFA Investment Strategist Aegon Asset Management US March 13, 2018 Aegon Asset Management is the global investment management brand of the Aegon Group N.V. and is comprised of Aegon USA Investment Management, LLC (Aegon Asset Management US), Aegon USA Realty Advisors, LLC (Aegon Real Assets US), Kames Capital plc (Kames Capital) and other Aegon affiliates. Aegon Asset Management US, Aegon Real Assets US, and Kames Capital are SEC registered investment advisers. For institutional use only.
Transcript of On Demographics, Growth and Investing Society Oklahoma...• 25% maximum tax rate on qualified ......

On Demographics, Growth and Investing When the structural collides with the cyclical
CFA Society Oklahoma
D. Harris Kere, CFAInvestment StrategistAegon Asset Management US
March 13, 2018
Aegon Asset Management is the global investment management brand of the Aegon Group N.V. and is comprised of Aegon USA Investment Management, LLC (Aegon Asset Management US), Aegon USA Realty Advisors, LLC (Aegon Real Assets US), Kames Capital plc (Kames Capital) and other Aegon affiliates. Aegon Asset Management US, Aegon Real Assets US, and Kames Capital are SEC registered investment advisers. For institutional use only.

2For institutional use only
On demographics, growth and investing
• Cyclical outlook – The see-saw years
• Trend growth – The goal posts have moved
• Productivity outlook
• Demographics
• Inflation
• Investment implications

3For institutional use only
Sizing up the expansion
Early 50s
Mid 50s
Late 50s
1960s
Early 70s
Mid-late 70s
Early 80s
Mid-late 80s
1990s
2000s
Current Cycle
R² = 0.7622
-
5
10
15
20
25
30
35
40
45
0.0 0.5 1.0 1.5 2.0 2.5
Len
gth
of
Cyc
le (
qtr
s)
Average Expansion Excess Speed vs. Potential % (Real GDP Growth, QoQ Saar)
Expansion pace relative to potential tends to drive cycle length
Source: Bureau of Economic Analysis, Congressional Budget Office,, National Bureau of Economic Research, Aegon AM US. As of Dec 2017.

4For institutional use only
Forecasts
Forecast
2015 2016 2017 2018 2019 2020 2021
GDP (Real %, YoY) 2.60 1.60 2.30 2.80 2.30 1.80 1.00
Unemployment (%) 5.30 4.90 4.40 3.90 3.70 4.10 4.80
Core PCE 1.30 1.70 1.50 1.90 2.00 1.80 1.70
Fed Funds (%) 0.50 0.75 1.50 2.00 2.50 1.75 1.25
10-year Treasury (%) 2.27 2.45 2.41 3.10 3.20 2.50 2.05
Source: Bureau of Economic Analysis, Congressional Budget Office, Haver Analytics, Aegon AM US. As of Feb 2018.

5For institutional use only
Forecasts
Source: Bloomberg, Aegon AM US. As of Feb 2018.
2.2
2.3
2.4
2.5
2.6
2.7
2.8
Jan-17 Feb-17 Mar-17 Apr-17 May-17 Jun-17 Jul-17 Aug-17 Sep-17 Oct-17 Nov-17 Dec-17 Jan-18 As ofFeb-18
Rea
l GD
P G
row
th, %
2018 GDP Forecasts
Bloomberg 2018 GDP Consensus AAM US Macro Strategy '18 GDP
Forecasts
Feb-15

6For institutional use only
Tax Cuts and Jobs Act highlights
Source: US Congress
Corporate
• Reduces the corporate tax rate to 21% (25% for personal services) from 35%
• Allows 100% expensing of certain business property through 2022
• Limits/reduces business interest deduction
• Limits Net Operating Loss deduction to 80% of taxable income
Individual
• Seven Brackets: 10%, 12%, 22%, 24%, 32%, 35%, 37%
• Standard Deduction increased to $24k for married joint filers, $12k for singles
• 25% maximum tax rate on qualified business income of individuals
• Increases the Child Tax Credit
• Deductions for State & Local Taxes limited to $10k
• Doubles Estate and Gift Tax exemption from $5MM to $10MM
• Repeal of Individual and Corporate Alternative Minimum Tax

7For institutional use only
The goal post has shifted
(5)
(4)
(3)
(2)
(1)
-
1
2
3
4
5
6
7
8
9
19
51
19
53
19
55
19
57
19
59
19
61
19
63
19
65
19
67
19
69
19
71
19
73
19
75
19
77
19
79
19
81
19
83
19
85
19
87
19
89
19
91
19
93
19
95
19
97
19
99
20
01
20
03
20
05
20
07
20
09
20
11
20
13
20
15
20
17
20
19
20
21
20
23
20
25
20
27
GD
P %
Diff GDP: Potential GDP: Actual
Source: BEA, CBO, HAVER, Aegon AM US. As of Jan 2018.
'Slow Growth in Absolute Terms, But Still Decent Relative to Potential'US Growth - Actual vs. Potential
Forecasts

8For institutional use only
Pressuring trend growth lower
0.0
0.5
1.0
1.5
2.0
2.5
3.0
3.5
4.0
4.5
5.0
5.5
6.0
19
51
19
53
19
55
19
57
19
59
19
61
19
63
19
65
19
67
19
69
19
71
19
73
19
75
19
77
19
79
19
81
19
83
19
85
19
87
19
89
19
91
19
93
19
95
19
97
19
99
20
01
20
03
20
05
20
07
20
09
20
11
20
13
20
15
20
17
20
19
20
21
20
23
20
25
20
27
Demographics suggest that 3% trend growth is highly unlikely
CBO Potential Real GDP (0.5% Labor Force Growth) 0.7% LF Growth 1% LF Growth 1.4% LF Growth (1950-2016 avg)
Source: Congressional Budget Office, Haver Analytics, Aegon AM US. As of June 30, 2017.
Forecasts
0.7% Labor
Force Growth
1.0% Labor
Force Growth
1.4% Labor Force Growth
(1950-2016 avg.)

9For institutional use only
Especially as productivity growth may hit a ceiling
1.0
1.5
2.0
2.5
3.0
3.5
4.0
19
77
19
79
19
81
19
83
19
85
19
87
19
89
19
91
19
93
19
95
19
97
19
99
20
01
20
03
20
05
20
07
20
09
20
11
20
13
20
15
20
17
20
19
20
21
20
23
20
25
Can Trumponomics boost long-term productivity?If so, real trend growth can accelerate, but upside is limited
Scenario 1 - GDPp (1.7% Trend Productivity)
Scenario 2 - GDPp (2.0% Trend Productivity)
CBO's Official Potential Real GDP Growth (Implies 1.4% Trend Productivity)
Source: Haver Analytics, Congressional Budget Office, Aegon AM US. As of Nov 2016.
Forecasts
10For institutional use only
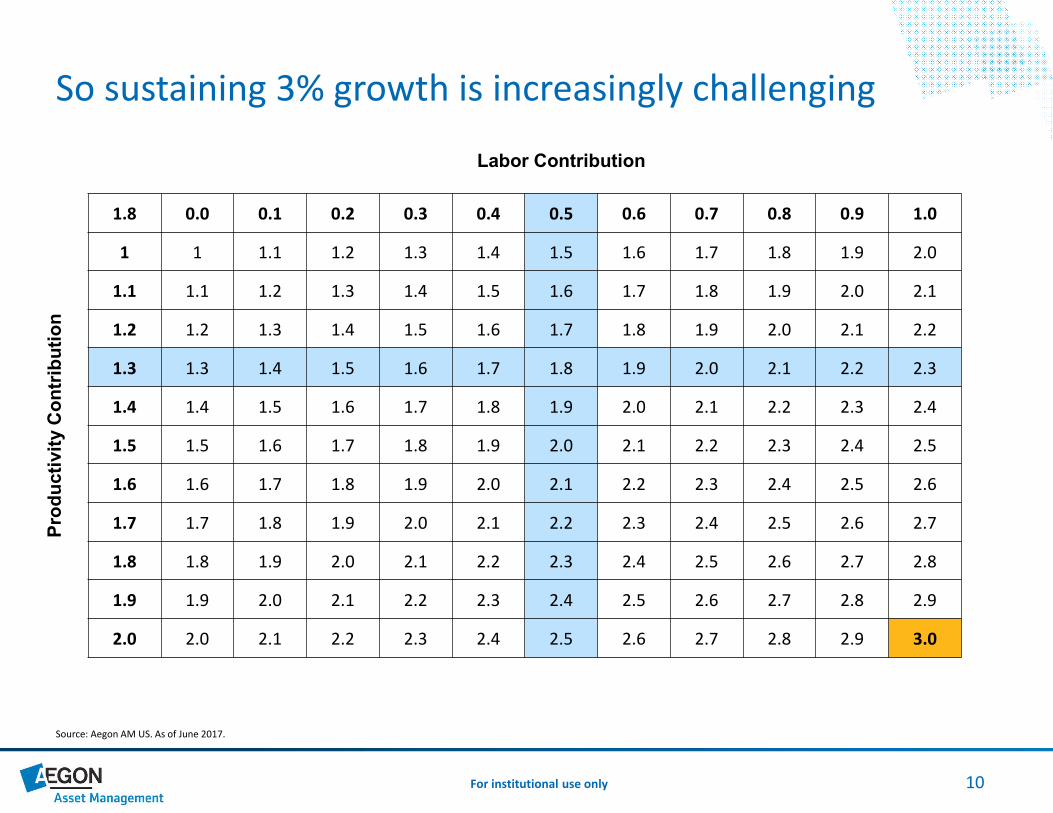
So sustaining 3% growth is increasingly challenging
Labor Contribution
1.8 0.0 0.1 0.2 0.3 0.4 0.5 0.6 0.7 0.8 0.9 1.0
Pro
du
cti
vit
y C
on
trib
uti
on
1 1 1.1 1.2 1.3 1.4 1.5 1.6 1.7 1.8 1.9 2.0
1.1 1.1 1.2 1.3 1.4 1.5 1.6 1.7 1.8 1.9 2.0 2.1
1.2 1.2 1.3 1.4 1.5 1.6 1.7 1.8 1.9 2.0 2.1 2.2
1.3 1.3 1.4 1.5 1.6 1.7 1.8 1.9 2.0 2.1 2.2 2.3
1.4 1.4 1.5 1.6 1.7 1.8 1.9 2.0 2.1 2.2 2.3 2.4
1.5 1.5 1.6 1.7 1.8 1.9 2.0 2.1 2.2 2.3 2.4 2.5
1.6 1.6 1.7 1.8 1.9 2.0 2.1 2.2 2.3 2.4 2.5 2.6
1.7 1.7 1.8 1.9 2.0 2.1 2.2 2.3 2.4 2.5 2.6 2.7
1.8 1.8 1.9 2.0 2.1 2.2 2.3 2.4 2.5 2.6 2.7 2.8
1.9 1.9 2.0 2.1 2.2 2.3 2.4 2.5 2.6 2.7 2.8 2.9
2.0 2.0 2.1 2.2 2.3 2.4 2.5 2.6 2.7 2.8 2.9 3.0
Source: Aegon AM US. As of June 2017.

11For institutional use only
Potential sources for productivity upside
Physical
• Autonomous vehicles
• Advanced robotics
• New materials
• 3D printing
Digital
• The Internet of Things (IoT)
Biological
• Genomics – Positive for labor force and productivity
Source: Klaus Schwab, The Fourth Industrial Revolution, 2016
The 4th Industrial Revolution – Key megatrends

12For institutional use only
Defining the generations
Source: Haver Analytics; Upside by Gronbach & Moye
Birth Years Births (mm) Age Today Midpoint
GI Generation 1905 - 1924 56.6 112 - 93 103
Silent Generation 1925 - 1944 52.5 92 - 73 83
Baby Boomers 1945 - 1964 78.2 72 - 53 63
Gen X 1965 - 1984 69.5 52 - 33 43
Gen Y (Millennials) 1985 - 2004 79.5 32 - 13 23
Gen Z 2005-- 40.9* 12-- 6
*as of 2014

13For institutional use only
The demographic tailwind...
Source: Bureau of Labor Statistics, Congressional Budget Office, Aegon AM US. As of June 2017.
0.0%
0.5%
1.0%
1.5%
2.0%
2.5%
3.0%
3.5%
4.0%
Total Labor Force Growth Total Male LF Total Female Labor Force
Average annual labor force growth
1960s 1970s 1980s 1990s 2000s Since 2010 2017-2027 (CBO)
Total Male Labor Force

14For institutional use only
...is now a demographic headwind
0.0%
0.5%
1.0%
1.5%
2.0%
2.5%
3.0%
3.5%
4.0%
4.5%
5.0%
1960s 1970s 1980s 1990s 2000s Since 2010 2017-2027(CBO)
Average annual labor force and potential real GDP growth
Total Labor Force Growth Potential Real GDP Growth
Sources: Bureau of Labor Statistics, Congressional Budget Office, Aegon AM US. As of June 2017.
15For institutional use only
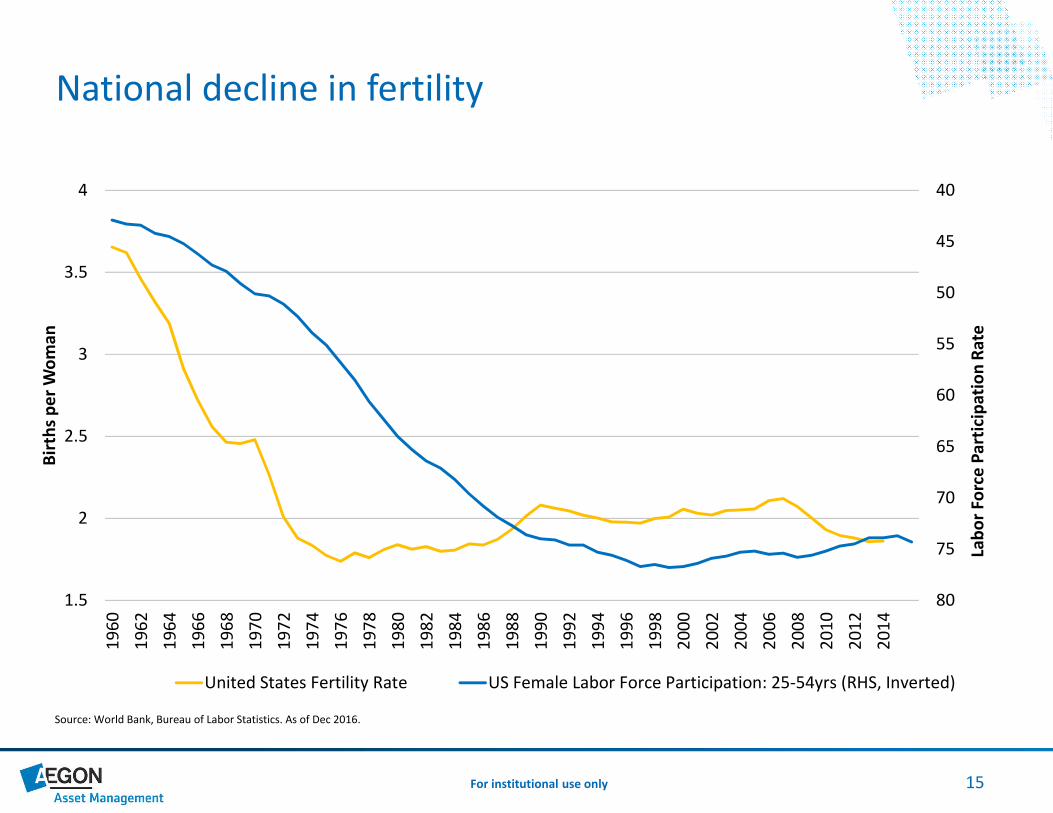
National decline in fertility
40
45
50
55
60
65
70
75
801.5
2
2.5
3
3.5
4
19
60
19
62
19
64
19
66
19
68
19
70
19
72
19
74
19
76
19
78
19
80
19
82
19
84
19
86
19
88
19
90
19
92
19
94
19
96
19
98
20
00
20
02
20
04
20
06
20
08
20
10
20
12
20
14
Lab
or
Forc
e P
arti
cip
atio
n R
ate
Bir
ths
pe
r W
om
an
United States Fertility Rate US Female Labor Force Participation: 25-54yrs (RHS, Inverted)
Source: World Bank, Bureau of Labor Statistics. As of Dec 2016.

16For institutional use only
The ‘Booming’ impact...
5.0%
7.0%
9.0%
11.0%
13.0%
15.0%
17.0%
19.0%
21.0%
23.0%
0
10,000
20,000
30,000
40,000
50,000
60,000
70,000
80,000
19
01
19
05
19
09
19
13
19
17
19
21
19
25
19
29
19
33
19
37
19
41
19
45
19
49
19
53
19
57
19
61
19
65
19
69
19
73
19
77
19
81
19
85
19
89
19
93
19
97
20
01
20
05
20
09
20
13
55-74 55-74
Total Population % Total Population (RHS)Source: Haver Analytics. As of Dec 2016.

17For institutional use only
...combined with a shrinking prime age workforce...
30.0%
32.0%
34.0%
36.0%
38.0%
40.0%
42.0%
44.0%
46.0%
0
20,000
40,000
60,000
80,000
100,000
120,000
140,000
19
01
19
05
19
09
19
13
19
17
19
21
19
25
19
29
19
33
19
37
19
41
19
45
19
49
19
53
19
57
19
61
19
65
19
69
19
73
19
77
19
81
19
85
19
89
19
93
19
97
20
01
20
05
20
09
20
13
25-54 25-54
Total Population % Total Population (RHS)Source: Haver Analytics. As of Dec 2016.

18For institutional use only
...stresses the old age dependency ratios
3.0x
3.5x
4.0x
4.5x
5.0x
5.5x
6.0x
6.5x
7.0x
7.5x
8.0x
19
48
19
51
19
54
19
57
19
60
19
63
19
66
19
69
19
72
19
75
19
78
19
81
19
84
19
87
19
90
19
93
19
96
19
99
20
02
20
05
20
08
20
11
20
14
Dependency ratios (20-64 / 65-plus)
Dependency Ratio Dependency Ratio (LFPR Adj.)
Source: Haver Analytics. As of Dec 2016.
Dependency ratios (20-64/ 65-plus)
(Labor Force Participation Rates Adj.)
19For institutional use only
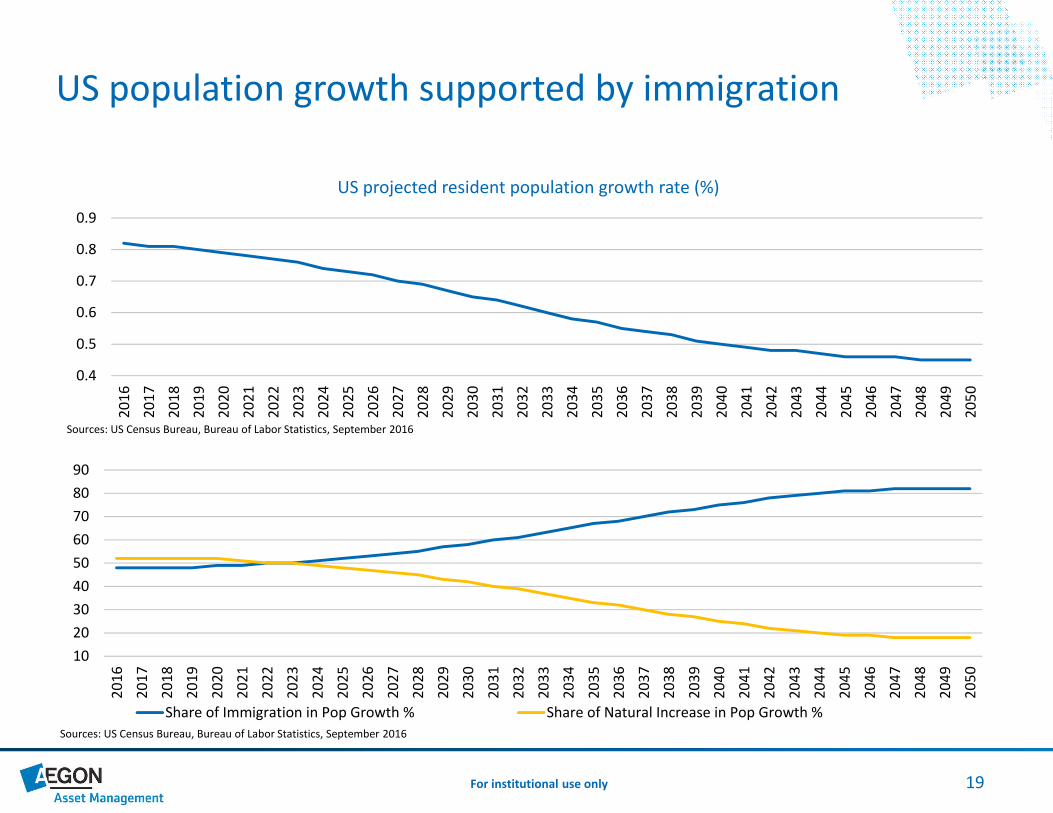
US population growth supported by immigration
0.4
0.5
0.6
0.7
0.8
0.9
20
16
20
17
20
18
20
19
20
20
20
21
20
22
20
23
20
24
20
25
20
26
20
27
20
28
20
29
20
30
20
31
20
32
20
33
20
34
20
35
20
36
20
37
20
38
20
39
20
40
20
41
20
42
20
43
20
44
20
45
20
46
20
47
20
48
20
49
20
50
US projected resident population growth rate (%)
Sources: US Census Bureau, Bureau of Labor Statistics, September 2016
10
20
30
40
50
60
70
80
90
20
16
20
17
20
18
20
19
20
20
20
21
20
22
20
23
20
24
20
25
20
26
20
27
20
28
20
29
20
30
20
31
20
32
20
33
20
34
20
35
20
36
20
37
20
38
20
39
20
40
20
41
20
42
20
43
20
44
20
45
20
46
20
47
20
48
20
49
20
50
Share of Immigration in Pop Growth % Share of Natural Increase in Pop Growth %
Sources: US Census Bureau, Bureau of Labor Statistics, September 2016
20For institutional use only
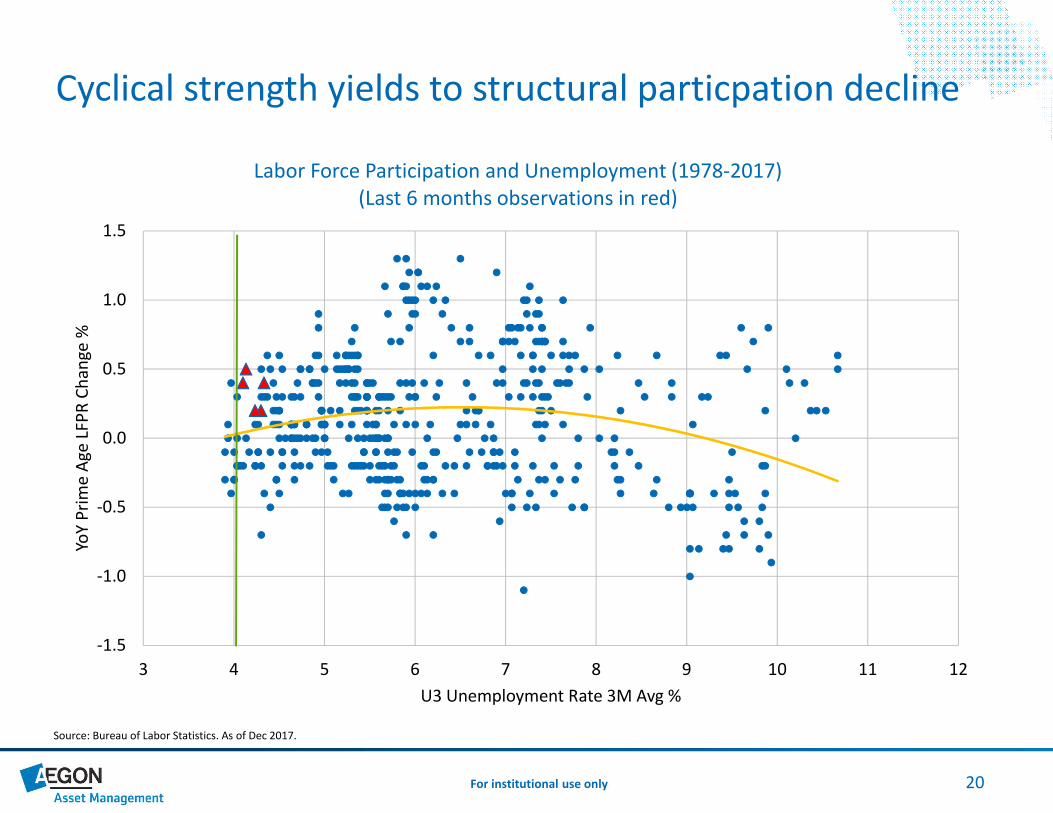
Cyclical strength yields to structural particpation decline
Source: Bureau of Labor Statistics. As of Dec 2017.
-1.5
-1.0
-0.5
0.0
0.5
1.0
1.5
3 4 5 6 7 8 9 10 11 12
YoY
Pri
me
Age
LFP
R C
han
ge %
U3 Unemployment Rate 3M Avg %
Labor Force Participation and Unemployment (1978-2017) (Last 6 months observations in red)

21For institutional use only
A global decline in fertility
1
2
3
4
5
6
19
60
19
62
19
64
19
66
19
68
19
70
19
72
19
74
19
76
19
78
19
80
19
82
19
84
19
86
19
88
19
90
19
92
19
94
19
96
19
98
20
00
20
02
20
04
20
06
20
08
20
10
20
12
20
14
20
16
Fertility rates (%)
World High income Low & middle income
Source: World Bank World Development Indicators. As of August 2017
22For institutional use only
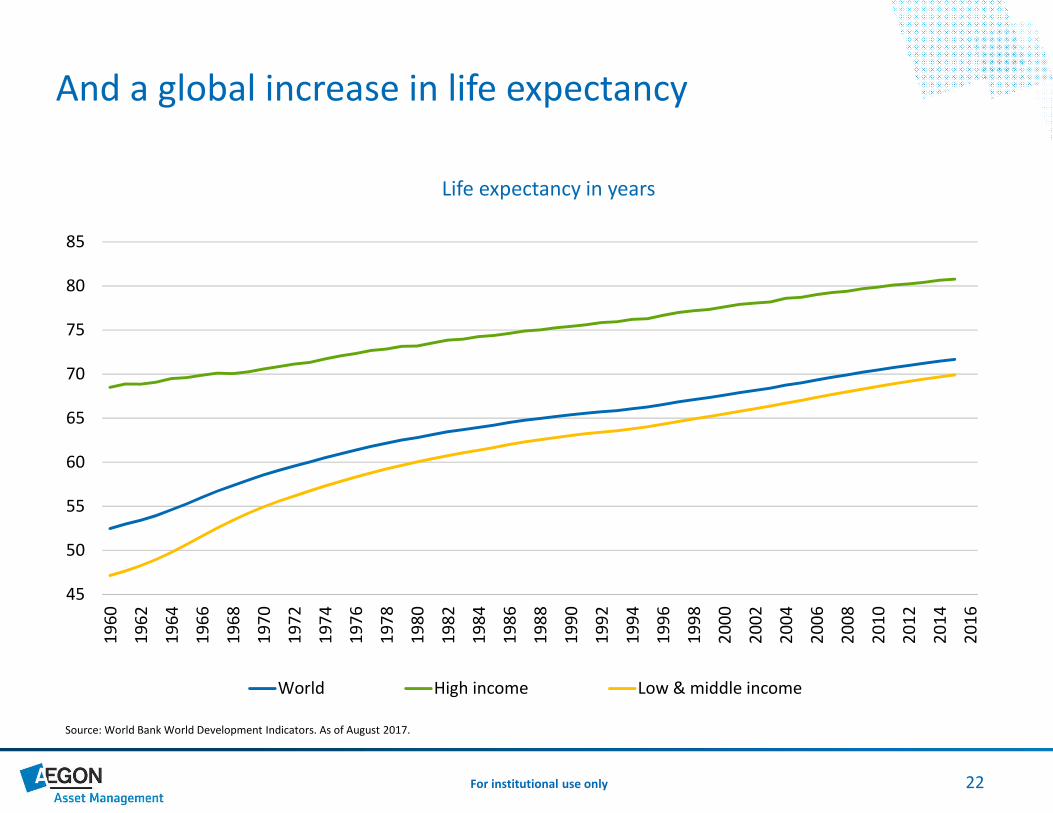
And a global increase in life expectancy
45
50
55
60
65
70
75
80
85
19
60
19
62
19
64
19
66
19
68
19
70
19
72
19
74
19
76
19
78
19
80
19
82
19
84
19
86
19
88
19
90
19
92
19
94
19
96
19
98
20
00
20
02
20
04
20
06
20
08
20
10
20
12
20
14
20
16
Life expectancy in years
World High income Low & middle income
Source: World Bank World Development Indicators. As of August 2017.

23For institutional use only
Lead to slower population growth rates
-0.25
0.25
0.75
1.25
1.75
2.25
2.75
1955 1960 1965 1970 1975 1980 1985 1990 1995 2000 2005 2010 2015 2020 2025 2030 2035 2040 2045 2050
Population growth rates (%)
WORLD Advanced Economies Emerging Economies ex Least Dev
Source: UN World Population Prospects, Medium-Variant Estimates. As of June 2017.
Emerging Economies ex- Least Developed
Forecasts

24For institutional use only
And a global silver economy
0
5
10
15
20
25
30
35
40
45
2015 2020 2025 2030 2035
Nu
mb
er o
f co
un
trie
s
Aging in the world a headwind to GDP growth
Number of countries with more 65+ adults than kids under 15 % of World GDP Represented (2015 Current $ Data)
Source: UN Population Division Medium-Variant Pop Estimates, World Bank. As of Dec 2015.

25For institutional use only
And a shrinking global labor force
-0.5%
0.0%
0.5%
1.0%
1.5%
2.0%
2.5%
3.0%
1980-2015 2015-2050
Working age population (CAGR)
Sub-Saharan Africa G7 World
Source: World Bank, Aegon AM US. As of Dec 2016.
0.0%
2.5%
5.0%
7.5%
10.0%
12.5%
15.0%
17.5%
20.0%
22.5%
25.0%
27.5%
30.0%
32.5%
2015 2050
Regional as % of world working age population
Sub-Saharan Africa G-7
Source: World Bank, Aegon AM US. As of Dec 2016.

26For institutional use only
Go where the growth is...NOT
Median GDP-Weighted Ease of Doing Business Average
Africa 114 124.3 119
Ease of Doing Business Rank South Africa 73 21.9
Ease of Doing Business Rank Senegal 153 2.0
Ease of Doing Business Rank Nigeria 169 78.1
Ease of Doing Business Rank Ghana 114 4.1
Ease of Doing Business Rank Ivory Coast 142 4.3
Ease of Doing Business Rank Kenya 108 6.6
Ease of Doing Business Rank Morocco 75 7.2
Median GDP-Weighted Ease of Doing Business Average
G7 15 14.7 21
Ease of Doing Business Rank United States 7 3.7
Ease of Doing Business Rank Germany 15 1.5
Ease of Doing Business Rank Canada 14 0.6
Ease of Doing Business Rank Japan 34 4.1
Ease of Doing Business Rank France 27 1.9
Ease of Doing Business Rank Italy 45 2.4
Ease of Doing Business Rank United Kingdom 6 0.5
Source: World Bank, Bloomberg. As of Dec 2016.

27For institutional use only
A Sustained GDP Growth Edge to Emerging Economies
-2
-1
0
1
2
3
4
5
6
7
-4
-2
0
2
4
6
8
10
12
19
80
19
81
19
82
19
83
19
84
19
85
19
86
19
87
19
88
19
89
19
90
19
91
19
92
19
93
19
94
19
95
19
96
19
97
19
98
19
99
20
00
20
01
20
02
20
03
20
04
20
05
20
06
20
07
20
08
20
09
20
10
20
11
20
12
20
13
20
14
20
15
20
16
20
17
20
18
20
19
20
20
20
21
20
22
Rea
l GD
P G
row
th %
Rea
l GD
P G
row
th %
Emerging market and developing economies
Major advanced economies (G7)
Growth Gap - Emergning minus Major Advanced (rhs)
Source: IMF World Economic Outlook, October 2017
Forecasts

28For institutional use only
Prompting a global yield hunt
Japan
US Securitized
IG Industrials
Global HY
EM USD
Euro Corp
IG Financials
US HY
SpainItaly
UK
Non US Sec
Germany
Euro Agg IndustrialsEuro Sec
Spain
Euro Financials
Euro Banking
Pan-Euro HY
Australia
Canada
USTsy
Ireland.
Australian corp
-2
-1
0
1
2
3
4
5
6
7
YTW
Global hunt for yield
B3AAA
Source: Barclays Live, Aegon AM US. As of Sept. 2017.
Market Cap is represented by the size of each Bubble & Yield by the midpoint.

29For institutional use only
Advanced economies growing older
40
50
60
70
80
90
100
1950 1955 1960 1965 1970 1975 1980 1985 1990 1995 2000 2005 2010 2015 2020 2025 2030 2035 2040 2045 2050
Dependency ratios (Ages 0-14 and 65+, %)
United States of America Japan United Kingdom Germany
Source: UN World Population Prospects. As of June 2017
Forecasts

30For institutional use only
More time spent in retirement
United States 12/31/1970 12/31/1990 12/31/2010
Average Retirement Age 68 65 66
Life Expectancy 71 75 79
2.4 10.5 13.0
China
Average Retirement Age 67 67 67
Life Expectancy 59 69 75
-8.0 2.1 8.0
Japan
Average Retirement Age 73 71 70
Life Expectancy 72 79 83
-0.8 8.2 12.8
Germany
Average Retirement Age 60 60 62
Life Expectancy 71 75 80
10.3 14.9 18.0
Source: Organization for Economic Co-operation and Development, World Bank, Bloomberg, Aegon AM US. As of Dec 2016.
31For institutional use only
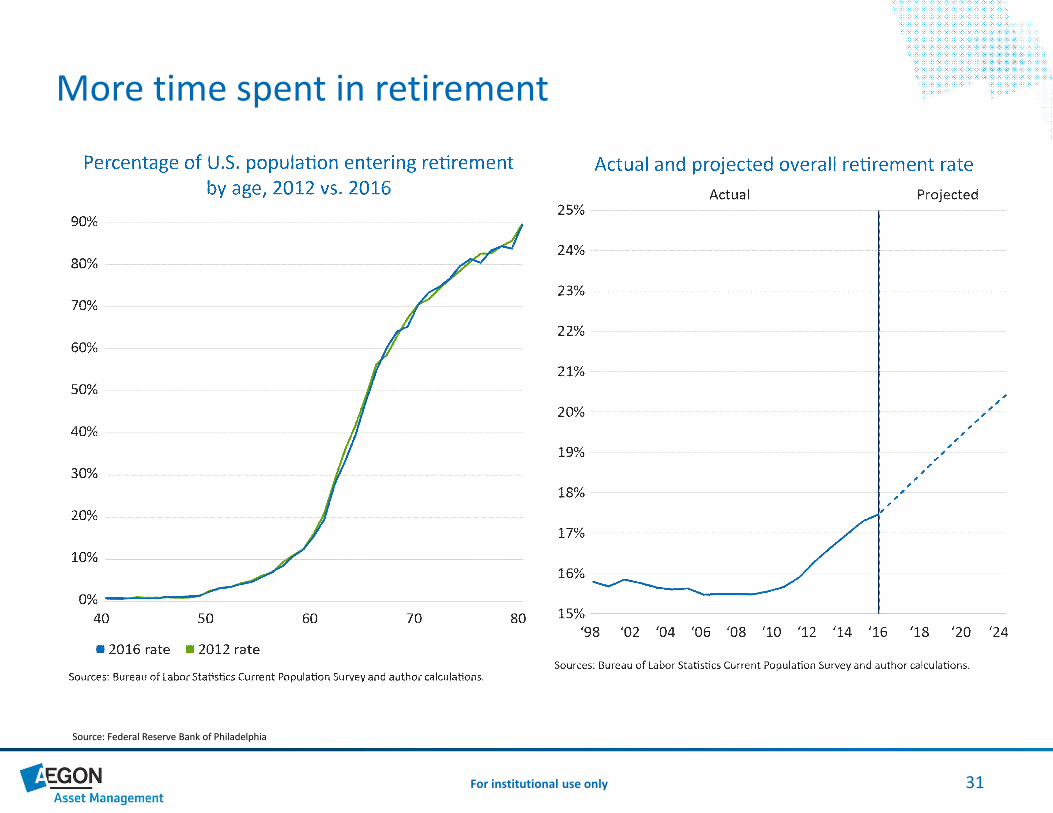
More time spent in retirement
Source: Federal Reserve Bank of Philadelphia

32For institutional use only
More time spent in unfunded retirement
-12%
-9%
-6%
-3%
0%
3%
6%
9%
12%
15%
18%
-5%
-4%
-3%
-2%
-1%
0%
1%
2%
3%
4%
5%
6%
7%
8%
9%
2001 2002 2003 2004 2005 2006 2007 2008 2009 2010 2011 2012 2013 2014 2015
Average returns – public pension plans
Avg Assumed Return Avg ann return since 2001 Avg 1-yr investment return (RHS)
Source: publicplansdata.org. As of Dec 2016.
Average annual return since 2001

33For institutional use only
More time spent in unfunded retirement
0
0.1
0.2
0.3
0.4
0.5
0.6
0.7
0.8
0.9
1
1.1
2001 2002 2003 2004 2005 2006 2007 2008 2009 2010 2011 2012 2013 2014 2015 2016
Public pension plans funded ratio
Source: publicplansdata.org. As of Dec 2016.

34For institutional use only
More time spent in unfunded retirement
-100
0
100
200
300
400
500
600
700
800
900
1,000
1,100
1,200
50%
55%
60%
65%
70%
75%
80%
85%
90%
95%
100%
2001 2002 2003 2004 2005 2006 2007 2008 2009 2010 2011 2012 2013 2014 2015 2016
Total Public Pension Shortfall (RHS, $Billion) Percent of Unfunded State & Local Public Pension Plans
Source: publicplansdata.org. As of Dec 2016.

35For institutional use only
With budgetary pressures
3
4
5
6
7
8
9
15%
20%
25%
30%
35%
40%
45%
Retired (65+) to Working (20-64) Ratio Social Security and Medicare Spending as % of GDP (RHS)
Sources: Census Bureau, Congressional Budget Office. As of June 2017.
Forecasts

36For institutional use only
And selling a structural call on inflation
Brazil
China
France
Germany
India
Indonesia
Italy
Japan
NL
S. Africa
Turkey
US
R² = 0.408
-6
-4
-2
0
2
4
6
8
10
0 1 2 3 4 5 6 7 8 9 10
5yr
ch
ange
in D
epen
den
cy R
atio
(%
)
5 year average Annual CPI (%)
Source: IMF, World Bank, Aegon AM US. As of Dec 2016.

37For institutional use only
And as term premia are pressured lower by increasingly anchored inflation uncertainty
R² = 0.4055
-1
0
1
2
3
4
5
6
0.00 0.25 0.50 0.75 1.00 1.25 1.50 1.75 2.00 2.25 2.50
AC
M 1
0Yr
Ter
m P
rem
ium
CPI 4Qtrs ahead Forecast Dispersion (75th – 25th Percentile)
Adrian, Crump, Moench 10 year term premium vs. inflation uncertainty
Sources: Philly Fed SPF, New York Fed ACM, Aegon AM US, Bloomberg. As of June 2017.
0.00
0.50
1.00
1.50
2.00
2.50
19
81
Q3
19
83
Q2
19
85
Q1
19
86
Q4
19
88
Q3
19
90
Q2
19
92
Q1
19
93
Q4
19
95
Q3
19
97
Q2
19
99
Q1
20
00
Q4
20
02
Q3
20
04
Q2
20
06
Q1
20
07
Q4
20
09
Q3
20
11
Q2
20
13
Q1
20
14
Q4
20
16
Q3
Inflation uncertainty: CPI four quarters ahead
Sources: Philly Fed SPF. As of June 2017.

38For institutional use only
So are long Treasury yields
-2
0
2
4
6
8
10
12
14
16
-2
0
2
4
6
8
10
12
14
16
1982 1984 1986 1988 1990 1992 1994 1996 1998 2000 2002 2004 2006 2008 2010 2012 2014 2016
The 10-year US Treasury interest rate and its components
10-Year Treasury Yield Expected InflationNY Fed ACM Term Premium 10-Year Risk-Free Treasury Rate
Source: Federal Reserve Board, Haver Analytics. As of Jan 2018.

39For institutional use only
Treasuries should remain a viable portfolio hedge
-5%
-4%
-3%
-2%
-1%
0%
1%
2%
3%
4%
5%
6%
7%
8%
9%
10%
-100%-90%-80%-70%-60%-50%-40%-30%-20%-10%
0%10%20%30%40%50%60%70%80%90%
100%
Mar
-78
Mar
-79
Mar
-80
Mar
-81
Mar
-82
Mar
-83
Mar
-84
Mar
-85
Mar
-86
Mar
-87
Mar
-88
Mar
-89
Mar
-90
Mar
-91
Mar
-92
Mar
-93
Mar
-94
Mar
-95
Mar
-96
Mar
-97
Mar
-98
Mar
-99
Mar
-00
Mar
-01
Mar
-02
Mar
-03
Mar
-04
Mar
-05
Mar
-06
Mar
-07
Mar
-08
Mar
-09
Mar
-10
Mar
-11
Mar
-12
Mar
-13
Mar
-14
Mar
-15
Mar
-16
Mar
-17
Stock and Treasury bond return correlations and inflation
12mo Correlation 5Yr correlation 5Yr avg inflation, CPI YoY (RHS)
Source: Aegon AM US, Bloomberg. As of June 2017.
Sto
ck (
SPX
)
Trea
suri
es (
Bar
clay
s U
S Tr
easu
ry In
dex
)

40For institutional use only
As the relationship is yield and inflation-level dependant
0
1
2
3
4
5
6
7
8
9
10
11
12
13
14
15
16
-100% -80% -60% -40% -20% 0% 20% 40% 60% 80% 100%
10
Year
Tre
asu
ry Y
ield
%
Correlation
Rolling 26-week correlation (Weekly change in SPX and 10-yr yield) vs. 10-yr Level
Sources: Aegon AM US, Bloomberg. As of June 2017.

41For institutional use only
On demographics, growth and investing
• Cyclical outlook – The see-saw years
• Trend growth – The goal posts have moved
• Productivity outlook
• Demographics
• Inflation
• Investment implications
• EM v. DM
• Equities with Treasury hedge

42For institutional use only
Additional readings
Reports can be found on the AEGON Asset Management US website:
• 2018 Macro & Rates Outlook
• Structural Drivers of Low Rates
• Where Will the Flow Go? Why we favor EM. vs. DM
• Will Treasuries Remain a Viable Portfolio Hedge?
• Demographic Destiny
• Demographic Effects on Unemployment Rate (Q2 2017 Macro Outlook)

43For institutional use only
“Demographics Is Destiny”— Auguste Comte
“If we don’t change direction soon we will end up where
we are going”— Irwin Corey

44
D. Harris Kere, CFA, is an investment strategist whose
responsibilities include macro research and analytical
support for the firm’s global macro strategy efforts.
Prior to joining the firm in 2015, Harris worked for
Bank of America Merrill Lynch as an investment
manager research analyst. His responsibilities included
macro research as it relates to asset class behavior and
investment strategies in fixed income, equity and liquid
alternatives. Harris began his financial career at Bank
of America Merrill Lynch in private wealth
management. He has eight years of industry
experience. Harris received a BS in international
business and economics with a minor in applied
statistics from the Indiana University of Pennsylvania.
He is a CFA® charterholder.
Many thanks!

45For institutional use only
This material is to be used for institutional investors and not for any other purpose. The information presented is for illustrative purposes only. The enclosed information has been developed internally and/or obtained from sources believed to be reliable. This material contains current opinions of the manager and such opinions are subject to change without notice. Aegon AM US is under no obligation, expressed or implied, to update the material contained herein. This material contains general information only on investment matters; it should not be considered a comprehensive statement on any matter and should not be relied upon as such. If there is any conflict between the enclosed information and AUIM's Form ADV, the Form ADV controls. The information contained does not take into account any investor's investment objectives, particular needs, or financial situation. Nothing in this material constitutes investment, legal, accounting or tax advice, or a representation that any investment or strategy is suitable or appropriate to you. The value of any investment may fluctuate.
This document contains “forward-looking statements” which are based on change to the firm’s beliefs, as well as on a number of assumptions concerning future events based on information currently available. These statements involve certain risks, uncertainties and assumptions which are difficult to predict. Consequently, such statements cannot be guarantees and actual outcomes may differ materially from statements set forth herein. In addition. This material contains information regarding market outlook, rates of return, market indicators and other statistical information that is not intended and should not be considered an indication of actual results.
Results for certain charts and graphs are included for illustrative purposes only and should not be relied upon to assist or inform the making of any investment decisions.
Aegon USA Investment Management, LLC (“AUIM”), a wholly owned indirect subsidiary of Aegon N.V., is a U.S.-based investment adviser registered with the Securities and Exchange Commission (“SEC”) and part of Aegon Asset Management, the global investment management division of Aegon Group. AUIM is a limited liability company formed on June 1, 2001 and began managing assets on December 1, 2001. The firm definition was revised February 1, 2016 to better reflect AUIM's relationship in the broader Aegon Asset Management organization. The firm maintains a complete list and description of composites, which is available upon request.
AUIM is also registered as a Commodity Trading Advisor (CTA) with the Commodity Futures Trading Commission (CFTC) and is a member of the National Futures Association (NFA).
Aegon USA Investment Management, LLC claims compliance with the Global Investment Performance Standards (GIPS®). Please contact AUIM at [email protected] or 877-234-6862 to obtain a compliant presentation and/or a list of composite descriptions.
Recipient shall not distribute, publish, sell, license or otherwise create derivative works using any of the content of this report without the prior written consent of Aegon USA Investment Management, LLC, 4333 Edgewood Rd NE, Cedar Rapids, IA 52499.
Copyright © 2018 Aegon USA Investment Management, LLC
Disclosures
AdTrax: 1997510.5Exp Date: 3/31/2018


![Capablanca - Lasker Match 1921 [Capablanca, 1921]](https://static.fdocuments.us/doc/165x107/577cda471a28ab9e78a54085/capablanca-lasker-match-1921-capablanca-1921.jpg)