On Combining Morphological Component Analysis and Concentric Morphology Model for
8
266 IEEE TRANSACTIONS ON INFORMATION TECHNOLOGY IN BIOMEDICINE, VOL. 14, NO. 2, MARCH 2010 On Combining Morphological Component Analysis and Concentric Morphology Model for Mammographic Mass Detection Xinbo Gao, Senior Member, IEEE, Ying Wang, Xuelong Li, Senior Member, IEEE, and Dacheng Tao, Member, IEEE Abstract—Mammographic mass detection is an important task for the early diagnosis of breast cancer. However, it is difficult to distinguish masses from normal regions because of their abundant morphological characteristics and ambiguous margins. To improve the mass detection performance, it is essential to effectively prepro- cess mammogram to preserve both the intensity distribution and morphological characteristics of regions. In this paper, morpholog- ical component analysis is first introduced to decompose a mammo- gram into a piecewise-smooth component and a texture component. The former is utilized in our detection scheme as it effectively sup- presses both structural noises and effects of blood vessels. Then, we propose two novel concentric layer criteria to detect different types of suspicious regions in a mammogram. The combination is evaluated based on the Digital Database for Screening Mammog- raphy, where 100 malignant cases and 50 benign cases are utilized. The sensitivity of the proposed scheme is 99% in malignant, 88% in benign, and 95.3% in all types of cases. The results show that the proposed detection scheme achieves satisfactory detection perfor- mance and preferable compromises between sensitivity and false positive rates. Index Terms—Breast cancer, computer-aided detection, mass detection, morphological component analysis (MCA), morphology concentric layer. I. INTRODUCTION B REAST cancer is one of the most frequent leading causes of cancer deaths in women. The American Cancer Society (ACS) estimates that about 184,450 new breast cancer cases are expected to be diagnosed in 2008 [1]. Therefore, the early detec- tion is a main factor to reduce deaths of the disease. Mammog- raphy, which reveals the pronounced evidence of abnormality in breast, is currently the most effective tool for early detection of Manuscript received November 20, 2008; revised June 27, 2009. First pub- lished November 10, 2009; current version published March 17, 2010. This work was supported by the National Science Foundation of China under Grant 60771068, Grant 60702061, and Grant 60832005, by the Open-End Fund of the National Laboratory of Pattern Recognition in China and the National Lab- oratory of Automatic Target Recognition, Shenzhen University, China, by the Program for Changjiang Scholars and Innovative Research Team in the Uni- versity of China under Grant IRT0645, and by the 100 Talents Program of The Chinese Academy of Sciences, by the Nanyang Technological University Nanyang SUG Grant, under Grant M58020010, and by the K. C. Wong Educa- tion Foundation Award. X. Gao and Y. Wang are with the School of Electronic Engineering, Xidian University, Xi’an 710071, China (e-mail: [email protected]; [email protected]). X. Li is with the State Key Laboratory of Transient Optics and Photonics, Xi’an Institute of Optics and Precision Mechanics, Chinese Academy of Sci- ences, Xi’an 710119, China (e-mail: xuelong_li@opt. ac.cn). D. Tao is with the School of Computer Engineering, Nanyang Technological University, Singapore 639798, Singapore (e-mail: [email protected]). Color versions of one or more of the figures in this paper are available online at http://ieeexplore.ieee.org. Digital Object Identifier 10.1109/TITB.2009.2036167 breast cancer. However, it is difficult to interpret a mammogra- phy as its sensitivity is seriously affected by image quality and radiologist’s experiences. Independent double reading by two radiologists is introduced in screening routine to improve the accuracy of diagnosis. Though it could improve the sensitivity of diagnosis, the high cost is unacceptable in practical appli- cations. Therefore, Computer-aided detection (CAD) schemes have been developed and acknowledged to assist radiologists in improving the accuracy of diagnosis. Masses and calcifica- tions are two primary signatures of abnormity in mammograms. Existing research results show masses are more difficult to rec- ognize because of their abundant appearances and ambiguous margins than calcifications, and thus, mass detection is a chal- lenging problem [2], [3]. A number of schemes have been developed for mammo- graphic mass detection. Early detection schemes always em- ploy simple enhancing or filtering techniques [4]–[6]. To further enhance the detection efficiency and accuracy, some complex techniques are developed. Rangayyan et al. [7] studied a den- sity slicing method to segment the region of interests (ROIs); Brake and Karssemeijer [8] discussed the mass detection with single- and multiscale styles; Karssemeijer [9] also proposed local orientation patterns for mass detection. To incorporate neighborhood information, Li et al. [10] applied the morpho- logical enhancement and stochastic model-based segmentation. Tourassi et al. [11] employed ROIs with known ground truth as templates, and the template matching with mutual information was used. Varela et al. [12] studied the iris filter in different scales and then developed a new system to detect malignant masses. Their average sensitivities are around 90% at 1–15 false positives per image (FPsI). Recently, essential characteristics of masses are considered for detection. Timp and Karssemeijer [13] investigated inter- val changes between two consecutive mammographics in the feature space, which could find small lesions and architec- tural distortions. Georgiou et al. [14] studied the original ra- dial distance under the complete spectrum of signal analysis. Guliato et al. [15] proposed a method to derive polygonal mod- els of contours to preserve spicules and details of diagnostic importance. Among all these existing characteristics, gradient and mor- phological features are most frequently used for masses recog- nition, since masses always possess a highlighted focal region with some successive dimmer concentric layers. For this rea- son, Eltonsy et al. [16] developed a concentric morphology model for detecting masses. They first granulated the gray 1089-7771/$26.00 © 2009 IEEE Authorized licensed use limited to: XIDIAN UNIVERSITY. Downloaded on April 04,2010 at 10:19:59 EDT from IEEE Xplore. Restrictions apply.
Transcript of On Combining Morphological Component Analysis and Concentric Morphology Model for

266 IEEE TRANSACTIONS ON INFORMATION TECHNOLOGY IN BIOMEDICINE, VOL. 14, NO. 2, MARCH 2010
On Combining Morphological Component Analysisand Concentric Morphology Model for
Mammographic Mass DetectionXinbo Gao, Senior Member, IEEE, Ying Wang, Xuelong Li, Senior Member, IEEE, and Dacheng Tao, Member, IEEE
Abstract—Mammographic mass detection is an important taskfor the early diagnosis of breast cancer. However, it is difficult todistinguish masses from normal regions because of their abundantmorphological characteristics and ambiguous margins. To improvethe mass detection performance, it is essential to effectively prepro-cess mammogram to preserve both the intensity distribution andmorphological characteristics of regions. In this paper, morpholog-ical component analysis is first introduced to decompose a mammo-gram into a piecewise-smooth component and a texture component.The former is utilized in our detection scheme as it effectively sup-presses both structural noises and effects of blood vessels. Then,we propose two novel concentric layer criteria to detect differenttypes of suspicious regions in a mammogram. The combination isevaluated based on the Digital Database for Screening Mammog-raphy, where 100 malignant cases and 50 benign cases are utilized.The sensitivity of the proposed scheme is 99% in malignant, 88%in benign, and 95.3% in all types of cases. The results show that theproposed detection scheme achieves satisfactory detection perfor-mance and preferable compromises between sensitivity and falsepositive rates.
Index Terms—Breast cancer, computer-aided detection, massdetection, morphological component analysis (MCA), morphologyconcentric layer.
I. INTRODUCTION
BREAST cancer is one of the most frequent leading causesof cancer deaths in women. The American Cancer Society
(ACS) estimates that about 184,450 new breast cancer cases areexpected to be diagnosed in 2008 [1]. Therefore, the early detec-tion is a main factor to reduce deaths of the disease. Mammog-raphy, which reveals the pronounced evidence of abnormality inbreast, is currently the most effective tool for early detection of
Manuscript received November 20, 2008; revised June 27, 2009. First pub-lished November 10, 2009; current version published March 17, 2010. Thiswork was supported by the National Science Foundation of China under Grant60771068, Grant 60702061, and Grant 60832005, by the Open-End Fund ofthe National Laboratory of Pattern Recognition in China and the National Lab-oratory of Automatic Target Recognition, Shenzhen University, China, by theProgram for Changjiang Scholars and Innovative Research Team in the Uni-versity of China under Grant IRT0645, and by the 100 Talents Program ofThe Chinese Academy of Sciences, by the Nanyang Technological UniversityNanyang SUG Grant, under Grant M58020010, and by the K. C. Wong Educa-tion Foundation Award.
X. Gao and Y. Wang are with the School of Electronic Engineering,Xidian University, Xi’an 710071, China (e-mail: [email protected];[email protected]).
X. Li is with the State Key Laboratory of Transient Optics and Photonics,Xi’an Institute of Optics and Precision Mechanics, Chinese Academy of Sci-ences, Xi’an 710119, China (e-mail: xuelong_li@opt. ac.cn).
D. Tao is with the School of Computer Engineering, Nanyang TechnologicalUniversity, Singapore 639798, Singapore (e-mail: [email protected]).
Color versions of one or more of the figures in this paper are available onlineat http://ieeexplore.ieee.org.
Digital Object Identifier 10.1109/TITB.2009.2036167
breast cancer. However, it is difficult to interpret a mammogra-phy as its sensitivity is seriously affected by image quality andradiologist’s experiences. Independent double reading by tworadiologists is introduced in screening routine to improve theaccuracy of diagnosis. Though it could improve the sensitivityof diagnosis, the high cost is unacceptable in practical appli-cations. Therefore, Computer-aided detection (CAD) schemeshave been developed and acknowledged to assist radiologistsin improving the accuracy of diagnosis. Masses and calcifica-tions are two primary signatures of abnormity in mammograms.Existing research results show masses are more difficult to rec-ognize because of their abundant appearances and ambiguousmargins than calcifications, and thus, mass detection is a chal-lenging problem [2], [3].
A number of schemes have been developed for mammo-graphic mass detection. Early detection schemes always em-ploy simple enhancing or filtering techniques [4]–[6]. To furtherenhance the detection efficiency and accuracy, some complextechniques are developed. Rangayyan et al. [7] studied a den-sity slicing method to segment the region of interests (ROIs);Brake and Karssemeijer [8] discussed the mass detection withsingle- and multiscale styles; Karssemeijer [9] also proposedlocal orientation patterns for mass detection. To incorporateneighborhood information, Li et al. [10] applied the morpho-logical enhancement and stochastic model-based segmentation.Tourassi et al. [11] employed ROIs with known ground truth astemplates, and the template matching with mutual informationwas used. Varela et al. [12] studied the iris filter in differentscales and then developed a new system to detect malignantmasses. Their average sensitivities are around 90% at 1–15 falsepositives per image (FPsI).
Recently, essential characteristics of masses are consideredfor detection. Timp and Karssemeijer [13] investigated inter-val changes between two consecutive mammographics in thefeature space, which could find small lesions and architec-tural distortions. Georgiou et al. [14] studied the original ra-dial distance under the complete spectrum of signal analysis.Guliato et al. [15] proposed a method to derive polygonal mod-els of contours to preserve spicules and details of diagnosticimportance.
Among all these existing characteristics, gradient and mor-phological features are most frequently used for masses recog-nition, since masses always possess a highlighted focal regionwith some successive dimmer concentric layers. For this rea-son, Eltonsy et al. [16] developed a concentric morphologymodel for detecting masses. They first granulated the gray
1089-7771/$26.00 © 2009 IEEE
Authorized licensed use limited to: XIDIAN UNIVERSITY. Downloaded on April 04,2010 at 10:19:59 EDT from IEEE Xplore. Restrictions apply.
GAO et al.: COMBINING MORPHOLOGICAL COMPONENT ANALYSIS AND CONCENTRIC MORPHOLOGY MODEL 267
levels of a mammogram into manageable bins; then morpholog-ical features were extracted on the granule mammograms; andfinally, the suspicious regions were detected by multiple con-centric layers (MCL) criteria. This scheme takes the essentialcharacteristics of masses into consideration as the preconditionsthat disclose the real growth activity of masses.
Despite MCL being a promising strategy to detect malignantmasses, it is not so suitable for benign cases. This is probablybecause the strategy only employs a simple gray-level trans-formation for granulation processing. Despite the fact that thetransformation presents the connectivity and similarity amongpixels, it leads to three problems: 1) it decreases the globaland also local contrast of mammograms, and thus, it is dif-ficult to detect masses with low contrast in comparison withtheir backgrounds; 2) it assigns granule levels by scanning3 × 3 neighborhood of each pixel, and thus, Mosaics effectsand morphological features analysis will be incorrect; and 3) itcannot suppress the high intensity of blood vessels and glandulartissues.
To solve the aforementioned problems, we present a newscheme for mass detection. Morphological component analysis(MCA) is introduced as a preprocessing step in this schemeto 1) maintain the local contrast of an original mammogram;2) preserve the margin characteristics; and 3) suppress the struc-tural noises, blood vessels, and glandular tissues. The proposedscheme first decomposes the mammogram into a piecewise-smooth component and a texture component by MCA, wherethe former component achieves these three objectives. Then,morphological features are extracted and analyzed based on thepiecewise-smooth component for detecting ROIs. Finally, ROIs,which satisfy the new concentric layer rules, are extracted as thesuspicious mass regions. Model parameters are also discussedfor analyzing their impact on detection results and the optimalrules and parameters will be given later.
The rest of this paper is organized as follows. Section IIbriefs MCA. The proposed framework is detailed in Section III.Experimental results and analysis are given in Section IV andSection V concludes the paper.
II. MORPHOLOGICAL COMPONENT ANALYSIS
Preprocessing is the precondition and foundation for the massdetection system, so we need a method that could accurately pre-serve the local contrast and the morphological features of massesin mammograms. Moreover, the method could suppress the neg-ative impaction induced by blood vessels and structural noises.Therefore, MCA is introduced to extract the piecewise-smoothcomponent of mammograms to further improve the detectionperformance.
MCA [17] separates features that present different morpho-logical aspects contained in an image, and it can be deemedas a fast and simple basis pursuit [18], in which 1) its dic-tionary is a concatenation associated with a fast transforma-tion and 2) constraints can be easily imposed on decomposedcomponents.
Assume an image s is a linear combination of K components,i.e., s =
∑Kk=1 sk , and MCA seeks the sparest representation
over dictionaries Φk , i.e.
{αopt
1 , . . . , αoptK
}= arg min
{α1 ,...,αK }
K∑
k=1
‖αk‖1
+ λ
∥∥∥∥∥s −
K∑
k=1
Φkαk
∥∥∥∥∥
2
2
(1)
where αk represents the kth sparse solution. To have a fast solv-ing procedure, MCA uses dictionaries that have a fast transfor-mation Tk (αk = Tk sk ) and reconstruction Rk (sk = Rkαk ).Then, the problem is simplified as
{sopt
1 , . . . , soptK
}= arg min
{s1 ,...,sK }
K∑
k=1
‖Tk sk‖1
+ λ
∥∥∥∥∥s −
K∑
k=1
sk
∥∥∥∥∥
2
2
. (2)
Block coordinate relaxation method [19] can be utilized toobtain the solution of (2). Based on MCA, an image is decom-posed into different components by using different combina-tions of transformations and each component represents a kindof morphologic component.
III. MASS DETECTION BASED ON MCA AND MODIFIED MCL
The proposed scheme comprises three major stages, i.e., pre-processing, morphological feature extraction, and rule-baseddetection stage. Fig. 1 shows the overview of the proposed massdetection scheme, each component of which will be describedin detail as follows.
A. MCA in Mammograms
A mammogram can be deemed as a combination of two com-ponents, a piecewise-smooth component that contains main en-ergy and intensity distribution of the breast region, and a texturecomponent that contains blood vessels and structural noises.Therefore, we need two dictionaries to, respectively, representthese components in mammograms.
Undecimated version of biorthogonal wavelet transforms(UWT) is often well suited to a wide class of natural scenes [20].It can effectively represent the piecewise-smooth content in im-ages. In addition, the shift invariance property of UWT couldmake the mass location process more accurate. So, the UWTis applied in our decomposition work. Local discrete cosinetransform (LDCT) possesses good performance in extractingthe local texture. It can effectively represent either smooth orperiodic behaviors [20]. Thus, LDCT is adopted to extract thestructural noises and blood vessels in mammogram.
Assume TLDC and TUWT denote the UWT and LDCT,respectively. Under this setting, the solutions are given by{αopt
LDC , αoptUWT
}, and we can get two components sLDC and
sUWT . Therefore, (2) is rewritten as{sopt
LDC , soptUWT
}= arg min
{sL D C ,sU W T }‖TLDCsLDC‖1
+ ‖TUWTsUWT‖1 + λ ‖s − sLDC − sUWT‖22 . (3)
Authorized licensed use limited to: XIDIAN UNIVERSITY. Downloaded on April 04,2010 at 10:19:59 EDT from IEEE Xplore. Restrictions apply.

268 IEEE TRANSACTIONS ON INFORMATION TECHNOLOGY IN BIOMEDICINE, VOL. 14, NO. 2, MARCH 2010
Fig. 1. Proposed mass detection scheme.
We also apply the block coordinate relaxation to obtain theoptimal solution of (3) and the details are given as follows.
Step 1: Initialize the number of iterations N and thresholdδ = λN .
Step 2: In each iteration, if δ > λ
1) update sLDC with fixed sUWT ;2) calculate the residual r = s − sUWT and transform r to
obtain αLDC ;3) soft threshold is used to obtain αLDC , and the signal is
reconstructed by sLDC = RLDC αLDC ;4) assume sLDC is fixed and repeat the above operation.Then, morphologic features will be extracted based on the
piecewise-smooth component, described as follows.
B. Morphological Features Extraction and Analysis
Most mass regions always possess rounded or oval focal ar-eas, and the intensity distributions within them are usually con-tinuous. These experiences provide some useful morphologicalfeatures to detect the ROIs, through which regions with highsuspicion could be detected.
1) Solidity: It describes duty ratio by calculating the ratioof the filling area to the total area including all the holes of theregion. Since mass regions always possess continuous intensitydistributions, their solidity values are very high. Variations ofthis parameter almost do not affect the detection sensitivities,while it may affect the false positive rates subtlety.
2) Eccentricity: It represents the region shapes. It is the ec-centricity of the ellipse that is most close to the region. Focalregions of masses always possess rounded or oval shapes. So,regions are potentially mass regions when this parameter is morethan the threshold. This parameter is very important in the de-tection procedure, since a little variation will severely affect thesensitivity and the FPsI.
3) Extent: This parameter is the ratio of an actual area toits smallest external rectangle. Normal regions always possessarbitrary shapes which are more likely anisotropic, while focalregions of masses usually have large extent value because oftheir rounded or oval shapes. This parameter affects detectionresults severely, and a small threshold will bring many falsepositives.
4) Contrast: It is the intensity ratio of a focal region to itsinflated region. Some small masses do not have concentric lay-ers, so this parameter can help in detecting small masses. Inaddition, this parameter also affects the detection performance,and an appropriate threshold can improve the sensitivity.
C. Mass Region Detection
Mass regions always possess continuous intensity distribu-tions. They usually have the brightest focal regions and thengradually grow dimmer. Therefore, after mammograms are sep-arated into multi-intensity layers by using different intensitythresholds, the real mass regions should contain some con-centric layers on different intensity layers. MCA extract thepiecewise-smooth component of mammograms, but this opera-tion also reduces the multilayer characteristic of masses’ inten-sity. Therefore, suspicious region detection criteria should bemodified according to the practical detection procedures.
According to the smooth degree of mammograms obtained byMCA, masses can be divided into two major classes, i.e., largemasses with more than one concentric layer and small masseswith no concentric layers. Then, we develop two new detectioncriteria for mass region detection.
1) Multilayer Criterion: Focal regions with concentric lay-ers (≥1) are considered as mass regions, and the confidenceincreases with the increase in the number of layers.
2) Single-Layer Criterion: Focal regions without concentriclayers in their adjacent lower intensity layer are considered asmass regions, only if their morphological features satisfy stricterthreshold conditions and the additional contrast condition at thesame time.
These two criteria cover two types of masses. One is the massregions with significant intensity distributions, and another typeis the subtle abnormities that possess a small area with weakcontrast. Therefore, these two new criteria are developed todetect all types of mass regions. If one of the criteria is satisfied,the region can be deemed as the suspicious region.
As described earlier, the detailed procedure of the proposeddetection scheme is given as follows.
Step 1: Breast regions are segmented first by using Otsu’smethod. Then, the mammograms are decomposed
Authorized licensed use limited to: XIDIAN UNIVERSITY. Downloaded on April 04,2010 at 10:19:59 EDT from IEEE Xplore. Restrictions apply.
GAO et al.: COMBINING MORPHOLOGICAL COMPONENT ANALYSIS AND CONCENTRIC MORPHOLOGY MODEL 269
into piecewise-smooth component and textural com-ponent by using MCA.
Step 2: Piecewise-smooth parts of mammograms are thenseparated into different intensity layers by using mul-tiple intensity thresholds. The thresholds start fromthe highest gray level to the lowest one with a prede-fined fixed step. All the independent regions in eachintensity layer are then extracted for further analy-sis. The separation is stopped when the area of thethresholding regions is larger than half of the size ofthe mammograms.
Step 3: Morphological features in B are calculated to selectthe suspicious focal regions. We preserve regions,which satisfy all the initial conditions, as suspiciousfocal regions.
Step 4: After initial selection, unnecessary regions are furtherremoved by using two new concentric layer criteria.
Finally, false positives are removed by using criteria of theMCL method, and the ultimate detection results are given.
IV. EXPERIMENTAL RESULTS AND ANALYSIS
A. Dataset
The scheme is tested with a total of 200 mammograms se-lected from the DDSM provided by the University of SouthFlorida [21]. Mammograms in DDSM were digitized by us-ing the Lumisys scanner at 0.5 mm, and Howtek scannerat 0.435 mm pixel size, 12 bits per pixel, with size about5000 pixel × 3000 pixel. Mammograms containing suspectareas have associated ground truth information about the lo-cations and types of those regions. The subdatabases that wereselected include circumscribed and speculate cases in both be-nign and malignant categories. Among all the cases, 140 aremalignant masses while 60 are benign ones, and 50 (40 malig-nant and 10 benign) are selected as the training set to analyzethe model parameters. Before the scheme was applied, mammo-grams were downsampled by a factor of 5. Since masses alwayspossess certain area, the downsampling operation will affect theperformance slightly while the processing will be speeded upsignificantly.
B. Model Parameters Analysis
As described in Section III, model parameters in each stepplay an important role in the whole detection scheme. Theseparameters are discussed independently. In this paper, we paymore attention to sensitivity because it is more important at thedetection stage.
1) Layer Separation Interval (LSI): It was set as 0.05 in ourdetection scheme, which resulted in a good tradeoff between thesensitivity and false positives rates. Table I shows the detectionresults under different settings in training.
TP is the true positive rate of the detection results. Accordingto the training results in Table II, 0.05 is a good choice of LSIand it led to better compromise between TP and FPsI.
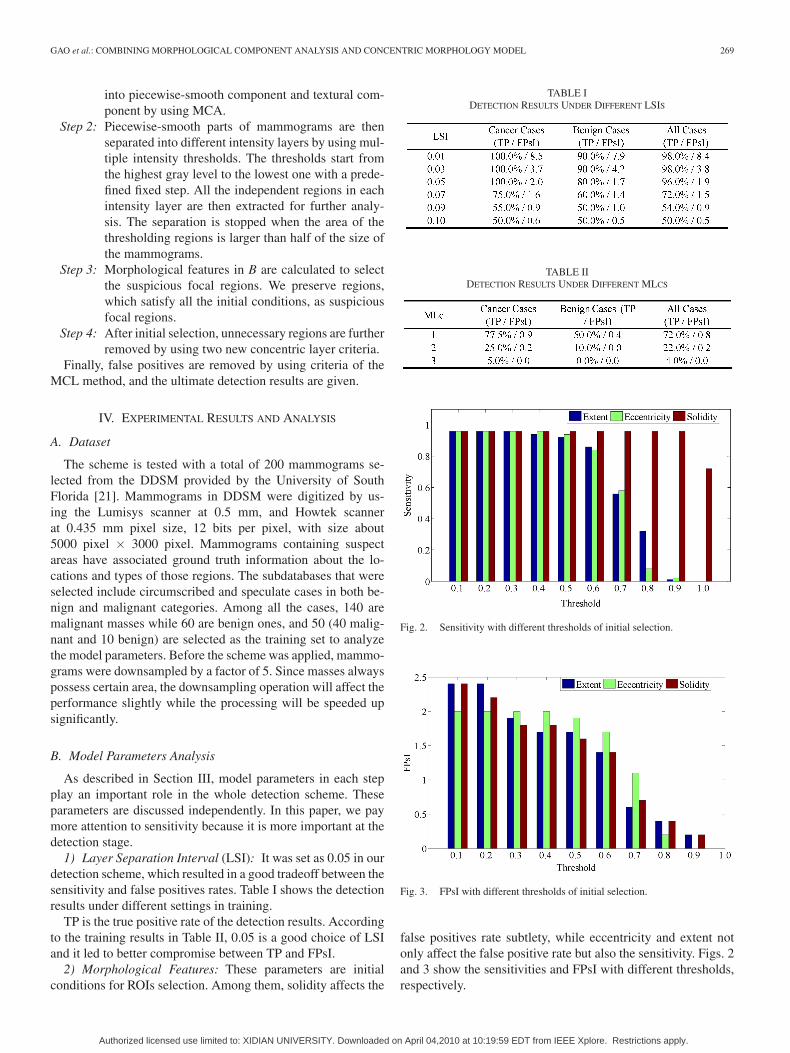
2) Morphological Features: These parameters are initialconditions for ROIs selection. Among them, solidity affects the
TABLE IDETECTION RESULTS UNDER DIFFERENT LSIS
TABLE IIDETECTION RESULTS UNDER DIFFERENT MLCS
Fig. 2. Sensitivity with different thresholds of initial selection.
Fig. 3. FPsI with different thresholds of initial selection.
false positives rate subtlety, while eccentricity and extent notonly affect the false positive rate but also the sensitivity. Figs. 2and 3 show the sensitivities and FPsI with different thresholds,respectively.
Authorized licensed use limited to: XIDIAN UNIVERSITY. Downloaded on April 04,2010 at 10:19:59 EDT from IEEE Xplore. Restrictions apply.
270 IEEE TRANSACTIONS ON INFORMATION TECHNOLOGY IN BIOMEDICINE, VOL. 14, NO. 2, MARCH 2010
Fig. 4. Sensitivity with different thresholds of SLc.
Fig. 5. FPsI with different thresholds of SLc.
3) Multiconcentric Layers Criteria (MLc): If selected ROIshave more than one concentric layer in their successive lowerintensity layers, they will be considered as mass regions. Whencriteria turn strict, the detection sensitivity deceases. The cor-responding detection results without single-layer criteria areshown in Table II. Without the single-layer criteria, the detec-tion results are unacceptable.
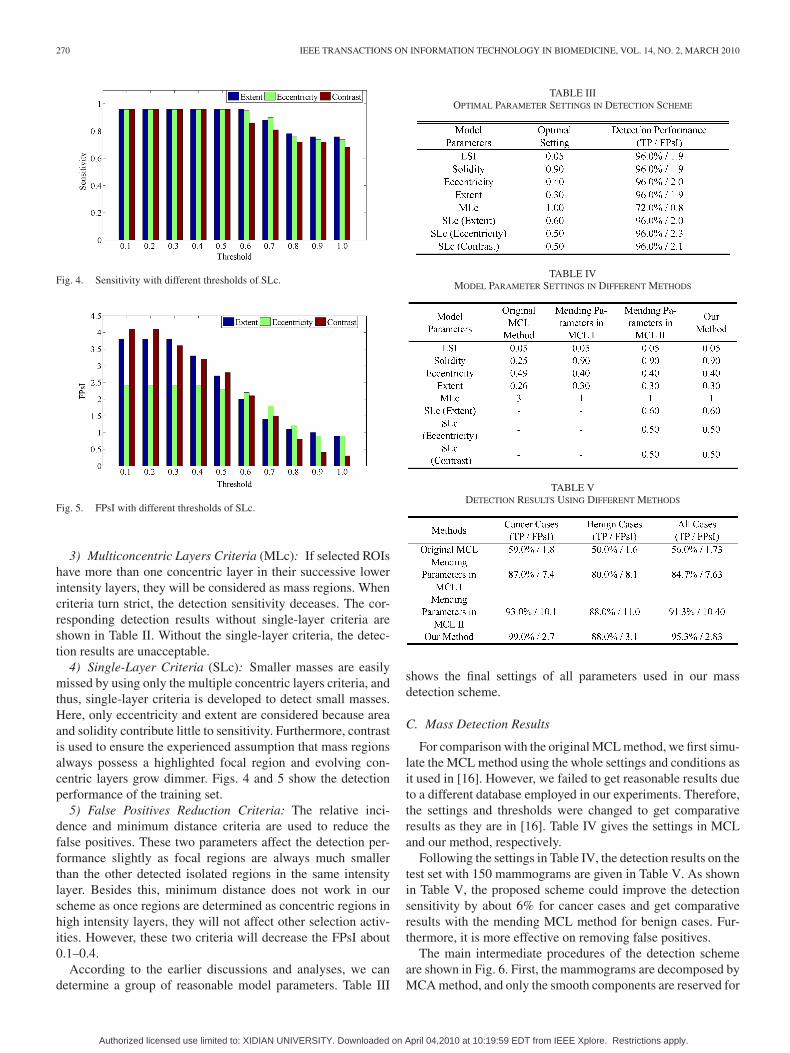
4) Single-Layer Criteria (SLc): Smaller masses are easilymissed by using only the multiple concentric layers criteria, andthus, single-layer criteria is developed to detect small masses.Here, only eccentricity and extent are considered because areaand solidity contribute little to sensitivity. Furthermore, contrastis used to ensure the experienced assumption that mass regionsalways possess a highlighted focal region and evolving con-centric layers grow dimmer. Figs. 4 and 5 show the detectionperformance of the training set.
5) False Positives Reduction Criteria: The relative inci-dence and minimum distance criteria are used to reduce thefalse positives. These two parameters affect the detection per-formance slightly as focal regions are always much smallerthan the other detected isolated regions in the same intensitylayer. Besides this, minimum distance does not work in ourscheme as once regions are determined as concentric regions inhigh intensity layers, they will not affect other selection activ-ities. However, these two criteria will decrease the FPsI about0.1–0.4.
According to the earlier discussions and analyses, we candetermine a group of reasonable model parameters. Table III
TABLE IIIOPTIMAL PARAMETER SETTINGS IN DETECTION SCHEME
TABLE IVMODEL PARAMETER SETTINGS IN DIFFERENT METHODS
TABLE VDETECTION RESULTS USING DIFFERENT METHODS
shows the final settings of all parameters used in our massdetection scheme.
C. Mass Detection Results
For comparison with the original MCL method, we first simu-late the MCL method using the whole settings and conditions asit used in [16]. However, we failed to get reasonable results dueto a different database employed in our experiments. Therefore,the settings and thresholds were changed to get comparativeresults as they are in [16]. Table IV gives the settings in MCLand our method, respectively.
Following the settings in Table IV, the detection results on thetest set with 150 mammograms are given in Table V. As shownin Table V, the proposed scheme could improve the detectionsensitivity by about 6% for cancer cases and get comparativeresults with the mending MCL method for benign cases. Fur-thermore, it is more effective on removing false positives.
The main intermediate procedures of the detection schemeare shown in Fig. 6. First, the mammograms are decomposed byMCA method, and only the smooth components are reserved for
Authorized licensed use limited to: XIDIAN UNIVERSITY. Downloaded on April 04,2010 at 10:19:59 EDT from IEEE Xplore. Restrictions apply.

GAO et al.: COMBINING MORPHOLOGICAL COMPONENT ANALYSIS AND CONCENTRIC MORPHOLOGY MODEL 271
Fig. 6. Whole process of the detection scheme. (a) Original image.(b) Piecewise-smooth image. (c) First density layer. (d) Second density layer.(e) Third density layer. (f) Fourth density layer. (g) Fifth density layer. (h) Eighthdensity layer. (i) Multilayer characteristics of the mass regions. (j) Detectionresult.
Fig. 7. Detection results. (a) Original image. (b) Piecewise-smooth image.(c) Granule image. (d) Detection result based on MCL without employingMCA. (e) Detection result based on MCA.
later detection. Then, the density layers with different thresholdsare acquired for picking up the suspicious isolated regions. Andthe regions which could satisfy the morphological limitationsand also the density layer criteria are finally detected as the massregions.
The original MCL method without employing MCA methodcannot detect the weak contrast regions [as shown in Fig. 7(d)],while the new detection scheme can accurately detect them [asshown in Fig. 7(e)].
A granule image without using MCA is given in Fig. 8(c),which presents obvious Mosaic effects. The detection resultbased on it is given in Fig. 8(d). As we can see, the real massregion is missed. The detection result based on MCA is shownin Fig. 8(e), which can accurately detect the missed abnormity.
Masses are different to detect in mammograms based on gran-ulation processing because it cannot suppress the blood vesselsand structural noises. The detection result using MCA is givenin Fig. 9(e), and the abnormity is accurately detected as thehighlight margin of blood vessels and structural noises are sup-pressed by MCA.
Then, the detection results of the malignant and benign casesare presented, respectively. As shown in Figs. 10 and 11, the
Fig. 8. Detection results. (a) Original image. (b) Piecewise-smooth image.(c) Granule image. (d) Detection result based on MCL without employingMCA. (e) Detection result based on MCA.
Fig. 9. Detection results. (a) Original image. (b) Piecewise-smooth image.(c) Granule image. (d) Detection result based on MCL without employingMCA. (e) Detection result based on MCA.
Fig. 10. Detection results of malignant cases. (a) Original image.(b) Piecewise-smooth image. (c) Detection result based on MCL. (d) Multi-layer characteristics of the mass regions.
malignant masses always possess complex density distributions,while the benign cases have more homogeneous density distri-butions with well-defined margins. And the proposed detectionscheme could effectively detect both these cases.
Although the proposed scheme can improve the detection per-formance significantly with lower false positives rates, it fails towork well on the following examples, as shown in Fig. 12. Thesemissed cases always possess dense glandular tissues embeddedwith mass regions.
The missed mass regions, as shown in Fig. 12, are similarto circles or ellipses with highest density in the center, i.e.,the intensity distributions of these mass regions are similar to2-D projection of Gaussian surface. Therefore, the Gaussian
Authorized licensed use limited to: XIDIAN UNIVERSITY. Downloaded on April 04,2010 at 10:19:59 EDT from IEEE Xplore. Restrictions apply.

272 IEEE TRANSACTIONS ON INFORMATION TECHNOLOGY IN BIOMEDICINE, VOL. 14, NO. 2, MARCH 2010
Fig. 11. Detection results of benign cases. (a) Original image. (b) Piecewise-smooth image. (c) Detection result based on MCL. (d) Multilayer characteristicsof the mass regions.
Fig. 12. Missed cases.
Fig. 13. Mass intensity distribution. (a) Original image. (b) Subimage with amass region. (c) 3-D intensity distribution of the mass region.
model could be introduced to effectively represent this commoncharacteristic of these mass regions, as shown in Fig. 13. In thefuture, we will consider using the Gaussian model to furtherenhance the performance of the proposed scheme.
V. CONCLUSION
A novel mass detection scheme based on MCA and new con-centric layer criteria is presented in this paper. The scheme firstdecomposes the mammograms into piecewise-smooth compo-nent and texture component by using MCA. Then, the smoothcomponent is used to extract the independent regions on differ-ent intensity layers. Four morphological features are calculatedto initially select ROIs, and selected regions are considered asmass regions when they satisfy one of the concentric layer crite-ria. Finally, two false positives reduction criteria are developedto control the number of FPsI. The experimental results showthat the proposed concentric layer criteria could effectively im-prove the detection sensitivity of the benign masses, and theMCA-based mass detection scheme could achieve satisfactorydetection sensitivity with acceptable FPsI. Though the modelparameters of the scheme are discussed to decide the optimalsettings, more robust method should be developed to get thegeneralized model. Furthermore, new features such as Gaussiandistribution characteristics of mass regions and local textureshould be introduced to further reduce the false positives.
ACKNOWLEDGMENT
The authors thank the anonymous reviewers for their helpfulcomments and suggestions.
REFERENCES
[1] American Cancer Society. (2008). “Cancer facts and figures 2008,” inStatistics for 2008. [Online]. Available: http://www.cancer.org/downloads/STT/008-CAFFfinalsecured.pdf
[2] M. P. Sampat, M. K. Markey, and A. C. Bovik, “Computer-aided detec-tion and diagnosis in mammography,” in Handbook of Image and VideoProcessing, 2nd ed. New York: Academic, 2005, pp. 1195–1217.
[3] R. M. Rangayyan, F. J. Ayres, and J. E. Leo Desautels, “A review ofcomputer-aided diagnosis of breast cancer: Toward the detection of subtlesigns,” J. Franklin Inst., vol. 344, no. 3–4, pp. 312–348, May/Jul. 2007.
[4] N. Petrick, H. P. Chan, B. Sahiner, and D. Wei, “An adaptive density-weighted contrast enhancement filter for mammographic breast mass de-tection,” IEEE Trans. Med. Imag., vol. 15, no. 1, pp. 59–67, Feb. 1996.
[5] R. M. Rangayyan, L. Shen, Y. Shen, J. E. Leo Desautels, H. Bryant,T. J. Terry, N. Horeczko, and M. S. Rose, “Improvement of sensitivity ofbreast cancer diagnosis with adaptive neighborhood contrast enhancementof mammograms,” IEEE Trans. Med. Imag., vol. 16, no. 3, pp. 161–170,Sep. 1997.
[6] H. Kobatake, M. Murakami, H. Takeo, and S. Nawano, “Computerizeddetection of malignant tumors on digital mammograms,” IEEE Trans.Med. Imag., vol. 18, no. 5, pp. 369–378, May 1999.
[7] N. R. Mudigonda, R. M. Rangayyan, and J. E. Leo Desautels, “Detectionof breast masses in mammograms by density slicing and texture flow-fieldanalysis,” IEEE Trans. Med. Imag., vol. 20, no. 12, pp. 1215–1227, Dec.2001.
[8] G. M. te Brake and N. Karssemeijer, “Single and multiscale detection ofmasses in digital mammograms,” IEEE Trans. Med. Imag., vol. 18, no. 7,pp. 628–639, Jul. 1999.
[9] N. Karssemeijer, “Local orientation distribution as a function of spatialscale for detection of masses in mammograms,” in Proc. IPMI, LectureNotes in Computer Science, 1999, vol. 1613, pp. 280–293.
[10] H. Li, Y. Wang, K. J. R. Liu, S. B. Lo, and M. T. Freedman, “Computerizedradiographic mass detection—part I: Lesion site selection by morphologi-cal enhancement and contextual segmentation,” IEEE Trans. Med. Imag.,vol. 20, no. 4, pp. 289–301, Apr. 2001.
[11] G. D. Tourassi, R. V. Voracek, D. M. Catarious, Jr., and C. E. Floyd,Jr., “Computer-assisted detection of mammographic masses: A templatematching scheme based on mutual information,” Med. Phys., vol. 30,no. 8, pp. 2123–2130, Aug. 2003.
Authorized licensed use limited to: XIDIAN UNIVERSITY. Downloaded on April 04,2010 at 10:19:59 EDT from IEEE Xplore. Restrictions apply.

GAO et al.: COMBINING MORPHOLOGICAL COMPONENT ANALYSIS AND CONCENTRIC MORPHOLOGY MODEL 273
[12] C. Varela, P. G. Tahoces, A. J. Mendez, M. Souto, and J. J. Vidal, “Com-puterized detection of breast masses in digitized mammograms,” Comput.Biol. Med., vol. 37, no. 2, pp. 214–226, Feb. 2007.
[13] S. Timp and N. Karssemeijer, “Interval change analysis to improve com-puter aided detection in mammography,” Med. Image Anal., vol. 10, no. 1,pp. 82–95, Feb. 2006.
[14] H. Georgiou, M. Mavroforakis, N. Dimitropoulos, D. Cavouras, andS. Theodoridis, “Multi-scale morphological features for the characteri-zation of mammographic masses using statistical classification schemes,”Artif. Intell. Med., vol. 41, no. 1, pp. 39–55, Sep. 2007.
[15] D. Guliato, R. M. Rangayyan, J. D. Carvalho, and S. A. Santiago, “Polyg-onal modeling of contours of breast tumors with the preservation ofspicules,” IEEE Trans. Biomed. Eng., vol. 55, no. 1, pp. 14–20, Jan.2008.
[16] N. H. Eltonsy, G. D. Tourassi, and A. S. Elmaghraby, “A concentricmorphology model for the detection of masses in mammography,” IEEETrans. Med. Imag., vol. 26, no. 6, pp. 880–889, Jun. 2007.
[17] J. L. Starck, M. Elad, and D. Donoho, “Redundant multiscale transformsand their application for morphological component analysis,” Adv. Imag.Electron Phys., vol. 132, pp. 287–348, Feb. 2004.
[18] S. Chen, D. Donoho, and M. Saunder, “Atomic decomposition by basispursuit,” SIAM J. Sci. Comput., vol. 20, no. 1, pp. 33–61, Jan. 1998.
[19] A. Bruce, S. Sardy, and P. Tseng, “Block coordinate relaxation methodsfor nonparametric signal denoising,” in Proc. Int. Soc. Opt. Eng. (SPIE),1998, vol. 3391, pp. 75–86.
[20] J. L. Starck, M. Elad, and D. L. Donoho, “Image decomposition via thecombination of sparse representations and a variational approach,” IEEETrans. Image Process., vol. 14, no. 10, pp. 1570–1582, Oct. 2005.
[21] University of South Florida. (2004). Digital Database for Screening Mam-mography (DDSM). [Online]. Available: http://marathon.csee.usf.edu/Mammography/Database.html
Xinbo Gao (M’02–SM’07) received the B.Sc.,M.Sc., and Ph.D. degrees in signal and informationprocessing from Xidian University, Xi’an, China, in1994, 1997, and 1999, respectively.
From 1997 to 1998, he was a Research Fellow withthe Department of Computer Science, Shizuoka Uni-versity, Shizuoka, Japan. From 2000 to 2001, he wasa Postdoctoral Research Fellow with the Departmentof Information Engineering, The Chinese Universityof Hong Kong, Shatin, Hong Kong. Since 2001, hehas been with the School of Electronic Engineering,
Xidian University, where he is currently a Professor of pattern recognition andintelligent system and the Director of the Video and Image Processing System(VIPS) Laboratory. He has published four books and more than 100 scientificpapers in refereed journals and proceedings, including the IEEE TRANSACTIONS
ON IMAGE PROCESSING, the IEEE TRANSACTIONS ON CIRCUITS AND SYSTEMS
FOR VIDEO TECHNOLOGY, the IEEE TRANSACTIONS ON NEURAL NETWORKS,the IEEE TRANSACTIONS ON SYSTEMS, MAN, AND CYBERNETICS—PART C:APPLICATIONS AND REVIEWS, etc. His research interests include computationalintelligence, machine learning, computer vision, pattern recognition, and artifi-cial intelligence.
Prof. Gao is a Fellow of the Institution of Engineering and Technology(IET). He is on the Editorial Boards of many journals, including EURASIP Sig-nal Processing (Elsevier) and Neurocomputing (Elsevier). He served as Gen-eral Chair/Co-Chair or Program Committee Chair/Co-Chair or PC member foraround 30 major international conferences. He is a member of the IEEE Xi’anSection Executive Committee, the Membership Development Committee Chair,and the Vice Chairman of IET Xi’an Network.
Ying Wang received the B.Sc. degree in 2003 andthe M.Sc. degree in 2006, both in signal and infor-mation processing, from Xidian University, Xi’an,China, where she is currently working toward thePh.D. degree in pattern recognition and intelligencesystem.
Her research interests include medical imageanalysis, pattern recognition, and computer-aideddiagnosis.
Xuelong Li (M’02–SM’07) is a Researcher (Full Professor) with the State KeyLaboratory of Transient Optics and Photonics, Xi’an Institute of Optics andPrecision Mechanics, Chinese Academy of Sciences, Xi’an, China.
Dacheng Tao (M’07) received the B.Eng. degreefrom the University of Science and Technology ofChina, the M.Phil degree from The Chinese Univer-sity of Hong Kong, Shatin, Hong Kong, and the Ph.D.degree from the University of London, London, U.K.
Currently, he is a Nanyang Assistant Professorwith the School of Computer Engineering, NanyangTechnological University, Singapore, and holds a vis-iting post in London. He is a Visiting Professor atXidian University, Xi’an, China, and a Guest Pro-fessor at Wuhan University, Wuhan, China. He has
published more than 100 scientific papers in top venues with best paper runnerup awards and finalists. He has authored/edited six books and eight journalspecial issues. His research is mainly on applying statistics and mathematics fordata analysis problems in computer vision, multimedia, machine learning, datamining, and video surveillance.
He has Cochaired for special sessions, invited sessions, workshops, panelsand conferences. He is an Associate Editor of the IEEE TRANSACTIONS ON
KNOWLEDGE AND DATA ENGINEERING and the Computational Statistics andData Analysis (Elsevier).
Authorized licensed use limited to: XIDIAN UNIVERSITY. Downloaded on April 04,2010 at 10:19:59 EDT from IEEE Xplore. Restrictions apply.