On-Campus Work and Success - Colorado State University
23
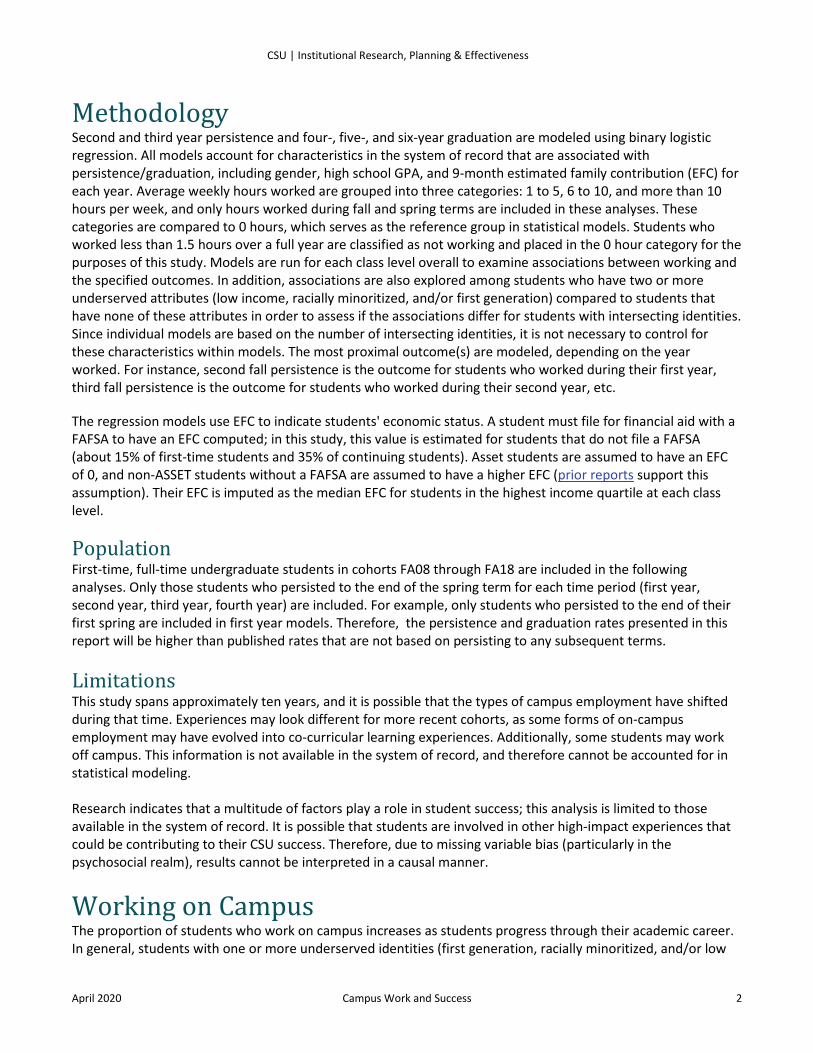
CSU | Institutional Research, Planning & Effectiveness April 2020 Campus Work and Success 1 On-Campus Work and Success The purpose of this report is to examine the relationship between on-campus employment and undergraduate student persistence and graduation. Campus employment, in addition to providing financial support, also provides opportunity for meaningful learning experiences and connection to the campus community, similar to other co-curricular experiences. Results from the 2016 and 2019 National Surveys of Student Engagement (NSSE) show mixed results when examining student success outcomes by number of hours worked. In 2016, students who reported working up to 15 hours per week in the previous year persisted at a higher rate compared to students who did not work on campus. This same association was not observed in 2019; students who worked had very similar success outcomes compared to students who did not work. This report uses student employment data in the system of record, rather than self-reported survey data, while statistically controlling for other factors associated with persistence and graduation, to examine these associations more in- depth. Associations are further explored by the intersection of underserved attributes (Pell recipient, first generation, and racially minoritized). Key Findings In general, working on campus is positively associated with persistence and graduation across all years that students are employed, compared to students who did not work during the same time period. This association holds for students with multiple underrepresented attributes compared to students without any attributes. This trend is observed for all years (first, second, third, and fourth). • Students who work on campus tend to have a larger representation of underserved identities compared to those who do not. In general, students with multiple underserved identities work more hours per week and work multiple years. • The proportion of students employed on campus increases as students progress through their academic career, as do the number of hours worked. • Among all students, working more than 5 hours per week during their first or second year is associated with higher persistence to second and third fall compared to students who did not work during their first year. Importantly, this association is even stronger for students with intersecting underserved identities. • Overall, students who work during their third year have higher four- and six-year graduation rates compared to students who did not work. The association between working and graduating is slightly stronger for students with underserved identities for six-year graduation. • Overall, students who work more than 10 hours per week do not gain any additional benefit in terms of persistence or graduation; in general, rates plateau at 6-10 hours per week. However, these data do not suggest that working more than 10 hours a week is negatively associated with persistence and graduation. • Among all six-year degree recipients, working is associated with a shorter time to graduation overall. This association is strongest among students without any underserved identities. As the number of years worked increases, the proportion of graduates who are able to complete their degree in four years or less also increases.
Transcript of On-Campus Work and Success - Colorado State University
CSU | Institutional Research, Planning & Effectiveness
April 2020 Campus Work and Success 1
On-Campus Work and Success The purpose of this report is to examine the relationship between on-campus employment and undergraduate student persistence and graduation. Campus employment, in addition to providing financial support, also provides opportunity for meaningful learning experiences and connection to the campus community, similar to other co-curricular experiences. Results from the 2016 and 2019 National Surveys of Student Engagement (NSSE) show mixed results when examining student success outcomes by number of hours worked. In 2016, students who reported working up to 15 hours per week in the previous year persisted at a higher rate compared to students who did not work on campus. This same association was not observed in 2019; students who worked had very similar success outcomes compared to students who did not work. This report uses student employment data in the system of record, rather than self-reported survey data, while statistically controlling for other factors associated with persistence and graduation, to examine these associations more in-depth. Associations are further explored by the intersection of underserved attributes (Pell recipient, first generation, and racially minoritized).
Key Findings In general, working on campus is positively associated with persistence and graduation across all years that students are employed, compared to students who did not work during the same time period. This association holds for students with multiple underrepresented attributes compared to students without any attributes. This trend is observed for all years (first, second, third, and fourth).
• Students who work on campus tend to have a larger representation of underserved identities compared to those who do not. In general, students with multiple underserved identities work more hours per week and work multiple years.
• The proportion of students employed on campus increases as students progress through their academic career, as do the number of hours worked.
• Among all students, working more than 5 hours per week during their first or second year is associated with higher persistence to second and third fall compared to students who did not work during their first year. Importantly, this association is even stronger for students with intersecting underserved identities.
• Overall, students who work during their third year have higher four- and six-year graduation rates compared to students who did not work. The association between working and graduating is slightly stronger for students with underserved identities for six-year graduation.
• Overall, students who work more than 10 hours per week do not gain any additional benefit in terms of persistence or graduation; in general, rates plateau at 6-10 hours per week. However, these data do not suggest that working more than 10 hours a week is negatively associated with persistence and graduation.
• Among all six-year degree recipients, working is associated with a shorter time to graduation overall. This association is strongest among students without any underserved identities. As the number of years worked increases, the proportion of graduates who are able to complete their degree in four years or less also increases.
CSU | Institutional Research, Planning & Effectiveness
April 2020 Campus Work and Success 2
Methodology Second and third year persistence and four-, five-, and six-year graduation are modeled using binary logistic regression. All models account for characteristics in the system of record that are associated with persistence/graduation, including gender, high school GPA, and 9-month estimated family contribution (EFC) for each year. Average weekly hours worked are grouped into three categories: 1 to 5, 6 to 10, and more than 10 hours per week, and only hours worked during fall and spring terms are included in these analyses. These categories are compared to 0 hours, which serves as the reference group in statistical models. Students who worked less than 1.5 hours over a full year are classified as not working and placed in the 0 hour category for the purposes of this study. Models are run for each class level overall to examine associations between working and the specified outcomes. In addition, associations are also explored among students who have two or more underserved attributes (low income, racially minoritized, and/or first generation) compared to students that have none of these attributes in order to assess if the associations differ for students with intersecting identities. Since individual models are based on the number of intersecting identities, it is not necessary to control for these characteristics within models. The most proximal outcome(s) are modeled, depending on the year worked. For instance, second fall persistence is the outcome for students who worked during their first year, third fall persistence is the outcome for students who worked during their second year, etc.
The regression models use EFC to indicate students' economic status. A student must file for financial aid with a FAFSA to have an EFC computed; in this study, this value is estimated for students that do not file a FAFSA (about 15% of first-time students and 35% of continuing students). Asset students are assumed to have an EFC of 0, and non-ASSET students without a FAFSA are assumed to have a higher EFC (prior reports support this assumption). Their EFC is imputed as the median EFC for students in the highest income quartile at each class level.
Population First-time, full-time undergraduate students in cohorts FA08 through FA18 are included in the following analyses. Only those students who persisted to the end of the spring term for each time period (first year, second year, third year, fourth year) are included. For example, only students who persisted to the end of their first spring are included in first year models. Therefore, the persistence and graduation rates presented in this report will be higher than published rates that are not based on persisting to any subsequent terms.
Limitations This study spans approximately ten years, and it is possible that the types of campus employment have shifted during that time. Experiences may look different for more recent cohorts, as some forms of on-campus employment may have evolved into co-curricular learning experiences. Additionally, some students may work off campus. This information is not available in the system of record, and therefore cannot be accounted for in statistical modeling. Research indicates that a multitude of factors play a role in student success; this analysis is limited to those available in the system of record. It is possible that students are involved in other high-impact experiences that could be contributing to their CSU success. Therefore, due to missing variable bias (particularly in the psychosocial realm), results cannot be interpreted in a causal manner.
Working on Campus The proportion of students who work on campus increases as students progress through their academic career. In general, students with one or more underserved identities (first generation, racially minoritized, and/or low

CSU | Institutional Research, Planning & Effectiveness
April 2020 Campus Work and Success 3
income) are more likely to work on campus, and work more hours compared to students without these attributes. Table 1 displays demographics by undergraduate year and work status. For more detailed demographics by number of underrepresented attributes and number of hours worked each year, please see Appendix Table 1.
Table 1. Demographics by Year and Hours Worked on Campus (FA08-FA18 FTFT Cohorts)
Headcount Percent %
Male %
Nonres % Pell % First
Gen % RM HS
GPA Avg 9 Mo
EFC Filed
FAFSA
First Year Did not work 39,378 83.0% 47.0% 27.6% 18.0% 22.4% 19.9% 3.59 $31,680 83.0% Worked 8,037 17.0% 36.6% 24.8% 33.5% 30.5% 26.4% 3.70 $18,558 95.0%
Second Year Did not work 29,644 73.0% 47.3% 26.5% 16.9% 21.2% 18.5% 3.59 $23,521 61.9% Worked 10,942 27.0% 37.5% 25.7% 27.0% 25.9% 25.1% 3.74 $19,166 78.9%
Third Year Did not work 22,754 67.4% 47.1% 24.8% 16.6% 21.1% 17.1% 3.59 $21,422 59.8% Worked 11,001 32.6% 38.6% 25.0% 24.7% 24.4% 23.7% 3.73 $18,596 76.2%
Fourth Year Did not work 19,337 66.6% 46.6% 23.5% 16.6% 21.6% 16.3% 3.59 $19,764 56.7% Worked 9,713 33.4% 39.3% 24.5% 23.8% 23.7% 22.0% 3.72 $17,213 74.2%
*Limited to students who persisted to the end of their spring term for the specified year. For example, only those students who persisted to the end of their first spring are included in the first year demographics. Approximately 17% of students worked on campus during their first year. Of those who worked, the majority worked 10 hours or less per week. In addition, they are more likely to be first generation, Pell recipients, female, Colorado residents, and racially minoritized compared to students who did not work on campus during their first year. First year workers also tend to have a higher level of pre-college academic preparation; their average high school GPA is 3.70 compared to 3.59 among students who did not work on campus during their first year. As the number of hours worked increases, so does the proportion of marginalized characteristics; students who work the most hours are the most likely to file a FAFSA and have the lowest EFC (see Appendix Table 1). Approximately 27% of students worked on campus during their second year. Of those who worked, the majority worked 10 hours or less per week. Second year workers are more likely to be Pell recipients, female, and racially minoritized compared to students who did not work on campus. They also tend to have a higher level of pre-college academic preparation; their average high school GPA is 3.74 compared to 3.59 among students who did not work on campus during their second year. Students working more than 10 hours per week have the largest proportion of underserved characteristics, as well as the lowest average EFC (see Appendix Table 1). About 33% of students worked on campus during their third year. About two-thirds of these students worked 10 hours or less (see Appendix Table 1). Similar to previous years, students who work during their third year on campus have a larger representation of Pell recipients, females, first generation, and racially minoritized students compared to third year students who did not work on campus. These students also have a higher average high school GPA and a lower EFC. About one-third of fourth year students worked on campus. Sixty percent of these students worked 10 hours or less per week, on average. Fourth year workers have a slightly larger proportion of first generation students (2 PP), about 7 PP more Pell recipients and racially minoritized students, and a similar proportion of nonresidents. Students working more than 10 hours have the largest proportion of first generation, Pell, and resident students, with the lowest average EFC (see Appendix Table 1).
CSU | Institutional Research, Planning & Effectiveness
April 2020 Campus Work and Success 4
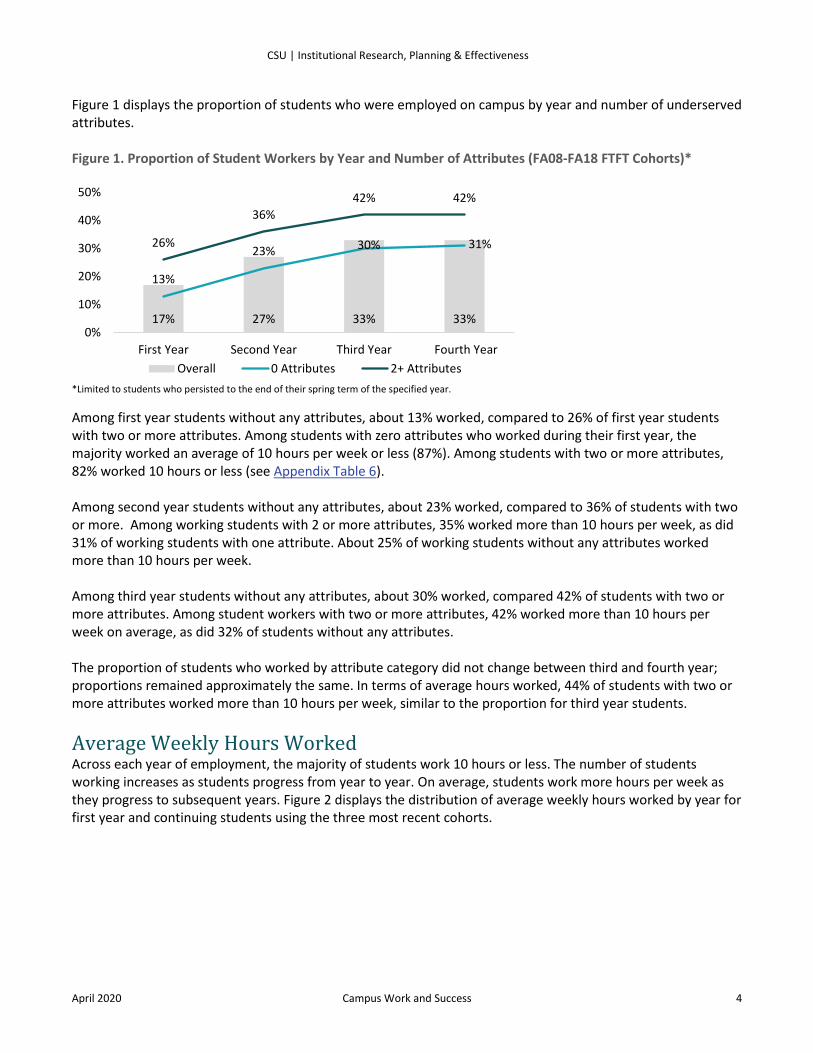
Figure 1 displays the proportion of students who were employed on campus by year and number of underserved attributes. Figure 1. Proportion of Student Workers by Year and Number of Attributes (FA08-FA18 FTFT Cohorts)*
*Limited to students who persisted to the end of their spring term of the specified year. Among first year students without any attributes, about 13% worked, compared to 26% of first year students with two or more attributes. Among students with zero attributes who worked during their first year, the majority worked an average of 10 hours per week or less (87%). Among students with two or more attributes, 82% worked 10 hours or less (see Appendix Table 6). Among second year students without any attributes, about 23% worked, compared to 36% of students with two or more. Among working students with 2 or more attributes, 35% worked more than 10 hours per week, as did 31% of working students with one attribute. About 25% of working students without any attributes worked more than 10 hours per week. Among third year students without any attributes, about 30% worked, compared 42% of students with two or more attributes. Among student workers with two or more attributes, 42% worked more than 10 hours per week on average, as did 32% of students without any attributes. The proportion of students who worked by attribute category did not change between third and fourth year; proportions remained approximately the same. In terms of average hours worked, 44% of students with two or more attributes worked more than 10 hours per week, similar to the proportion for third year students.
Average Weekly Hours Worked Across each year of employment, the majority of students work 10 hours or less. The number of students working increases as students progress from year to year. On average, students work more hours per week as they progress to subsequent years. Figure 2 displays the distribution of average weekly hours worked by year for first year and continuing students using the three most recent cohorts.
17% 27% 33% 33%
13%
23% 30% 31%26%
36%42% 42%
0%
10%
20%
30%
40%
50%
First Year Second Year Third Year Fourth YearOverall 0 Attributes 2+ Attributes

CSU | Institutional Research, Planning & Effectiveness
April 2020 Campus Work and Success 5
Figure 2. Average Weekly Hours Worked, 1st Year and Continuing Students (FA16-FA18 FTFT Cohorts)
About half of all first year workers worked 5 hours or less; and almost 90% worked 10 hours or less. Less than 5% worked more than 15 hours per week during their first year. Among continuing student workers, a larger number worked more than 10 hours per week compared to first year workers; about 30% worked more than 10 hours, and about 10% worked more than 15 hours per week. About one-third worked 5 hours or less, which is about 15 PP less than first year students. Based on this distribution, average hours worked is divided into three groups of 5 hour increments (1-5, 6-10, more than 10) for each year, which creates three relatively equal groups to use in the following analyses.
Total Years Worked Table 2 displays the distribution of total years worked overall and by the number of historically underserved attributes. It is limited to only those students who persisted to the end of their fourth spring and thus had the opportunity to work four years. Table 2: Years Worked by Number of Historically Underserved Attributes (FA08-FA18 FTFT Cohorts)*
No Attributes 2+ Attributes Overall Did not work 9,600 55.2% 1,749 41.1% 15,075 51.9% 1 Year 2,590 14.9% 615 14.5% 4,226 14.5% 2 Years 2,211 12.7% 579 13.6% 3,773 13.0% 3 Years 1,815 10.4% 602 14.1% 3,300 11.4% 4 Years 1,160 6.7% 711 16.7% 2,676 9.2%
*Limited to students who persisted to the end of their fourth spring term Overall, just over half (52%) of students did not work at all during their undergraduate career. About 15% worked one year, 13% worked 2 years, 11% worked 3 years, and 9% worked all four years. Students with two or more attributes were the most likely to work one or more years during their undergraduate career. Students without any attributes were the least likely to have worked; 55% did not work, compared to 41% of students with two or more attributes (14 PP). The largest gap in proportion of years worked exists between groups at 4 years; 7% of students without attributes worked all 4 years, compared to almost 17% of students with two or more attributes (10 PP).
0
50
100
150
200
250
300
350
1 2 3 4 5 6 7 8 9 10 11 12 13 14 15 16 17 18 19 20 21 22 23 24 25 26 27 28 29 30
Head
coun
t
Avg Weekly Hours Worked
First Year Continuing
CSU | Institutional Research, Planning & Effectiveness
April 2020 Campus Work and Success 6
Persistence and Graduation This section explores the association between hours worked and persistence/graduation by number of underserved attributes. Statistical models allow for comparison of any differential effects associated with attribute category (no attributes vs. two or more). In general, working has a small positive association with student success and time to graduation, regardless of number of attributes. The magnitude of this association is slightly larger among students with multiple underserved identities.
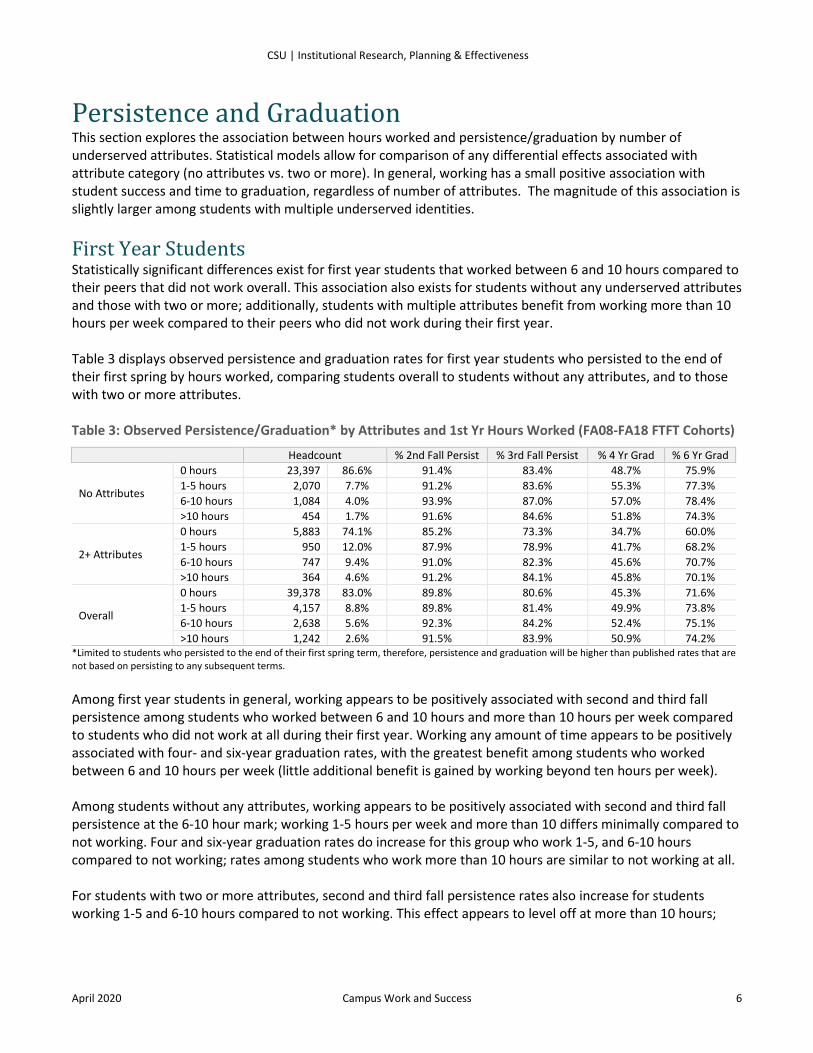
First Year Students Statistically significant differences exist for first year students that worked between 6 and 10 hours compared to their peers that did not work overall. This association also exists for students without any underserved attributes and those with two or more; additionally, students with multiple attributes benefit from working more than 10 hours per week compared to their peers who did not work during their first year. Table 3 displays observed persistence and graduation rates for first year students who persisted to the end of their first spring by hours worked, comparing students overall to students without any attributes, and to those with two or more attributes. Table 3: Observed Persistence/Graduation* by Attributes and 1st Yr Hours Worked (FA08-FA18 FTFT Cohorts)
Headcount % 2nd Fall Persist % 3rd Fall Persist % 4 Yr Grad % 6 Yr Grad
No Attributes
0 hours 23,397 86.6% 91.4% 83.4% 48.7% 75.9% 1-5 hours 2,070 7.7% 91.2% 83.6% 55.3% 77.3% 6-10 hours 1,084 4.0% 93.9% 87.0% 57.0% 78.4% >10 hours 454 1.7% 91.6% 84.6% 51.8% 74.3%
2+ Attributes
0 hours 5,883 74.1% 85.2% 73.3% 34.7% 60.0% 1-5 hours 950 12.0% 87.9% 78.9% 41.7% 68.2% 6-10 hours 747 9.4% 91.0% 82.3% 45.6% 70.7% >10 hours 364 4.6% 91.2% 84.1% 45.8% 70.1%
Overall
0 hours 39,378 83.0% 89.8% 80.6% 45.3% 71.6% 1-5 hours 4,157 8.8% 89.8% 81.4% 49.9% 73.8% 6-10 hours 2,638 5.6% 92.3% 84.2% 52.4% 75.1% >10 hours 1,242 2.6% 91.5% 83.9% 50.9% 74.2%
*Limited to students who persisted to the end of their first spring term, therefore, persistence and graduation will be higher than published rates that are not based on persisting to any subsequent terms. Among first year students in general, working appears to be positively associated with second and third fall persistence among students who worked between 6 and 10 hours and more than 10 hours per week compared to students who did not work at all during their first year. Working any amount of time appears to be positively associated with four- and six-year graduation rates, with the greatest benefit among students who worked between 6 and 10 hours per week (little additional benefit is gained by working beyond ten hours per week). Among students without any attributes, working appears to be positively associated with second and third fall persistence at the 6-10 hour mark; working 1-5 hours per week and more than 10 differs minimally compared to not working. Four and six-year graduation rates do increase for this group who work 1-5, and 6-10 hours compared to not working; rates among students who work more than 10 hours are similar to not working at all. For students with two or more attributes, second and third fall persistence rates also increase for students working 1-5 and 6-10 hours compared to not working. This effect appears to level off at more than 10 hours;
CSU | Institutional Research, Planning & Effectiveness
April 2020 Campus Work and Success 7
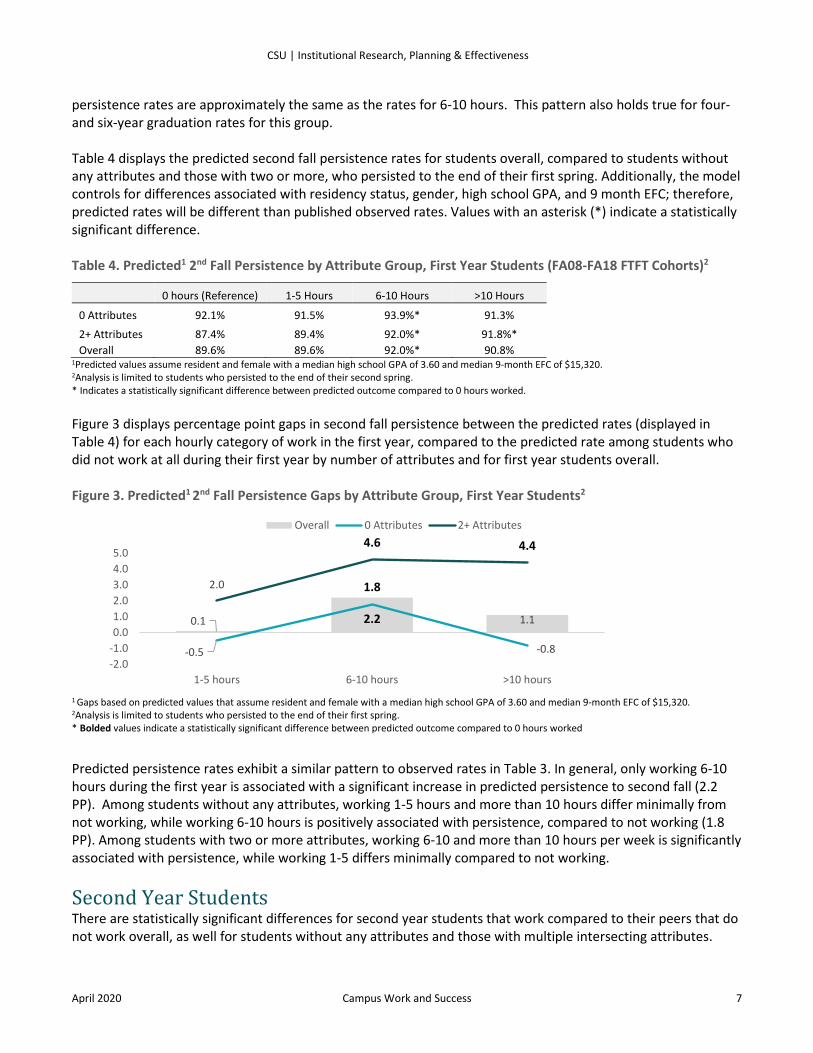
persistence rates are approximately the same as the rates for 6-10 hours. This pattern also holds true for four- and six-year graduation rates for this group. Table 4 displays the predicted second fall persistence rates for students overall, compared to students without any attributes and those with two or more, who persisted to the end of their first spring. Additionally, the model controls for differences associated with residency status, gender, high school GPA, and 9 month EFC; therefore, predicted rates will be different than published observed rates. Values with an asterisk (*) indicate a statistically significant difference. Table 4. Predicted1 2nd Fall Persistence by Attribute Group, First Year Students (FA08-FA18 FTFT Cohorts)2
0 hours (Reference) 1-5 Hours 6-10 Hours >10 Hours
0 Attributes 92.1% 91.5% 93.9%* 91.3%
2+ Attributes 87.4% 89.4% 92.0%* 91.8%* Overall 89.6% 89.6% 92.0%* 90.8%
1Predicted values assume resident and female with a median high school GPA of 3.60 and median 9-month EFC of $15,320. 2Analysis is limited to students who persisted to the end of their second spring. * Indicates a statistically significant difference between predicted outcome compared to 0 hours worked. Figure 3 displays percentage point gaps in second fall persistence between the predicted rates (displayed in Table 4) for each hourly category of work in the first year, compared to the predicted rate among students who did not work at all during their first year by number of attributes and for first year students overall. Figure 3. Predicted1 2nd Fall Persistence Gaps by Attribute Group, First Year Students2
1 Gaps based on predicted values that assume resident and female with a median high school GPA of 3.60 and median 9-month EFC of $15,320. 2Analysis is limited to students who persisted to the end of their first spring. * Bolded values indicate a statistically significant difference between predicted outcome compared to 0 hours worked
Predicted persistence rates exhibit a similar pattern to observed rates in Table 3. In general, only working 6-10 hours during the first year is associated with a significant increase in predicted persistence to second fall (2.2 PP). Among students without any attributes, working 1-5 hours and more than 10 hours differ minimally from not working, while working 6-10 hours is positively associated with persistence, compared to not working (1.8 PP). Among students with two or more attributes, working 6-10 and more than 10 hours per week is significantly associated with persistence, while working 1-5 differs minimally compared to not working.
Second Year Students There are statistically significant differences for second year students that work compared to their peers that do not work overall, as well for students without any attributes and those with multiple intersecting attributes.
0.1 2.2 1.1
-0.5
1.8
-0.8
2.0
4.6 4.4
-2.0-1.00.01.02.03.04.05.0
1-5 hours 6-10 hours >10 hours
Overall 0 Attributes 2+ Attributes

CSU | Institutional Research, Planning & Effectiveness
April 2020 Campus Work and Success 8
Table 5 displays the observed success outcomes for second year students who persisted to the end of their second spring by attribute group and average number of hours worked per week. Table 5: Observed Success Outcomes1 by Attributes and 2nd Yr Hours Worked (FA08-FA17 FTFT Cohorts)
Headcount % 3rd Fall Persist % 4 Yr Grad % 6 Yr Grad
No Attributes
0 hours 18,195 76.5% 93.8% 53.9% 84.9% 1-5 hours 2,270 9.5% 96.6% 62.8% 89.4% 6-10 hours 1,925 8.1% 96.5% 65.4% 91.0% >10 hours 1,387 5.8% 95.7% 63.9% 90.3%
2+ Attributes
0 hours 4,053 63.7% 91.1% 41.6% 73.8% 1-5 hours 693 10.9% 94.6% 48.1% 77.4% 6-10 hours 816 12.8% 95.3% 55.4% 83.1% >10 hours 804 12.6% 95.3% 55.0% 83.0%
Overall
0 hours 29,644 73.0% 93.1% 51.4% 82.4% 1-5 hours 4,009 9.9% 95.7% 58.7% 86.5% 6-10 hours 3,808 9.4% 96.2% 62.4% 88.5% >10 hours 3,125 7.7% 95.3% 61.1% 86.9%
1Limited to students who persisted to the end of their second spring term, therefore, persistence and graduation will be higher than published rates that are not based on persisting to any subsequent terms. Among second year student workers overall, persistence and graduation rates are higher among students who worked any amount compared to students who did not. Third fall persistence rates are about 3 PP higher among students who worked at each hourly interval compared to non-workers. Four-year graduation rates increase by about 7 PP at 1-5 hours; 11 PP at 6-10 hours, and by 10 PP at more than 10 hours per week compared to the rate for non-workers (51%). Six-year graduation rates increase by 4 PP at 1-5 hours, 6 PP at 6-10, and by almost 5 PP at more than 10 hours compared to the rate for non-workers (82%). Among students without any attributes, persistence to third fall increases slightly for students working 1-5, 6-10, and more than 10 hours per week compared to not working. For each hourly category above 0, persistence is approximately equal at about 95%. Four-year graduation rates increase from 54% at 0 hours worked to 63% at 1-5 hours (9 PP), increase slightly to 65% for 6-10 hours, and drop by about 1 PP for more than 10 hours (64%). Six-year graduation rates also exhibit a similar pattern in that the rate increases for students working 1-5 hours by about 4 PP (85% to 89%), increases slightly for students working between 6 and 10 hours (91%), and drops by about 1 PP at 10 hours or more (90%). Among students with two or more attributes, persistence to third fall increases by about 3 PP (91% to about 95%) for working students compared to non-working students; their persistence rate changes minimally across hourly categories. Four-year graduation rates increase among students who work 1-5 hours by about 6 PP compared to students who did not work (42% to 48%), increases again for students working 6-10 hours (55%), and remains at this level for students working more than 10 hours per week. Six-year graduation rates follow a similar pattern; increasing from 74% among students working 0 hours to 77% for students working 1-5 hours (3PP), to 83% at 6-10 hours (10 PP compared to 0 hours), and remaining at 83% for those working more than 10 hours per week. Table 6 displays predicted third fall persistence rates by attribute group and hours worked. For complete model results, see Appendix Tables 11 through 13.
CSU | Institutional Research, Planning & Effectiveness
April 2020 Campus Work and Success 9
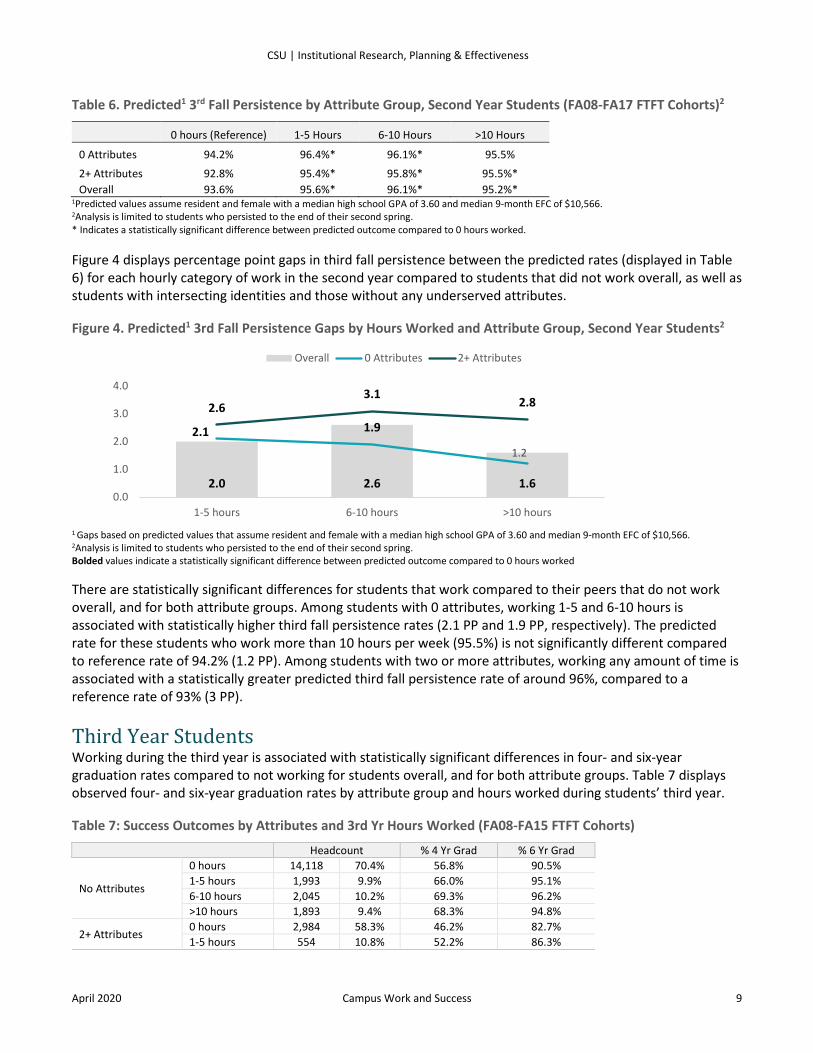
Table 6. Predicted1 3rd Fall Persistence by Attribute Group, Second Year Students (FA08-FA17 FTFT Cohorts)2
0 hours (Reference) 1-5 Hours 6-10 Hours >10 Hours
0 Attributes 94.2% 96.4%* 96.1%* 95.5%
2+ Attributes 92.8% 95.4%* 95.8%* 95.5%* Overall 93.6% 95.6%* 96.1%* 95.2%*
1Predicted values assume resident and female with a median high school GPA of 3.60 and median 9-month EFC of $10,566. 2Analysis is limited to students who persisted to the end of their second spring. * Indicates a statistically significant difference between predicted outcome compared to 0 hours worked. Figure 4 displays percentage point gaps in third fall persistence between the predicted rates (displayed in Table 6) for each hourly category of work in the second year compared to students that did not work overall, as well as students with intersecting identities and those without any underserved attributes. Figure 4. Predicted1 3rd Fall Persistence Gaps by Hours Worked and Attribute Group, Second Year Students2
1 Gaps based on predicted values that assume resident and female with a median high school GPA of 3.60 and median 9-month EFC of $10,566. 2Analysis is limited to students who persisted to the end of their second spring. Bolded values indicate a statistically significant difference between predicted outcome compared to 0 hours worked There are statistically significant differences for students that work compared to their peers that do not work overall, and for both attribute groups. Among students with 0 attributes, working 1-5 and 6-10 hours is associated with statistically higher third fall persistence rates (2.1 PP and 1.9 PP, respectively). The predicted rate for these students who work more than 10 hours per week (95.5%) is not significantly different compared to reference rate of 94.2% (1.2 PP). Among students with two or more attributes, working any amount of time is associated with a statistically greater predicted third fall persistence rate of around 96%, compared to a reference rate of 93% (3 PP).
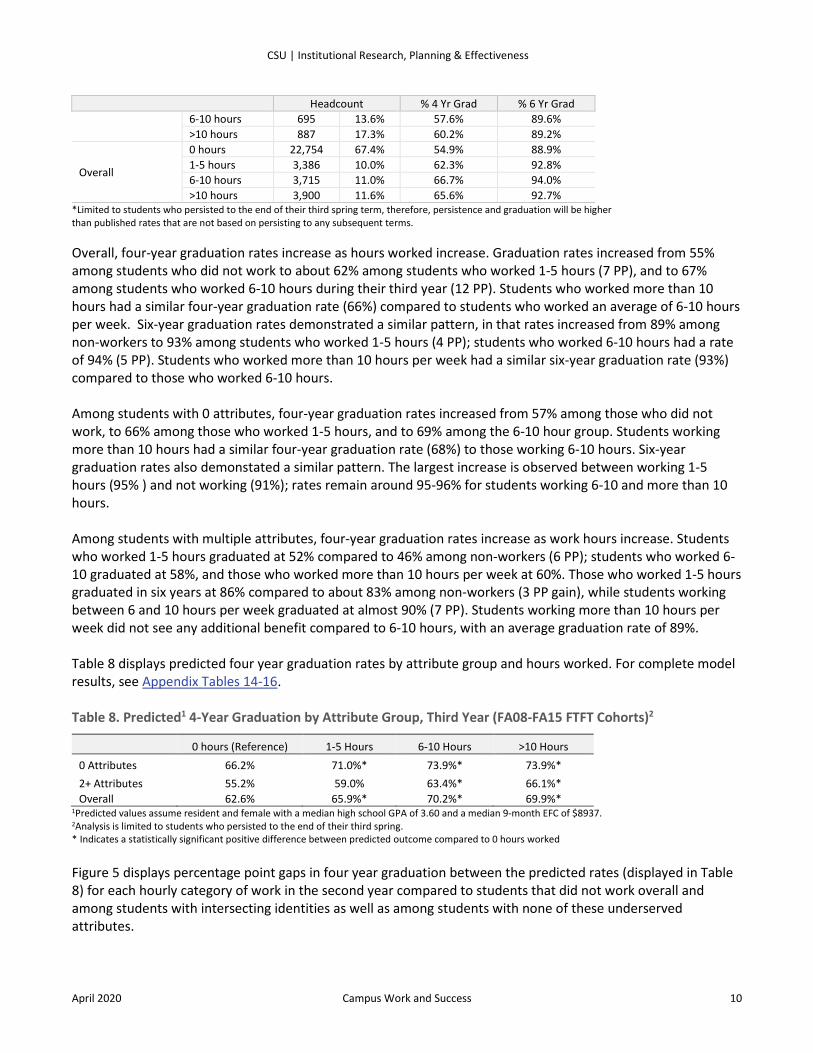
Third Year Students Working during the third year is associated with statistically significant differences in four- and six-year graduation rates compared to not working for students overall, and for both attribute groups. Table 7 displays observed four- and six-year graduation rates by attribute group and hours worked during students’ third year. Table 7: Success Outcomes by Attributes and 3rd Yr Hours Worked (FA08-FA15 FTFT Cohorts)
Headcount % 4 Yr Grad % 6 Yr Grad
No Attributes
0 hours 14,118 70.4% 56.8% 90.5% 1-5 hours 1,993 9.9% 66.0% 95.1% 6-10 hours 2,045 10.2% 69.3% 96.2% >10 hours 1,893 9.4% 68.3% 94.8%
2+ Attributes 0 hours 2,984 58.3% 46.2% 82.7% 1-5 hours 554 10.8% 52.2% 86.3%
2.0 2.6 1.6
2.1 1.9
1.2
2.63.1 2.8
0.0
1.0
2.0
3.0
4.0
1-5 hours 6-10 hours >10 hours
Overall 0 Attributes 2+ Attributes
CSU | Institutional Research, Planning & Effectiveness
April 2020 Campus Work and Success 10
Headcount % 4 Yr Grad % 6 Yr Grad 6-10 hours 695 13.6% 57.6% 89.6% >10 hours 887 17.3% 60.2% 89.2%
Overall
0 hours 22,754 67.4% 54.9% 88.9% 1-5 hours 3,386 10.0% 62.3% 92.8% 6-10 hours 3,715 11.0% 66.7% 94.0% >10 hours 3,900 11.6% 65.6% 92.7%
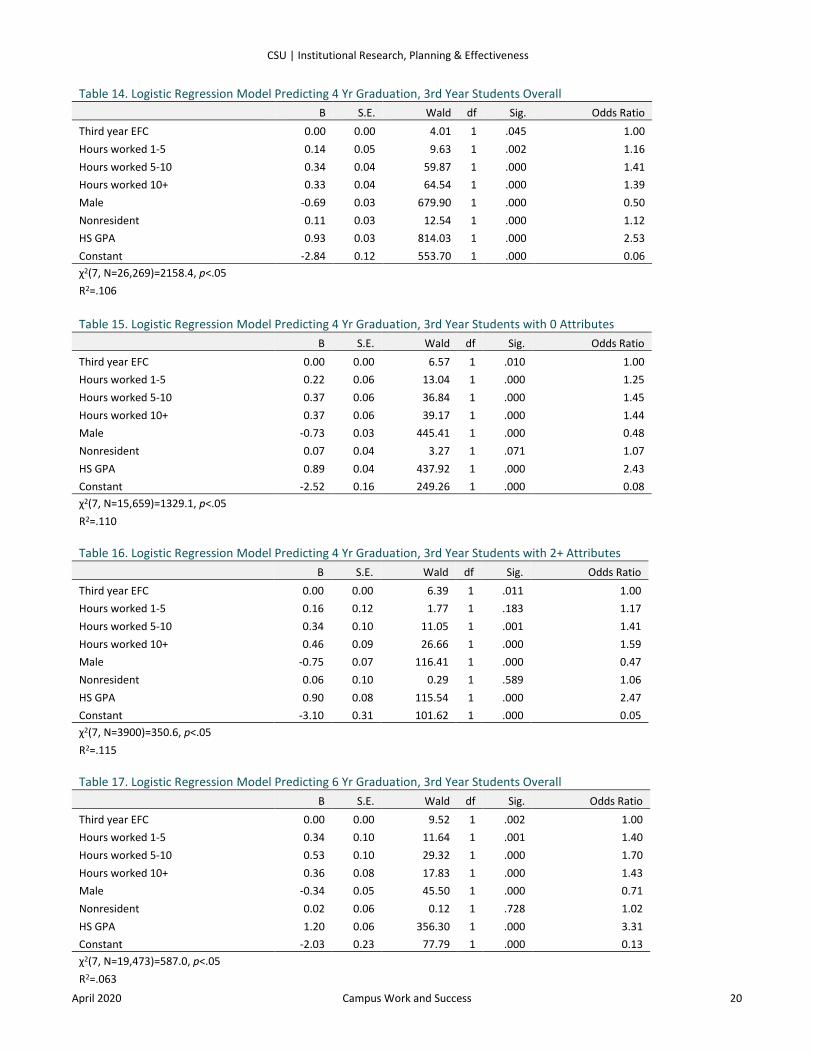
*Limited to students who persisted to the end of their third spring term, therefore, persistence and graduation will be higher than published rates that are not based on persisting to any subsequent terms. Overall, four-year graduation rates increase as hours worked increase. Graduation rates increased from 55% among students who did not work to about 62% among students who worked 1-5 hours (7 PP), and to 67% among students who worked 6-10 hours during their third year (12 PP). Students who worked more than 10 hours had a similar four-year graduation rate (66%) compared to students who worked an average of 6-10 hours per week. Six-year graduation rates demonstrated a similar pattern, in that rates increased from 89% among non-workers to 93% among students who worked 1-5 hours (4 PP); students who worked 6-10 hours had a rate of 94% (5 PP). Students who worked more than 10 hours per week had a similar six-year graduation rate (93%) compared to those who worked 6-10 hours. Among students with 0 attributes, four-year graduation rates increased from 57% among those who did not work, to 66% among those who worked 1-5 hours, and to 69% among the 6-10 hour group. Students working more than 10 hours had a similar four-year graduation rate (68%) to those working 6-10 hours. Six-year graduation rates also demonstated a similar pattern. The largest increase is observed between working 1-5 hours (95% ) and not working (91%); rates remain around 95-96% for students working 6-10 and more than 10 hours. Among students with multiple attributes, four-year graduation rates increase as work hours increase. Students who worked 1-5 hours graduated at 52% compared to 46% among non-workers (6 PP); students who worked 6-10 graduated at 58%, and those who worked more than 10 hours per week at 60%. Those who worked 1-5 hours graduated in six years at 86% compared to about 83% among non-workers (3 PP gain), while students working between 6 and 10 hours per week graduated at almost 90% (7 PP). Students working more than 10 hours per week did not see any additional benefit compared to 6-10 hours, with an average graduation rate of 89%. Table 8 displays predicted four year graduation rates by attribute group and hours worked. For complete model results, see Appendix Tables 14-16. Table 8. Predicted1 4-Year Graduation by Attribute Group, Third Year (FA08-FA15 FTFT Cohorts)2
0 hours (Reference) 1-5 Hours 6-10 Hours >10 Hours 0 Attributes 66.2% 71.0%* 73.9%* 73.9%* 2+ Attributes 55.2% 59.0% 63.4%* 66.1%* Overall 62.6% 65.9%* 70.2%* 69.9%*
1Predicted values assume resident and female with a median high school GPA of 3.60 and a median 9-month EFC of $8937. 2Analysis is limited to students who persisted to the end of their third spring. * Indicates a statistically significant positive difference between predicted outcome compared to 0 hours worked Figure 5 displays percentage point gaps in four year graduation between the predicted rates (displayed in Table 8) for each hourly category of work in the second year compared to students that did not work overall and among students with intersecting identities as well as among students with none of these underserved attributes.
CSU | Institutional Research, Planning & Effectiveness
April 2020 Campus Work and Success 11
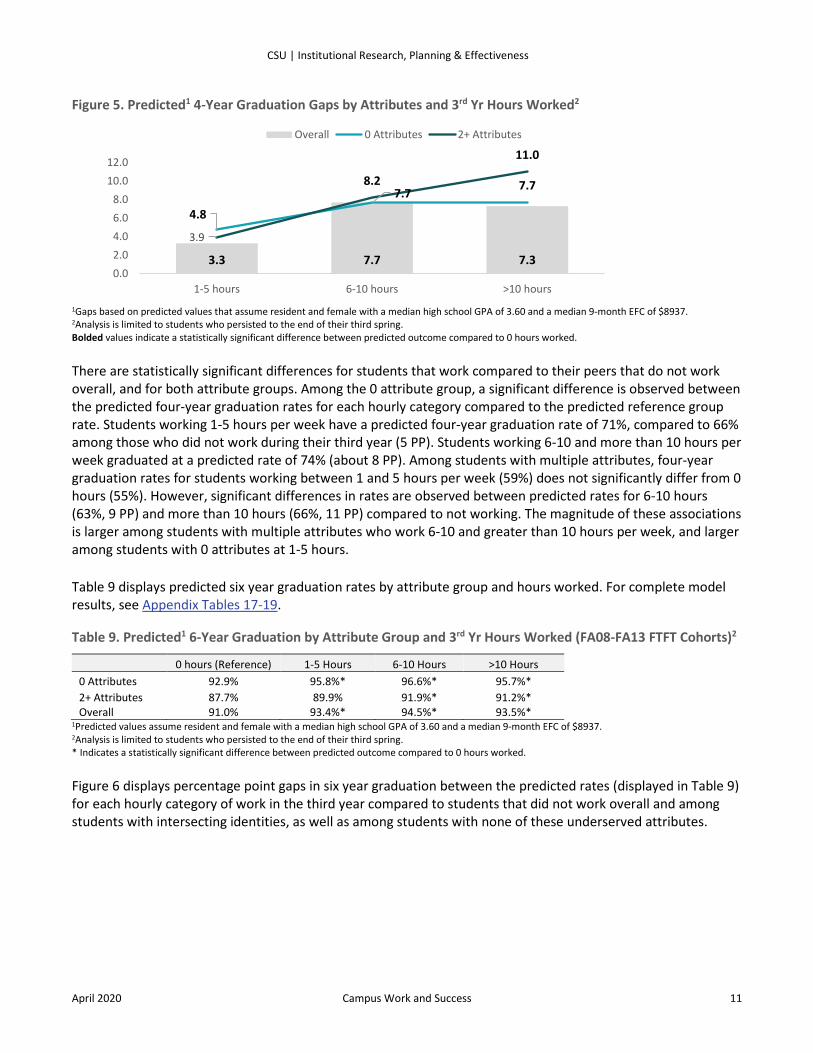
Figure 5. Predicted1 4-Year Graduation Gaps by Attributes and 3rd Yr Hours Worked2
1Gaps based on predicted values that assume resident and female with a median high school GPA of 3.60 and a median 9-month EFC of $8937. 2Analysis is limited to students who persisted to the end of their third spring. Bolded values indicate a statistically significant difference between predicted outcome compared to 0 hours worked.
There are statistically significant differences for students that work compared to their peers that do not work overall, and for both attribute groups. Among the 0 attribute group, a significant difference is observed between the predicted four-year graduation rates for each hourly category compared to the predicted reference group rate. Students working 1-5 hours per week have a predicted four-year graduation rate of 71%, compared to 66% among those who did not work during their third year (5 PP). Students working 6-10 and more than 10 hours per week graduated at a predicted rate of 74% (about 8 PP). Among students with multiple attributes, four-year graduation rates for students working between 1 and 5 hours per week (59%) does not significantly differ from 0 hours (55%). However, significant differences in rates are observed between predicted rates for 6-10 hours (63%, 9 PP) and more than 10 hours (66%, 11 PP) compared to not working. The magnitude of these associations is larger among students with multiple attributes who work 6-10 and greater than 10 hours per week, and larger among students with 0 attributes at 1-5 hours. Table 9 displays predicted six year graduation rates by attribute group and hours worked. For complete model results, see Appendix Tables 17-19. Table 9. Predicted1 6-Year Graduation by Attribute Group and 3rd Yr Hours Worked (FA08-FA13 FTFT Cohorts)2
0 hours (Reference) 1-5 Hours 6-10 Hours >10 Hours 0 Attributes 92.9% 95.8%* 96.6%* 95.7%* 2+ Attributes 87.7% 89.9% 91.9%* 91.2%* Overall 91.0% 93.4%* 94.5%* 93.5%*
1Predicted values assume resident and female with a median high school GPA of 3.60 and a median 9-month EFC of $8937. 2Analysis is limited to students who persisted to the end of their third spring. * Indicates a statistically significant difference between predicted outcome compared to 0 hours worked. Figure 6 displays percentage point gaps in six year graduation between the predicted rates (displayed in Table 9) for each hourly category of work in the third year compared to students that did not work overall and among students with intersecting identities, as well as among students with none of these underserved attributes.
3.3 7.7 7.3
4.8
7.7 7.7
3.9
8.2
11.0
0.02.04.06.08.0
10.012.0
1-5 hours 6-10 hours >10 hours
Overall 0 Attributes 2+ Attributes
CSU | Institutional Research, Planning & Effectiveness
April 2020 Campus Work and Success 12
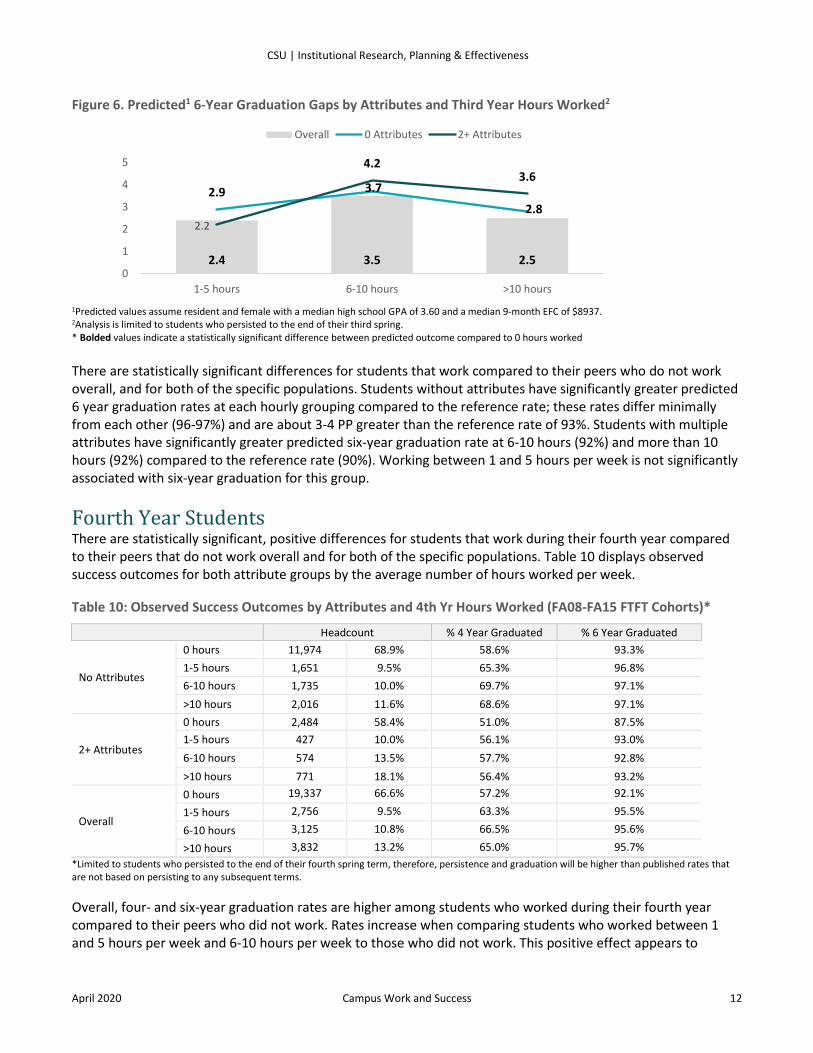
Figure 6. Predicted1 6-Year Graduation Gaps by Attributes and Third Year Hours Worked2
1Predicted values assume resident and female with a median high school GPA of 3.60 and a median 9-month EFC of $8937. 2Analysis is limited to students who persisted to the end of their third spring. * Bolded values indicate a statistically significant difference between predicted outcome compared to 0 hours worked There are statistically significant differences for students that work compared to their peers who do not work overall, and for both of the specific populations. Students without attributes have significantly greater predicted 6 year graduation rates at each hourly grouping compared to the reference rate; these rates differ minimally from each other (96-97%) and are about 3-4 PP greater than the reference rate of 93%. Students with multiple attributes have significantly greater predicted six-year graduation rate at 6-10 hours (92%) and more than 10 hours (92%) compared to the reference rate (90%). Working between 1 and 5 hours per week is not significantly associated with six-year graduation for this group.
Fourth Year Students There are statistically significant, positive differences for students that work during their fourth year compared to their peers that do not work overall and for both of the specific populations. Table 10 displays observed success outcomes for both attribute groups by the average number of hours worked per week. Table 10: Observed Success Outcomes by Attributes and 4th Yr Hours Worked (FA08-FA15 FTFT Cohorts)*
Headcount % 4 Year Graduated % 6 Year Graduated
No Attributes
0 hours 11,974 68.9% 58.6% 93.3% 1-5 hours 1,651 9.5% 65.3% 96.8% 6-10 hours 1,735 10.0% 69.7% 97.1% >10 hours 2,016 11.6% 68.6% 97.1%
2+ Attributes
0 hours 2,484 58.4% 51.0% 87.5% 1-5 hours 427 10.0% 56.1% 93.0% 6-10 hours 574 13.5% 57.7% 92.8% >10 hours 771 18.1% 56.4% 93.2%
Overall
0 hours 19,337 66.6% 57.2% 92.1%
1-5 hours 2,756 9.5% 63.3% 95.5%
6-10 hours 3,125 10.8% 66.5% 95.6%
>10 hours 3,832 13.2% 65.0% 95.7% *Limited to students who persisted to the end of their fourth spring term, therefore, persistence and graduation will be higher than published rates that are not based on persisting to any subsequent terms. Overall, four- and six-year graduation rates are higher among students who worked during their fourth year compared to their peers who did not work. Rates increase when comparing students who worked between 1 and 5 hours per week and 6-10 hours per week to those who did not work. This positive effect appears to
2.4 3.5 2.5
2.9 3.7
2.82.2
4.23.6
0
1
2
3
4
5
1-5 hours 6-10 hours >10 hours
Overall 0 Attributes 2+ Attributes

CSU | Institutional Research, Planning & Effectiveness
April 2020 Campus Work and Success 13
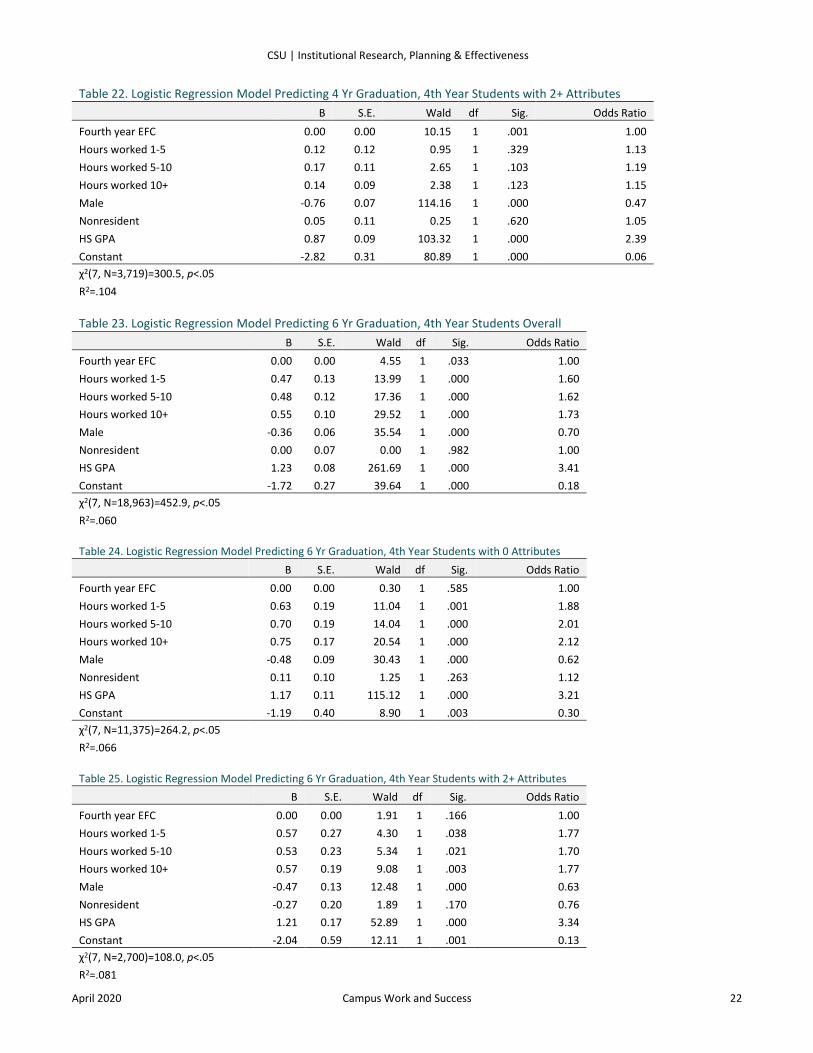
plateau at 6-10 hours per week; rates do not increase among students who work more than 10 hours compared to 6-10 hours. Among students without any attributes, four-year graduation rates are higher among students who worked between 1 and 5 hours (65%), 6-10 hours (70%), and more than 10 hours per week (69%) compared to students who did not work (59%) during their fourth year. The gap in success is largest for students who worked between 6 and 10 hours per week (10 PP) compared to those who did not work. Six-year graduation rates for this group differ minimally by hours worked; 97% of all student workers graduated in 6 years, compared to about 93% of students who did not work (4 PP). Among students with multiple attributes, graduation rates are higher for student who worked at each time block compared to students who did not work at all during their fourth year. Students who worked 1-5 hours per week graduated at 56% compared to 51% of non-workers (5 PP), students who worked 6-10 graduated at 58% (7 PP), and those who worked over 10 hours per week graduated at 56% (5 PP). Six-year graduation rates differ minimally by hours worked; 93% of student workers graduated in 6 years regardless of hourly grouping, compared to about 88% of non-workers (5 PP). Table 11 displays predicted four year graduation rates by attribute group and hours worked. For complete model results, see Appendix Tables 20-22. Table 11. Predicted1 4-Year Graduation by Attributes and 4th Yr Hours Worked (FA08-FA15 FTFT Cohorts)2
0 hours (Reference) 1-5 Hours 6-10 Hours >10 Hours 0 Attributes 67.3% 70.0%* 74.0%* 74.0%* 2+ Attributes 59.4% 62.3% 63.5% 62.7% Overall 64.5% 66.8%* 70.0%* 69.5%*
1Predicted values assume resident and female with a median high school GPA of 3.60 and a median 9-month EFC of $7,654. 2Analysis is limited to students who persisted to the end of their fourth spring. * Indicates a statistically significant positive difference between predicted outcome compared to 0 hours worked Figure 7 displays percentage point gaps in six year graduation between the predicted rates (displayed in Table 11) for each hourly category of work in the fourth year compared to students that did not work overall, and among students with multiple and 0 intersecting identities. Figure 7. Predicted1 4 Yr Graduation Gaps by Attributes and 4th Year Hours Worked2
1Gaps based on predicted values that assume resident and female with a median high school GPA of 3.60 and a median 9-month EFC of $7,654. 2Analysis is limited to students who persisted to the end of their fourth spring. Bolded values indicate a statistically significant difference between the predicted outcome compared to 0 hours worked.
2.3 5.5 5.0
2.7
6.7 6.6
2.9
4.1 3.3
0
2
4
6
8
1-5 hours 6-10 hours >10 hours
Overall 0 Attributes 2+ Attributes
CSU | Institutional Research, Planning & Effectiveness
April 2020 Campus Work and Success 14
There are statistically significant differences for students that work compared to their peers that do not work overall and for students with 0 attributes. Students without attributes have significantly greater predicted 4 year graduation rates at each hourly grouping compared to the reference rate. Students who work between 1 and 5 hours per week have a predicted rate of 70%, compared to 67% among students who did not work (about 3 PP higher). Students who work between 6 and 10 and more than 10 hours per week have the same predicted graduation rate of 74%, about 7 PP higher than the reference group. Students with multiple attributes also have higher predicted four-year graduation rates at each hourly grouping compared to the reference rate, but these differences are not statistically significant. Students who work between 1 and 5 have a predicted rate of about 62%, compared to 59% among students who did not work (about 3 PP higher). Students who work between 6 and 10 and more than 10 hours per week have the same predicted graduation rate of 64% and 63%, respectively, which is about 3-4 PP higher than the reference group. Table 12 displays the predicted six-year graduation rates among fourth year students by attribute group. For complete model results, see Appendix Tables 23-25. Table 12. Predicted1 6-Year Graduation by Attributes and 4th Yr Hours Worked (FA08-FA13 FTFT Cohorts)2
0 hours (Reference) 1-5 Hours 6-10 Hours >10 Hours 0 Attributes 95.3% 97.4%* 97.6%* 97.7%* 2+ Attributes 91.3% 94.9%* 94.7%* 94.9%* Overall 93.8% 96.0%* 96.1%* 96.3%*
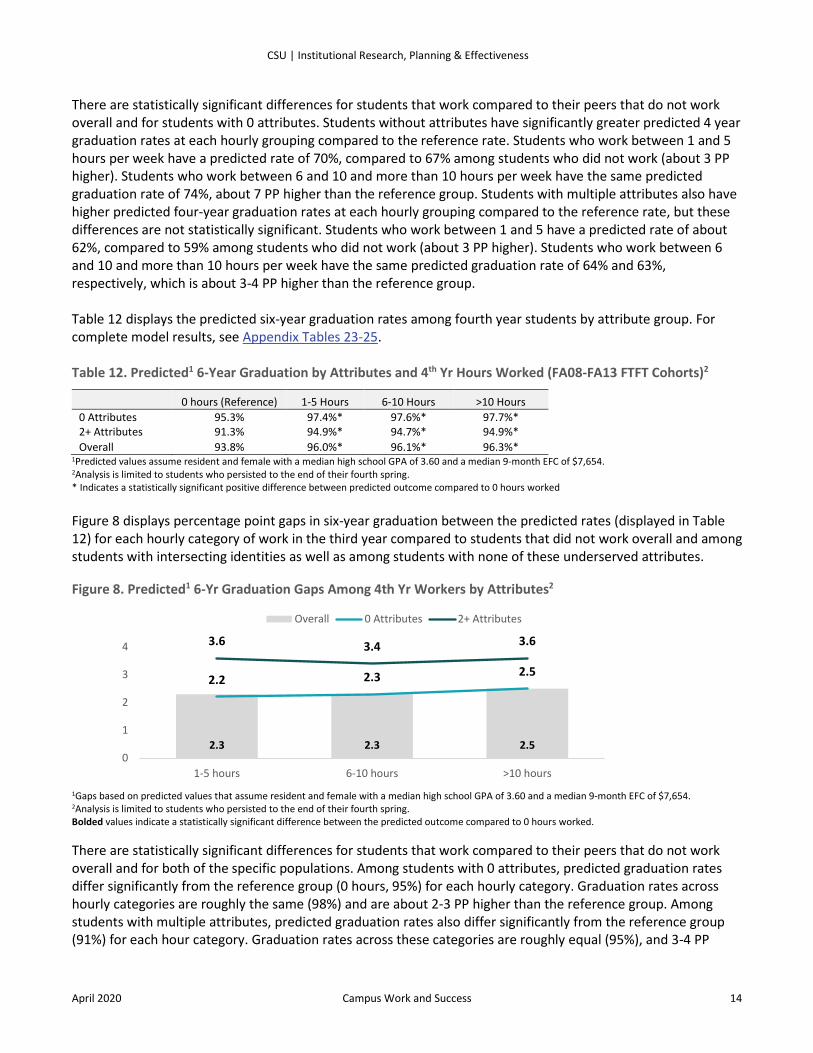
1Predicted values assume resident and female with a median high school GPA of 3.60 and a median 9-month EFC of $7,654. 2Analysis is limited to students who persisted to the end of their fourth spring. * Indicates a statistically significant positive difference between predicted outcome compared to 0 hours worked Figure 8 displays percentage point gaps in six-year graduation between the predicted rates (displayed in Table 12) for each hourly category of work in the third year compared to students that did not work overall and among students with intersecting identities as well as among students with none of these underserved attributes. Figure 8. Predicted1 6-Yr Graduation Gaps Among 4th Yr Workers by Attributes2
1Gaps based on predicted values that assume resident and female with a median high school GPA of 3.60 and a median 9-month EFC of $7,654. 2Analysis is limited to students who persisted to the end of their fourth spring. Bolded values indicate a statistically significant difference between the predicted outcome compared to 0 hours worked. There are statistically significant differences for students that work compared to their peers that do not work overall and for both of the specific populations. Among students with 0 attributes, predicted graduation rates differ significantly from the reference group (0 hours, 95%) for each hourly category. Graduation rates across hourly categories are roughly the same (98%) and are about 2-3 PP higher than the reference group. Among students with multiple attributes, predicted graduation rates also differ significantly from the reference group (91%) for each hour category. Graduation rates across these categories are roughly equal (95%), and 3-4 PP
2.3 2.3 2.5
2.2 2.3 2.5
3.6 3.4 3.6
0
1
2
3
4
1-5 hours 6-10 hours >10 hours
Overall 0 Attributes 2+ Attributes
CSU | Institutional Research, Planning & Effectiveness
April 2020 Campus Work and Success 15
higher compared to the reference group. The magnitude of these associations is largest among students with multiple attributes.
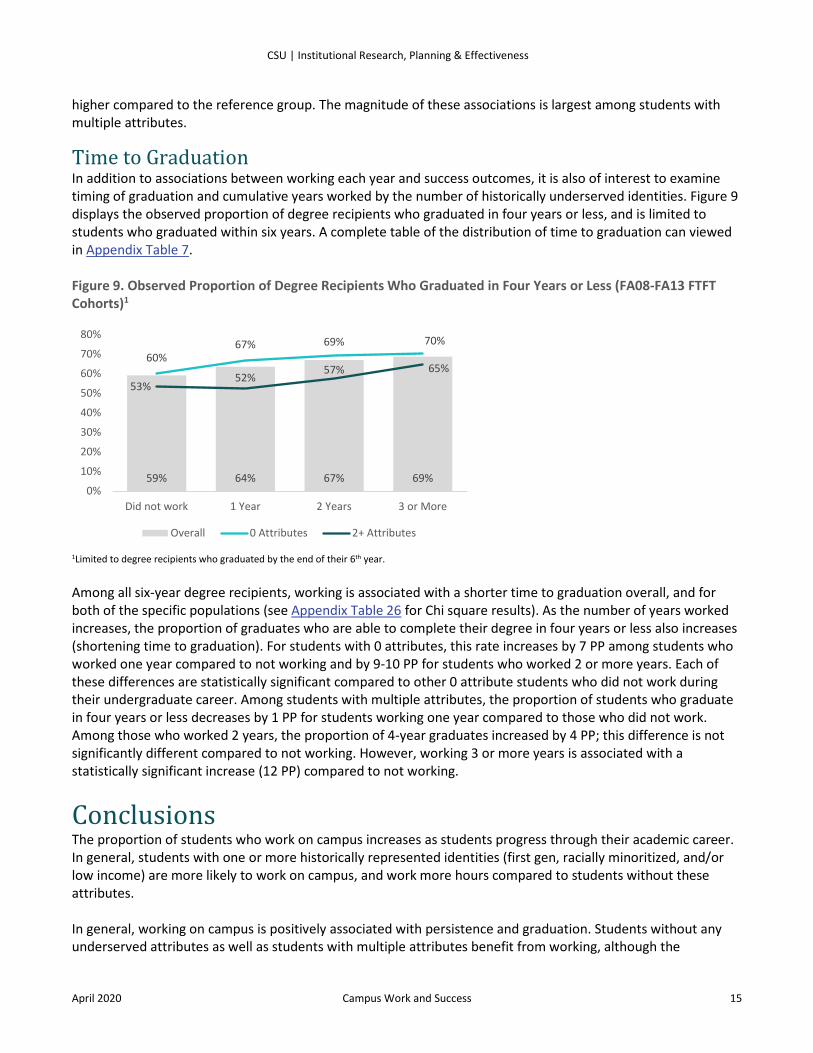
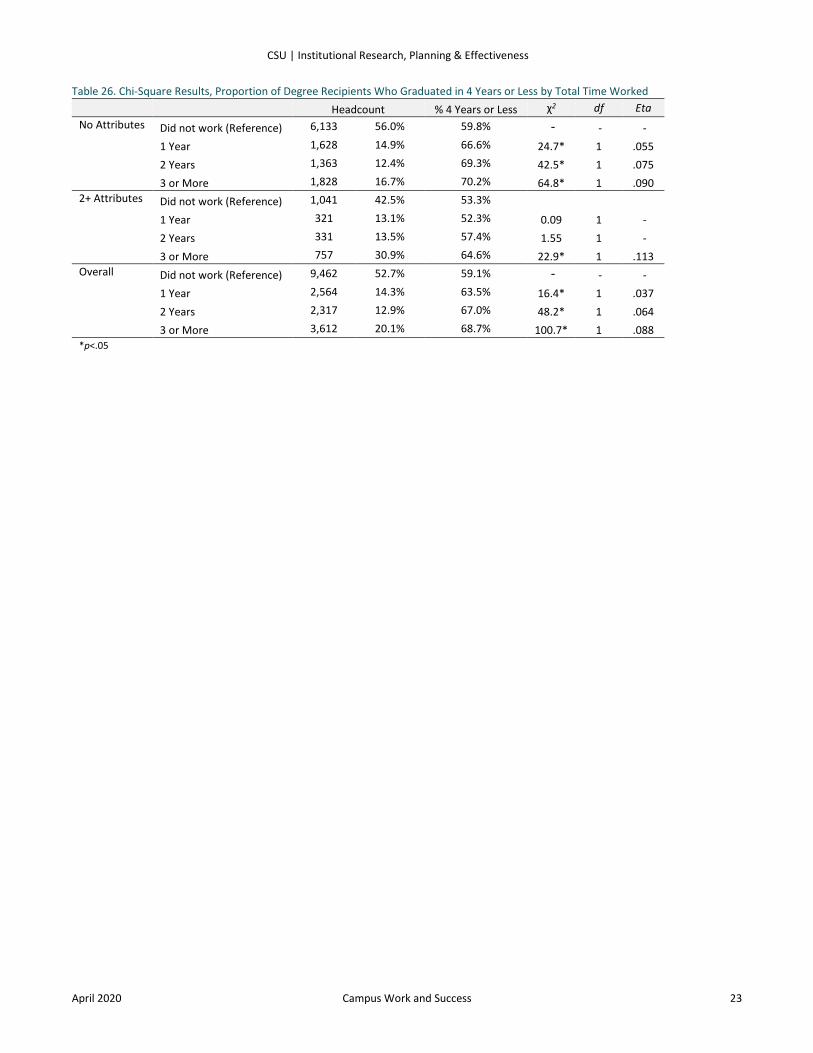
Time to Graduation In addition to associations between working each year and success outcomes, it is also of interest to examine timing of graduation and cumulative years worked by the number of historically underserved identities. Figure 9 displays the observed proportion of degree recipients who graduated in four years or less, and is limited to students who graduated within six years. A complete table of the distribution of time to graduation can viewed in Appendix Table 7. Figure 9. Observed Proportion of Degree Recipients Who Graduated in Four Years or Less (FA08-FA13 FTFT Cohorts)1
1Limited to degree recipients who graduated by the end of their 6th year. Among all six-year degree recipients, working is associated with a shorter time to graduation overall, and for both of the specific populations (see Appendix Table 26 for Chi square results). As the number of years worked increases, the proportion of graduates who are able to complete their degree in four years or less also increases (shortening time to graduation). For students with 0 attributes, this rate increases by 7 PP among students who worked one year compared to not working and by 9-10 PP for students who worked 2 or more years. Each of these differences are statistically significant compared to other 0 attribute students who did not work during their undergraduate career. Among students with multiple attributes, the proportion of students who graduate in four years or less decreases by 1 PP for students working one year compared to those who did not work. Among those who worked 2 years, the proportion of 4-year graduates increased by 4 PP; this difference is not significantly different compared to not working. However, working 3 or more years is associated with a statistically significant increase (12 PP) compared to not working.
Conclusions The proportion of students who work on campus increases as students progress through their academic career. In general, students with one or more historically represented identities (first gen, racially minoritized, and/or low income) are more likely to work on campus, and work more hours compared to students without these attributes. In general, working on campus is positively associated with persistence and graduation. Students without any underserved attributes as well as students with multiple attributes benefit from working, although the
59% 64% 67% 69%
60%67% 69% 70%
53%52%
57% 65%
0%
10%
20%
30%
40%
50%
60%
70%
80%
Did not work 1 Year 2 Years 3 or More
Overall 0 Attributes 2+ Attributes
CSU | Institutional Research, Planning & Effectiveness
April 2020 Campus Work and Success 16
magnitude of this association varies between groups and by number of hours worked. This positive association is observed regardless of when a student works during their undergraduate career. Overall, students with multiple attributes demonstrate a larger positive association between hours worked and persistence/graduation compared to students without any attributes. The magnitude of this association is strongest for multiple attribute students who work more than 5 hours per week. For both groups, the positive association between working and success plateaus between 6 and 10 hours per week. Students gain little additional benefit from working more than 10 hours per week, but in most cases, students are not negatively impacted for working more than 10 hours. Observed time to graduation suggests that among six-year degree recipients, working on campus is associated with a shorter time to degree. Students without any attributes experience this benefit from working just one year, while students with multiple attributes experience this benefit at three years or more. Working on campus is a promising behavior, with potential to support persistence and graduation across a student’s career, regardless of timing. This is an important finding for on campus employers, particularly those who offer positions in the 6 to 10 hours per week range. Similar to other co-curricular opportunities, working on campus can serve as another experience to support success for all students, particularly for those with underserved identities.
CSU | Institutional Research, Planning & Effectiveness
April 2020 Campus Work and Success 17
Appendix
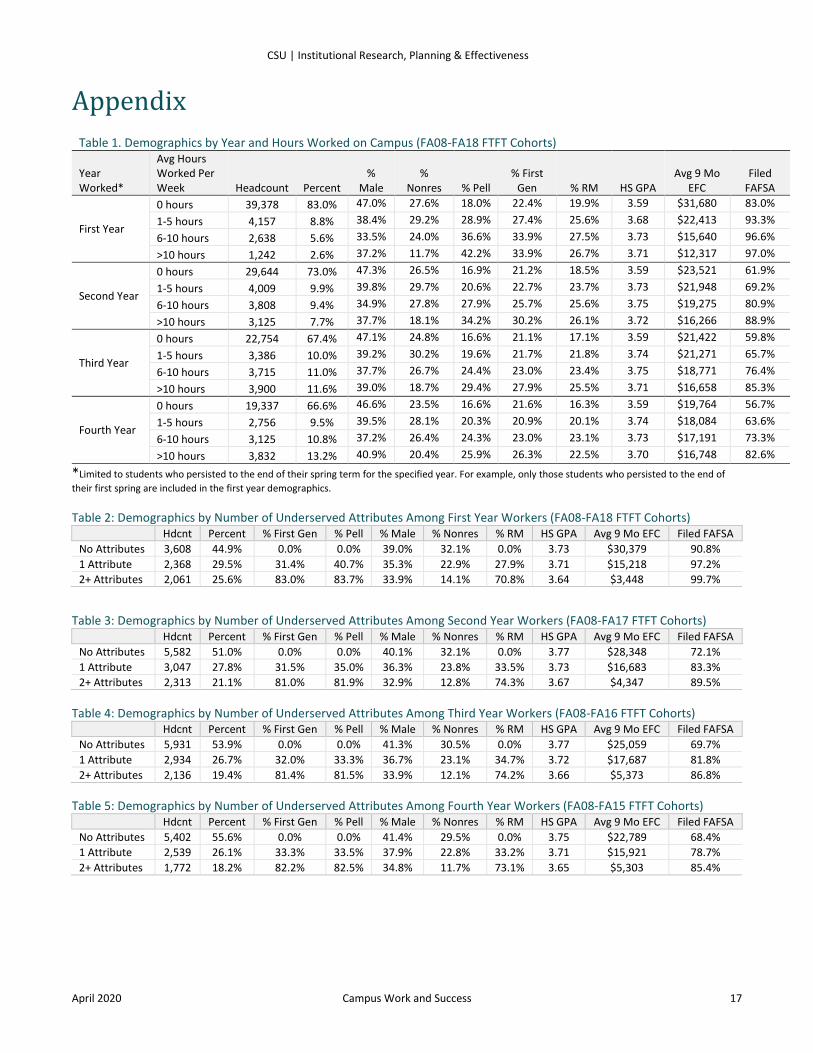
Table 1. Demographics by Year and Hours Worked on Campus (FA08-FA18 FTFT Cohorts) Year Worked*
Avg Hours Worked Per Week Headcount Percent
% Male
% Nonres % Pell
% First Gen % RM HS GPA
Avg 9 Mo EFC
Filed FAFSA
First Year
0 hours 39,378 83.0% 47.0% 27.6% 18.0% 22.4% 19.9% 3.59 $31,680 83.0% 1-5 hours 4,157 8.8% 38.4% 29.2% 28.9% 27.4% 25.6% 3.68 $22,413 93.3% 6-10 hours 2,638 5.6% 33.5% 24.0% 36.6% 33.9% 27.5% 3.73 $15,640 96.6% >10 hours 1,242 2.6% 37.2% 11.7% 42.2% 33.9% 26.7% 3.71 $12,317 97.0%
Second Year
0 hours 29,644 73.0% 47.3% 26.5% 16.9% 21.2% 18.5% 3.59 $23,521 61.9% 1-5 hours 4,009 9.9% 39.8% 29.7% 20.6% 22.7% 23.7% 3.73 $21,948 69.2% 6-10 hours 3,808 9.4% 34.9% 27.8% 27.9% 25.7% 25.6% 3.75 $19,275 80.9% >10 hours 3,125 7.7% 37.7% 18.1% 34.2% 30.2% 26.1% 3.72 $16,266 88.9%
Third Year
0 hours 22,754 67.4% 47.1% 24.8% 16.6% 21.1% 17.1% 3.59 $21,422 59.8% 1-5 hours 3,386 10.0% 39.2% 30.2% 19.6% 21.7% 21.8% 3.74 $21,271 65.7% 6-10 hours 3,715 11.0% 37.7% 26.7% 24.4% 23.0% 23.4% 3.75 $18,771 76.4% >10 hours 3,900 11.6% 39.0% 18.7% 29.4% 27.9% 25.5% 3.71 $16,658 85.3%
Fourth Year
0 hours 19,337 66.6% 46.6% 23.5% 16.6% 21.6% 16.3% 3.59 $19,764 56.7% 1-5 hours 2,756 9.5% 39.5% 28.1% 20.3% 20.9% 20.1% 3.74 $18,084 63.6% 6-10 hours 3,125 10.8% 37.2% 26.4% 24.3% 23.0% 23.1% 3.73 $17,191 73.3% >10 hours 3,832 13.2% 40.9% 20.4% 25.9% 26.3% 22.5% 3.70 $16,748 82.6%
*Limited to students who persisted to the end of their spring term for the specified year. For example, only those students who persisted to the end of their first spring are included in the first year demographics. Table 2: Demographics by Number of Underserved Attributes Among First Year Workers (FA08-FA18 FTFT Cohorts)
Hdcnt Percent % First Gen % Pell % Male % Nonres % RM HS GPA Avg 9 Mo EFC Filed FAFSA No Attributes 3,608 44.9% 0.0% 0.0% 39.0% 32.1% 0.0% 3.73 $30,379 90.8% 1 Attribute 2,368 29.5% 31.4% 40.7% 35.3% 22.9% 27.9% 3.71 $15,218 97.2% 2+ Attributes 2,061 25.6% 83.0% 83.7% 33.9% 14.1% 70.8% 3.64 $3,448 99.7%
Table 3: Demographics by Number of Underserved Attributes Among Second Year Workers (FA08-FA17 FTFT Cohorts)
Hdcnt Percent % First Gen % Pell % Male % Nonres % RM HS GPA Avg 9 Mo EFC Filed FAFSA No Attributes 5,582 51.0% 0.0% 0.0% 40.1% 32.1% 0.0% 3.77 $28,348 72.1% 1 Attribute 3,047 27.8% 31.5% 35.0% 36.3% 23.8% 33.5% 3.73 $16,683 83.3% 2+ Attributes 2,313 21.1% 81.0% 81.9% 32.9% 12.8% 74.3% 3.67 $4,347 89.5%
Table 4: Demographics by Number of Underserved Attributes Among Third Year Workers (FA08-FA16 FTFT Cohorts)
Hdcnt Percent % First Gen % Pell % Male % Nonres % RM HS GPA Avg 9 Mo EFC Filed FAFSA No Attributes 5,931 53.9% 0.0% 0.0% 41.3% 30.5% 0.0% 3.77 $25,059 69.7% 1 Attribute 2,934 26.7% 32.0% 33.3% 36.7% 23.1% 34.7% 3.72 $17,687 81.8% 2+ Attributes 2,136 19.4% 81.4% 81.5% 33.9% 12.1% 74.2% 3.66 $5,373 86.8%
Table 5: Demographics by Number of Underserved Attributes Among Fourth Year Workers (FA08-FA15 FTFT Cohorts)
Hdcnt Percent % First Gen % Pell % Male % Nonres % RM HS GPA Avg 9 Mo EFC Filed FAFSA No Attributes 5,402 55.6% 0.0% 0.0% 41.4% 29.5% 0.0% 3.75 $22,789 68.4% 1 Attribute 2,539 26.1% 33.3% 33.5% 37.9% 22.8% 33.2% 3.71 $15,921 78.7% 2+ Attributes 1,772 18.2% 82.2% 82.5% 34.8% 11.7% 73.1% 3.65 $5,303 85.4%
CSU | Institutional Research, Planning & Effectiveness
April 2020 Campus Work and Success 18
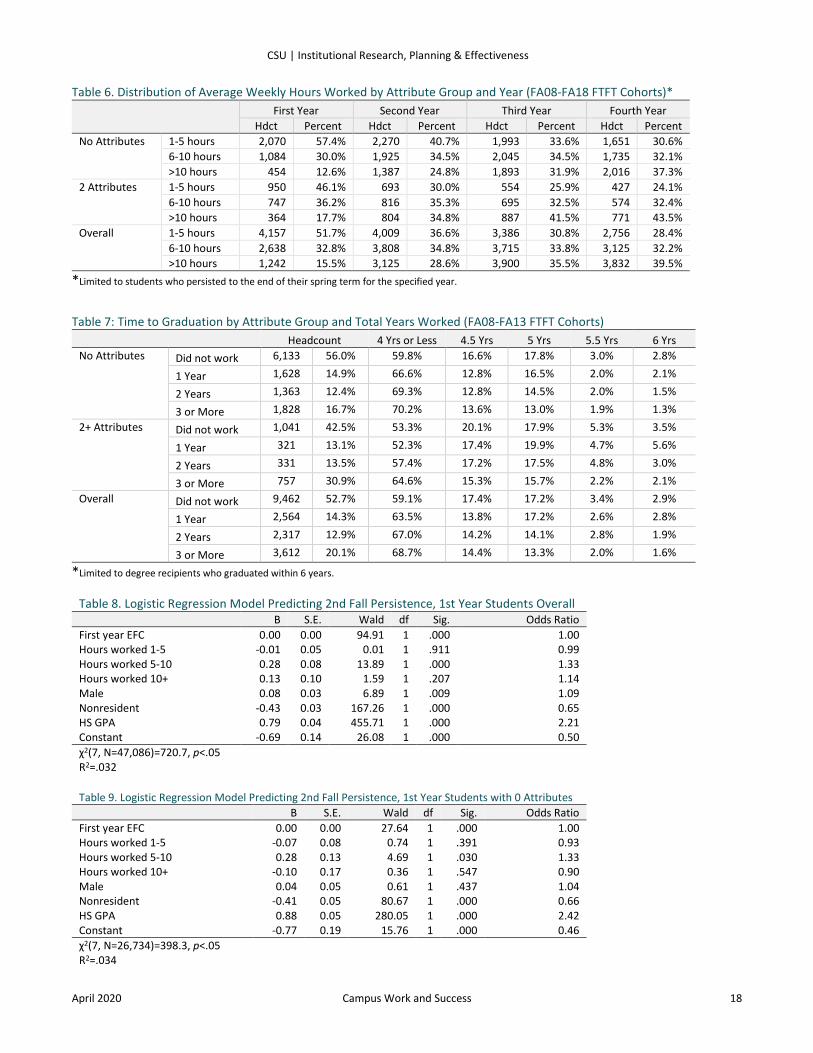
Table 6. Distribution of Average Weekly Hours Worked by Attribute Group and Year (FA08-FA18 FTFT Cohorts)*
First Year Second Year Third Year Fourth Year Hdct Percent Hdct Percent Hdct Percent Hdct Percent
No Attributes 1-5 hours 2,070 57.4% 2,270 40.7% 1,993 33.6% 1,651 30.6% 6-10 hours 1,084 30.0% 1,925 34.5% 2,045 34.5% 1,735 32.1% >10 hours 454 12.6% 1,387 24.8% 1,893 31.9% 2,016 37.3%
2 Attributes 1-5 hours 950 46.1% 693 30.0% 554 25.9% 427 24.1% 6-10 hours 747 36.2% 816 35.3% 695 32.5% 574 32.4% >10 hours 364 17.7% 804 34.8% 887 41.5% 771 43.5%
Overall 1-5 hours 4,157 51.7% 4,009 36.6% 3,386 30.8% 2,756 28.4% 6-10 hours 2,638 32.8% 3,808 34.8% 3,715 33.8% 3,125 32.2% >10 hours 1,242 15.5% 3,125 28.6% 3,900 35.5% 3,832 39.5%
*Limited to students who persisted to the end of their spring term for the specified year.
Table 7: Time to Graduation by Attribute Group and Total Years Worked (FA08-FA13 FTFT Cohorts) Headcount 4 Yrs or Less 4.5 Yrs 5 Yrs 5.5 Yrs 6 Yrs
No Attributes Did not work 6,133 56.0% 59.8% 16.6% 17.8% 3.0% 2.8%
1 Year 1,628 14.9% 66.6% 12.8% 16.5% 2.0% 2.1%
2 Years 1,363 12.4% 69.3% 12.8% 14.5% 2.0% 1.5%
3 or More 1,828 16.7% 70.2% 13.6% 13.0% 1.9% 1.3% 2+ Attributes Did not work 1,041 42.5% 53.3% 20.1% 17.9% 5.3% 3.5%
1 Year 321 13.1% 52.3% 17.4% 19.9% 4.7% 5.6%
2 Years 331 13.5% 57.4% 17.2% 17.5% 4.8% 3.0%
3 or More 757 30.9% 64.6% 15.3% 15.7% 2.2% 2.1% Overall Did not work 9,462 52.7% 59.1% 17.4% 17.2% 3.4% 2.9%
1 Year 2,564 14.3% 63.5% 13.8% 17.2% 2.6% 2.8%
2 Years 2,317 12.9% 67.0% 14.2% 14.1% 2.8% 1.9%
3 or More 3,612 20.1% 68.7% 14.4% 13.3% 2.0% 1.6%
*Limited to degree recipients who graduated within 6 years.
Table 8. Logistic Regression Model Predicting 2nd Fall Persistence, 1st Year Students Overall B S.E. Wald df Sig. Odds Ratio First year EFC 0.00 0.00 94.91 1 .000 1.00 Hours worked 1-5 -0.01 0.05 0.01 1 .911 0.99 Hours worked 5-10 0.28 0.08 13.89 1 .000 1.33 Hours worked 10+ 0.13 0.10 1.59 1 .207 1.14 Male 0.08 0.03 6.89 1 .009 1.09 Nonresident -0.43 0.03 167.26 1 .000 0.65 HS GPA 0.79 0.04 455.71 1 .000 2.21 Constant -0.69 0.14 26.08 1 .000 0.50 χ2(7, N=47,086)=720.7, p<.05 R2=.032 Table 9. Logistic Regression Model Predicting 2nd Fall Persistence, 1st Year Students with 0 Attributes B S.E. Wald df Sig. Odds Ratio First year EFC 0.00 0.00 27.64 1 .000 1.00 Hours worked 1-5 -0.07 0.08 0.74 1 .391 0.93 Hours worked 5-10 0.28 0.13 4.69 1 .030 1.33 Hours worked 10+ -0.10 0.17 0.36 1 .547 0.90 Male 0.04 0.05 0.61 1 .437 1.04 Nonresident -0.41 0.05 80.67 1 .000 0.66 HS GPA 0.88 0.05 280.05 1 .000 2.42 Constant -0.77 0.19 15.76 1 .000 0.46 χ2(7, N=26,734)=398.3, p<.05 R2=.034
CSU | Institutional Research, Planning & Effectiveness
April 2020 Campus Work and Success 19
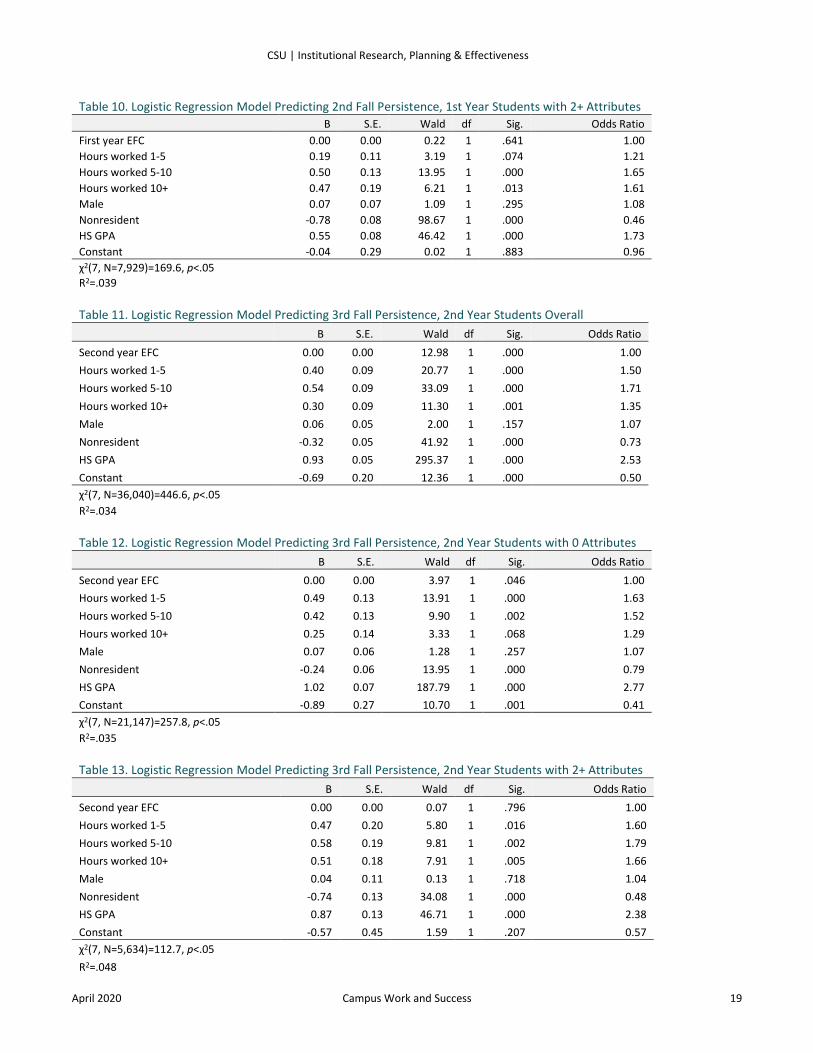
Table 10. Logistic Regression Model Predicting 2nd Fall Persistence, 1st Year Students with 2+ Attributes B S.E. Wald df Sig. Odds Ratio First year EFC 0.00 0.00 0.22 1 .641 1.00 Hours worked 1-5 0.19 0.11 3.19 1 .074 1.21 Hours worked 5-10 0.50 0.13 13.95 1 .000 1.65 Hours worked 10+ 0.47 0.19 6.21 1 .013 1.61 Male 0.07 0.07 1.09 1 .295 1.08 Nonresident -0.78 0.08 98.67 1 .000 0.46 HS GPA 0.55 0.08 46.42 1 .000 1.73 Constant -0.04 0.29 0.02 1 .883 0.96 χ2(7, N=7,929)=169.6, p<.05 R2=.039 Table 11. Logistic Regression Model Predicting 3rd Fall Persistence, 2nd Year Students Overall B S.E. Wald df Sig. Odds Ratio Second year EFC 0.00 0.00 12.98 1 .000 1.00 Hours worked 1-5 0.40 0.09 20.77 1 .000 1.50 Hours worked 5-10 0.54 0.09 33.09 1 .000 1.71 Hours worked 10+ 0.30 0.09 11.30 1 .001 1.35 Male 0.06 0.05 2.00 1 .157 1.07 Nonresident -0.32 0.05 41.92 1 .000 0.73 HS GPA 0.93 0.05 295.37 1 .000 2.53 Constant -0.69 0.20 12.36 1 .000 0.50 χ2(7, N=36,040)=446.6, p<.05 R2=.034 Table 12. Logistic Regression Model Predicting 3rd Fall Persistence, 2nd Year Students with 0 Attributes B S.E. Wald df Sig. Odds Ratio Second year EFC 0.00 0.00 3.97 1 .046 1.00 Hours worked 1-5 0.49 0.13 13.91 1 .000 1.63 Hours worked 5-10 0.42 0.13 9.90 1 .002 1.52 Hours worked 10+ 0.25 0.14 3.33 1 .068 1.29 Male 0.07 0.06 1.28 1 .257 1.07 Nonresident -0.24 0.06 13.95 1 .000 0.79 HS GPA 1.02 0.07 187.79 1 .000 2.77 Constant -0.89 0.27 10.70 1 .001 0.41 χ2(7, N=21,147)=257.8, p<.05 R2=.035 Table 13. Logistic Regression Model Predicting 3rd Fall Persistence, 2nd Year Students with 2+ Attributes B S.E. Wald df Sig. Odds Ratio Second year EFC 0.00 0.00 0.07 1 .796 1.00 Hours worked 1-5 0.47 0.20 5.80 1 .016 1.60 Hours worked 5-10 0.58 0.19 9.81 1 .002 1.79 Hours worked 10+ 0.51 0.18 7.91 1 .005 1.66 Male 0.04 0.11 0.13 1 .718 1.04 Nonresident -0.74 0.13 34.08 1 .000 0.48 HS GPA 0.87 0.13 46.71 1 .000 2.38 Constant -0.57 0.45 1.59 1 .207 0.57 χ2(7, N=5,634)=112.7, p<.05 R2=.048
CSU | Institutional Research, Planning & Effectiveness
April 2020 Campus Work and Success 20
Table 14. Logistic Regression Model Predicting 4 Yr Graduation, 3rd Year Students Overall B S.E. Wald df Sig. Odds Ratio Third year EFC 0.00 0.00 4.01 1 .045 1.00 Hours worked 1-5 0.14 0.05 9.63 1 .002 1.16 Hours worked 5-10 0.34 0.04 59.87 1 .000 1.41 Hours worked 10+ 0.33 0.04 64.54 1 .000 1.39 Male -0.69 0.03 679.90 1 .000 0.50 Nonresident 0.11 0.03 12.54 1 .000 1.12 HS GPA 0.93 0.03 814.03 1 .000 2.53 Constant -2.84 0.12 553.70 1 .000 0.06 χ2(7, N=26,269)=2158.4, p<.05 R2=.106 Table 15. Logistic Regression Model Predicting 4 Yr Graduation, 3rd Year Students with 0 Attributes B S.E. Wald df Sig. Odds Ratio Third year EFC 0.00 0.00 6.57 1 .010 1.00 Hours worked 1-5 0.22 0.06 13.04 1 .000 1.25 Hours worked 5-10 0.37 0.06 36.84 1 .000 1.45 Hours worked 10+ 0.37 0.06 39.17 1 .000 1.44 Male -0.73 0.03 445.41 1 .000 0.48 Nonresident 0.07 0.04 3.27 1 .071 1.07 HS GPA 0.89 0.04 437.92 1 .000 2.43 Constant -2.52 0.16 249.26 1 .000 0.08 χ2(7, N=15,659)=1329.1, p<.05 R2=.110 Table 16. Logistic Regression Model Predicting 4 Yr Graduation, 3rd Year Students with 2+ Attributes B S.E. Wald df Sig. Odds Ratio Third year EFC 0.00 0.00 6.39 1 .011 1.00 Hours worked 1-5 0.16 0.12 1.77 1 .183 1.17 Hours worked 5-10 0.34 0.10 11.05 1 .001 1.41 Hours worked 10+ 0.46 0.09 26.66 1 .000 1.59 Male -0.75 0.07 116.41 1 .000 0.47 Nonresident 0.06 0.10 0.29 1 .589 1.06 HS GPA 0.90 0.08 115.54 1 .000 2.47 Constant -3.10 0.31 101.62 1 .000 0.05 χ2(7, N=3900)=350.6, p<.05 R2=.115 Table 17. Logistic Regression Model Predicting 6 Yr Graduation, 3rd Year Students Overall B S.E. Wald df Sig. Odds Ratio Third year EFC 0.00 0.00 9.52 1 .002 1.00 Hours worked 1-5 0.34 0.10 11.64 1 .001 1.40 Hours worked 5-10 0.53 0.10 29.32 1 .000 1.70 Hours worked 10+ 0.36 0.08 17.83 1 .000 1.43 Male -0.34 0.05 45.50 1 .000 0.71 Nonresident 0.02 0.06 0.12 1 .728 1.02 HS GPA 1.20 0.06 356.30 1 .000 3.31 Constant -2.03 0.23 77.79 1 .000 0.13 χ2(7, N=19,473)=587.0, p<.05 R2=.063

CSU | Institutional Research, Planning & Effectiveness
April 2020 Campus Work and Success 21
Table 18. Logistic Regression Model Predicting 6 Yr Graduation, 3rd Year Students with 0 Attributes B S.E. Wald df Sig. Odds Ratio Third year EFC 0.00 0.00 0.05 1 .824 1.00 Hours worked 1-5 0.54 0.15 12.91 1 .000 1.72 Hours worked 5-10 0.77 0.16 22.59 1 .000 2.16 Hours worked 10+ 0.53 0.14 14.68 1 .000 1.69 Male -0.42 0.07 33.51 1 .000 0.66 Nonresident 0.04 0.08 0.18 1 .668 1.04 HS GPA 1.13 0.09 159.07 1 .000 3.10 Constant -1.50 0.33 20.75 1 .000 0.22 χ2(7, N=11,629)=328.2, p<.05 R2=.065 Table 19. Logistic Regression Model Predicting 6 Yr Graduation, 3rd Year Students with 2+ Attributes B S.E. Wald df Sig. Odds Ratio Third year EFC 0.00 0.00 0.01 1 .907 1.00 Hours worked 1-5 0.22 0.20 1.29 1 .256 1.25 Hours worked 5-10 0.46 0.19 6.23 1 .013 1.59 Hours worked 10+ 0.38 0.16 5.75 1 .016 1.46 Male -0.46 0.11 17.54 1 .000 0.63 Nonresident -0.13 0.17 0.55 1 .457 0.88 HS GPA 1.20 0.14 74.03 1 .000 3.31 Constant -2.35 0.49 22.71 1 .000 0.10 χ2(7, N=2,825)=133.5, p<.05 R2=.081 Table 20. Logistic Regression Model Predicting 4 Yr Graduation, 4th Year Students Overall B S.E. Wald df Sig. Odds Ratio Fourth year EFC 0.00 0.00 11.04 1 .001 1.00 Hours worked 1-5 0.10 0.05 4.44 1 .035 1.11 Hours worked 5-10 0.25 0.05 29.81 1 .000 1.28 Hours worked 10+ 0.22 0.04 32.39 1 .000 1.25 Male -0.70 0.03 685.58 1 .000 0.49 Nonresident 0.12 0.03 14.45 1 .000 1.13 HS GPA 0.93 0.03 776.42 1 .000 2.52 Constant -2.75 0.12 495.71 1 .000 0.06 χ2(7, N=25,556)=2018.7, p<.05 R2=.103 Table 21. Logistic Regression Model Predicting 4 Yr Graduation, 4th Year Students with 0 Attributes B S.E. Wald df Sig. Odds Ratio Fourth year EFC 0.00 0.00 0.94 1 .333 1.00 Hours worked 1-5 0.12 0.06 3.88 1 .049 1.13 Hours worked 5-10 0.32 0.06 27.14 1 .000 1.38 Hours worked 10+ 0.32 0.05 33.87 1 .000 1.38 Male -0.74 0.04 443.72 1 .000 0.48 Nonresident 0.10 0.04 5.91 1 .015 1.10 HS GPA 0.90 0.04 433.35 1 .000 2.46 Constant -2.52 0.16 239.36 1 .000 0.08 χ2(7, N=15,301)=1274.6, p<.05 R2=.109
CSU | Institutional Research, Planning & Effectiveness
April 2020 Campus Work and Success 22
Table 22. Logistic Regression Model Predicting 4 Yr Graduation, 4th Year Students with 2+ Attributes B S.E. Wald df Sig. Odds Ratio Fourth year EFC 0.00 0.00 10.15 1 .001 1.00 Hours worked 1-5 0.12 0.12 0.95 1 .329 1.13 Hours worked 5-10 0.17 0.11 2.65 1 .103 1.19 Hours worked 10+ 0.14 0.09 2.38 1 .123 1.15 Male -0.76 0.07 114.16 1 .000 0.47 Nonresident 0.05 0.11 0.25 1 .620 1.05 HS GPA 0.87 0.09 103.32 1 .000 2.39 Constant -2.82 0.31 80.89 1 .000 0.06 χ2(7, N=3,719)=300.5, p<.05 R2=.104 Table 23. Logistic Regression Model Predicting 6 Yr Graduation, 4th Year Students Overall B S.E. Wald df Sig. Odds Ratio Fourth year EFC 0.00 0.00 4.55 1 .033 1.00 Hours worked 1-5 0.47 0.13 13.99 1 .000 1.60 Hours worked 5-10 0.48 0.12 17.36 1 .000 1.62 Hours worked 10+ 0.55 0.10 29.52 1 .000 1.73 Male -0.36 0.06 35.54 1 .000 0.70 Nonresident 0.00 0.07 0.00 1 .982 1.00 HS GPA 1.23 0.08 261.69 1 .000 3.41 Constant -1.72 0.27 39.64 1 .000 0.18 χ2(7, N=18,963)=452.9, p<.05 R2=.060 Table 24. Logistic Regression Model Predicting 6 Yr Graduation, 4th Year Students with 0 Attributes B S.E. Wald df Sig. Odds Ratio Fourth year EFC 0.00 0.00 0.30 1 .585 1.00 Hours worked 1-5 0.63 0.19 11.04 1 .001 1.88 Hours worked 5-10 0.70 0.19 14.04 1 .000 2.01 Hours worked 10+ 0.75 0.17 20.54 1 .000 2.12 Male -0.48 0.09 30.43 1 .000 0.62 Nonresident 0.11 0.10 1.25 1 .263 1.12 HS GPA 1.17 0.11 115.12 1 .000 3.21 Constant -1.19 0.40 8.90 1 .003 0.30 χ2(7, N=11,375)=264.2, p<.05 R2=.066
Table 25. Logistic Regression Model Predicting 6 Yr Graduation, 4th Year Students with 2+ Attributes B S.E. Wald df Sig. Odds Ratio Fourth year EFC 0.00 0.00 1.91 1 .166 1.00 Hours worked 1-5 0.57 0.27 4.30 1 .038 1.77 Hours worked 5-10 0.53 0.23 5.34 1 .021 1.70 Hours worked 10+ 0.57 0.19 9.08 1 .003 1.77 Male -0.47 0.13 12.48 1 .000 0.63 Nonresident -0.27 0.20 1.89 1 .170 0.76 HS GPA 1.21 0.17 52.89 1 .000 3.34 Constant -2.04 0.59 12.11 1 .001 0.13 χ2(7, N=2,700)=108.0, p<.05 R2=.081
CSU | Institutional Research, Planning & Effectiveness
April 2020 Campus Work and Success 23
Table 26. Chi-Square Results, Proportion of Degree Recipients Who Graduated in 4 Years or Less by Total Time Worked Headcount % 4 Years or Less χ2 df Eta
No Attributes Did not work (Reference) 6,133 56.0% 59.8% - - - 1 Year 1,628 14.9% 66.6% 24.7* 1 .055 2 Years 1,363 12.4% 69.3% 42.5* 1 .075 3 or More 1,828 16.7% 70.2% 64.8* 1 .090
2+ Attributes Did not work (Reference) 1,041 42.5% 53.3% 1 Year 321 13.1% 52.3% 0.09 1 - 2 Years 331 13.5% 57.4% 1.55 1 - 3 or More 757 30.9% 64.6% 22.9* 1 .113
Overall Did not work (Reference) 9,462 52.7% 59.1% - - - 1 Year 2,564 14.3% 63.5% 16.4* 1 .037 2 Years 2,317 12.9% 67.0% 48.2* 1 .064 3 or More 3,612 20.1% 68.7% 100.7* 1 .088
*p<.05