Assignment: Yokosuka ----- ----- ----- Current Trends, Concerns and Processes
On Board Cruise Report
YOKOSUKA Cruise: YK13-01
Rodriguez Triple Junction, Indian Ocean
Jan.16-Feb.4, 2013
Japan Agency for Marine-Earth Science and Technology (JAMSTEC)
Contents
1. Purpose 2. Participants 2-1. Onboard Scientists 2-2. Onboard technicians 2-3. Scientists on land 2-4. Crew and Operation Team 3. Cruise Information 3-1. Basic Information 3-2. Research Area 3-3. Ship Log 4. Instruments 4-1. OBEM (Ocean Bottom Electro-Magnetometer) 4-2. OBS (Ocean Bottom Seismometers) 4-3. OBSP (Ocean Bottom Seismometer with Pressure gauge) 4-4. OBSM (Ocean Bottom Seismometers with Magnetometer) 4-5. Equipment for active seismic surveys 5. Preliminary Results 5-1. Deployment of ocean bottom instruments 5-2. Seismic Reflection and Refraction Survey 5-3. Surface Geophysical Survey 5-4. Checking on TRITON Buoy No.18 6. Summary Acknowledgement Notice on using
1. Purpose We deploy four different types of instruments; OBEM (Ocean Bottom
Electro-Magnetometer), OBS (Ocean Bottom Seismometer), OBSP (Ocean Bottom Seismometer with Pressure gauge), and OBSM (Ocean Bottom Seismometers with Magnetometer). The OBEM and OBSM are used to observe magnetic and electric field variations at the ocean bottom across the central and southeast Indian Ridges near the Rodriguez Triple Junction. The OBSs including the OBSP and OBSMs are used to conduct seismic observation at the ocean bottom near the “Kairei” hydrothermal vent site in the first segment of the central Indian Ridge. These observations continue up to the recovery of the instruments during another Yokosuka cruise in this March. The OBSs are also used for active seismic surveys to investigate seismic velocity structure during this cruise and the recovery cruise. Further, we conduct surface geophysical survey mainly during night and transit times. The central and southeast Indian Ridges spreading system shows different spreading rate with different topographic characters, which give the one of the best locations to investigate dependence of seafloor-spreading system on a parameter of spreading rate. In the slower spreading central Indian Ridge, the “Kairei” vent site exist and extrude hydrothermal fluid with richer hydrogen content compared to other hydrothermal vents in the world. The observed data will be analyzed to derive upper mantle structure, crustal structure, and hypocenter distribution, which will provide important constraint on following four main points to understand the seafloor-spreading system; 1) imaging melt delivery to the spreading axis, 2) production and character of the crust, 3) relationship between melt supply and crustal formation, and 4) pathway and heat source for hydrothermal circulation with related to its formation. Moreover, we check the TRITON buoy No.18, which is missing after 3 Dec. 2012 due to no satellite communications.

2. Participants 2-1.Onboard Scientists Nobukazu Seama (Professor; Chief scientist/Representative of the science party) Department of Earth and Planetary Sciences, Kobe University Tomoaki Yamada (Assistant Professor) Earthquake Research Institute The University of Tokyo Tetsuo Matsuno (Postdoctoral Research Scientist) Geoscience Group National Institute of Polar Research Division of Research and Education Masayuki Yamaguchi (Engineer) Japan Agency for Marine-Earth Science and Technology Haruka Shindo (Graduate Student) Graduate School of Science Kobe University Yui Noguchi (Graduate Student) Graduate School of Science Chiba University Takahiro Baba (Graduate Student) Graduate School of Science Kobe University Akihiro Kono (Graduate Student) Graduate School of Science Chiba University Eri Iizuka (Undergraduate Student) Faculty of Science Kobe University 2-2.Onboard technicians Satoshi Okada (Marine Technician) Marine Science Department, Nippon Marine Enterprises, Ltd. Keisuke Matsumoto (Marine Technician) Marine Observation Section, Department of Marine Science Marine Work Japan Ltd. Mitsuteru Kuno (Marine Technician) Marine Science Department, Nippon Marine Enterprises, Ltd. Hisanori Iwamoto (Marine Technician) Marine Science Department, Nippon Marine Enterprises, Ltd.

Toshimasa Nasu (Marine Technician) Marine Science Department, Nippon Marine Enterprises, Ltd. 2-3. Scientists on land Kyoko Okino, Atmosphere and Ocean Research Institute, University of Tokyo Toshinori Sato, Earth Sciences, Chiba University Masanao Shinohara, Earthquake Research Institute, University of Tokyo Yoshifumi Nogi, National Institute of Polar Research Kimihiro Mochizuki, Earthquake Research Institute, University of Tokyo Takeshi Tsuji, Kyushu University 2-4. Crew and Operation Team Captain Shinya Ryono Chief Officer Tatsuo Adachi 2nd Officer Takeshi Egashira 3rd Officer Shunsuke Fujii Chief Engineer Eiji Sakguchi 1st Engineer Takashi Ota 2nd Engineer Kenta Ikeguchi 3rd Engineer Katsuto Yamaguchi Chief Electronics Operator Taketo Hattori 2nd Electronics Operator Yoshikazu Kuramoto Boat Swain Kazuo Abe Able Seaman Masanori Ohata Able Seaman Kaito Murata Able Seaman Takuya Miyashita Sailor Shinsuke Uzuki Sailor Ryoma Tamura Sailor Kenta Nasu No.1 Oiler Kouzo Miura Oiler Keita Funawatari Oiler Yuji Higashigawa Assistant Oiler Makoto Kozaki Assistant Oiler Eiji Aratake Chief Steward Ryuei Takemura Steward Yoshio Okada Steward Seiji Honda Steward Kazuma Sonoda Steward Kei Ito
3. Cruise Information 3-1. Basic Information
Cruise ID: YK13-01 Name of vessel: YOKOSUKA Title of the cruise: Seafloor spreading dynamics near the Rodriguez Triple Junction: from
mantle to hydrothermal activity, part 1 Title of the proposal: Crustal production process of slow spreading ridge system: Any
relation to make hydrogen rich hydrothermal fluid? Cruise period: Jan.16-Feb.4, 2013 Ports of call: Singapore - Port Louis
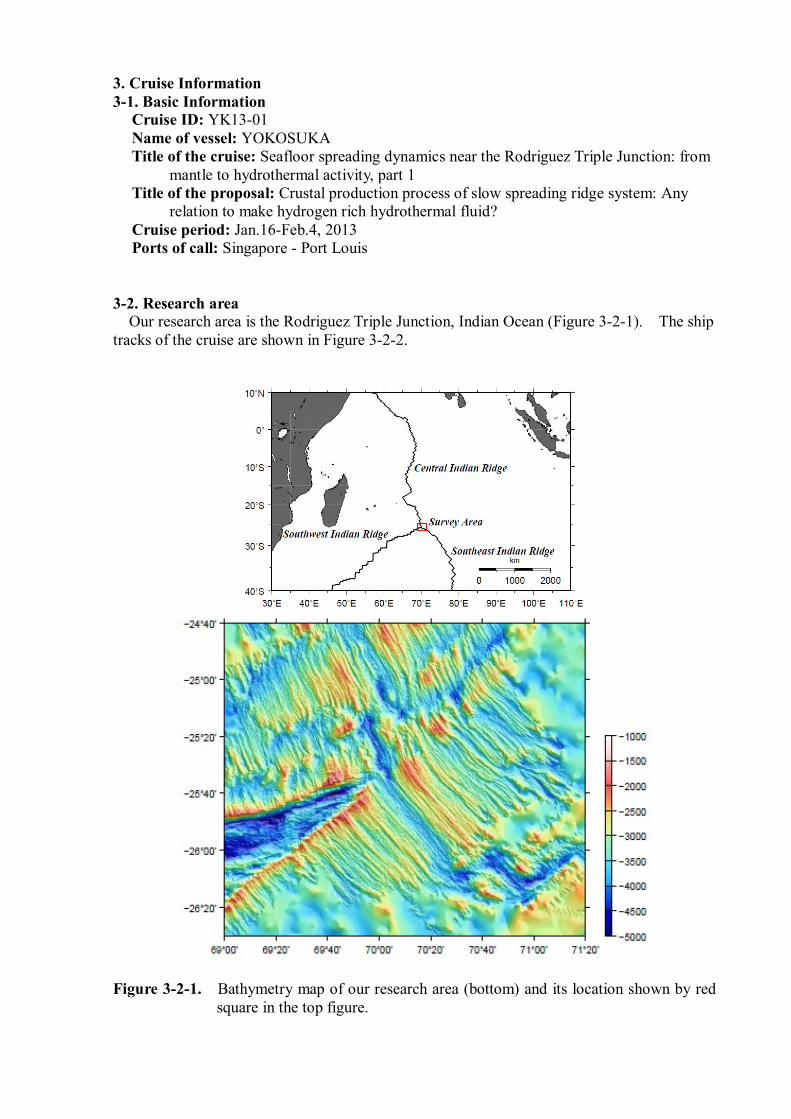
3-2. Research area Our research area is the Rodriguez Triple Junction, Indian Ocean (Figure 3-2-1). The ship tracks of the cruise are shown in Figure 3-2-2.
Figure 3-2-1. Bathymetry map of our research area (bottom) and its location shown by red square in the top figure.
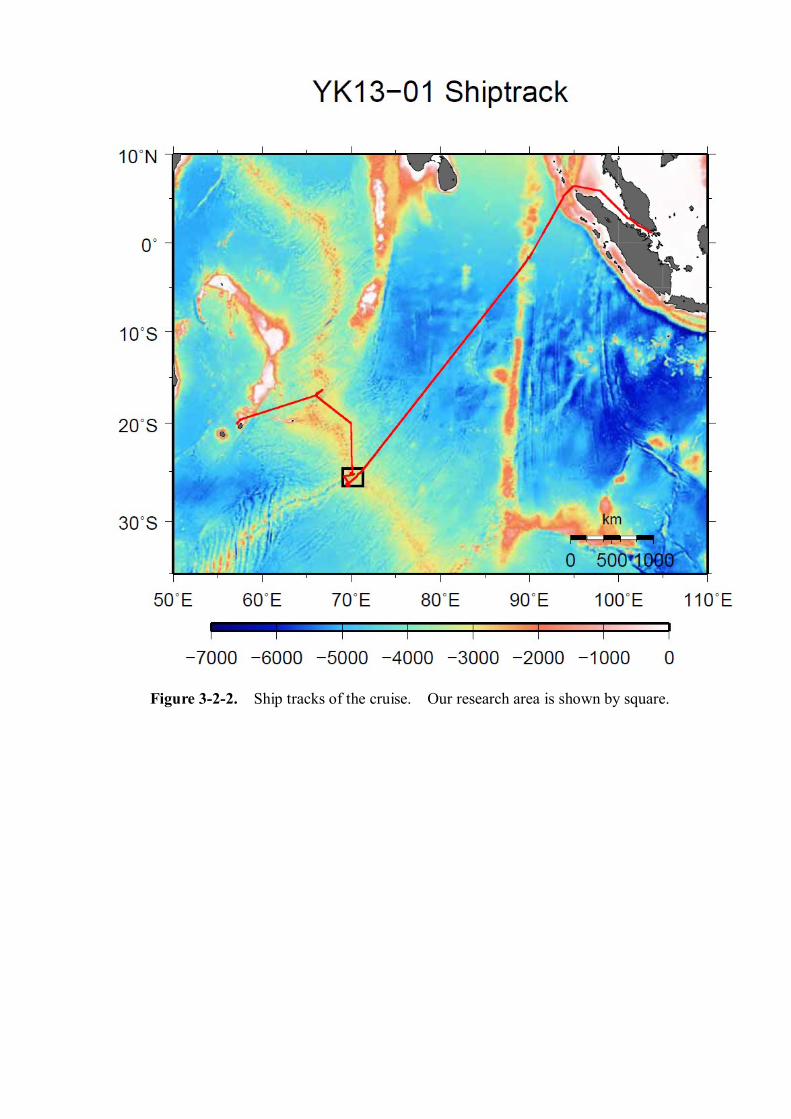
Figure 3-2-2. Ship tracks of the cruise. Our research area is shown by square.
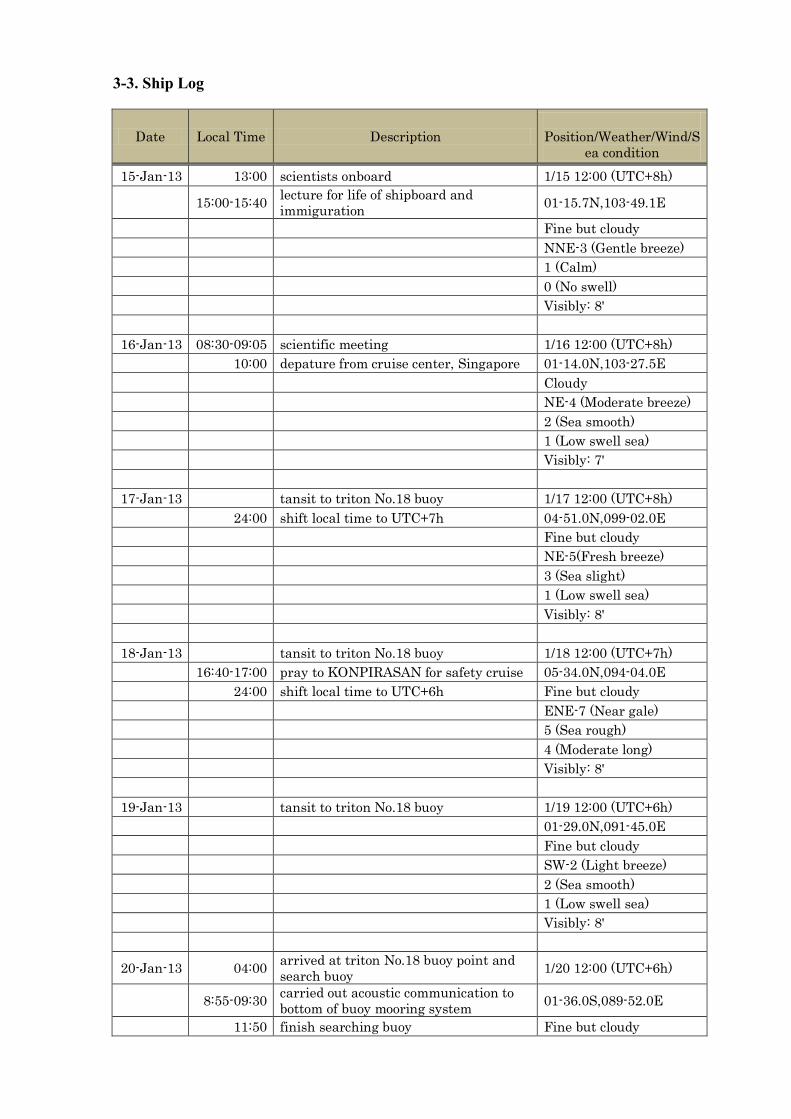
3-3. Ship Log
Date Local Time Description
Position/Weather/Wind/Sea condition
15-Jan-13 13:00 scientists onboard 1/15 12:00 (UTC+8h)
15:00-15:40 lecture for life of shipboard and immiguration 01-15.7N,103-49.1E
Fine but cloudy NNE-3 (Gentle breeze) 1 (Calm) 0 (No swell) Visibly: 8' 16-Jan-13 08:30-09:05 scientific meeting 1/16 12:00 (UTC+8h) 10:00 depature from cruise center, Singapore 01-14.0N,103-27.5E Cloudy NE-4 (Moderate breeze) 2 (Sea smooth) 1 (Low swell sea) Visibly: 7' 17-Jan-13 tansit to triton No.18 buoy 1/17 12:00 (UTC+8h) 24:00 shift local time to UTC+7h 04-51.0N,099-02.0E Fine but cloudy NE-5(Fresh breeze) 3 (Sea slight) 1 (Low swell sea) Visibly: 8' 18-Jan-13 tansit to triton No.18 buoy 1/18 12:00 (UTC+7h) 16:40-17:00 pray to KONPIRASAN for safety cruise 05-34.0N,094-04.0E 24:00 shift local time to UTC+6h Fine but cloudy ENE-7 (Near gale) 5 (Sea rough) 4 (Moderate long) Visibly: 8' 19-Jan-13 tansit to triton No.18 buoy 1/19 12:00 (UTC+6h) 01-29.0N,091-45.0E Fine but cloudy SW-2 (Light breeze) 2 (Sea smooth) 1 (Low swell sea) Visibly: 8'
20-Jan-13 04:00 arrived at triton No.18 buoy point and search buoy 1/20 12:00 (UTC+6h)
8:55-09:30 carried out acoustic communication to bottom of buoy mooring system 01-36.0S,089-52.0E
11:50 finish searching buoy Fine but cloudy
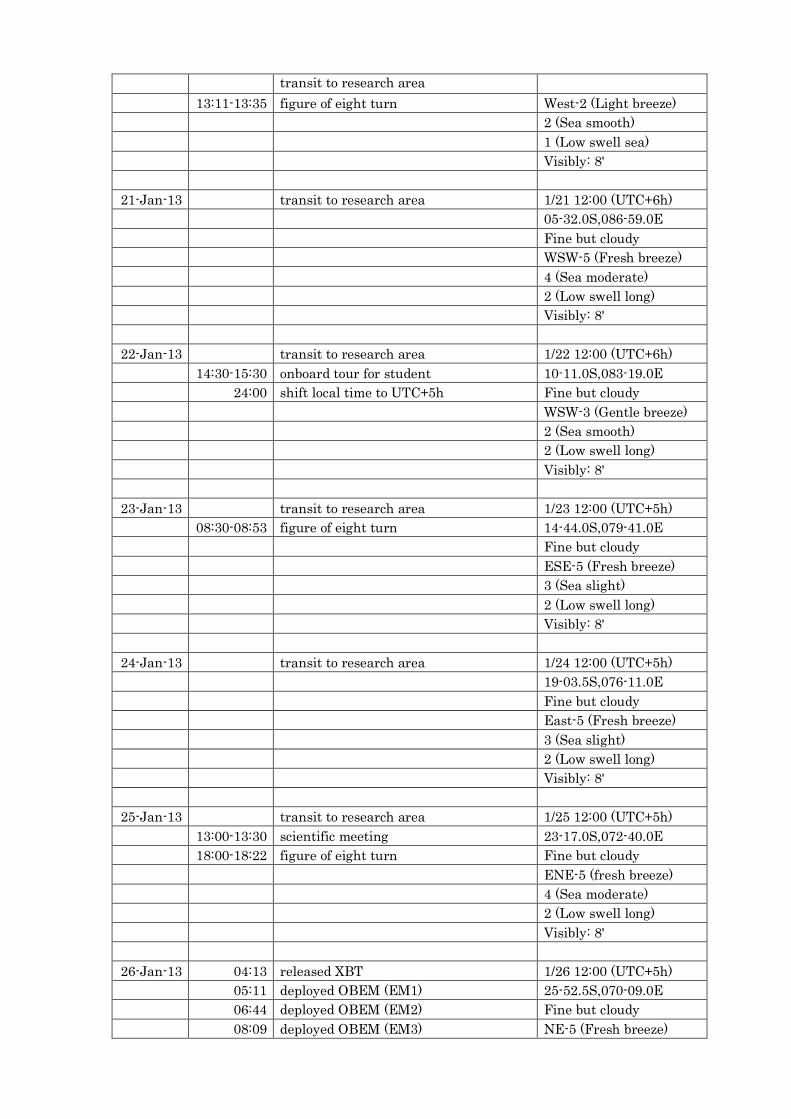
transit to research area 13:11-13:35 figure of eight turn West-2 (Light breeze) 2 (Sea smooth) 1 (Low swell sea) Visibly: 8' 21-Jan-13 transit to research area 1/21 12:00 (UTC+6h) 05-32.0S,086-59.0E Fine but cloudy WSW-5 (Fresh breeze) 4 (Sea moderate) 2 (Low swell long) Visibly: 8' 22-Jan-13 transit to research area 1/22 12:00 (UTC+6h) 14:30-15:30 onboard tour for student 10-11.0S,083-19.0E 24:00 shift local time to UTC+5h Fine but cloudy WSW-3 (Gentle breeze) 2 (Sea smooth) 2 (Low swell long) Visibly: 8' 23-Jan-13 transit to research area 1/23 12:00 (UTC+5h) 08:30-08:53 figure of eight turn 14-44.0S,079-41.0E Fine but cloudy ESE-5 (Fresh breeze) 3 (Sea slight) 2 (Low swell long) Visibly: 8' 24-Jan-13 transit to research area 1/24 12:00 (UTC+5h) 19-03.5S,076-11.0E Fine but cloudy East-5 (Fresh breeze) 3 (Sea slight) 2 (Low swell long) Visibly: 8' 25-Jan-13 transit to research area 1/25 12:00 (UTC+5h) 13:00-13:30 scientific meeting 23-17.0S,072-40.0E 18:00-18:22 figure of eight turn Fine but cloudy ENE-5 (fresh breeze) 4 (Sea moderate) 2 (Low swell long) Visibly: 8' 26-Jan-13 04:13 released XBT 1/26 12:00 (UTC+5h) 05:11 deployed OBEM (EM1) 25-52.5S,070-09.0E 06:44 deployed OBEM (EM2) Fine but cloudy 08:09 deployed OBEM (EM3) NE-5 (Fresh breeze)
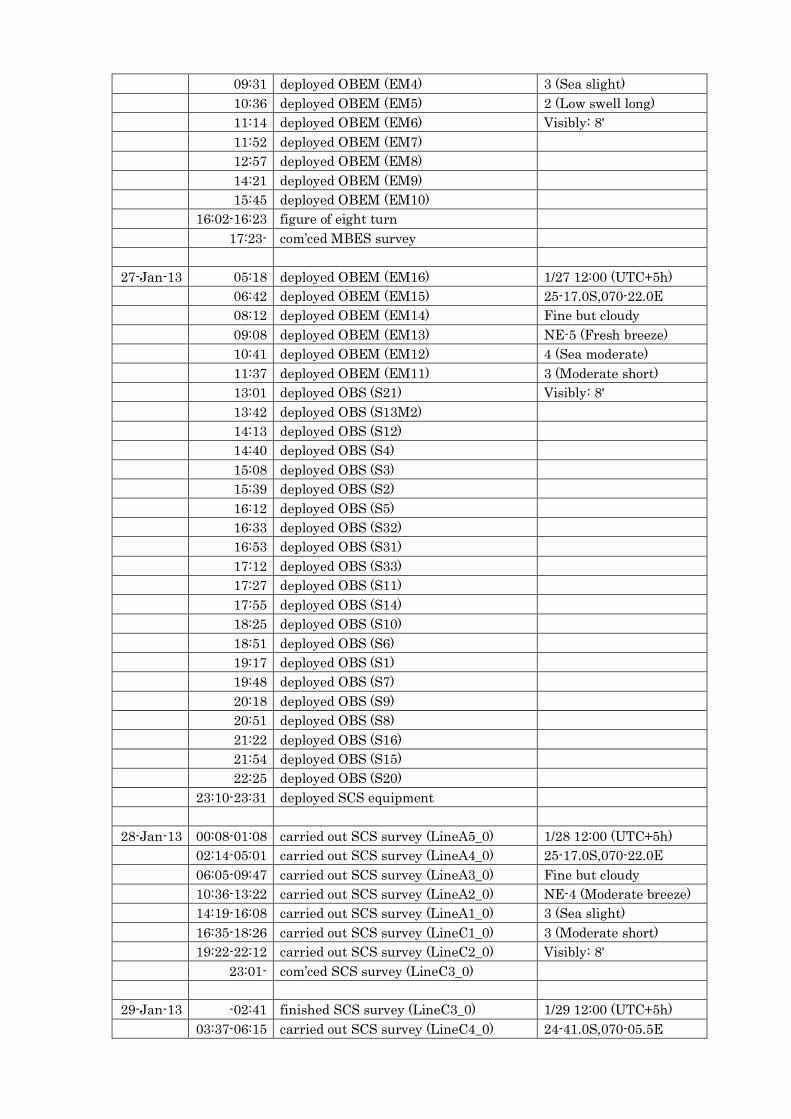
09:31 deployed OBEM (EM4) 3 (Sea slight) 10:36 deployed OBEM (EM5) 2 (Low swell long) 11:14 deployed OBEM (EM6) Visibly: 8' 11:52 deployed OBEM (EM7) 12:57 deployed OBEM (EM8) 14:21 deployed OBEM (EM9) 15:45 deployed OBEM (EM10) 16:02-16:23 figure of eight turn 17:23- com’ced MBES survey 27-Jan-13 05:18 deployed OBEM (EM16) 1/27 12:00 (UTC+5h) 06:42 deployed OBEM (EM15) 25-17.0S,070-22.0E 08:12 deployed OBEM (EM14) Fine but cloudy 09:08 deployed OBEM (EM13) NE-5 (Fresh breeze) 10:41 deployed OBEM (EM12) 4 (Sea moderate) 11:37 deployed OBEM (EM11) 3 (Moderate short) 13:01 deployed OBS (S21) Visibly: 8' 13:42 deployed OBS (S13M2) 14:13 deployed OBS (S12) 14:40 deployed OBS (S4) 15:08 deployed OBS (S3) 15:39 deployed OBS (S2) 16:12 deployed OBS (S5) 16:33 deployed OBS (S32) 16:53 deployed OBS (S31) 17:12 deployed OBS (S33) 17:27 deployed OBS (S11) 17:55 deployed OBS (S14) 18:25 deployed OBS (S10) 18:51 deployed OBS (S6) 19:17 deployed OBS (S1) 19:48 deployed OBS (S7) 20:18 deployed OBS (S9) 20:51 deployed OBS (S8) 21:22 deployed OBS (S16) 21:54 deployed OBS (S15) 22:25 deployed OBS (S20) 23:10-23:31 deployed SCS equipment 28-Jan-13 00:08-01:08 carried out SCS survey (LineA5_0) 1/28 12:00 (UTC+5h) 02:14-05:01 carried out SCS survey (LineA4_0) 25-17.0S,070-22.0E 06:05-09:47 carried out SCS survey (LineA3_0) Fine but cloudy 10:36-13:22 carried out SCS survey (LineA2_0) NE-4 (Moderate breeze) 14:19-16:08 carried out SCS survey (LineA1_0) 3 (Sea slight) 16:35-18:26 carried out SCS survey (LineC1_0) 3 (Moderate short) 19:22-22:12 carried out SCS survey (LineC2_0) Visibly: 8' 23:01- com’ced SCS survey (LineC3_0) 29-Jan-13 -02:41 finished SCS survey (LineC3_0) 1/29 12:00 (UTC+5h) 03:37-06:15 carried out SCS survey (LineC4_0) 24-41.0S,070-05.5E
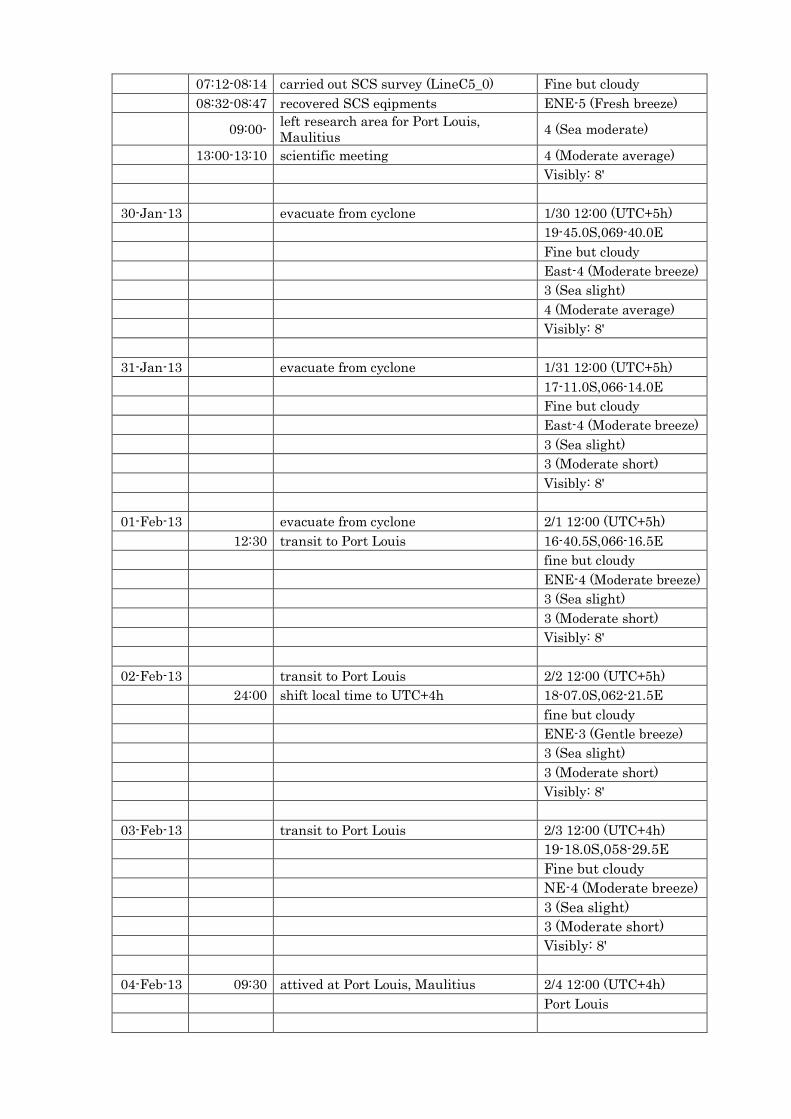
07:12-08:14 carried out SCS survey (LineC5_0) Fine but cloudy 08:32-08:47 recovered SCS eqipments ENE-5 (Fresh breeze)
09:00- left research area for Port Louis, Maulitius 4 (Sea moderate)
13:00-13:10 scientific meeting 4 (Moderate average) Visibly: 8' 30-Jan-13 evacuate from cyclone 1/30 12:00 (UTC+5h) 19-45.0S,069-40.0E Fine but cloudy East-4 (Moderate breeze) 3 (Sea slight) 4 (Moderate average) Visibly: 8' 31-Jan-13 evacuate from cyclone 1/31 12:00 (UTC+5h) 17-11.0S,066-14.0E Fine but cloudy East-4 (Moderate breeze) 3 (Sea slight) 3 (Moderate short) Visibly: 8' 01-Feb-13 evacuate from cyclone 2/1 12:00 (UTC+5h) 12:30 transit to Port Louis 16-40.5S,066-16.5E fine but cloudy ENE-4 (Moderate breeze) 3 (Sea slight) 3 (Moderate short) Visibly: 8' 02-Feb-13 transit to Port Louis 2/2 12:00 (UTC+5h) 24:00 shift local time to UTC+4h 18-07.0S,062-21.5E fine but cloudy ENE-3 (Gentle breeze) 3 (Sea slight) 3 (Moderate short) Visibly: 8' 03-Feb-13 transit to Port Louis 2/3 12:00 (UTC+4h) 19-18.0S,058-29.5E Fine but cloudy NE-4 (Moderate breeze) 3 (Sea slight) 3 (Moderate short) Visibly: 8'
04-Feb-13 09:30 attived at Port Louis, Maulitius 2/4 12:00 (UTC+4h) Port Louis
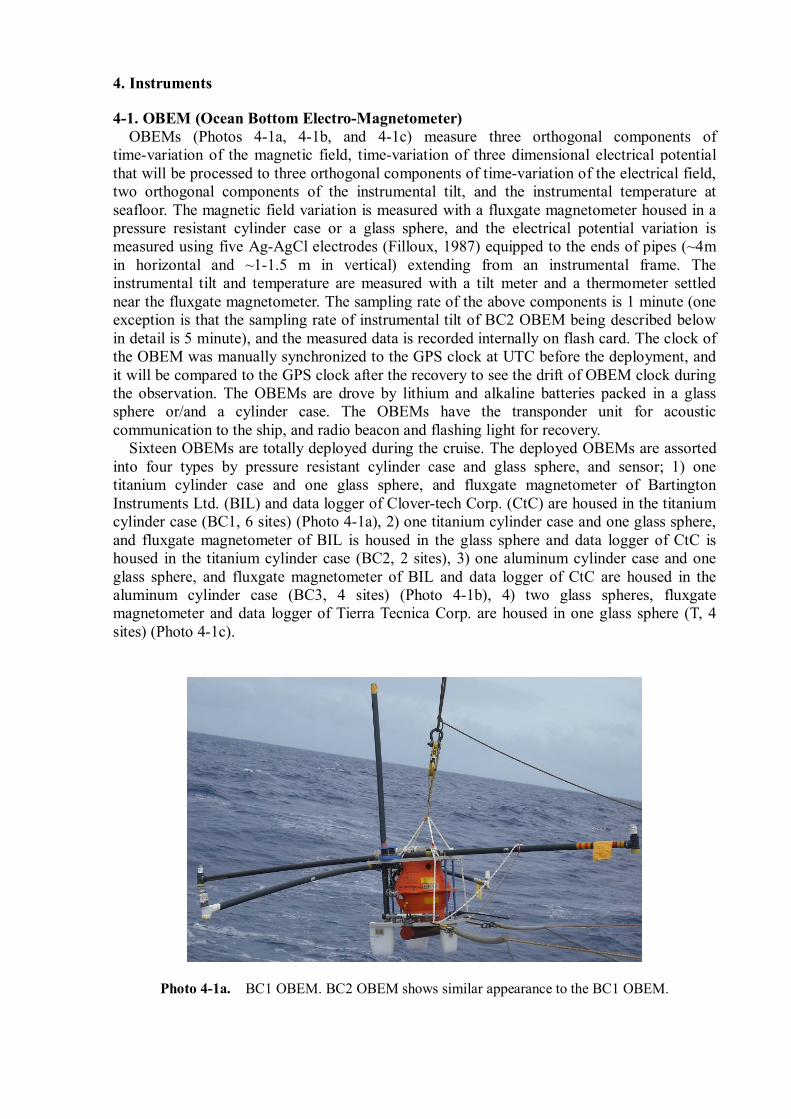
4. Instruments 4-1. OBEM (Ocean Bottom Electro-Magnetometer) OBEMs (Photos 4-1a, 4-1b, and 4-1c) measure three orthogonal components of time-variation of the magnetic field, time-variation of three dimensional electrical potential that will be processed to three orthogonal components of time-variation of the electrical field, two orthogonal components of the instrumental tilt, and the instrumental temperature at seafloor. The magnetic field variation is measured with a fluxgate magnetometer housed in a pressure resistant cylinder case or a glass sphere, and the electrical potential variation is measured using five Ag-AgCl electrodes (Filloux, 1987) equipped to the ends of pipes (~4m in horizontal and ~1-1.5 m in vertical) extending from an instrumental frame. The instrumental tilt and temperature are measured with a tilt meter and a thermometer settled near the fluxgate magnetometer. The sampling rate of the above components is 1 minute (one exception is that the sampling rate of instrumental tilt of BC2 OBEM being described below in detail is 5 minute), and the measured data is recorded internally on flash card. The clock of the OBEM was manually synchronized to the GPS clock at UTC before the deployment, and it will be compared to the GPS clock after the recovery to see the drift of OBEM clock during the observation. The OBEMs are drove by lithium and alkaline batteries packed in a glass sphere or/and a cylinder case. The OBEMs have the transponder unit for acoustic communication to the ship, and radio beacon and flashing light for recovery. Sixteen OBEMs are totally deployed during the cruise. The deployed OBEMs are assorted into four types by pressure resistant cylinder case and glass sphere, and sensor; 1) one titanium cylinder case and one glass sphere, and fluxgate magnetometer of Bartington Instruments Ltd. (BIL) and data logger of Clover-tech Corp. (CtC) are housed in the titanium cylinder case (BC1, 6 sites) (Photo 4-1a), 2) one titanium cylinder case and one glass sphere, and fluxgate magnetometer of BIL is housed in the glass sphere and data logger of CtC is housed in the titanium cylinder case (BC2, 2 sites), 3) one aluminum cylinder case and one glass sphere, and fluxgate magnetometer of BIL and data logger of CtC are housed in the aluminum cylinder case (BC3, 4 sites) (Photo 4-1b), 4) two glass spheres, fluxgate magnetometer and data logger of Tierra Tecnica Corp. are housed in one glass sphere (T, 4 sites) (Photo 4-1c).
Photo 4-1a. BC1 OBEM. BC2 OBEM shows similar appearance to the BC1 OBEM.
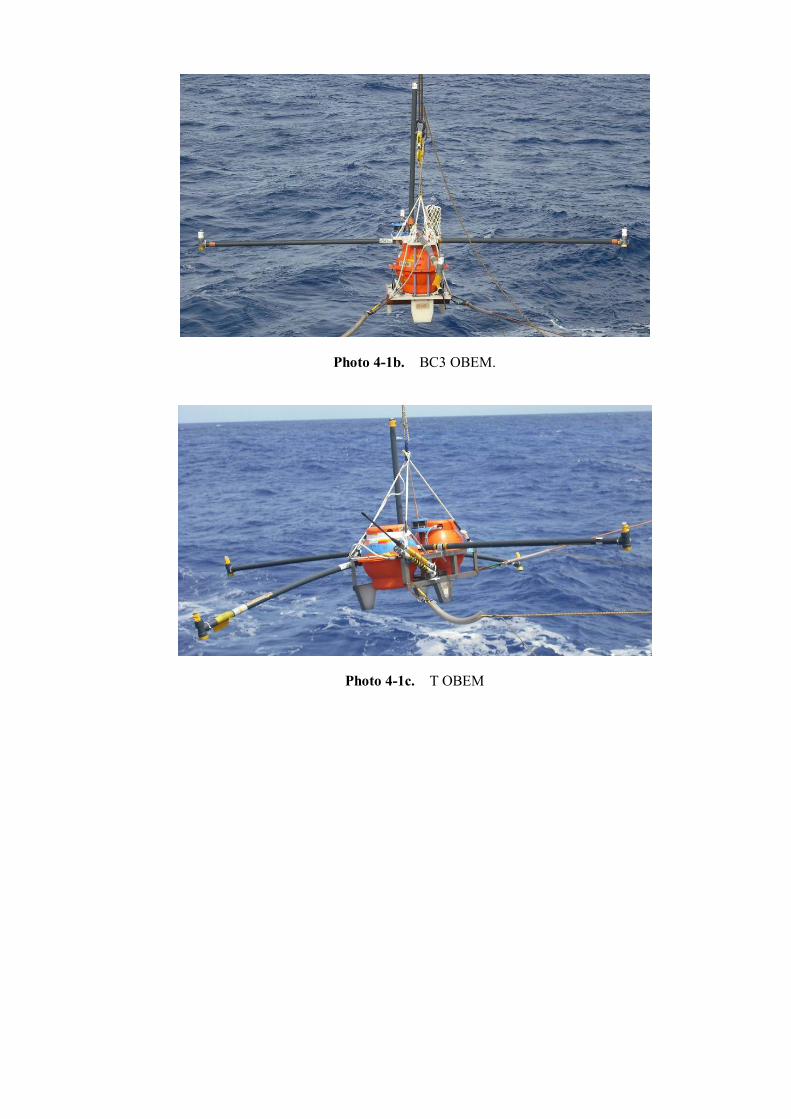
Photo 4-1b. BC3 OBEM.
Photo 4-1c. T OBEM
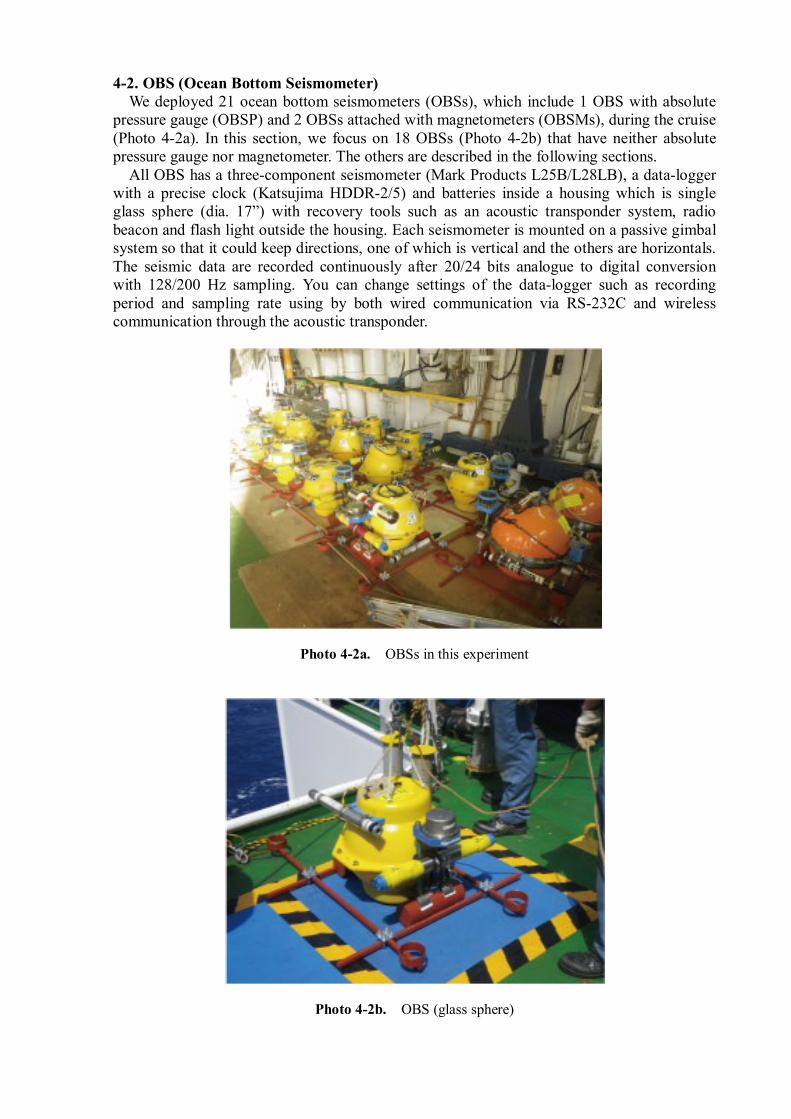
4-2. OBS (Ocean Bottom Seismometer) We deployed 21 ocean bottom seismometers (OBSs), which include 1 OBS with absolute pressure gauge (OBSP) and 2 OBSs attached with magnetometers (OBSMs), during the cruise (Photo 4-2a). In this section, we focus on 18 OBSs (Photo 4-2b) that have neither absolute pressure gauge nor magnetometer. The others are described in the following sections. All OBS has a three-component seismometer (Mark Products L25B/L28LB), a data-logger with a precise clock (Katsujima HDDR-2/5) and batteries inside a housing which is single glass sphere (dia. 17”) with recovery tools such as an acoustic transponder system, radio beacon and flash light outside the housing. Each seismometer is mounted on a passive gimbal system so that it could keep directions, one of which is vertical and the others are horizontals. The seismic data are recorded continuously after 20/24 bits analogue to digital conversion with 128/200 Hz sampling. You can change settings of the data-logger such as recording period and sampling rate using by both wired communication via RS-232C and wireless communication through the acoustic transponder.
Photo 4-2a. OBSs in this experiment
Photo 4-2b. OBS (glass sphere)
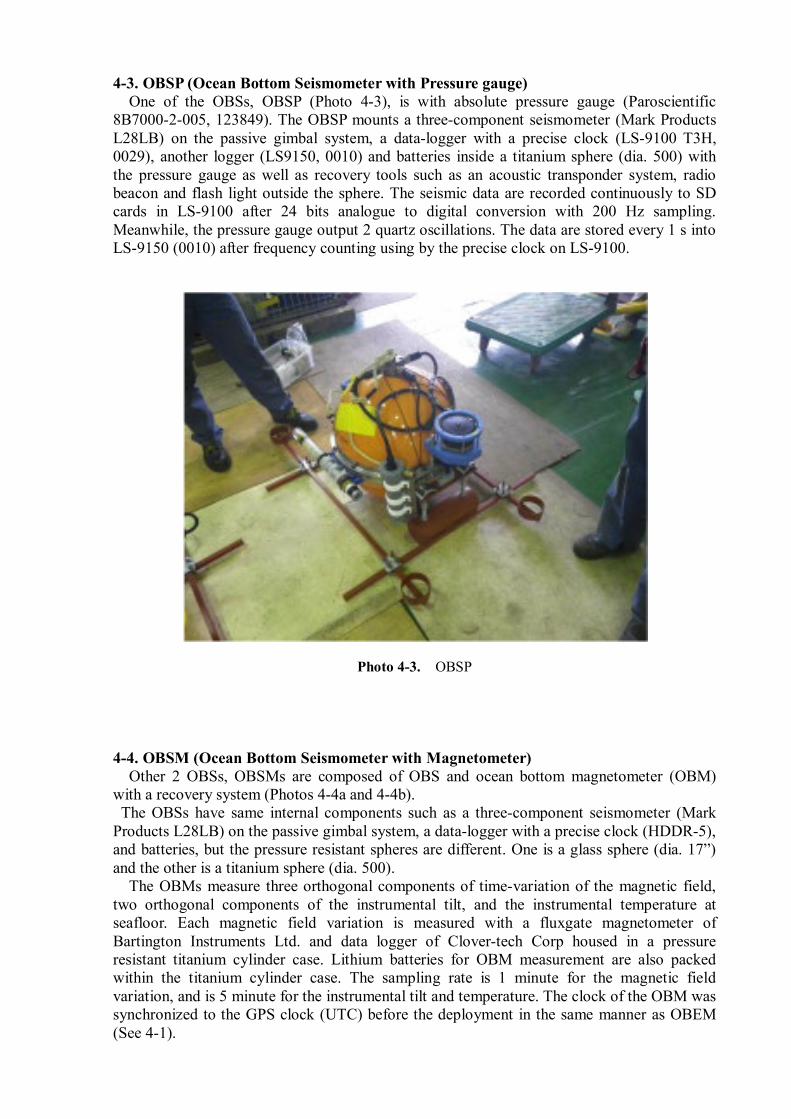
4-3. OBSP (Ocean Bottom Seismometer with Pressure gauge) One of the OBSs, OBSP (Photo 4-3), is with absolute pressure gauge (Paroscientific 8B7000-2-005, 123849). The OBSP mounts a three-component seismometer (Mark Products L28LB) on the passive gimbal system, a data-logger with a precise clock (LS-9100 T3H, 0029), another logger (LS9150, 0010) and batteries inside a titanium sphere (dia. 500) with the pressure gauge as well as recovery tools such as an acoustic transponder system, radio beacon and flash light outside the sphere. The seismic data are recorded continuously to SD cards in LS-9100 after 24 bits analogue to digital conversion with 200 Hz sampling. Meanwhile, the pressure gauge output 2 quartz oscillations. The data are stored every 1 s into LS-9150 (0010) after frequency counting using by the precise clock on LS-9100.
Photo 4-3. OBSP 4-4. OBSM (Ocean Bottom Seismometer with Magnetometer) Other 2 OBSs, OBSMs are composed of OBS and ocean bottom magnetometer (OBM) with a recovery system (Photos 4-4a and 4-4b). The OBSs have same internal components such as a three-component seismometer (Mark
Products L28LB) on the passive gimbal system, a data-logger with a precise clock (HDDR-5), and batteries, but the pressure resistant spheres are different. One is a glass sphere (dia. 17”) and the other is a titanium sphere (dia. 500). The OBMs measure three orthogonal components of time-variation of the magnetic field, two orthogonal components of the instrumental tilt, and the instrumental temperature at seafloor. Each magnetic field variation is measured with a fluxgate magnetometer of Bartington Instruments Ltd. and data logger of Clover-tech Corp housed in a pressure resistant titanium cylinder case. Lithium batteries for OBM measurement are also packed within the titanium cylinder case. The sampling rate is 1 minute for the magnetic field variation, and is 5 minute for the instrumental tilt and temperature. The clock of the OBM was synchronized to the GPS clock (UTC) before the deployment in the same manner as OBEM (See 4-1).
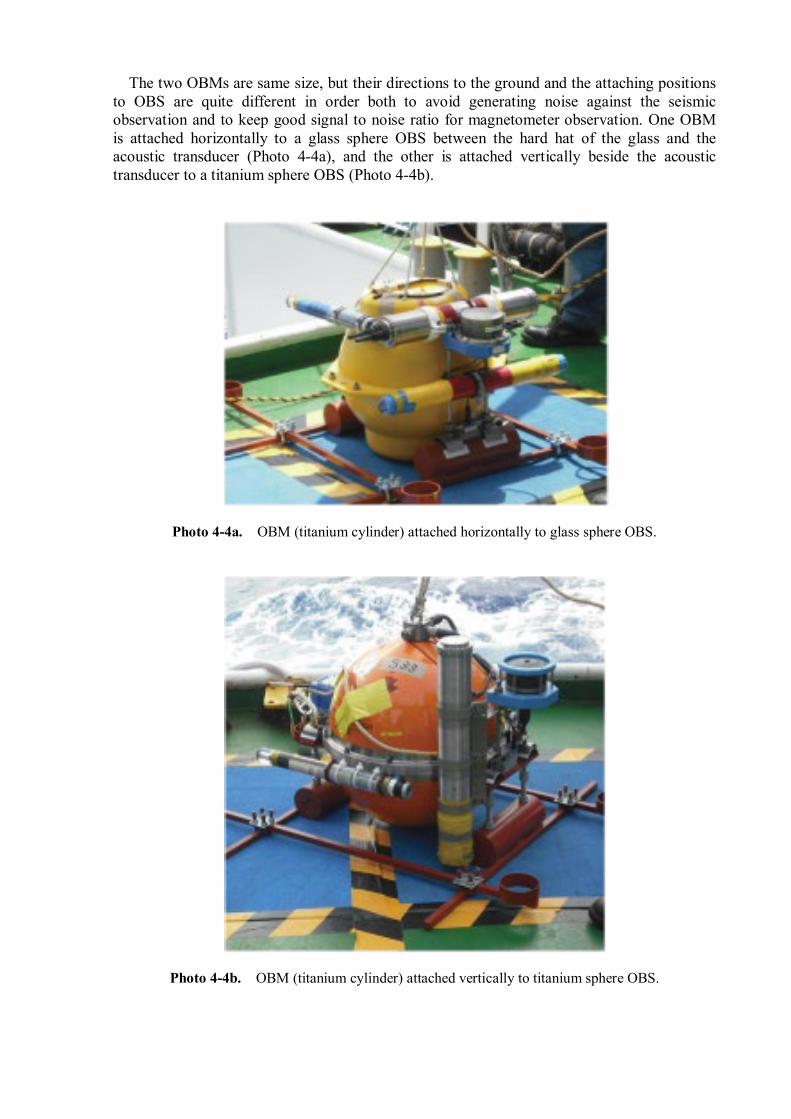
The two OBMs are same size, but their directions to the ground and the attaching positions to OBS are quite different in order both to avoid generating noise against the seismic observation and to keep good signal to noise ratio for magnetometer observation. One OBM is attached horizontally to a glass sphere OBS between the hard hat of the glass and the acoustic transducer (Photo 4-4a), and the other is attached vertically beside the acoustic transducer to a titanium sphere OBS (Photo 4-4b).
Photo 4-4a. OBM (titanium cylinder) attached horizontally to glass sphere OBS.
Photo 4-4b. OBM (titanium cylinder) attached vertically to titanium sphere OBS.
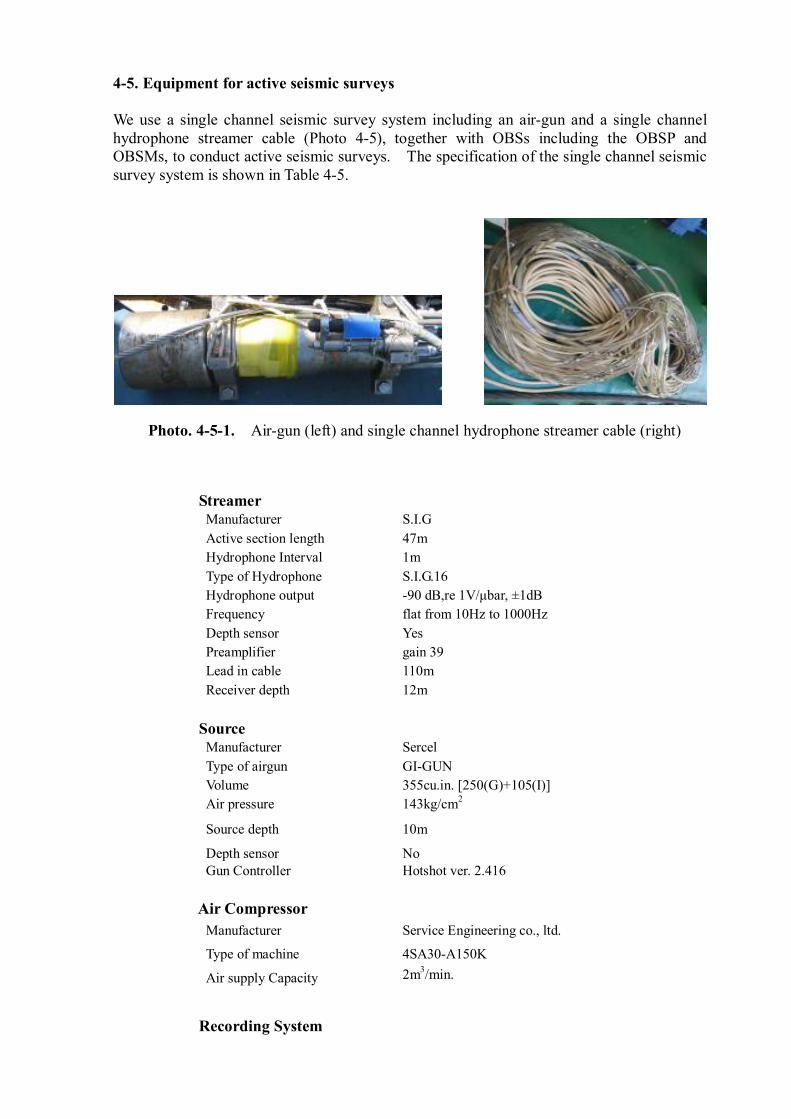
4-5. Equipment for active seismic surveys We use a single channel seismic survey system including an air-gun and a single channel hydrophone streamer cable (Photo 4-5), together with OBSs including the OBSP and OBSMs, to conduct active seismic surveys. The specification of the single channel seismic survey system is shown in Table 4-5.
Photo. 4-5-1. Air-gun (left) and single channel hydrophone streamer cable (right)
Streamer Manufacturer S.I.G Active section length 47m Hydrophone Interval 1m Type of Hydrophone S.I.G.16 Hydrophone output -90 dB,re 1V/μbar, ±1dB Frequency flat from 10Hz to 1000Hz Depth sensor Yes Preamplifier gain 39 Lead in cable 110m Receiver depth 12m Source Manufacturer Sercel Type of airgun GI-GUN Volume 355cu.in. [250(G)+105(I)] Air pressure 143kg/cm2
Source depth 10m
Depth sensor No Gun Controller Hotshot ver. 2.416
Air Compressor Manufacturer Service Engineering co., ltd.
Type of machine 4SA30-A150K
Air supply Capacity 2m3/min.
Recording System
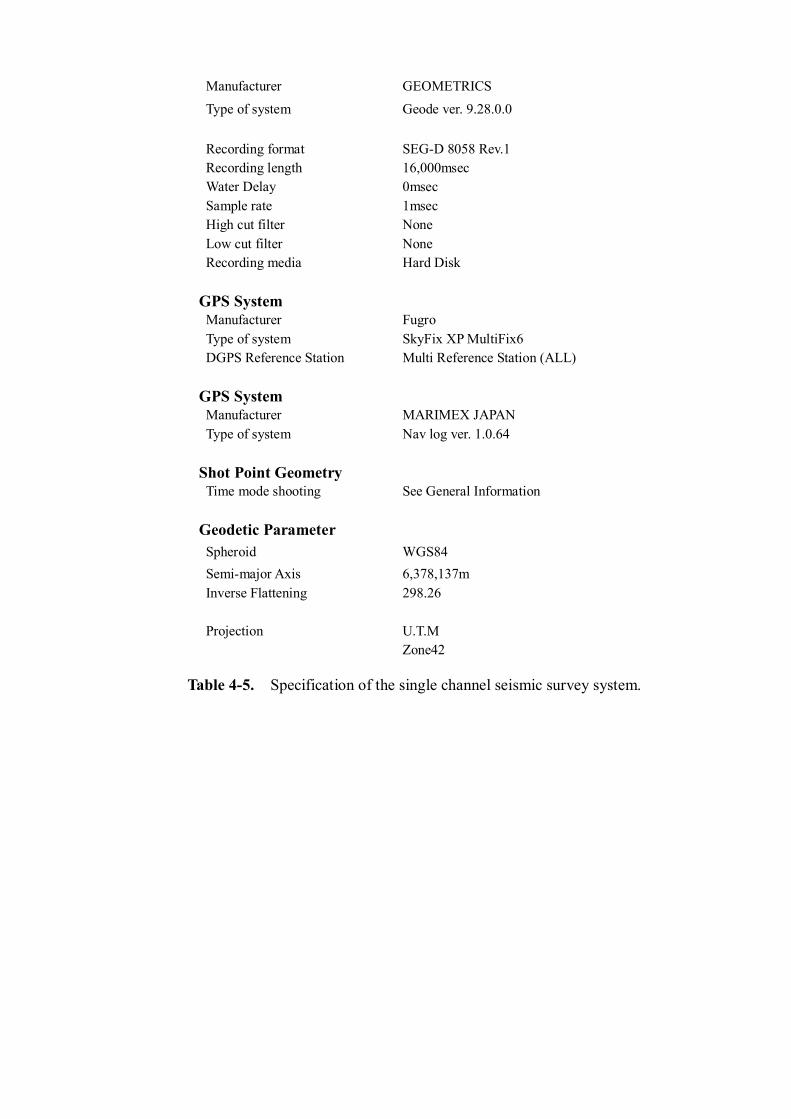
Manufacturer GEOMETRICS Type of system Geode ver. 9.28.0.0 Recording format SEG-D 8058 Rev.1 Recording length 16,000msec Water Delay 0msec Sample rate 1msec High cut filter None Low cut filter None Recording media Hard Disk GPS System Manufacturer Fugro Type of system SkyFix XP MultiFix6 DGPS Reference Station Multi Reference Station (ALL) GPS System Manufacturer MARIMEX JAPAN Type of system Nav log ver. 1.0.64 Shot Point Geometry Time mode shooting See General Information Geodetic Parameter Spheroid WGS84 Semi-major Axis 6,378,137m Inverse Flattening 298.26 Projection U.T.M
Zone42
Table 4-5. Specification of the single channel seismic survey system.
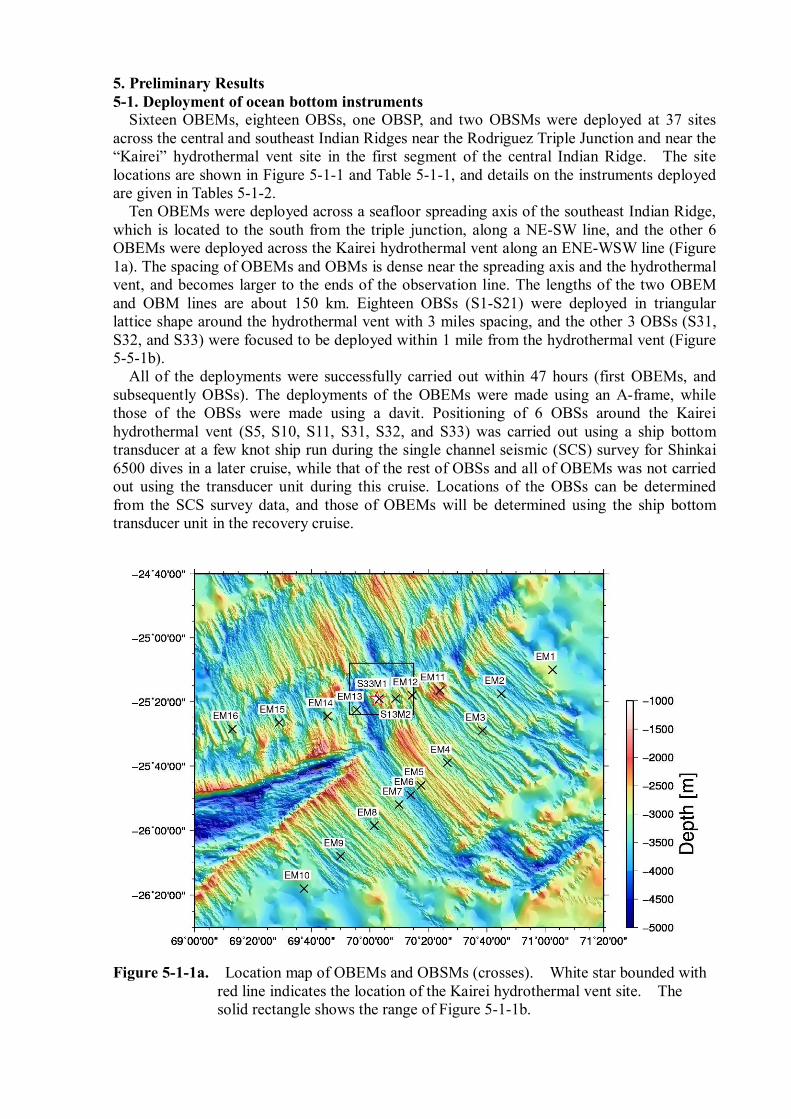
5. Preliminary Results 5-1. Deployment of ocean bottom instruments Sixteen OBEMs, eighteen OBSs, one OBSP, and two OBSMs were deployed at 37 sites across the central and southeast Indian Ridges near the Rodriguez Triple Junction and near the “Kairei” hydrothermal vent site in the first segment of the central Indian Ridge. The site locations are shown in Figure 5-1-1 and Table 5-1-1, and details on the instruments deployed are given in Tables 5-1-2. Ten OBEMs were deployed across a seafloor spreading axis of the southeast Indian Ridge, which is located to the south from the triple junction, along a NE-SW line, and the other 6 OBEMs were deployed across the Kairei hydrothermal vent along an ENE-WSW line (Figure 1a). The spacing of OBEMs and OBMs is dense near the spreading axis and the hydrothermal vent, and becomes larger to the ends of the observation line. The lengths of the two OBEM and OBM lines are about 150 km. Eighteen OBSs (S1-S21) were deployed in triangular lattice shape around the hydrothermal vent with 3 miles spacing, and the other 3 OBSs (S31, S32, and S33) were focused to be deployed within 1 mile from the hydrothermal vent (Figure 5-5-1b). All of the deployments were successfully carried out within 47 hours (first OBEMs, and subsequently OBSs). The deployments of the OBEMs were made using an A-frame, while those of the OBSs were made using a davit. Positioning of 6 OBSs around the Kairei hydrothermal vent (S5, S10, S11, S31, S32, and S33) was carried out using a ship bottom transducer at a few knot ship run during the single channel seismic (SCS) survey for Shinkai 6500 dives in a later cruise, while that of the rest of OBSs and all of OBEMs was not carried out using the transducer unit during this cruise. Locations of the OBSs can be determined from the SCS survey data, and those of OBEMs will be determined using the ship bottom transducer unit in the recovery cruise.
Figure 5-1-1a. Location map of OBEMs and OBSMs (crosses). White star bounded with
red line indicates the location of the Kairei hydrothermal vent site. The solid rectangle shows the range of Figure 5-1-1b.
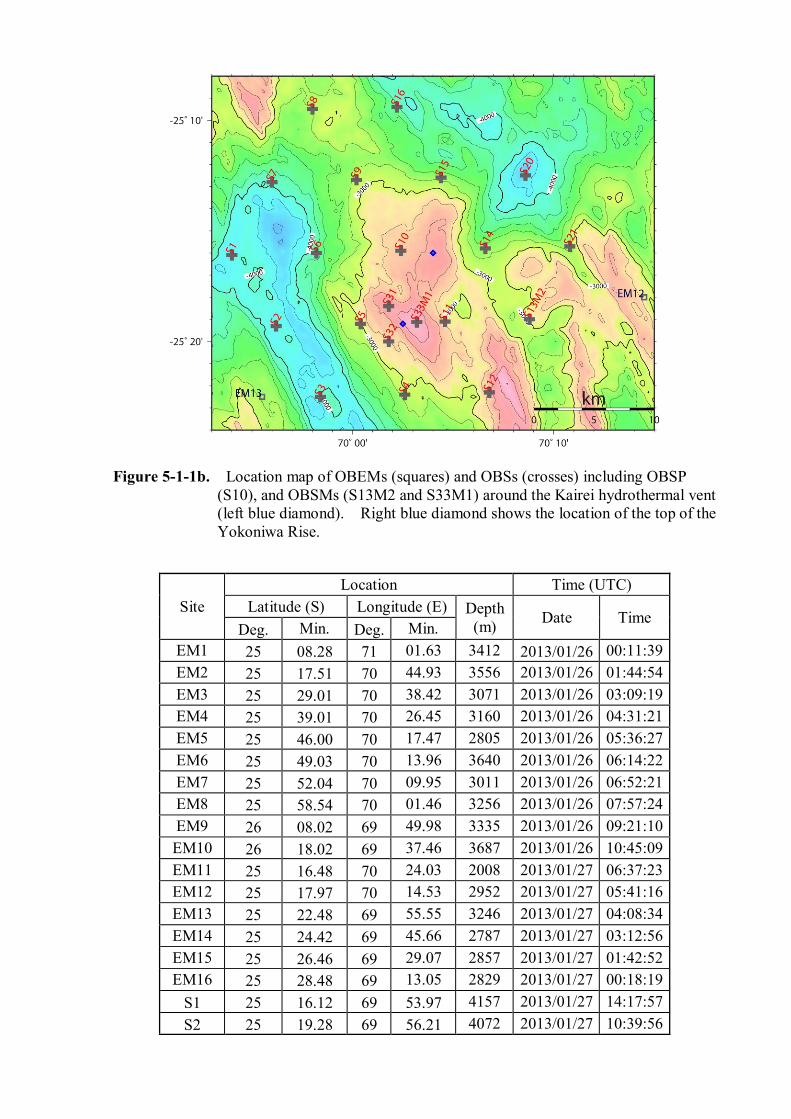
Figure 5-1-1b. Location map of OBEMs (squares) and OBSs (crosses) including OBSP (S10), and OBSMs (S13M2 and S33M1) around the Kairei hydrothermal vent (left blue diamond). Right blue diamond shows the location of the top of the Yokoniwa Rise.
Site Location Time (UTC)
Latitude (S) Longitude (E) Depth (m) Date Time
Deg. Min. Deg. Min. EM1 25 08.28 71 01.63 3412 2013/01/26 00:11:39 EM2 25 17.51 70 44.93 3556 2013/01/26 01:44:54 EM3 25 29.01 70 38.42 3071 2013/01/26 03:09:19 EM4 25 39.01 70 26.45 3160 2013/01/26 04:31:21 EM5 25 46.00 70 17.47 2805 2013/01/26 05:36:27 EM6 25 49.03 70 13.96 3640 2013/01/26 06:14:22 EM7 25 52.04 70 09.95 3011 2013/01/26 06:52:21 EM8 25 58.54 70 01.46 3256 2013/01/26 07:57:24 EM9 26 08.02 69 49.98 3335 2013/01/26 09:21:10 EM10 26 18.02 69 37.46 3687 2013/01/26 10:45:09 EM11 25 16.48 70 24.03 2008 2013/01/27 06:37:23 EM12 25 17.97 70 14.53 2952 2013/01/27 05:41:16 EM13 25 22.48 69 55.55 3246 2013/01/27 04:08:34 EM14 25 24.42 69 45.66 2787 2013/01/27 03:12:56 EM15 25 26.46 69 29.07 2857 2013/01/27 01:42:52 EM16 25 28.48 69 13.05 2829 2013/01/27 00:18:19
S1 25 16.12 69 53.97 4157 2013/01/27 14:17:57 S2 25 19.28 69 56.21 4072 2013/01/27 10:39:56
S3 25 22.51 69 58.36 4035 2013/01/27 10:08:42 S4 25 22.41 70 02.56 3110 2013/01/27 09:40:44 S5 25 19.17 70 00.44 2972 2013/01/27 11:12:57 S6 25 16.02 69 58.19 3862 2013/01/27 13:51:40 S7 25 12.80 69 56.05 3912 2013/01/27 14:48:30 S8 25 09.49 69 58.04 3167 2013/01/27 15:51:23 S9 25 12.71 70 00.24 3073 2013/01/27 15:18:45
S10P1 25 15.92 70 02.37 2726 2013/01/27 13:25:44 S11 25 19.07 70 04.64 2893 2013/01/27 12:27:41 S12 25 22.30 70 06.75 2729 2013/01/27 09:13:50
S13M2 25 18.97 70 08.83 2924 2013/01/27 08:42:15 S14 25 15.77 70 06.64 3293 2013/01/27 12:55:29 S15 25 12.60 70 04.44 3219 2013/01/27 16:54:38 S16 25 09.40 70 02.24 3788 2013/01/27 16:22:54 S20 25 12.51 70 08.64 4314 2013/01/27 17:25:09 S21 25 15.70 70 10.83 3213 2013/01/27 08:01:04 S31 25 18.39 70 01.83 2425 2013/01/27 11:53:19 S32 25 19.99 70 01.83 2827 2013/01/27 11:33:13
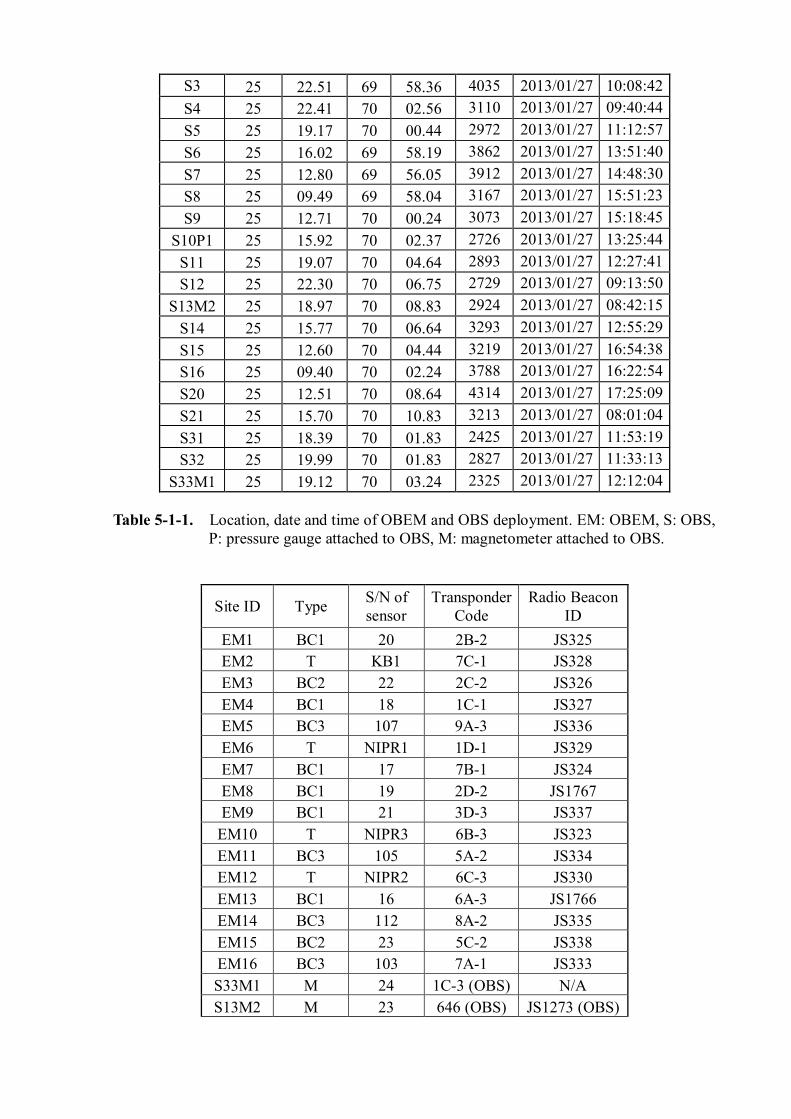
S33M1 25 19.12 70 03.24 2325 2013/01/27 12:12:04 Table 5-1-1. Location, date and time of OBEM and OBS deployment. EM: OBEM, S: OBS,
P: pressure gauge attached to OBS, M: magnetometer attached to OBS.
Site ID Type S/N of sensor
Transponder Code
Radio Beacon ID
EM1 BC1 20 2B-2 JS325 EM2 T KB1 7C-1 JS328 EM3 BC2 22 2C-2 JS326 EM4 BC1 18 1C-1 JS327 EM5 BC3 107 9A-3 JS336 EM6 T NIPR1 1D-1 JS329 EM7 BC1 17 7B-1 JS324 EM8 BC1 19 2D-2 JS1767 EM9 BC1 21 3D-3 JS337
EM10 T NIPR3 6B-3 JS323 EM11 BC3 105 5A-2 JS334 EM12 T NIPR2 6C-3 JS330 EM13 BC1 16 6A-3 JS1766 EM14 BC3 112 8A-2 JS335 EM15 BC2 23 5C-2 JS338 EM16 BC3 103 7A-1 JS333 S33M1 M 24 1C-3 (OBS) N/A S13M2 M 23 646 (OBS) JS1273 (OBS)
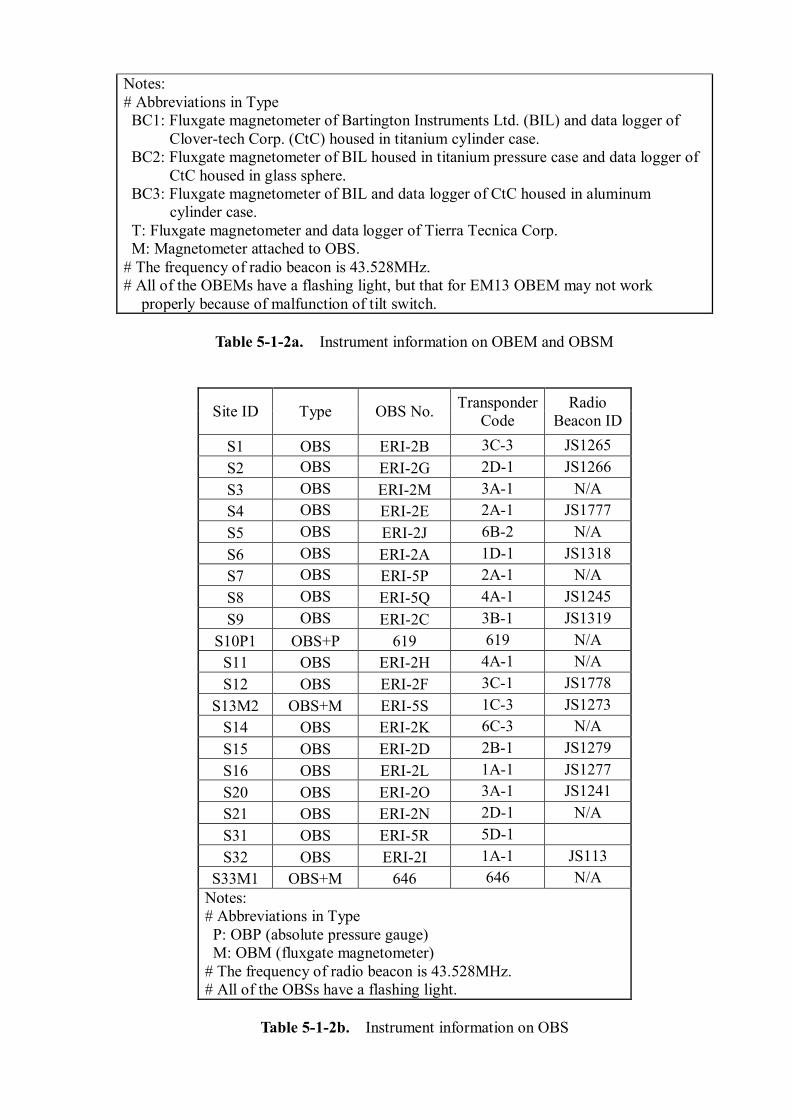
Notes: # Abbreviations in Type BC1: Fluxgate magnetometer of Bartington Instruments Ltd. (BIL) and data logger of
Clover-tech Corp. (CtC) housed in titanium cylinder case. BC2: Fluxgate magnetometer of BIL housed in titanium pressure case and data logger of
CtC housed in glass sphere. BC3: Fluxgate magnetometer of BIL and data logger of CtC housed in aluminum
cylinder case. T: Fluxgate magnetometer and data logger of Tierra Tecnica Corp. M: Magnetometer attached to OBS. # The frequency of radio beacon is 43.528MHz. # All of the OBEMs have a flashing light, but that for EM13 OBEM may not work
properly because of malfunction of tilt switch.
Table 5-1-2a. Instrument information on OBEM and OBSM
Site ID Type OBS No. Transponder Code
Radio Beacon ID
S1 OBS ERI-2B 3C-3 JS1265 S2 OBS ERI-2G 2D-1 JS1266 S3 OBS ERI-2M 3A-1 N/A S4 OBS ERI-2E 2A-1 JS1777 S5 OBS ERI-2J 6B-2 N/A S6 OBS ERI-2A 1D-1 JS1318 S7 OBS ERI-5P 2A-1 N/A S8 OBS ERI-5Q 4A-1 JS1245 S9 OBS ERI-2C 3B-1 JS1319
S10P1 OBS+P 619 619 N/A S11 OBS ERI-2H 4A-1 N/A S12 OBS ERI-2F 3C-1 JS1778
S13M2 OBS+M ERI-5S 1C-3 JS1273 S14 OBS ERI-2K 6C-3 N/A S15 OBS ERI-2D 2B-1 JS1279 S16 OBS ERI-2L 1A-1 JS1277 S20 OBS ERI-2O 3A-1 JS1241 S21 OBS ERI-2N 2D-1 N/A S31 OBS ERI-5R 5D-1 S32 OBS ERI-2I 1A-1 JS113
S33M1 OBS+M 646 646 N/A Notes: # Abbreviations in Type P: OBP (absolute pressure gauge) M: OBM (fluxgate magnetometer) # The frequency of radio beacon is 43.528MHz. # All of the OBSs have a flashing light.
Table 5-1-2b. Instrument information on OBS
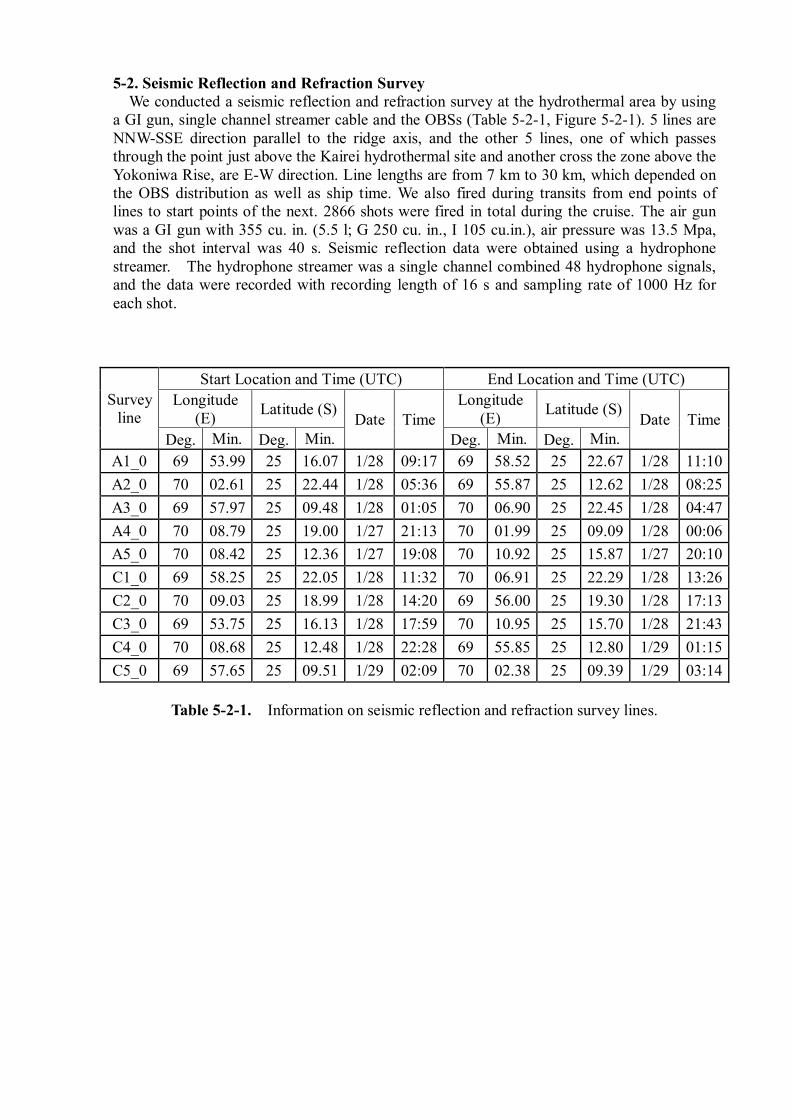
5-2. Seismic Reflection and Refraction Survey We conducted a seismic reflection and refraction survey at the hydrothermal area by using a GI gun, single channel streamer cable and the OBSs (Table 5-2-1, Figure 5-2-1). 5 lines are NNW-SSE direction parallel to the ridge axis, and the other 5 lines, one of which passes through the point just above the Kairei hydrothermal site and another cross the zone above the Yokoniwa Rise, are E-W direction. Line lengths are from 7 km to 30 km, which depended on the OBS distribution as well as ship time. We also fired during transits from end points of lines to start points of the next. 2866 shots were fired in total during the cruise. The air gun was a GI gun with 355 cu. in. (5.5 l; G 250 cu. in., I 105 cu.in.), air pressure was 13.5 Mpa, and the shot interval was 40 s. Seismic reflection data were obtained using a hydrophone streamer. The hydrophone streamer was a single channel combined 48 hydrophone signals, and the data were recorded with recording length of 16 s and sampling rate of 1000 Hz for each shot.
Survey line
Start Location and Time (UTC) End Location and Time (UTC) Longitude
(E) Latitude (S) Date Time
Longitude (E) Latitude (S)
Date Time Deg. Min. Deg. Min. Deg. Min. Deg. Min.
A1_0 69 53.99 25 16.07 1/28 09:17 69 58.52 25 22.67 1/28 11:10 A2_0 70 02.61 25 22.44 1/28 05:36 69 55.87 25 12.62 1/28 08:25 A3_0 69 57.97 25 09.48 1/28 01:05 70 06.90 25 22.45 1/28 04:47 A4_0 70 08.79 25 19.00 1/27 21:13 70 01.99 25 09.09 1/28 00:06 A5_0 70 08.42 25 12.36 1/27 19:08 70 10.92 25 15.87 1/27 20:10 C1_0 69 58.25 25 22.05 1/28 11:32 70 06.91 25 22.29 1/28 13:26 C2_0 70 09.03 25 18.99 1/28 14:20 69 56.00 25 19.30 1/28 17:13 C3_0 69 53.75 25 16.13 1/28 17:59 70 10.95 25 15.70 1/28 21:43 C4_0 70 08.68 25 12.48 1/28 22:28 69 55.85 25 12.80 1/29 01:15 C5_0 69 57.65 25 09.51 1/29 02:09 70 02.38 25 09.39 1/29 03:14
Table 5-2-1. Information on seismic reflection and refraction survey lines.
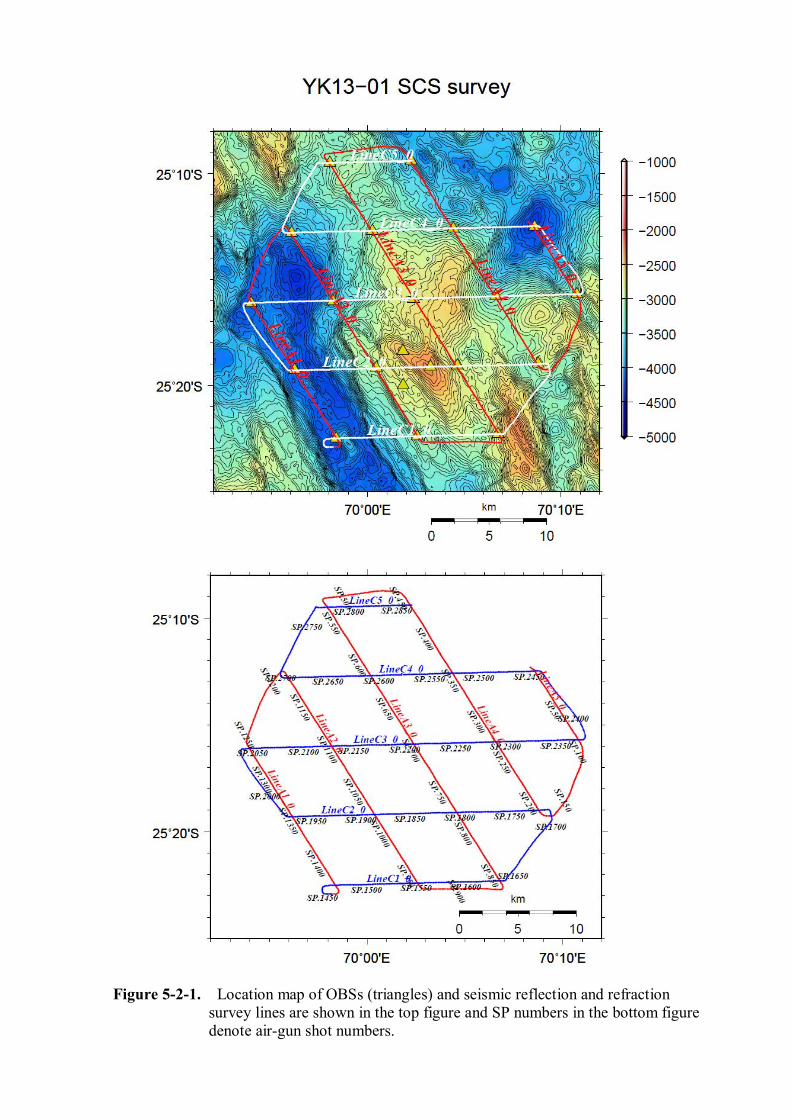
Figure 5-2-1. Location map of OBSs (triangles) and seismic reflection and refraction
survey lines are shown in the top figure and SP numbers in the bottom figure denote air-gun shot numbers.
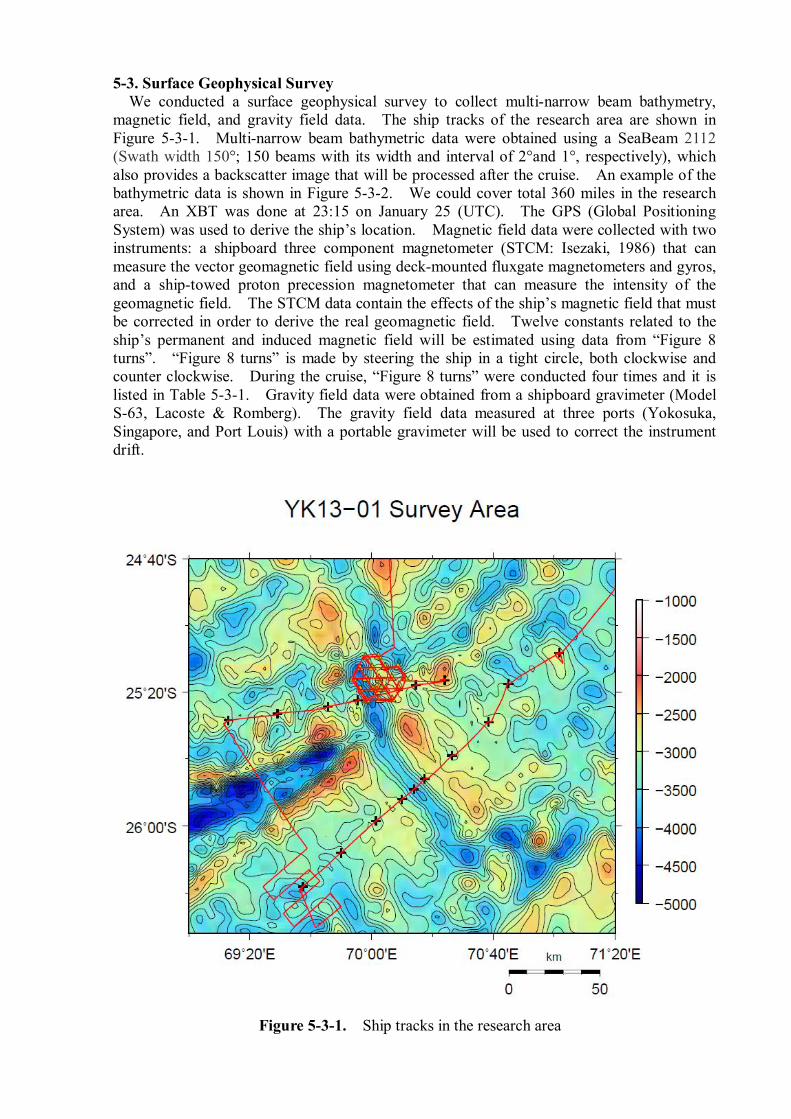
5-3. Surface Geophysical Survey We conducted a surface geophysical survey to collect multi-narrow beam bathymetry, magnetic field, and gravity field data. The ship tracks of the research area are shown in Figure 5-3-1. Multi-narrow beam bathymetric data were obtained using a SeaBeam 2112 (Swath width 150°; 150 beams with its width and interval of 2°and 1°, respectively), which also provides a backscatter image that will be processed after the cruise. An example of the bathymetric data is shown in Figure 5-3-2. We could cover total 360 miles in the research area. An XBT was done at 23:15 on January 25 (UTC). The GPS (Global Positioning System) was used to derive the ship’s location. Magnetic field data were collected with two instruments: a shipboard three component magnetometer (STCM: Isezaki, 1986) that can measure the vector geomagnetic field using deck-mounted fluxgate magnetometers and gyros, and a ship-towed proton precession magnetometer that can measure the intensity of the geomagnetic field. The STCM data contain the effects of the ship’s magnetic field that must be corrected in order to derive the real geomagnetic field. Twelve constants related to the ship’s permanent and induced magnetic field will be estimated using data from “Figure 8 turns”. “Figure 8 turns” is made by steering the ship in a tight circle, both clockwise and counter clockwise. During the cruise, “Figure 8 turns” were conducted four times and it is listed in Table 5-3-1. Gravity field data were obtained from a shipboard gravimeter (Model S-63, Lacoste & Romberg). The gravity field data measured at three ports (Yokosuka, Singapore, and Port Louis) with a portable gravimeter will be used to correct the instrument drift.
Figure 5-3-1. Ship tracks in the research area
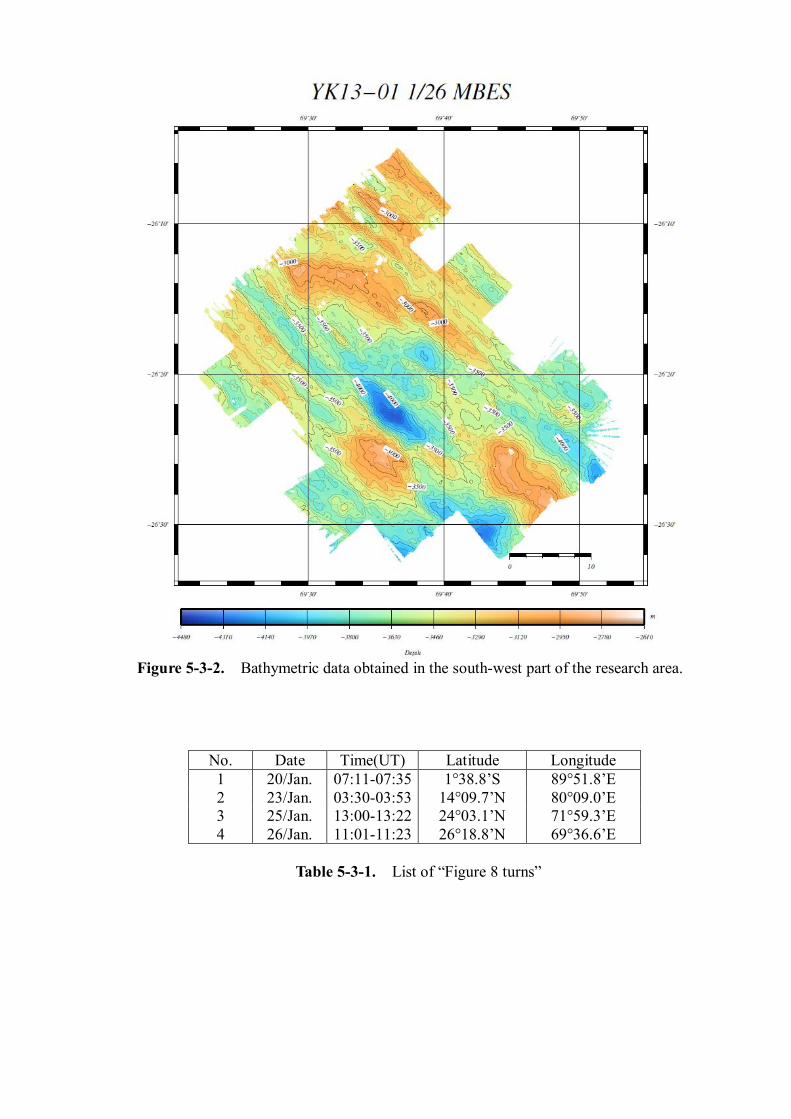
Figure 5-3-2. Bathymetric data obtained in the south-west part of the research area.
No. Date Time(UT) Latitude Longitude 1 20/Jan. 07:11-07:35 1°38.8’S 89°51.8’E 2 23/Jan. 03:30-03:53 14°09.7’N 80°09.0’E 3 25/Jan. 13:00-13:22 24°03.1’N 71°59.3’E 4 26/Jan. 11:01-11:23 26°18.8’N 69°36.6’E
Table 5-3-1. List of “Figure 8 turns”
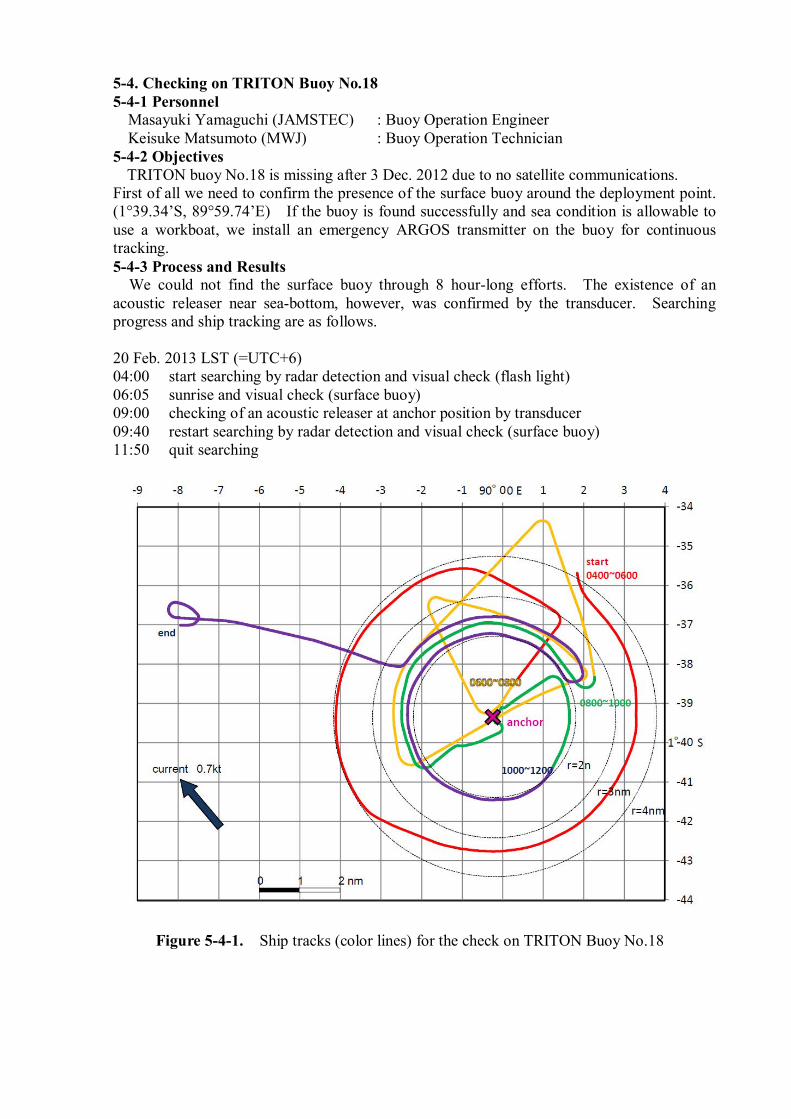
5-4. Checking on TRITON Buoy No.18 5-4-1 Personnel
Masayuki Yamaguchi (JAMSTEC) : Buoy Operation Engineer Keisuke Matsumoto (MWJ) : Buoy Operation Technician
5-4-2 Objectives TRITON buoy No.18 is missing after 3 Dec. 2012 due to no satellite communications.
First of all we need to confirm the presence of the surface buoy around the deployment point. (1°39.34’S, 89°59.74’E) If the buoy is found successfully and sea condition is allowable to use a workboat, we install an emergency ARGOS transmitter on the buoy for continuous tracking. 5-4-3 Process and Results
We could not find the surface buoy through 8 hour-long efforts. The existence of an acoustic releaser near sea-bottom, however, was confirmed by the transducer. Searching progress and ship tracking are as follows. 20 Feb. 2013 LST (=UTC+6) 04:00 start searching by radar detection and visual check (flash light) 06:05 sunrise and visual check (surface buoy) 09:00 checking of an acoustic releaser at anchor position by transducer 09:40 restart searching by radar detection and visual check (surface buoy) 11:50 quit searching
Figure 5-4-1. Ship tracks (color lines) for the check on TRITON Buoy No.18

6. Summary We successfully deployed sixteen OBEMs, eighteen OBSs, one OBSP, and two OBSMs across the central and southeast Indian Ridges near the Rodriguez Triple Junction and near the “Kairei” hydrothermal vent site in the first segment of the central Indian Ridge. We started our observation at the ocean bottom; the measurement of magnetic and electric field variations by the OBEMs and OBSMs and seismic observation by the OBSs including the OBSP and OBSMs. The observation continues up to the recovery of these instruments during another Yokosuka cruise in this March. We also conducted active seismic surveys to investigate seismic velocity structure using the OBSs, an air-gun, and a single channel hydrophone streamer. Further, we conducted surface geophysical survey to collect multi-narrow beam bathymetry, magnetic field, and gravity field data mainly during night and transit times, which cover total 360 miles in the research area. The observed data will be analyzed to derive upper mantle structure, crustal structure, hypocenter distribution, and tectonic history, which will provide important constraint on geodynamics of this seafloor-spreading system together with hydrothermal activities. Moreover, we checked the TRITON buoy No.18 that has been missing since 3 Dec. 2012, and we found that only the acoustic releaser near sea-bottom exists and that the surface buoy was probably lost. Acknowledgement We gratefully recognize the efforts of the officers and crew (Shinya Ryono, captain) of the R/V Yokosuka during the cruise. We thank all the support staffs in JAMSTEC. This research was supported by the scientific program “TAIGA (Trans-crustal Advection and In-situ reaction of Global sub-seafloor Aquifer)” sponsored by the Ministry of Education, Culture, Sports, Science and Technology (MEXT), Japan. Notice on using This cruise report is a preliminary documentation that was written at the end of the cruise. This report may not be corrected even if changes on contents (i.e. taxonomic classifications) may be found after its publication. This report may also be changed without notice. Data on this cruise report may be raw or unprocessed. If you are going to use or to refer to the data written on this report, please ask the Chief Scientist for the latest information. Users of data or results on this cruise report are requested to submit their results to the Data Management Group of JAMSTEC.