ON A ROBUST FOUNDATION - Sasol | our competitive advantage ROBUST FOUNDATION Our diligent and...
46
SASOL LIMITED Integrated Report 30 June 2017 ON A ROBUST FOUNDATION
Transcript of ON A ROBUST FOUNDATION - Sasol | our competitive advantage ROBUST FOUNDATION Our diligent and...

SASOL LIMITEDIntegrated Report30 June 2017
ON A ROBUST FOUNDATION

Our
str
ateg
ic b
usin
ess
cont
ext
How
we
crea
te v
alue
Our
gov
erna
nce
Our
per
form
ance
revi
ewA
ddit
iona
l inf
orm
atio
nW
ho w
e ar
e
ENA
BLE
D B
Y:
Our strong focus on maintaining and enhancing our existing diversified asset base across the world has ensured that our foundation businesses run safely, reliably and optimally
Through our cost-containment, capital-conservation and cash-savings programmes, we have achieved a competitive market position
We have a diversified asset base to reduce risk exposure and to secure access to distribution channels globally
We have a strong balance sheet despite the volatile macro-economic environment
The resilience and diligence of our values-driven, high-performing employees who are committed to value creation for all our key stakeholders
SASOL OF TODAYBUILDING ON OUR ROBUST FOUNDATION...
$40/bbl
WE ARE ABLE TO OPERATE PROFITABLY AND SUSTAINABLY AT:
SASOL OF THE FUTUREAs a leading integrated global chemical and energy company, proudly rooted in our South African heritage, delivering superior value to our stakeholders, we aim to...
• Focus on continuous improvement to address the structural shift in energy prices by sustainably improving our margin contribution and cost base delivery
• Actively manage the balance sheet to address external volatilities and deliver value through the commodity cycles
• Use digital solutions to drive cost competitiveness and deliver value
• Continuously assess the efficiency and effectiveness of our operations against best in class global benchmarks
• Use our capital allocation model to enhance business value
• Continuously review our asset base to ensure that we can increase our return on invested capital
• Work with governments and other stakeholders to manage the regulatory impact on our businesses
• Develop our people and drive transformation to deliver economic value to our shareholders and stakeholders
• The LCCP, once completed, will reshape Sasol as a chemicals company and diversify our earnings both from a geographical and product slate perspective
• Progress with the PSA development in Mozambique to ensure our future gas supply is on track, and within our approved budget and schedule. We expect to complete our 13-well drilling programme by the end of 2018
Improve project execution by
implementing lessons learnt from previous
projects
Deliver superior
returns to shareholders and
stakeholders
Further improve our competitive advantage
ROBUSTFOUNDATIONOur diligent and continued focus on business fundamentals provides a robust foundation for Sasol to deliver sustainable value over the long term
OUR
Sasol Integrated Report 2017 1
Sasol is entering an exciting new era of driving value-based growth for shareholders and stakeholders. Driven by the Joint CEOs and the need to reshape the future of Sasol, we are in the process of transforming and repositioning the company by refocusing our vision, defi ning our purpose and refreshing our values.
OUR VISION
To be a leading integrated global chemical and energy company, proudly rooted in our South African heritage, delivering superior value to our stakeholders.
OUR PURPOSE
To create superior value for our customers, shareholders and other stakeholders. Through our talented people, we use selected technologies to safely and sustainably source, produce and market chemical and energy products competitively.
OUR VALUES
We ensure that SAFETY, HEALTH AND ENVIRONMENT is a top priority
We care for OUR PEOPLE and support their development
We value and promote DIVERSITY AND INCLUSION
We act with RESPECT AND INTEGRITY at all times
We COMPLY with all applicable legal requirements
We take OWNERSHIP AND ACCOUNTABILITY for our individual and team performance
We deliver what we promise to our CUSTOMERS, SHAREHOLDERS AND OTHER STAKEHOLDERS

CONTENTS
The Sasol Limited Board (the Board) is ultimately responsible to ensure the integrity of Sasol’s integrated reporting. We confirm that the 2017 Integrated Report addresses all material issues and matters, and fairly represents the Group’s integrated performance. The Audit Committee, as delegated by the Board, approved this report and authorised its publication on 28 August 2017.
Signed on behalf of the Board.
Directors' approval
MSV GantshoChairman of the Board
B NqwababaJoint President and Chief Executive Officer
SR CornellJoint President and Chief Executive Officer
P VictorChief Financial Officer
Our Integrated Report provides cross-references to our suite of reporting publications:
Form 20-F Our annual report issued in accordance with the Securities Exchange Act of 1934.
Sustainability Reporting Supporting information to the Integrated Report. Prepared in accordance with the GRI, Sustainability Reporting Standards.
Annual Financial Statements The fi nancial statements and remuneration report, prepared in accordance with International Financial Reporting Standards, together with the report of the Audit Committee.
Inside front cover.IFC
These reports are available on our website, www.sasol.com, or on request from Sasol Corporate Affairs. Contact details are on page 84.
C BeggsChairman of theAudit Committee
C B
OUR PERFORMANCE REVIEWChief Financial Officer’s review
76-81 Operational reviews
Our investment case
84 Contact details and shareholders’ diary
IBC Forward-looking information; Abbreviations
WHO WE AREChairman’s statement
05 Performance overview
06 Understanding our business
07 How we structure ourselves to create value
08-09 Leveraging growth through our global presence
HOW WE CREATE VALUE10-11 Our integrated value chain
12-13 Using the six capitals to create value
14-15 Scoreboard of our six capitals
16-17 External environment which impacts our ability to create value
OUR STRATEGIC BUSINESS CONTEXTStatement of the Joint Presidents and Chief Executive Officers
22-23 Our strategy
24-25 Our key performance scorecard and indicators
26-27 Delivering value through our capital allocation principles
28-35 Material matters
36-37 Building trust-based relationships to enable growth
38-39 Engaging with our stakeholders
40-43 Risk management
OUR GOVERNANCE44-47 Our governance framework
48-51 Our Board of Directors
52-53 Responsibilities of our Group Executive Committee
54-61 Summarised report of the Remuneration Committee
The Integrated Report is our primary report to stakeholders.
REPORTING BOUNDARY FOR THE INTEGRATED REPORT (risks, opportunities and outcomes)
FINANCIAL REPORTING ENTITY (control and significant influence)
EmployeesBusiness partners
Customers Suppliers Communities Others
Investments (other forms)Joint arrangements Subsidiaries
The Board, with the support of the Audit Committee, is ultimately responsible for Sasol’s system of internal control, designed to identify, evaluate, manage and provide reasonable assurance against material misstatement and loss. We apply a combined assurance model, which seeks to optimise the assurance obtained from management and internal and external assurance providers while fostering a strong ethical climate and mechanisms to ensure compliance.Through the enterprise risk management approach, approved by the Board, management identifies key risks facing Sasol and implements the necessary internal controls. The process is monitored and evaluated under the direction of internal audit, while external audit covers key controls and accounting matters in the course of their audit. Other levels of external assurance is obtained as and when where required.The Board and Audit Committee assessed the effectiveness of controls for the year ended 30 June 2017 as satisfactory, principally through a process of management self-assessment, including formal confirmation from executive management and also considered reports from internal audit, external auditor and other assurance providers.
INTERNAL CONTROL AND COMBINED ASSURANCE FRAMEWORK
COMBINED ASSURANCE
Management
External assurance providers
Internal assurance providers
ABOUT THIS REPORT
Our Integrated Report aims to provide a balanced, accurate and accessible assessment of our strategy, performance and opportunities in relation to material financial, economic, social, environmental and governance issues. This year, we continue to provide a more detailed discussion on the material matters (see page 28) which could substantially affect our ability to create value in the short, medium or long term. These matters form the anchor of the content throughout this report.
Committed to growing shareholder value sustainably, our Joint Presidents and Chief Executive Officers (CEOs) are accountable for the successful implementation of the Group strategy and the overall management and performance of Sasol.
The Group Executive Committee is responsible for developing the strategy and manages the business in an integrated manner, taking into consideration available resources and the interests of all our stakeholders. The Board is accountable to approve the strategy.
In preparing our Integrated Report, we were guided by the International Integrated Reporting Framework, published by the International Integrated Reporting Council in December 2013. Our sustainability reporting (SR) with supporting information to the Integrated Report, is informed by the GRI Sustainability Reporting Standards to ensure the contents are aligned with the material matters impacting our ability to create value.
The Board governs the Group’s disclosure control processes, including the integrity of Sasol’s annual reports. All significant items are reported on a like-for-like basis, with no major or significant restatements. Our disclosure and reporting processes and suite of publications are aligned with the disclosure requirements of the Companies Act 71 of 2008, the Johannesburg Stock Exchange, the New York Stock Exchange, the Securities and Exchange Commission and the integrated reporting requirements of the King Code of Governance Principles for South Africa 2016 (King IV™). Our controls and processes in place to comply with section 404 of the Sarbanes-Oxley Act, 2002 are subject to internal and external audit assessment.

Sasol Integrated Report 2017 3
Our
str
ateg
ic b
usin
ess
cont
ext
How
we
crea
te v
alue
Our
gov
erna
nce
Our
per
form
ance
revi
ewA
ddit
iona
l inf
orm
atio
nW
ho w
e ar
e
Dear stakeholder,
The 2017 financial year was characterised by significant changes at a geopolitical level and across the global financial markets. Notwithstanding the turbulent times, Sasol reported a strong business performance across most of the value chain, and despite continued macro-economic and political volatility, Sasol’s core headline earnings increased by 6%.
The collapse of the oil price at the end of 2014 has, undoubtedly, changed the playing field. Our assessment, as articulated in early 2015, maintains that a lower-for-longer oil price environment is likely to remain the reality for the foreseeable future. To mitigate the effects of this, the Sasol management team, supported by the Board, initiated a lower-for-longer oil price Response Plan to proactively conserve cash. Commendable progress has been made in this regard, with total cash conserved at the end of the financial year of R69,4 billion. This brings us close to the upper end of our target range of R65 billion to R75 billion through to the end of the next financial year.
Furthermore, the management team’s foresight to sustainably reduce Sasol’s cost base and bring about a more competitive organisation, with the commencement of our Business Performance Enhancement Programme (BPEP) in 2012, has enabled us to operate profitably and generate healthy free cash flows from our core operations at oil prices of US$40 per barrel. This attests to the underlying resilience of our business and our determination to continue to provide shareholders with a world-class investment.
Owing to these measures, despite a tough macro-economic environment, Sasol’s balance sheet remains strong and has sufficient flexibility. This allows us to manage the company’s gearing and credit rating to ensure we maintain the strength of our balance sheet to fund our growth plans and deliver on our dividend policy.
2017 performance and shareholder distributions Our 2017 performance is testament to the broader Sasol organisation rallying together to drive continued optimisation and efficiency of our operations. This past financial year, we set new production records in our operations in Secunda. We delivered a strong cash flow, prioritised capital spending and lower operating costs and significantly met our cost reduction target a year early.
Our large-scale, US-based Lake Charles Chemicals Project (LCCP) is progressing well according to the revised cost estimate. In parallel, our management team continues to review our group-wide assets to identify opportunities to further enhance performance.
Through the collective effort across the Sasol value chain, we maintained the total dividend at R12,60 per ordinary share through 2017 and the Board remains committed to grow sustainable free cash flow and distributions to our shareholders.
Sasol’s management team, ably led by Joint Presidents and Chief Executive Officers, Messrs Bongani Nqwababa and Stephen Cornell, is assiduously controlling both capital investment and operating expenses, while driving value-based growth in Southern Africa and North America.
Pursuing zero harm I am, personally, deeply saddened to report that this year, five of our colleagues (four Sasol employees and one service provider) lost their lives in work-related incidents. I speak on behalf of the Board and the rest of the Sasol family in extending our deepest condolences to their families, friends and colleagues, and reaffirming Sasol’s unwavering commitment to achieving zero fatalities and injuries. In terms of each fatal incident, the Sasol team has undertaken comprehensive independent investigations, shared the lessons learnt across the Group, implemented appropriate remedial actions, and ensured that the affected families receive care and support.
Given the disappointing trend in fatalities this year, the Board has supported a safety initiative to focus on high-severity injuries associated with high risk tasks. More must be done to prevent the unnecessary and unacceptable loss of life and the Board and management are addressing this challenge with renewed rigour. The Board is confident that Sasol will reverse the fatality trend to align with the ever improving recordable injury trend, the best of which was recorded in 2017.
Enhancing governance Our diverse Board enables an environment in which varied views and learnings can be exchanged as a result of the mix of skills, experience and backgrounds of the executive and non-executive directors interacting as a unitary working group.
Given the importance of the role each director plays, and taking into account factors such as scarce skills, gender diversity and global exposure, which may complicate finding and attracting suitably qualified individuals, the Board has devoted much time in evaluating and updating the succession plan of our directors, without having to wait for an impending vacancy.
The Board strives to ensure that Sasol is governed effectively, with integrity, and in accordance with sound corporate governance practices. Among significant corporate governance developments in the year, and taking into account emerging global trends and Sasol’s strategic direction, details of which are on page 22 and 23, was
CHAIRMAN’S STATEMENT
Sasol Integrated Report 20172
Dr Mandla SV Gantsho
KEY MESSAGES:
2017 performance and shareholder distributions
Pursuing zero harm
Enhancing governance
Communicating on strategy
Increasing total shareholder returnAdvancing transformation and diversity

Sasol Integrated Report 2017 5
Safety Recordable Case Rate (RCR), excluding illnesses, improved to
0,28, regrettably five
fatalities occurred
Lake Charles Chemicals Project is
74% complete, capital
expenditure to date of US$7,5 billion and
tracking revised estimate
Core headline earnings up
6%reflects sustainable
operations
Headline earnings per share down 15% to
R35,15; earnings per share up 54% to R33,36 in line
with market consensus
Sales volumes• Base Chemicals up 3% and Performance
Chemicals up 2%• Liquid fuels sales volumes down 2%
Strong operational performance across most of the value chain• Secunda Synfuels Operations volumes up
1%, to a new record production level• Eurasian operations volumes up 6%,
highest since 2015
Strong cost and cash performance• Cash fixed costs, in real terms, remained
flat for three consecutive years• Achieved R5,4 billion per annum of
sustainable savings from our Business Performance Enhancement Programme, a year earlier than planned
• Delivered cumulative capital conservation cash savings from low oil Response Plan of R69,4 billion
Delivering on our stakeholder commitments• Invested R1,6 billion in skills and socio-
economic development• Over R7 billion spent on preferential
procurement from black-owned enterprises in South Africa
PERFORMANCE OVERVIEW
Our
str
ateg
ic b
usin
ess
cont
ext
How
we
crea
te v
alue
Our
gov
erna
nce
Our
per
form
ance
revi
ewA
ddit
iona
l inf
orm
atio
nW
ho w
e ar
e
the externally facilitated evaluation of the effectiveness and performance of the Board, its committees, individual directors and the chairman.
Taking into account various inputs, including the outcomes of the external assessment, the Board has restructured some of its committees, to ensure focused attention on:
• a wider range of sustainability issues, including those pertaining to the environment and employee wellbeing, and enabling direct and regular stakeholder dialogue, through a reconstituted Safety, Social and Ethics Committee;
• succession planning, diversity and inclusion and compliance, the former Nomination, Governance, Social and Ethics Committee has been reconstituted as the Nomination and Governance Committee; and
• changing market forces and the ability to better leverage technologies to support the overarching corporate strategy, a Digital, Information Management and Hedging Committee was constituted.
Having assumed direct responsibility for the governance of risk, with the dissolution of the Risk and Safety, Health and Environment Committee, the Board will be evaluating the organisational top risks and how these serve to shape and influence Sasol’s longer-term strategy.
Advancing transformation and diversityDiversity and inclusion at all levels of the business are essential to the sustainability of Sasol. In the year, the Board set a target of 30% representation of women directors by 30 June 2019. Calculated as a percentage of the directors, in 2017 this figure rose to 26,7% (from 21,4% in 2016) with the appointment of our newest Board members, Mss Trix Kennealy and Mpho Nkeli. With, respectively, exemplary track records in finance and human resources, we are delighted to have corporate leaders of their calibre on the Board.
Over many years, Sasol has worked to encourage transformation in its broadest sense, most especially in our home base of South Africa.
With the Sasol Inzalo Broad-Based Black Economic Empowerment (B-BBEE) transaction maturing in 2018, we are now investigating the merits of a new B-BBEE transaction with some of our South African-based wholly owned subsidiaries.
Communicating on strategyIn terms of the here and now, the Board remains committed to the near- to medium-term strategy that has defined Sasol’s activities over the past several years. This strategy has been characterised by a shift in focus from volume optimisation to value creation, driven by business excellence programmes, cost base restructuring and enhanced operational efficiencies.
With the scheduled start-up of the first units of the game-changing LCCP in the United States in calender year 2018, the management team is working with the Board to identify Sasol’s growth drivers beyond 2020, which will be communicated during the Group’s capital markets day in November 2017.
Increasing total shareholder returnLooking at total return to shareholders, over the past few years Sasol’s share price has underperformed those of our peers. We believe this to be a reflection of the macro-economic volatility that has impacted our earnings and in some instances, poor capital projection execution, most notably of the LCCP.
To address this, the Board is overseeing the implementation of a number of measures including actively managing the balance sheet to address external volatility, focusing on continuous improvement and to work with governments and other stakeholders to manage the impact of regulations on our business. The Board is confident that these measures will assist in delivering superior returns to our shareholders. As such, in 2016, the Board constituted a dedicated committee, the Capital Investment Committee, to enhance its oversight on capital project execution and asset portfolio optimisation. Furthermore, the Board convened its June 2016 board meeting in Maputo, Mozambique, to engage directly with the government and other stakeholders in that country.
ConclusionThe Board and management team have set out Sasol’s strategic priorities leading up to the end of the decade.
Sasol is a global business operating in 33 countries. To do this effectively over the long term, we need the trust and confidence of our shareholders that we will continue to deliver value. Equally, we rely on the trust and support of the societies we work and operate in – both in South Africa and across the world.
In this, the Board considers the needs of all stakeholders to ensure value is shared appropriately. The Board provides leadership in supporting that Sasol acts ethically and with integrity at all times.
This report, together with our Sustainability Reporting and Annual Financial Statements, demonstrate the tenacity and devotion of Sasol people and the management teams who lead them. At Sasol, we know full well that our longevity is inextricably linked to the success of our many stakeholders – our employees, shareholders, customers, partners, suppliers, governments and communities. Despite the challenging and volatile backdrop, the Board and the management team remain steadfast in our commitment to our stakeholders. Thank you for your unfailing support.
Dr Mandla SV GantshoChairman
28 August 2017
Sasol Integrated Report 20174
CHAIRMAN’S STATEMENT (continued)

HOW WE STRUCTURE OURSELVES TO CREATE VALUEOur businesses and functions are arranged by capabilities along an integrated value chain that draws on each business's unique capabilities and areas of specialisation to enable decision-making as an integrated organisation.
MAKE PRODUCTS
Mining operations
Exploration and Production
International
SOURCE FEEDSTOCK
OPERATING BUSINESS UNITS
Upstream
REGIONAL OPERATING HUBS
Operations
STRATEGIC BUSINESS UNITS
Energy and Chemicals
Energy Chemicals
SELL PRODUCTS
• Mozambique• Canada• Gabon
• Secunda Synfuels• Secunda Chemicals• Sasolburg Operations• Satellite Operations
• Natref Operations• US Operations• Eurasian Operations
• Liquid fuels• Electricity• ORYX GTL• Escravos GTL
• Base Chemicals• Performance
Chemicals
Regional operating hubs
SUPPORTED BY GROUP FUNCTIONS TO ENABLE BUSINESS
• Secunda• Sasolburg
Sasol Integrated Report 2017 7
Our
str
ateg
ic b
usin
ess
cont
ext
How
we
crea
te v
alue
Our
gov
erna
nce
Our
per
form
ance
revi
ewA
ddit
iona
l inf
orm
atio
nW
ho w
e ar
e
MATERIAL MATTERS WHICH IMPACT ON OUR ABILITY TO CREATE VALUE
MACRO-ECONOMIC ENVIRONMENT
The volatile macro-economic environment requires us to maintain and improve our cash-conservation and savings initiatives, while effectively allocating capital for growth projects and improving our competitive position.
HUMAN CAPITAL MANAGEMENT
Promoting safety, diversity and cultural transformation as well as attracting, developing and retaining high-performing people, while engaging all employees and respecting human rights.
DELIVERING VALUE-BASED GROWTH
Driving continuous improvement, harnessing technology and talent, developing a diverse portfolio and embracing more digital solutions enables us to deliver superior value to our stakeholders and ensures long-term sustainability.
COMMITMENT TO OUR COMMUNITIES
Consistently delivering on our commitments to community stakeholders and optimising the impact of our social investment programmes by increasing local content and collaborating more broadly to address social and economic development challenges.
ENVIRONMENTAL SUSTAINABILITY
Securing our licence to operate by driving sustainable air quality, waste and land risk management, responding to the climate change and energy security challenges, promoting water stewardship and ensuring responsible product stewardship.
Refer to page 4 for further details. Refer to page 28 for further details.
CREATING SUSTAINABLE VALUE THROUGH THE DELIVERY ON OUR GROWTH PROJECTS
• Fischer-Tropsch Wax Expansion Project (FTWEP), phase two, reached beneficial operation in March 2017 and is expected to contribute 116kt of hard wax in 2018
• Loopline 2 completed ahead of schedule and below budget, increasing capacity of Mozambique-to-South Africa gas pipeline
• LCCP is progressing well with start-up of the first units forecast in the second half of the 2018 calendar year
• Production Sharing Agreement (PSA) project in Mozambique developing on budget and schedule
• C3 stabilisation yielding higher chemical volumes• Record production volumes at Secunda Synfuels
Sasol Integrated Report 20176
UNDERSTANDING OUR BUSINESS
Sasol is an international integrated chemicals and energy company. Through our talented people, we use selected technologies to safely and sustainably source, produce and market chemical and energy products competitively to create superior value for our customers, shareholders and other stakeholders.
To be a leading integrated global chemical and energy company, proudly rooted in our South African heritage, delivering superior value to our stakeholders.
Upstream• Deliver low-cost feedstock
in Southern Africa
• Grow economically attractive upstream resources in Southern Africa
Operations• Continuously improve existing
asset base and maintain technological lead
• Drive world-class safe operations to support growth
Energy• Optimise liquid fuels
marketing channels
• Deliver selective GTL opportunities and grow lower-carbon power generation
Chemicals• Drive value chain optimisation
• Drive selective growth based on feedstock, market and/or technology advantage
OURSTRATEGY
OURVISION
WHAT DIFFERENTIATES US
OUR KEY COMPETENCIESManaging the balance sheet and creating headroom through cost-containment programmes and RISK-MITIGATION INITIATIVES
DRIVING INNOVATION in our products and customer service
OPERATIONS EXCELLENCE in delivering continuous improvement in volumes
Ability to operate in various environments and geographies, currently 33 COUNTRIES
Our cost COMPETITIVENESS
Our high-performing PEOPLE
Our ability to manage complexintegrated VALUE CHAINS AND PRODUCTION FACILITIES
Our DIVERSE asset portfolio
Our ABILITY TO OPERATE PROFITABLY AND SUSTAINABLY at a $40 oil price
Our TECHNOLOGY
Our ability to respond to a changing BUSINESS ENVIRONMENT
Our robust FOUNDATION businesses

Zambia
Namibia
South Africa
Lesotho
MozambiqueBotswana
Gabon
Nigeria
China
Taiwan
Qatar
United Arab Emirates
India
Japan
Singapore
Malaysia
Australia
Egypt
United Kingdom
France
GermanyBelgium
Spain
Austria
Italy
Slovakia
PolandIreland
Russia
The Netherlands
ASIA
276 employees
R14,76 bn$1,08 bnturnover
R59m direct taxes paid
MIDDLE EAST
42 employees
R5 bn$0,37 bnturnover
Sasol Integrated Report 2017 9
Our
str
ateg
ic b
usin
ess
cont
ext
How
we
crea
te v
alue
Our
gov
erna
nce
Our
per
form
ance
revi
ewA
ddit
iona
l inf
orm
atio
nW
ho w
e ar
e
EUROPE
2 728 employees
R38,06 bn$2,80 bnturnover
R1 152m direct taxes paid
SOUTH AFRICA
26 058 employees
R82 bn$6,02 bnturnover
R4 043m direct taxes paid
REST OF AFRICA
366 employees
R7,36 bn$0,54 bnturnover
R840m direct taxes paid
Brazil
United StatesBermuda
Canada
BelIrela
Capital investments
R60,3 bn28% spent in South Africa
Social investment
R676 million88% spent in South Africa
Operating profi t
R31,7 bnPreferential procurement
R7 bn from black-owned enterprises in South Africa
65%
4%
28%
3%
AmericasSouth AfricaRest of AfricaEurope
Total capital spend
R60,3billion
LEVERAGING GROWTH THROUGH OUR GLOBAL PRESENCE
Sasol Integrated Report 20178
AMERICAS
1 430 employees
R25,23 bn$1,85 bnturnover
R259m direct taxes paid
Investing in our growth

Sasol Integrated Report 2017 11
Our
str
ateg
ic b
usin
ess
cont
ext
How
we
crea
te v
alue
Our
gov
erna
nce
Our
per
form
ance
revi
ewA
ddit
iona
l inf
orm
atio
nW
ho w
e ar
e
Gas and chemical
components
Electricity
Recovery and beneficiationCoal gasification produces co-products for recovery and beneficiation.
Chemical processesChemical intermediates from the FT process are separated, purified and, together with conventional chemical raw materials, converted into a range of final products.
Fuel components
Fuel components
Refine and blendOur GTL diesel is of ultra-high purity and therefore is ideal as a low-emission, premium grade fuel and as a blend stock for upgrading conventionally derived diesels.
Crude oil refinery
Co-products
Refine and blendIn the liquid fuels business, synthetic fuels components are upgraded and marketed together with conventional fuels produced in a refinery from crude oil.
MARKETING AND SELLING OF PRODUCTS
LIQUID FUELSVehicle fuel Jet fuel
METHANE-RICH AND NATURAL GAS
Energy for factories/homes
CHEMICALS (COMMODITY)Polymers
Wax Surfactants
CHEMICALS (HIGH-VALUE)Alumina Alcohols
Ethoxylates
LOWER-CARBON ELECTRICITYGas-to-power
Sasol Integrated Report 201710
Our integrated value chain, centered on our gas-to-liquids, coal-to-liquids and chemical processes, is at the heart of our differentiated value proposition. As we are becoming a more chemicals-biased company, we will continue to leverage off the benefi ts of the value chain as well as improve our processes in ways that ensure safe, reliable and effi cient operations with reduced environmental impacts.
OWN HYDROCARBON
FEEDSTOCK
Gas engine power plant
Lower-carbon electricityAllows us the capacity to cumulatively generate up to 70% of our total internal electricity requirements in South Africa.
Gas andchemical
components
LAB
Wax
LAB, alcohols
Reforming
GAS-TO-LIQUIDS (GTL) PROCESS
COAL-TO-LIQUIDS (CTL) PROCESS
NATURAL GAS
COAL
Sasol Fixed Bed DryBottom
Gasification(Sasol® FBDB™)
SASOL ADVANCEDSYNTHOLTM
REACTOR(SASTM)
High temperature
Wax
Light hydrocarbons
ETHANE CRACKER
ETHYLENE
CRUDE OIL AND LIQUID
FUELS
Ethylene also sold directly to market.
ETHANE
PARAFFIN AND WAX
FROM CRUDE OIL
PURCHASED FEEDSTOCK
SASOL SLURRY PHASE
DISTILLATE(SASOL SPDTM)
PROCESSLow temperature
Light hydrocarbons
OUR INTEGRATED VALUE CHAIN
CHEMICALS PROCESS
Chemical derivative
units

FINANCIAL IMPACT
Prioritised investment in research and development
R1,1 billion
VALUE DISTRIBUTED
SUSTAINABILITY IMPACT
Sasol Integrated Report 2017 13
When making decisions on how to manage and grow our business, we take into account the resources and relationships that are critical to our ability to create value. We refer to these as the six capitals. Inputs of each are needed for the effective production and delivery of Sasol goods and services, thereby generating value for all our stakeholders.
Evaluate risk tolerance and risk appetite
measures
IN MANAGING OUR SIX
CAPITALS, THE BOARD AND
MANAGEMENT CONTINUES TO
Assess impact on our material matters
Evaluate impact on our strategic objectives
Allocate capital in further driving value
Total greenhouse gas emissions
67 632kilotons (C02 equivalent)
WaterstewardshipR4,6mleveraged with R4,7 million partnership funding
0,28RCR of
Advanced housing scheme in Mozambique
20 morehouses delivered
Total energy use396 844thousand gigajoules
Level 8B-BBEE
Payments to the South African fi scus
R35,6 billion
Dividends paid
R8,6 billionPreferential procurement of over
R7,0 billion
Wages and benefi ts paid
R26,9 billionSocial investment and skills development spend
R1,6 billion
Total capital expenditure
R60,3 billion
Operating profi t
R31,7 billion
Our
str
ateg
ic b
usin
ess
cont
ext
How
we
crea
te v
alue
Our
gov
erna
nce
Our
per
form
ance
revi
ewA
ddit
iona
l inf
orm
atio
nW
ho w
e ar
e
OUTPUTS OUTCOMES FOR OUR
STAKEHOLDERS
Sasol Integrated Report 201712
We create value for our various stakeholders by developing and commercialising technologies and building and operating facilities to convert mostly low-cost hydrocarbon feedstock into a range of high-value product streams. Products include liquid fuels needed to move people and goods, chemicals used in industrial and consumer products and electricity that powers our facilities and contributes to South Africa’s and Mozambique’s power-generating capacity.
Governance Risk management High-performing people Zero harm Managing the capital trade-offs
Environmental and regulatory compliance
USING THETO CREATE VALUE
To grow and steer our business and operate our facilities safely and efficiently, we require high-performing, innovative and diverse people with the right skills and experience.
HUMAN CAPITAL
To create an enabling environment for operations and investment, we integrate the needs of our stakeholders into our business and we deliver on our commitments.
SOCIAL AND RELATIONSHIP CAPITAL
We require natural gas, shale gas, coal and crude oil as well as air, water, land and energy to convert hydrocarbon reserves into value-adding product streams.
NATURAL CAPITAL
We use cash generated by our operations and investments as well as debt and equity financing to run our business and fund growth.
FINANCIAL CAPITAL
Investing in plant and equipment allows us to convert hydrocarbon resources into high-value product streams and operate reliably. It also helps reduce our environmental footprint and enables us to comply with regulatory requirements.
MANUFACTURED CAPITAL
Our proprietary or licensed technologies, software, licences, procedures and protocols support Sasol’s competitive advantage.
INTELLECTUAL CAPITAL
UNDERPINNED BY:
INPUTS KEY PROCESSES
Gas-to-liquids (GTL)
Chemical processes
Electricity
Gas-to-power (GTP)
Coal-to-liquids (CTL)
Develop new value-adding
opportunities
Grow the business sustainably
Invest smartly to retain current operations
Evaluate business performance continuously against
strategic targets
We produce bulk fuel and
chemical commodities as
well as a vast spectrum of
high value-add differentiated petrochemical
products

Sasol Integrated Report 2017 15
TRADE- OFFS
CREATING VALUE FOR OUR
STAKEHOLDERS
The reduction since 2012 in our workforce and spending with service providers has negatively impacted human and social and relationship capital. However, by enabling Sasol to achieve cost-saving targets and withstand the low oil price environment, it has benefited financial capital. By making better use of our own employees, we have grown our in-house skills, supporting intellectual capital.
We invest in the communities in which we operate through social investment programmes that reduce our financial capital, but in the longer term enable growth in this capital stock. By supporting enterprise development, we boost manufactured, intellectual and financial capital. Our impact on natural capital has undermined trust with certain stakeholders, but through our environmental awareness campaigns, we are able to improve both natural and social and relationship capital.
We impact negatively on natural capital by using non-renewable resources, and through our emissions and wastes. We work to minimise these (see ). In some instances, we also impact adversely on human and social and relationship capital through, for example, competition for resources such as water. However, by converting natural capital into value-added products, we boost the stocks of all the other capitals.
By applying financial capital we sustain and grow our business, with positive impacts on manufactured, human, intellectual and social and relationship capital, and negative impacts on natural capital.
By pursuing our growth projects we are increasing the stock of manufactured capital, but impacting natural capital and, in the short-term financial capital. Our commitment to reduce the environmental footprint of our existing facilities will however benefit natural, intellectual, human and social and relationship capital.
By investing in intellectual capital, we reduce the stocks of financial capital in the short term. However in the longer term financial capital, as well as manufactured, natural, human, and social and relationship capital, are likely to be enhanced by our commitments. By further investing in our intellectual capital we seek opportunities to respond to clean fuels and other environmental legislation ultimately benefiting natural capital.
• Leveraging job-creation projects to bring basic services to communities• Investing in numerous educational programmes from early childhood and teacher development
to bursaries• On-the-ground engagement by Joint CEOs with all major stakeholder groups• Supporting entrepreneur development, municipality capacity-building in Secunda• Facilitating local recruitment drives to register job seekers with Department of Labour in towns
around Secunda• Acknowledging that some traditional ways of engaging are no longer appropriate• Launching formal complaints framework for local community engagement • Fostering positive employee and union relationships informed by trust and respect• Committed to contribute meaningfully to transformation in South Africa through
B-BBEE initiatives
SOCIAL AND RELATIONSHIP CAPITAL OUTCOMES
ACTIONS TO ENHANCE OUTCOMES
2017 2016
Taxes (direct and indirect) paid to South African government R35,6bn R36,8bn
Spending on skills development and social investment R1,6bn R1,2bn
Broad-Based Black Economic Empowerment status Level 8 Level 8
Person-days production lost to strike action 63 119 13 016
• Committing to promoting sustainable ambient air quality improvement in South Africa• Progressing our South African volatile organic compound emissions abatement and coal tar
filtration projects• Setting targets for water and energy efficiency• Supporting the UN Paris Agreement 2016• Working on water conservation and demand management projects• Improving on-site waste disposal practices
NATURAL CAPITAL OUTPUTS
ACTIONS TO ENHANCE OUTPUTS
2017 2016
Total greenhouse gas emissions (CO2 equivalent) (kilotons) 67 632 69 250
Greenhouse gas (GHG) emissions intensity (CO2 equivalent/ton product) 3,66 3,68
Nitrogen oxides (NOx) (kilotons) 152 156
Sulphur oxides (SOx) (kilotons) 202 223
Particulates (fly ash) (kilotons) 10 10
• Entering into commodity and currency hedges as part of our financial risk mitigation strategy, to protect the balance sheet
• Intensifying our risk management processes to enable us to better understand the risks we face
• Defined a capital allocation model to enhance shareholder returns• Considering alternatives to fund our capital growth investments
FINANCIAL CAPITAL OUTCOMES
ACTIONS TO ENHANCE OUTCOMES
2017 2016
Operating profit R31,7bn R24,2bn
Cash generated by operating activities R44,1bn R54,7bn
Net debt to EBITDA (ratio) 1,13 0,56
Net borrowings to shareholders’ equity (gearing) 26,7% 14,6%
Headline earnings per share R35,15 R41,40
Earnings attributable to shareholders R20,4bn R13,2bn
Sasol Integrated Report 201714
SCOREBOARD OF OUR SIX CAPITALS
To grow and steer our business and operate our facilities safely and efficiently, we require high-performing, innovative and diverse people with the right skills and experience.• A safe, healthy, engaged and productive workforce of
30 900 people with relevant skills, knowledge and experience
• A strong leadership team, driving a culture of high performance
• More than 22 000 service providers, delivering to agreed terms
HUMAN CAPITAL
To create an enabling environment for operations and investment, we integrate the needs of our stakeholders into our business and we deliver on our commitments.• An employee relations culture that encourages
engagement with employees and recognised trade unions• The sustained confidence of investors• Effective partnerships with customers, suppliers,
business peers as well as sector and research bodies• Engagement with our fenceline communities,
governments and regulators
SOCIAL AND RELATIONSHIP CAPITAL
We require natural gas, shale gas, coal and crude oil as well as air, water, land and energy to convert hydrocarbon reserves into value-adding product streams.• Coal to process (dry ash-free basis) (kilotons): 17 961• Crude oil processed (mm bbl): 32 • Natural gas to process (bscf): 97• Total water used (thousand cubic meters): 137 061• Total energy usage (thousand GJ): 396 844
NATURAL CAPITAL
We use cash generated by our operations and investments as well as debt and equity financing to run our business and fund growth.• Market capitalisation of R239 billion• Debt raised to execute capital investments of R13 billion• Finance income of R1,6 billion• Funding facilities of R136 billion, of which R82 billion
has been utilised
FINANCIAL CAPITAL
Investing in plant and equipment allows us to convert hydrocarbon resources into high-value product streams and operate reliably. It also helps reduce our environmental footprint and enables us to comply with regulatory requirements.• Property, plant and equipment of R159 billion
(carrying value)• Assets under construction of R131 billion• Exploration, development, production, marketing and sales
operations in 33 countries
MANUFACTURED CAPITAL
Our proprietary or licensed technologies, software, licences, procedures and protocols support Sasol’s competitive advantage.• Skilled, experienced and technically qualified employees,
industry thought leaders and experts that enable Sasol to respond to the constantly changing environment
• Our patented technologies• Our business processes and management systems
INTELLECTUAL CAPITAL
KEY INPUTS
2017 2016
Amount paid in wages and benefits R26,9bn R26,4bn
Number of work-related employee and service provider fatalities 5 2
Recordable Case Rate (RCR) 0,28 0,29
Investment in employee learning R970m R678m
Artisans trained 1 160 758
Fatal-injury frequency rate 0,006 0,002
New cases of occupational disease 39 55
• Continuous work to improve employee safety• Refreshed our action-orientated values and efforts to meaningfully
improve our diverse and inclusive workforce • Building and maintaining critical skills and capability, despite
cost-containment initiatives, that allow employees to deliver high performance
• Focused talent sourcing and succession planning
HUMAN CAPITAL OUTCOMES
ACTIONS TO ENHANCE OUTCOMES
2017 2016
Capital expenditure (including capital accruals, excluding Canada settlement) R60,3bn R70,4bn
Capital expenditure in South Africa 28% 24%
Sustenance capital expenditure R17,2bn R17,0bn
Depreciation and amortisation R16,2bn R16,4bn
Net impairment of assets R1,3bn R12,3bn
Record production volumes at Secunda Synfuels Operations 7 834kt 7 779kt
• In the US, progressing construction of the LCCP and joint venture HDPE plant• Advancing project to reduce VOC emissions in South Africa• In Mozambique, drilling first six wells in PSA licence area and debottlenecking
PPA plant, supporting our Southern African growth drive• Complete first phase of sixth fine ash dam in South Africa
MANUFACTURED CAPITAL OUTCOMES AND OUTPUTS
ACTIONS TO ENHANCE OUTCOMES
2017 2016
Number of new patents issued 190 239
Total worldwide patents held 2 216 2 023
Investment in research and development R1 077m R1 105m
Investment in bursary scheme R53m R49m
Number of bursaries 473 369
Number of mentoring coaches 429 410
• Investing in research and development and partnerships to reduce our environmental impact and develop new technologies despite the low oil price environment and RP
• Providing training and skills development for Sasol artisans, accountants and engineers
• Driving excellence in science, technology, engineering and mathematics education
• Focusing on continuous improvement to address the structural shift in energy prices by sustainably improving our margin contribution and cost base delivery
INTELLECTUAL CAPITAL OUTCOMES
ACTIONS TO ENHANCE OUTCOMES
Our
str
ateg
ic b
usin
ess
cont
ext
How
we
crea
te v
alue
Our
gov
erna
nce
Our
per
form
ance
revi
ewA
ddit
iona
l inf
orm
atio
nW
ho w
e ar
e

Sasol Integrated Report 2017 17
Macro-economic environmentLink to material matters:
Human capital managementDelivering value-based growth Environmental sustainability
Increasing environmental regulatory requirements and labour market unrest
WHAT HAPPENED The 2016 United Nations Paris Agreement set a path towards a lower-carbon global economy and is a defining milestone for the climate change challenge. Changing regulations continue to reflect the worldwide trend to the more efficient use of resources and reducing environmental impacts. In South Africa, where multiple environmental laws have been promulgated over the same period of time concurrently and where further law reform is anticipated, it is important that an integrated and co-ordinated compliance and environmental management approach is adopted. This will enable aligned and optimised outcomes, and reduce misalignments and duplications across air, water, waste and future climate change requirements. For our Mining operations, we also experienced prolonged labour action which is reflective of the current economic and political climate in South Africa.
HOW WE RESPONDEDThe implications for resource-intensive businesses like Sasol’s are numerous. Recognising the role we have to play in addressing the global sustainability challenge, we continued to focus on sustainable growth and efficiency improvements, while ensuring we meet our regulatory requirements. To respond to the strike at Mining, we increased external coal purchases to maintain the uninterrupted supply to other Sasol businesses. We have developed a risk-based approach to minimise labour volatility challenges. This required a review of our broader employee relations strategy and the adoption of a more integrated approach across all affected stakeholder groups to ensure business continuity.
THE OUTLOOKWith our global reach and greater bias towards chemicals and gas, we are now better positioned to respond to evolving regulations. Notwithstanding our reliance on coal, we continue to optimise the use of lower-carbon natural gas-derived feedstock in our energy mix. However, our options to respond to new regulations may require significant capital and other resources which we are actively investigating. More research and development is needed, particularly for our South African operations, in terms of studies and commercial testing of various options. We will continue to prioritise strengthening our relationships with employees and recognised trade unions to reintegrate teams disrupted by strike action in 2017.
Structural shifts in global commodity prices
WHAT HAPPENED Commodity prices showed a slight recovery. Oil prices benefited from agreements between OPEC and non-OPEC countries to cut production, but high global inventory levels constrained gains. Brent averaged US$49,77/bbl in the 2017 financial year. Warmer US weather in the second half of the 2017 financial year and high inventory levels led to lower natural gas prices. With a significant amount of rejected ethane in the US system, the price of ethane remained just above the energy floor. Prices for the main commodity chemicals were moderately stronger.
HOW WE RESPONDEDAs crude oil prices fell and the rand strengthened, the selling prices of fuel marketed by our Energy business decreased, reducing our profitability. Our chemicals businesses however benefited from the moderately stronger commodity chemical prices and wider performance chemical margins in the US. Our continuous improvement drive to add value and protect our competitive advantage and our various RP and hedging initiatives helped mitigate the impact of commodity price volatility.
THE OUTLOOKCrude oil price volatility is expected to continue in the short term. Longer term, oil prices are at risk of staying much lower for longer and may impact on our business’s profitability. For every US$1/bbl change in the annual average crude oil price, operating profit will be impacted by approximately R850 million in 2018. US natural gas production is slowing and fundamentals are tightening. More rigs and greater infrastructure build point to higher production in 2018. Increasing demand for US natural gas for LNG purposes could provide support to prices in the medium to longer term. Demand for US ethane is expected to rise in the next few years. In the foreseeable future, prices for oil and commodity chemicals will be driven by supply, demand, inventory fundamentals and industry improvements. Longer term, commodity chemicals will be driven mainly by oil prices.
Person-days of production lost to strike action
0
10 000
20 000
30 000
40 000
50 000
60 000
70 000
80 000
14 15 16 17
days
13 950
0
13 016
63 119
Henry Hub natural gas price versus US ethane price
($/M
MBt
u)
02468
1012141618
07 08 09 10 11 12 13 14 15 16 17
Henry Hub Ethane
Refer to page 28 for further details.
Sasol Integrated Report 201716
EXTERNAL ENVIRONMENT WHICH IMPACTS OUR ABILITY TO CREATE VALUEThis has been another particularly turbulent year, not only for Sasol, but also globally at a geopolitical level and across fi nancial markets. Britain’s decision to leave the European Union and the election of Donald Trump as president in the United States are defi ning features of what is increasingly becoming the new normal, namely high levels of volatility and increasing political and economic uncertainty. In South Africa we have seen general political uncertainty. The external market environment has a signifi cant impact on our ability to create value for our stakeholders. The key drivers which impact on profi tability and business continuity are the oil price, rand/US dollar exchange rate, environmental regulatory requirements and labour market volatility. In 2017 growth remained subdued and fi nancial markets were volatile. Oil prices were slightly higher on average compared to 2016, due to OPEC production volume cuts that came into effect in January 2017. During the year, we developed a digital roadmap as part of our business strategy to align and guide the organisation forward.
CURRENCY VOLATILITY
CHANGING DIGITAL
LANDSCAPE
STRUCTURAL SHIFTS
IN GLOBAL COMMODITY
PRICES
LABOUR MARKET UNREST
ENVIRONMENTAL REGULATORY
REQUIREMENTSOur exposure to external factors
Weak economic growth and volatile currencies
WHAT HAPPENED Global growth slowed to average 3,1% in calendar 2016, from 3,4% in 2015. The US grew by 1,6%. China and India expanded 6,7% and 7% respectively, while recessionary conditions persisted in Russia and Brazil. South Africa grew 0,3%, before contracting in first quarter calendar 2017 following the downgrade of its sovereign credit rating to sub-investment grade. The rand/US dollar exchange rate remained volatile and much stronger in relation to other currencies. Mozambique’s growth slowed to 3,4% in calendar 2016 from 6,6%, following IMF actions on the discovery of previously undisclosed loans to state firms, leading to a sharp fall in the currency.
HOW WE RESPONDEDOn-going weak demand conditions and the strong rand/US dollar exchange rate limited gains in our revenue, margins and earnings. South Africa’s downgrade resulted in a corresponding downgrade of Sasol’s credit rating. However, we remained focused on delivering on our Response Plan (RP) objectives, and prudently managed our balance sheet and cash flows and increased our hedging activities to create headroom on our balance sheet. For financial year 2018 we have hedged 70% of our currency exposure which equates to US$4 billion. In Mozambique, the fiscal crisis led to reduced government spending and increased fuel, electricity and food prices. The government increasingly enforced regulation to generate revenue. Sasol and other companies were impacted by this in the areas of work permits, customs and business visas.
THE OUTLOOKWe expect global GDP growth to be stronger in calendar 2017 and 2018, however there are a number of uncertainties. These include the implementation of the Trump administration’s policy agenda and risks around the timing, pace, extent and spill-over effects on the rest of the world, the evolution of the ‘Brexit’ process, geopolitical tensions and the sustainability of China’s growth. South Africa’s growth prospects are challenging and exchange rate volatility will continue. We estimate that a 10-cent change in the annual average rand/US dollar exchange rate will impact our operating profit by approximately R710 million in 2018.
Changing digital landscape
HOW WE RESPONDEDWe embarked on a journey to formally define our digital roadmap.
THE OUTLOOKTo improve our efficiencies and maintain our competitiveness we will embrace more digital solutions in our upstream, exploration and manufacturing operations, supply chain activities and in our strategic business units to meet our customer needs.
WHAT HAPPENED All industries in which Sasol participates are increasingly impacted to some extent by the adoption of digital solutions. Digital technologies are transforming how we work and we aspire to deliver even more superior returns by accelerating our digital journey at Sasol.
Real GDP growth
% c
hang
e
(10)
(5)
0
5
10
15
20
0605 07 08 09 10 11 12 13 14 15 16
USA Eurozone China South Africa
Our
str
ateg
ic b
usin
ess
cont
ext
How
we
crea
te v
alue
Our
gov
erna
nce
Our
per
form
ance
revi
ewA
ddit
iona
l inf
orm
atio
nW
ho w
e ar
e

Sasol Integrated Report 2017 19
Our
str
ateg
ic b
usin
ess
cont
ext
How
we
crea
te v
alue
Our
gov
erna
nce
Our
per
form
ance
revi
ewA
ddit
iona
l inf
orm
atio
nW
ho w
e ar
e
Dear stakeholder,
The proactive measures we undertook from 2012 to sustainably reduce our cost base, enhance the Group’s competitiveness and, from early 2015, decisively respond to a low oil price, again proved indispensable in 2017 as we delivered another strong all-round performance amid continued market volatility. Evidence of our resilience is the fact that we are able to generate free cash flows from our core operations at oil prices of US$40 per barrel (bbl).
Our results, while adversely affected by a firmer rand and low commodity prices, are a testament to the robust foundation in place to position the Group for long-term growth. Indicators of our sound fundamentals are reflected in the record production volumes achieved this year as well as the realisation – a year ahead of previous market guidance – of the full Business Performance Enhancement Programme (BPEP) target of R5,4 billion in sustainable cash cost reductions.
When our solid operational and cost performance is combined with our heightened focus on macro-economic risk mitigations to protect our balance sheet, we have a robust base for future value-based growth. Additionally, through specific interventions to refine our long-term strategy and further improve capital allocation, we expect to further enhance Sasol’s intrinsic value.
Refocusing safety to prevent high-severity injuriesThese encouraging developments are, however, overshadowed by five tragic fatalities in the year. We mourn the loss of Johannes Mashili, Gideon Coetzee, Carl Vermaak, Themba Mahlangu and Tyler Truett and again convey our sincere condolences to their families, friends and colleagues.
While the Group safety recordable case rate, excluding illnesses, continued its downward trend in 2017, improving to 0,28, our high-severity injuries remained too high and the loss of life is deeply distressing. We are working towards improving our understanding of injury severity, which is essential to mitigate the prevalence of fatalities and high-severity injuries. To enable this, we have established a methodology to help us better understand the actual, as well as the potential, severity of incidents.
Following the start-up, the 1,5 million ton per year ethane cracker and six downstream chemicals units will begin to transform our earnings profile, both in terms of geographic spread and relative contribution of our chemicals and energy businesses. We expect the contribution from the United States (US) to group earnings before interest, taxation, depreciation and amortisation (EBITDA) to increase from 9% to 31%, and that of our chemicals business to grow from 47% to 64%.
In Southern Africa, our US$1,4 billion development in the Production Sharing Agreement (PSA) licence area in Mozambique progressed within our approved budget and schedule. By year-end, six wells had been drilled. We expect to complete the 13-well drilling programme by the end of the 2018 calendar year and remain firmly committed to our growth plans, despite the financial challenges the country faces. We will continue to partner with the Mozambican Government, and other institutions, on projects that will help stimulate growth.
In addition to the large capital projects in the US and Mozambique, we delivered on several other developments in the year. Our high-density polyethylene joint venture with Ineos in the Gulf Coast of the US, is essentially complete and is on track for start-up during quarter four of the 2017 calendar year. The complex will produce 470kt annually of high-value, bimodal high-density polyethylene.
In Sasolburg, the second phase of our Fischer-Tropsch wax expansion project achieved beneficial operation in March 2017, allowing us to double our South African production of hard wax, a sought-after commodity used worldwide by several major industries. This facility continues to ramp-up and produced 92kt of hard wax in 2017.
In November 2016, Loopline 2 on the Mozambique-to-Secunda pipeline reached beneficial operation. The project was delivered ahead of schedule and at least 25% below budget. This, alongside a commendable safety recordable case rate of zero for the project, was a significant achievement.
Furthermore in the year, we continued work to refine our longer-term strategy. This is to ensure that we have a robust set of principles to drive our future growth and investments, irrespective of the macro-economic environment. We will share details of this work with investors at a special capital markets day scheduled for later this calendar year.
Shift towards continuous improvementWith the conclusion of our large-scale restructuring programme of the past few years, which closed with the early achievement of our full BPEP savings target, we are refocusing the organisation towards a continuous improvement mindset.
This approach will be driven by critically objective assessments of our performance in all respects, supported by regular independent benchmarking and rigorous effort to continuously improve both effectiveness and efficiency.
The drive for continuous improvement underpins the importance of addressing the structural shift in the oil price by sustainably improving our margin contribution and cost base delivery.
Generating value through our strategy During 2017, we recorded notable progress in delivering on our medium-term strategy, positioning Sasol for growth in Southern Africa and North America.
In North America, the US$11 billion Lake Charles Chemicals Project (LCCP) in Louisiana met key project milestones and was 74% complete by year-end, with capital expenditure amounting to US$7,5 billion and the start-up of the first units forecast in the second half of the 2018 calendar year. As we head towards commissioning of this world-scale facility, we have a fully integrated business and operations readiness plan in place to enable the new facility to successfully get product to market.
STATEMENT OF THE JOINT PRESIDENTSAND CHIEF EXECUTIVE OFFICERS
Sasol Integrated Report 201718
Stephen Cornell and Bongani Nqwababa
KEY MESSAGES:
Refocusing safety to prevent high-severity injuries
Generating value through our strategy
Shift towards continuous improvement
Bolstering our standing as a credible stakeholder partner
Meeting our environmental commitments
Building organisational resilience

Sasol Integrated Report 2017 21
NURTURE OUR FOUNDATION BUSINESS AND SECURE LICENCE TO OPERATE• Maintain and continuously
improve our cost competitive position in other areas of our business
• Deliver Response Plan targets for 2018 to protect and strengthen our balance sheet
• Improve the perception of Sasol as a credible partner for Southern Africa by delivering on commitments
• Sustain momentum on implementation of 2025 roadmaps by delivering on environmental commitments
• Redefine and deliver on Sasol’s empowerment landscape through a focused project and stakeholder engagement plan
• Ensure PSA milestone delivery in partnership with the Government of Mozambique while continuing to deliver full strategic value to Sasol
• Deliver on project execution and business readiness milestones for the LCCP
• Protect and improve Return On Invested Capital (ROIC) by developing opportunities that can deliver medium- to long-term earnings growth
• Drive meaningful improvement in ensuring we have a diverse and inclusive workforce
• Build and retain critical skills and leadership capability
• Roll out the refreshed Sasol values, behaviours and aspired culture
DELIVER SUSTAINABLE GROWTH AND CLARIFY FUTURE INVESTMENT OPPORTUNITIES
BUILD A RESILIENT ORGANISATION FOR THE FUTURE
DRIVE CUSTOMER, OPERATIONAL AND CAPITAL EXCELLENCECONTINUE OPERATIONAL EXCELLENCE through predictable, reliable and efficient operations
ACHIEVE EXCELLENCE in the execution of all capital investments by ensuring delivery within budget and on schedule
ENHANCE SASOL’S one customer approach
DRIVE DIGITAL ENABLEMENT OPPORTUNITY to sustain and improve our competitive position
With plans to refi ne and articulate our longer-term strategy later this calendar year, we will continue to execute on our medium-term strategy, manage our material matters and deliver value through our new capital allocation principles. Our focus in 2018 will be on the following fi ve priorities:
Refer to page 22 – 23 for our strategy.
Refer to page 26 – 27 for capital allocation principles.
Refer to page 28 – 35 for material matters.
Refer to page 38 – 39 for our stakeholder engagements.
• Prevent high severity injuries by embedding learnings
• Obtain first level of assurance on critical controls
PURSUEZERO HARM
STATEMENT OF THE JOINT PRESIDENTS AND CHIEF EXECUTIVE OFFICERS (continued)
Sasol Integrated Report 201720
We anticipate significant challenges in meeting some of the “new plant standards” for our plants that were constructed years ago, including for steam and power plant sulphur dioxide emissions as well as coal gasification plant hydrogen sulphide emissions. We continue to investigate new technologies that may enable us to comply and to engage stakeholders to find sustainable longer-term solutions. It is expected that further postponements will be required to enable the advancement of our roadmaps. We are also implementing approved offset plans, focused on reducing non-industrial sources of air pollution such as that from the burning of household waste near our Sasolburg operations, and the burning of household coal and wood near our Secunda operations.
Building organisational resilience We understand culture is not a variable we should only pay attention to from time to time. Culture, underpinned by our values, is essential to support us in achieving our goals. To this end, we set the foundation for the next step in our culture transformation journey by introducing a new vision and purpose for Sasol and we refreshed the company’s values. In the new year, we will focus on embedding the behaviours that support our aspired future culture.
During the year, we renewed our focus on critical skills and leadership capability development, as key enablers to build a resilient organisation for the future. We continued to invest in sponsored study and technical learning programmes, as well as leadership, career and succession development plans.
To secure a pipeline of future talent, we invested significantly in skills development, ranging from basic literacy and school-level programmes to technical training for professionals, through some of the largest bursary, graduate development and internship programmes in Southern Africa.
Extending our thanksOur first year as Sasol’s Joint CEOs has certainly been a memorable one, characterised by disciplined cost management, cash conservation and astute capital allocation, underpinned by reliable and efficient operations, all of which is delivered through our talented people.
Our heartfelt appreciation goes to all our employees, who have remained resilient and focused on our key deliverables despite a very tough business environment.
We wish to acknowledge and thank the members of the Board for their continued support, guidance and wise counsel. We also extend our appreciation to all stakeholders who have entrusted us to drive this organisation forward to ensure we continue to deliver sustainable value over the long term.
Bongani Nqwababa Stephen CornellJoint Presidents and Chief Executive Officers
28 August 2017
Bolstering our standing as a credible stakeholder partnerThroughout Sasol’s 67-year history, we have played an important role in South Africa and the broader region’s industrialisation, growth and socio-economic development. In 2017, our contributions to South Africa included:
• approximately R17 billion in capital expenditure, with a further maintenance spend of R7 billion;
• payments of nearly R35,6 billion to the fiscus, retaining Sasol’s position as one of the largest corporate taxpayers in South Africa; and
• investment of over R676 million in social investment programmes globally, 88% of which was spent in Southern Africa.
Southern Africa is the cornerstone of Sasol’s global operations and here, as elsewhere, we seek to position ourselves as a credible stakeholder partner. We recognise that Sasol’s success depends on the support of multiple stakeholders and we must deliver on our commitments to improve perceptions of the company, especially in our home base.
We endeavour to build trust-based relationships with our key stakeholders, particularly in our ‘fenceline communities’ and with all levels of government. Here, our environmental performance, as well as transformation initiatives hold significant potential to bolster our standing as a credible stakeholder partner.
Meeting our environmental commitmentsOver the last years, South African legislation required that Sasol facilities comply with more stringent air quality standards commonly referred to as “existing plant standards” by April 2015 and “new plant standards” by April 2020.
We adopt a risk-based approach to environmental improvement, including:
• detailed monitoring and reporting of our emission inventories;
• compliance with applicable legal requirements; and• sustainably reducing emissions from our
operations, enhanced by community-based offsets towards improved ambient air quality.
Through proactive interventions, we were able to meet most of the existing plant standards by 1 April 2015. Where we needed more time, we applied to extend the compliance timeframes, outlining our plans in environmental roadmaps. We were granted postponements of variable periods up to five years, with stretched compliance targets which we operate under in the interim and including requirements to implement community-based offsets near our facilities.
Our
str
ateg
ic b
usin
ess
cont
ext
How
we
crea
te v
alue
Our
gov
erna
nce
Our
per
form
ance
revi
ewA
ddit
iona
l inf
orm
atio
nW
ho w
e ar
e

Sasol Integrated Report 2017 23
Details of our performance against the strategic objectives are in our operational reviews, pages 76 – 81.
Our operating model structure, page 7.
Our key performance indicators, page 24.
Our investment case, page 82.
Transitioning into the business of tomorrow.
Sustaining our business of today.
The aim of our Chemicals pillar is to grow our ethylene and derivative businesses, in addition to delivering incremental high-return growth in differentiated products. Underpinning these growth pillars is our strategic focus to nurture and grow our existing Southern African and global value chain to ensure long-term sustainability.
DELIVERY IN 2017• Achieved BPEP target of R5,4 billion a year earlier than
previous market guidance• Evolved our risk management approach to integrate in
our financial management processes by identifying key undesirable events and mitigating controls
• Defined capital allocation guidelines to ensure that capital is allocated optimally to deliver superior returns to stakeholders
• Focused on improving ROIC through asset reviews, hedging, cost-containment and risk mitigation
• Formally developed a digital roadmap
NEAR-TO-MEDIUM FOCUS• Focus on continuous improvement to address
the structural shift in energy prices by sustainably improving our margin contribution and cost base delivery
• Use digital solutions to drive cost competitiveness
• Continue to review assets to repair or divest to increase our ROIC
• Communicate refi ned strategy and capital allocation choices to the capital markets
• Improve project execution by implementing lessons learnt from previous projects
RO
BUST
FO
UN
DAT
ION
DELIVERY IN 2017 NEAR-TO-MEDIUM FOCUS
• Drilled fi rst six wells in PSA licence area, Mozambique
• Increased PPA gas production on plant debottlenecking, Mozambique
• Benefi ted from active well management of oil asset in GabonU
PST
REA
M
• Drill seven more wells in PSA licence area, Mozambique• Finalise terms for new exploration licences,
Mozambique• Focus on oil opportunities in West Africa• Complete the Shondoni colliery, advance Impumelelo
mine, South Africa• Ensure feedstock security of gas beyond 2034
• Increased liquid fuels retail network, South Africa • Expanded capacity of ROMPCO Mozambique-to-
South Africa gas pipeline• Licensed FT GTL technology, Uzbekistan• Increased capacity utilisation at ORYX GTL joint
venture, QatarENER
GY
• Grow fuel retail presence in Southern Africa• Maintain excellent utilisation rates and safety at ORYX GTL,
Qatar• Continue to engage with potential GTL technology
licensees• Consider gas-to-power opportunities in South Africa• Investigate further investment opportunities in Southern
Mozambique
• Benefi ted signifi cantly from C3 expansion project, South Africa
• Progressed construction of HDPE joint venture and LCCP, United States
• Completed wax expansion project, South Africa
CHEM
ICA
LS
• Develop incremental growth and merger and acquisition opportunities within our chemicals portfolio
• Complete joint venture HDPE plant, United States• Secure customers for new US products• Pilot project to transform customer experience using
digital platforms• Deliver LCCP within schedule and revised cost estimate
Sasol Integrated Report 201722
ROBUST FOUNDATION Protect our competitive advantage by ensuring that we can proactively respond to market and regulatory changes
Proactively manage fi nancial risks and protect the balance sheet
Improve effi ciency and effectiveness of our operations; use digital; to reduce our cost base
OUR STRATEGYGuided by our vision and purpose, our strategic focus areas are based on Upstream, Energy and Chemicals. Our Upstream pillar is geared to grow our oil and integrated gas business. Through our Energy pillar, we will expand our liquid fuels marketing and gas-to-power in Southern Africa, while growing selective gas-to-liquid globally.
ENABLED BYEffective allocation of capital
Values-driven, diverse and high-performing organisation
STRATEGIC OBJECTIVES
Deliver low-cost feedstocks in Southern Africa
Grow economically attractive upstream resources in Southern Africa
UPSTREAM
Continuously improve existing asset base and maintain technological lead
Drive world-class safe operations to support growth
• Improved overall safety performance • Increased production volumes across most of the
value chain• Advanced volatile organic compounds abatement
project, South Africa• Achieved record volumes at Secunda Synfuels
OP
ERAT
ION
S • Install 17th air separation unit, Secunda South Africa• Continue investigating solutions to meet air quality
standards post 2020, South AfricaOPERATIONS
Optimise liquid fuels marketing channels
Deliver selective GTL opportunities and grow lower-carbon power generation
ENERGY
Drive value chain optimisation
Drive selective growth based on feedstock, market and/or technology advantage
CHEMICALS
Summarised report of the Remuneration Committee is on page 54.
Return on invested capital (ROIC)Target: Capital portfolio to deliver return on capital invested of 18,3%
Quality-based earnings growthTarget: 8% US dollar EBIT growth on a three-year moving average
Net debt-to-EBITDATarget: Maintain a net debt-to-EBITDA ratio of <2,0 times
GearingTarget: Achieve a gearing level of 20% – 40% (Temporarily lifted to 44% until the end of 2018)
SafetyTarget: RCR of less than 0,3 by 2020
Greenhouse gas emissionsTarget: To maintain direct GHG emissions from our South African operations within 302mt of CO2e
over calender years 2016 – 2020
Broad-Based Black Economic EmpowermentTarget: At least level 4 by 2020
REMUNERATION POLICY AND PROCESS
Sasol’s remuneration policy is designed to enable the delivery of the Group’s strategy in a safe, reliable and
sustainable manner.
KPIs TO MEASURE PERFORMANCE
Our
str
ateg
ic b
usin
ess
cont
ext
How
we
crea
te v
alue
Our
gov
erna
nce
Our
per
form
ance
revi
ewA
ddit
iona
l inf
orm
atio
nW
ho w
e ar
e

OUR KEY PERFORMANCE INDICATORS
Sasol Integrated Report 2017 25
KPI Target Performance
Return on invested capital
(ROIC)
To target returns for net investments of 1,3 times weighted average cost of capital (investment WACC)
2017 – 9% (including AUC) and 17% (excluding AUC)
All new growth-related capital projects are required to provide a return of at least 1,3 times our investment WACC. In South Africa, our investment WACC is 14,05%. In the US, our investment WACC is 8,00% (excludes sustenance capital expenditure).
In 2017, although a marked improvement from 2016, we did not achieve our target. This was mainly due to the lower oil price environment and the impact of significant capital investments (LCCP project in the US and PSA project in Mozambique). We expect the return on invested capital ratio to remain under pressure in the short to medium term.
Quality-based earnings growth
8% US dollar EBIT growth on a three-year moving average
2017 – (21%)
The sharp drop in global oil prices since 2015 negatively impacted earnings. This resulted in us not delivering on our target. The impact of the macro-economic environment was, however, partially mitigated by our Business Performance Enhancement Programme and Response Plan initiatives.
Sasol’s cash-generative foundation business and growth prospects should enable us to achieve sustainable compound US dollar earnings growth of 8% per annum.
Net debt-to-EBITDA
Maintain a net-debt-to-EBITDA ratio of below 2,0 times
Net debt-to-EBITDA remains healthy at 1,13 times.
Our target takes into account our capital investment programme as well as our exposure to external market factors such as crude oil prices, commodity chemical prices and exchange rates.
We expect our net debt-to-EBITDA to reduce substantially two years post the completion of the LCCP.
Gearing
To maintain a gearing level of 20% – 40% (Temporarily lifted to 44% until the end of 2018)
Our gearing level increased to 26,7% mainly due to our capital investment programme. This is still comfortably within our self-imposed target of 44%.
We expect our balance sheet to deleverage two years post the completion of the LCCP.
Safety
To achieve a recordable case rate (RCR) excluding illnesses of less than 0,30 by 2020 with no fatalities.
Our safety Recordable Case Rate (RCR), excluding illnesses, improved to 0,28, however the high severity of injuries remains a concern. Regrettably, five fatalities occurred.
Greenhouse gas
emissions
To maintain direct GHG emissions from our South African operations within 302mt of CO2e over calendar years 2016 – 2020
Sasol is voluntarily taking part in the trial phase of the South African carbon budget process. In total, our budget contemplates a limit of 302mt carbon dioxide equivalent over five years (2016 to 2020), making provision for growth. For calendar year 2016, Sasol South Africa emitted approximately 55mt of direct CO2 equivalent emissions of our total budget, taking project delivery into account. From 2021 onwards mandatory budgets will be set in line with government’s requirements. We are engaging with government on the proposed methodology and will provide the necessary data to enable setting of appropriate limits. Refer to for further information.
Broad-Based Black Economic Empowerment
To achieve at least level 4 contributor status in terms of the revised Codes of Good Practice by 2020
Our most recent certifi cation issued in April 2017 represents a key milestone in our transformation efforts, with year-on-year improvements once again being realised across most pillars of the scorecard. Our current contributor status is level 8. In 2017, we increased our total expenditure with BEE-compliant businesses. We endeavour to build an inclusive supply base and leveraging opportunities as a catalyst for local economic growth. The Group is considering the merits of a new B-BBEE transaction to replace the Sasol Inzalo transaction.
ROBUST FOUNDATION Protect our competitive advantage by ensuring that we can respond to market and regulatory changes proactively
Proactively manage fi nancial risks and protect the balance sheet
Improve effi ciency and effectiveness of our operations; use digital; to reduce our cost base
Transitioning into the business of tomorrow.
Sustaining our business of today.
OUR PERFORMANCE SCORECARDOur performance scorecard provides an overview of how we have delivered in the year and tracks and reports on how we create value on our robust foundation. It shows our progress against seven Key Performance Indicators (KPIs) that are linked to the delivery of our strategy to create superior value for our stakeholders. The KPIs are integral to our risk management process, providing a tool with which to measure our risk tolerance.
ENABLED BYEffective allocation of capital
Values-driven, diverse and high-performing organisation
STRATEGIC OBJECTIVES
ROIC
Capital portfolio to deliver return on capital invested of 18,3%1
9%1
17%2
7%1
12%2
17%1
27%2
Quality-based earnings growth
8% US dollar EBIT growth on a three-year moving average
(21%) (23%) (5%)
Net debt-to-EBITDA
Maintain a net debt-to-EBITDA ratio of <2,0 times
1,13 0,56 (0,09)
Gearing
Achieve a gearing level of 20% – 40% (Temporarily lifted to 44% until the end of 2018)
26,7% 14,6% (2,8%)
Safety RCR of less than 0,3 by 2020
0,28 with five fatalities
0,29 with two fatalities
0,32 with one
fatality
Greenhouse gas emissions
To maintain direct GHG emissions from our South African operations within 302mt of CO2e over calendar years 2016 – 20203
–3
55mt direct
CO2 equiva-
lent
–
Broad-Based Black Economic Empowerment
At least level 4 by 2020
Level 8 (new
codes)
Level 8
(new codes)
Level 4
(2007 codes)
REMUNERATION POLICY AND
PROCESSSasol’s remuneration policy is designed to
enable the delivery of the Group’s strategy in a safe, reliable and sustainable manner.
Deliver low-cost feedstock in Southern Africa
Grow economically attractive upstream resources in Southern Africa
UPSTREAM
Continuously improve existing asset base and maintain technological lead
Drive world-class safe operations to support growth
OPERATIONS
Optimise liquid fuels marketing channels
Deliver selective GTL opportunities and grow lower-carbon power generation
ENERGY
Drive value chain optimisation
Drive selective growth based on feedstock, market and/or technology advantage
CHEMICALS
Summarised report of the Remuneration Committee is on page 54.
Sasol Integrated Report 201724
AUC – Assets under construction.1 Including AUC.2 Excluding AUC.3 This KPI is measured since 2016 over calendar years.
TARGETKPIs 2017 2016 2015
Achieved Work in progress
Our
str
ateg
ic b
usin
ess
cont
ext
How
we
crea
te v
alue
Our
gov
erna
nce
Our
per
form
ance
revi
ewA
ddit
iona
l inf
orm
atio
nW
ho w
e ar
e

Sasol Integrated Report 2017 27
TECHNOLOGY FEEDSTOCK MARKET CONTROLS FINANCING
ROBUST PROJECT ECONOMICS
Do we have a technology, scale of plant or operating know-how that provides a competitive advantage?
Do we have a low-cost feedstock position?
Do we have a product or market position that provides us with a compelling business case?
Do we have the controls in place to execute the project within the schedule and budget?
Do we have access to adequate funding while remaining within our gearing ceiling, and continuing with our current dividend policy?
Using defined investment criteria before committing capital to growth projectsTo meet our growth targets, we need to consider both organic and inorganic growth opportunities that fit with our capital allocation framework. Before pursuing a project, we use our carefully defined investment criteria to determine whether the project’s economics are sufficiently robust. The process can be simplified as follows:
The two key overarching objectives are to firstly, protect and strengthen the balance sheet and then to focus on value-based capital allocation
Protecting our licence to operate and ensuring the integrity and reliability of our assets is our first priority.Following this we remain committed to a dividend payment of at least 2,8 HEPS cover or 36% payout ratio, provided we can maintain our investment grade credit rating.
Our next priority is to evaluate between value levers from which we can derive the most value for our shareholders. Items which can be considered include:
1. value-based growth delivered from our portfolio of projects which may include merger and acquisitions transactions,
2. value returned to shareholders through targeted and increased dividend payout ratios, however still remaining within our 2,2 – 2,8 times range, and
3. value returned to shareholders through special dividends and/or share buy-back programmes.
It is important to note that these levers will be competing equally for capital.
As we consider these capital allocation decisions, we are guided by key financial risk and return metrics such as our gearing and liquidity levels and the return on invested capital, with the ultimate objective to aim to deliver maximum sustainable return to shareholders.
DELIVERING VALUE THROUGH OUR
In 2017, we defined a capital allocation framework as a catalyst for improving shareholder returns. Our aim is to drive a process that is disciplined as well as transparent so that the principles are clear to all stakeholders as to how we allocate capital. In this way, we hope to close the perceived ‘value gap’ in the Sasol share price, supporting an appreciation of the share price to more accurately reflect the Group’s value.
Sasol Integrated Report 201726
PRINCIPLES
The new framework will also assist us in allocating capital and is particularly important as the LCCP reaches beneficial operation, as this game-changing project will transform Sasol’s earnings profile. The first units of the LCCP are expected to come on line in the second half of 2018. We expect our balance sheet to deleverage two years post the completion of the LCCP, with our gearing and net debt:EBITDA declining rapidly. As a result, we will need to carefully evaluate our capital choices to yield maximum return to shareholders by way of further growth or additional dividend payouts. Our appetite for another project of the scale of the LCCP is limited. Instead, we will consider small-scale projects, joint ventures and mergers and acquisitions, but will be selective in our consideration of opportunities, measuring them up against our established investment criteria and ensuring that they give us flexibility and a quicker cash return, without any large balance sheet impact. The Board will consider each of the capital allocation decisions against our financial risk metrics and strength of the balance sheet before approving such decisions.
* Up to 2,2x cover/45% payout
Capital allocation guided by key financial metrics – Gearing, Net debt: EBITDA and ROIC
ALLOCATION OF CAPITAL
Maintain strong balance sheet and liquidity
DELIVER MAXIMUM SUSTAINABLE SHAREHOLDER RETURN
LICENCE TO OPERATE
AND SUSTENANCE
CAPEXMINIMUM
SHAREHOLDER RETURN
(2,8X COVER/36% PAYOUT)
Focused value-based capital allocation
VALUE-BASED GROWTH CAPEX
PREMIUM SHAREHOLDER
RETURN*
STRENGTHEN BALANCE SHEET
Balance sheet protection will take precedence if investment
grade credit rating at risk
SPECIAL DIVIDENDS
AND SHARE
BUY BACKS
All three elements compete equally for
capital
CASH FLOW FROM
OPERATIONS
SOURCES OF CAPITAL
CASH ON HAND
DEBT DRAWDOWN
EQUITY RAISE
Our
str
ateg
ic b
usin
ess
cont
ext
How
we
crea
te v
alue
Our
gov
erna
nce
Our
per
form
ance
revi
ewA
ddit
iona
l inf
orm
atio
nW
ho w
e ar
e

Sasol Integrated Report 2017 29
ENVIRONMENT
Sasol’s profitability is significantly impacted by changes in the oil price and the rand/US dollar exchange rate as most of our products have a rand cost base and a dollar-based final selling price. Subdued world growth in 2017 limited the rise in commodity and energy prices and our revenue, margins and earnings. The rand was volatile and it strengthened in the first half of the financial year before losing ground to the dollar in the second half due to political instability resulting in the downgrade of South Africa’s sovereign credit rating to sub-investment status. This has implications for our future cost of funding, our rand-based product prices and our share price.
HOW WE ARE RESPONDING• We entered into crude oil put options for
approximately 82% of our liquid fuel sales to protect our balance sheet against adverse movements in commodity and product prices and considered other commodity and currency hedges.
• We hedged 70% of our rand/US dollar exposure for 2018 using zero-cost collar instruments. We entered into hedges with a notional amount of US$4 billion, an annual average floor of R13,46/US$, and an annual average cap of R15,51/US$. These will provide some cash flow and balance sheet protection, as gearing and net debt-to-EBITDA are expected to peak in 2018. They will also partially mitigate the negative translation impact of valuing the balance sheet at each reporting date.
• We continue to drive our BPEP cost-containment programme and, through our RP in 2017 managed variable and cash fixed costs well below inflation in nominal terms. We achieved our BPEP sustainable savings exit run rate target of R5,4 billion in 2017, a year earlier than expected.
• Through our RP, we recorded cash savings of R32,3 billion in 2017, mostly through reprioritising our capital portfolio. This positions Sasol well to operate profitably in a US$40-50/bbl oil price environment. We have increased our RP sustainable cash cost savings target from R2,5 billion to at least R3,0 billion by 2019.
• We are reviewing our functional structure to ensure we remain cost competitive while embedding a cost-savings mindset.
• We continue to prioritise the effective allocation of capital to maximise returns to shareholders (see page 26).
• We are reviewing digital solutions to evaluate how we can be more efficient and responsive to the macro-economic landscape.
• We are reviewing our assets to improve our performance and profitability.
MANAGING THE CAPITAL TRADE-OFFSThrough our hedging activities, RP and BPEP we conserved financial capital, which was however impacted adversely by subdued world growth. Reduced earnings in turn affected our spending with suppliers, negatively impacting on human as well as social and relationship capital. Reprioritising capital projects was to the detriment of manufactured capital but to the benefit of natural and financial capital. Our enhanced cost initiatives to protect our competitive advantage supported intellectual capital. South Africa’s downgrade could impact our future cost of funding, in turn impacting on manufactured capital.
MAINTAINING OUR BPEP
AND RP INITIATIVES;ENTERING INTO
DERIVATIVE CONTRACTS
MAINTAINING OUR BPEP
AND RP INITIATIVES;ENTERING INTO
DERIVATIVE CONTRACTS
Rand/US dollar exchange rate
(US$
1=R)
0807 09 10 11 12 13 14 15 16 17
Yearly average (fuel sales)
Rate applicable to fuel sales
Average monthly exchange rate
0
3
6
9
12
15
18
0
30
60
90
120
150
180
Crude oil
(US$
/bbl
)
0807 09 10 11 12 13 14 15 16 17
Yearly average BFP Brent Product BFP
Sasol Integrated Report 201728
Our material matters are those issues that could substantially affect Sasol’s ability to create value in the short, medium or long term as a result of not being able to execute on our strategy and impact our ability to stay competitive.
MATERIAL MATTERS
We use the following process to manage our material matters:
By assessing:• Materiality• Impact of delivering on
our strategy• Risk metrics in the context
of our strategy
Through: • Assessing impact on risk
tolerance and risk appetite• Actioning activities
required to manage material matters
• Evaluating scenario modelling outcomes
• Evaluating trade-offs between capitals
By reviewing:• Board submissions• Quarterly submissions to the
Group Executive Committee• Our operating environment• Risk management process
and findings• Stakeholder issues
step 1IDENTIFY
step 2PRIORITISE
step 3RESPOND
step 5REVIEW AND
MONITOR
STAKEHOLDER INCLUSIVENESS
SUSTAINABILITY CONTEXT
In 2017, we identifi ed fi ve material matters:
MACRO-ECONOMIC ENVIRONMENT
The volatile macro-economic environment requires us to maintain our cash-conservation and savings initiatives, while effectively allocating capital for growth projects and improving our competitive position.
DELIVERING VALUE-BASED GROWTH
Driving continuous improvement, harnessing technology and talent, developing a diverse portfolio and embracing more digital solutions enables us to deliver superior value to our stakeholders and ensure long-term sustainability.
HUMAN CAPITAL MANAGEMENT
Promoting safety, diversity and cultural transformation as well as attracting, developing and retaining high-performing people, while engaging all employees and respecting human rights.
ENVIRONMENTAL SUSTAINABILITY
Securing our licence to operate by driving sustainable air quality, waste and land risk management, responding to the climate change and energy security challenges, promoting water stewardship and ensuring responsible product stewardship.
COMMITMENT TO OUR COMMUNITIES
Consistently delivering on our commitments to community stakeholders and optimising the impact of our social investment programmes by increasing local content and collaborating more broadly to address social and economic development challenges.
step 4REPORT
• Plausible outcomes to the Board
• Report to stakeholders
Refer to page 4 for further details on material matters.
Our
str
ateg
ic b
usin
ess
cont
ext
How
we
crea
te v
alue
Our
gov
erna
nce
Our
per
form
ance
revi
ewA
ddit
iona
l inf
orm
atio
nW
ho w
e ar
e

Sasol Integrated Report 2017 31
Building and managing trust-based relationships with all our stakeholders is a business imperative: our strategic success depends on it. Creating and maintaining a stable workforce is also essential. A prolonged strike at our Mining operations in 2017 led to additional costs of R1,4 billion, (including external purchases) reducing our profitability and requiring renewed and extensive efforts to reintegrate teams and stabilise the workforce.
All of the industries in which Sasol participates are impacted to some extent by the adoption of digital solutions. Digital encompasses new ways of synchronising, improving and optimising systems and processes across companies, customers and products through the use of hyper-connectivity, data proliferation and leaps in technology. To improve our efficiencies and customer experience as well as maintain our competitiveness we need to embrace more digital solutions, and in so doing ensure maximum returns.
HOW WE ARE RESPONDING• We engage with stakeholders through a planned
annual programme. It involves communicating the strategic aspirations, performance, decisions and activities that impact our stakeholders or are of significant interest to them. We communicate in a manner which is both honest and transparent and aim to understand our stakeholders’ perspectives.
• In South Africa, we work to enhance partnerships aimed at improving the lives of people in our fenceline communities as well as working with multiple stakeholders to promote inclusive economic growth.
• We strive to provide a work environment that promotes a values-driven, high-performance culture, offers sustainable and versatile careers, encourages diversity and transformation, and fosters sound employee relations.
• Following the Mining strike, we undertook a detailed survey of employees’ levels of indebtedness and offered financial support to employees to restructure their debt. We continued to work to enhance the Sasol employee value proposition, particularly for lower-level employees.
• We embarked on a journey to formally define our digital roadmap, which will be a key input into our strategy, defining our required digital capabilities and skills and plans going forward. We adopted a formal and focused initiative to unlock value across multiple value chain areas, selecting a strategic partner to help develop our digital roadmap and determine our digital opportunity.
• Our Digital Catalyst pilot programme aims to transform how we do business with our chemicals customers. It is about recreating the future of planning and scheduling through automation; enhancing order management by leveraging digital solutions; improving warehousing by reducing quality assurance time and implementing smart sensors and warehouse management systems.
MANAGING THE CAPITAL TRADE-OFFSGreater engagement with stakeholders, and in particular our employees to create a stable workforce, boosts the stocks of human capital and social and relationship capital, and ultimately financial capital. Manufactured and intellectual capital benefit from our investment in digital technologies, however in the short-term this has a negative impact on financial capital. Ultimately, as we become more efficient, this investment should boost this capital but potentially to the detriment of human capital.
MAINTAINING OUR BPEP
AND RP INITIATIVES;ENTERING INTO
DERIVATIVE CONTRACTS
EMBRACING DIGITAL SOLUTIONS;
FORMING STRONG RELATIONSHIPS
WITH OUR WORK-FORCE
DELIVERING
THROUGH STAKEHOLDER RELATIONSHIPS AND DIGITAL SOLUTIONS
Sasol Integrated Report 201730
MATERIAL MATTERS (continued)
DELIVERING
MAINTAINING OUR BPEP
AND RP INITIATIVES;ENTERING INTO
DERIVATIVE CONTRACTS
IMPLEMENTING NEW CAPITAL ALLOCATION PRINCIPLES;
PROGRESSING THE LCCP
Sasol operates in a cyclical and volatile environment. Remaining competitive and delivering superior returns to our stakeholders remain a key focus. When it starts up, the LCCP will have a significant impact on the growth of our earnings and hence capital availability.
We are working to improve Sasol’s capital allocation principles in pursuit of delivering maximum sustainable value for our shareholders and stakeholders. We are optimising the way we operate and leveraging our full capabilities while consistently achieving capital project performance. We have initiated a detailed asset review process to ensure that all assets in our portfolio deliver against our stringent financial metrics. This requires excellence in all we do, from achieving zero harm, leveraging our financial strength and raising capital at the best possible rates, to containing costs, honing talent management, executing projects more effectively and operating at sustainably higher rates. At Sasol, we undertake a holistic approach to growth and ensure that we contribute to lowering unemployment and creating opportunities in our supply chain within the communities in which we operate. We need to continue to promote social value, particularly in South Africa and Mozambique.
THROUGH DISCIPLINED CAPITAL ALLOCATION
Energy Chemicals
55%
45%
40%
60%
Current business Post LCCP start-up
EBIT
DA
Rbn
HOW WE ARE RESPONDING• We implemented a new capital allocation framework
in 2017 (see page 26) to drive a disciplined and transparent process.
• We progressed the LCCP according to plan, with the first units on track to start up in the second half of the 2018 calendar year. We are confident that we can manage the risks that remain on the project because of our increased management oversight, the detailed project control base that we have developed, and the assurance processes that we have put in place. We issued a revised LCCP fact sheet. The updated economics, earning profile, capital spend and sensitivities are detailed in the Analyst Book available online.
For further details refer to our website at www.sasol.com.
MANAGING THE CAPITAL TRADE-OFFS Improving our safety, production, technological, environmental and financial performance have positive implications for all the capital stocks. By ensuring efficient capital project planning and execution, we are able to support manufactured capital and make the best use of financial capital. Our work to upgrade community infrastructure boosted social and relationship capital, but at a cost to our financial capital.
LCCP, once commissioned, will move the product slate much more to chemicals with the geographic split from foreign sources increasing to approximately 50% once the LCCP is in full operation.
South Africa EuropeNorth America Rest of world
50%
65%
22%
7%
21%
Current business Post LCCP start-up
EBIT
DA
by
geog
raph
ic re
gion
12%17%
6%
Our
str
ateg
ic b
usin
ess
cont
ext
How
we
crea
te v
alue
Our
gov
erna
nce
Our
per
form
ance
revi
ewA
ddit
iona
l inf
orm
atio
nW
ho w
e ar
e

Sasol Integrated Report 2017 33
At Sasol, safety is a way of life. It is a belief that zero harm is possible, through dedicated focus and teamwork. For Sasol, this is a journey we will continuously improve on. It is founded on a standardised and systematic approach to Safety, Health and Environment (SHE). Our SHE fundamentals emphasise leadership and accountability across our operations, engage our workforce and require a risk-based approach to inform the implementation of controls and associated activities at each operation. Despite our Recordable Case Rate (RCR) declining steadily, the number of high-severity injuries, as evidenced by the fatalities and life-altering injuries, is not declining. The past year was a challenging one for safety performance. We experienced five fatalities which is unacceptable:
• Mr Themba Mahlangu from Sasol Mining was struck by a pipe that dislodged under pressure causing fatal injury;
• Mr Johannes Mashili from Sasol Mining was trapped between the cab of a shuttle car and a underground side wall;
• Mr Gideon Coetzee and Mr Carl Vermaak from Supply Chain were fatally injured in a motor vehicle accident on the N17 highway; and
• Mr Tyler Truett, a service provider in the Lake Charles Chemicals Project, passed away after falling through an opening in a scaffold.
HOW WE ARE RESPONDINGOur heartfelt condolences go out to the families of the fatally injured. These five fatality incidents were thoroughly investigated and the root cause analysis shared with the Board. The learnings from the root cause analysis were then brought into our overall approach to safety to strengthen it and ensure our actions are correctly focused and informed by our priorities.
Specific focus from the fatality incidents included:• understanding the critical control failure;• sharing of lessons learnt; and• a reinforced approach to behaviour, transformation,
as well as behaviour-based safety.
Death benefits from Sasol to the employees fatally injured while on duty, as may be applicable, include salary, short-term incentive, share-based payments, leave encashment payment, personal accident and benefit fund as well as funeral benefits. Other payments include risk and retirement fund benefits based on employee-selected schemes and claims for Compensation for Occupational Injury and Disease.
SAFETY
MANAGING THE CAPITAL TRADE-OFFSThere is no trade-off for the safety of our people. Any loss of life in the workplace is completely unacceptable and is damaging to nearly all the capital stocks – human, social and relationship, intellectual and financial.Many of the fatalities in the year were preventable and arose from practices that were not aligned to our safety policies.
MAINTAINING OUR BPEP
AND RP INITIATIVES;ENTERING INTO
DERIVATIVE CONTRACTS
PURSUING ZERO HARM THROUGH
DISCIPLINE, FOCUS AND TEAMWORK
Sasol fatalities
Num
ber o
f fat
alit
ies
01 02 03 04 05 06 07 08 09 10 11 12 13 14 1615 170
2
4
6
8
10
12
14
16
18
MATERIAL MATTERS (continued)
Sasol Integrated Report 201732
Human capital management is key in enabling the execution of our Group business strategy. We continued to focus on building a resilient and engaged workforce. By leveraging the skills, experience, diversity and productivity of our people, we are able to operate our facilities safely, reliably and sustainably, and deliver on our growth objectives. To this end, we continued to invest in sponsored study, technical learning programmes, as well as leadership, career, succession development interventions and critical skills development to secure a pipeline of future talent.
Our diversity and inclusion 10-Point Plan provides a set of qualitative measures designed to enable the achievement of our diversity objectives, including the recruitment, development and retention of candidates from underrepresented groups, as well as measures to enhance gender equity.
Our culture transformation journey continues. It includes the embedding of our three critical behaviours: • work to a common game plan; • adopt a “One Sasol, one bottom-line” approach; and• embrace empowered accountability.
To drive the next phase of our culture transformation journey, we have refreshed our purpose, vision and values based on employee feedback received from the Heartbeat Survey in 2016. Promoting a healthy workforce through an integrated health and wellness approach contributes not only to employee health but also to the safety of our employees and service providers, and enhances productivity.
We continued to maintain constructive relationships with all representative unions and works councils that enjoy consultative or negotiating powers on issues of mutual interest. However, in South Africa, socio-political developments adversely impacted stability in the labour market. We had a prolonged strike at Mining therefore restoring a positive relationship with our employees, and enhancing our engagement levels to ensure optimal productivity, is a priority.
HOW WE ARE RESPONDING• We refined our approach to employee wellness,
focusing on disease management, psychosocial wellness and risk management.
• We adopted a risk-based approach to minimise labour volatility challenges. This required a review of our broader employee relations landscape and the adoption of a more integrated approach across all affected stakeholder groups aimed at achieving greater employee engagement and ensuring business continuity.
• We invested R1 billion in bursaries, learnerships and scarce critical skills development.
• Although we have made significant progress in improving diversity at Sasol, there is still work to do. In 2017, we released R70 million from Response Plan savings to invest in targeted development programmes.
• Women empowerment remains a key focus area. In South Africa women in operations programmes have been implemented across the majority of operating model entities. In the US, women were the recipients of all the bursaries we awarded in the year.
• Our bursary and graduate programmes are designed to secure the critical and scarce skills required to operate our plants and deliver on our long-term growth ambitions.
• We refreshed the Sasol values to address the feedback received from employees through the Heartbeat Survey and to drive the next phase of our transformation journey.
MANAGEMENT
MANAGING THE CAPITAL TRADE-OFFSOur BPEP and RP initiatives to achieve cost savings targets led to continued efforts to manage our headcount and negatively impacted our human capital, hence we remained focused on the health and wellbeing of our employees; developing them and ensuring our culture is one of high performance. Managing our external spend for service providers also negatively impacted our human capital, but benefited our financial capital.
MAINTAINING OUR BPEP
AND RP INITIATIVES;ENTERING INTO
DERIVATIVE CONTRACTS
REFINING OUR VALUES;
REVIEWING OUR EMPLOYEE RELATIONS;
SECURING SCARES SKILLS
Ethnic diversity improvement of South Africa
% A
fric
an, I
ndia
ns a
nd
Colo
ured
s
1312 14 15 16 170
1020
304050607080
Global gender diversity
77%
23%
Male
Female
Our
str
ateg
ic b
usin
ess
cont
ext
How
we
crea
te v
alue
Our
gov
erna
nce
Our
per
form
ance
revi
ewA
ddit
iona
l inf
orm
atio
nW
ho w
e ar
e
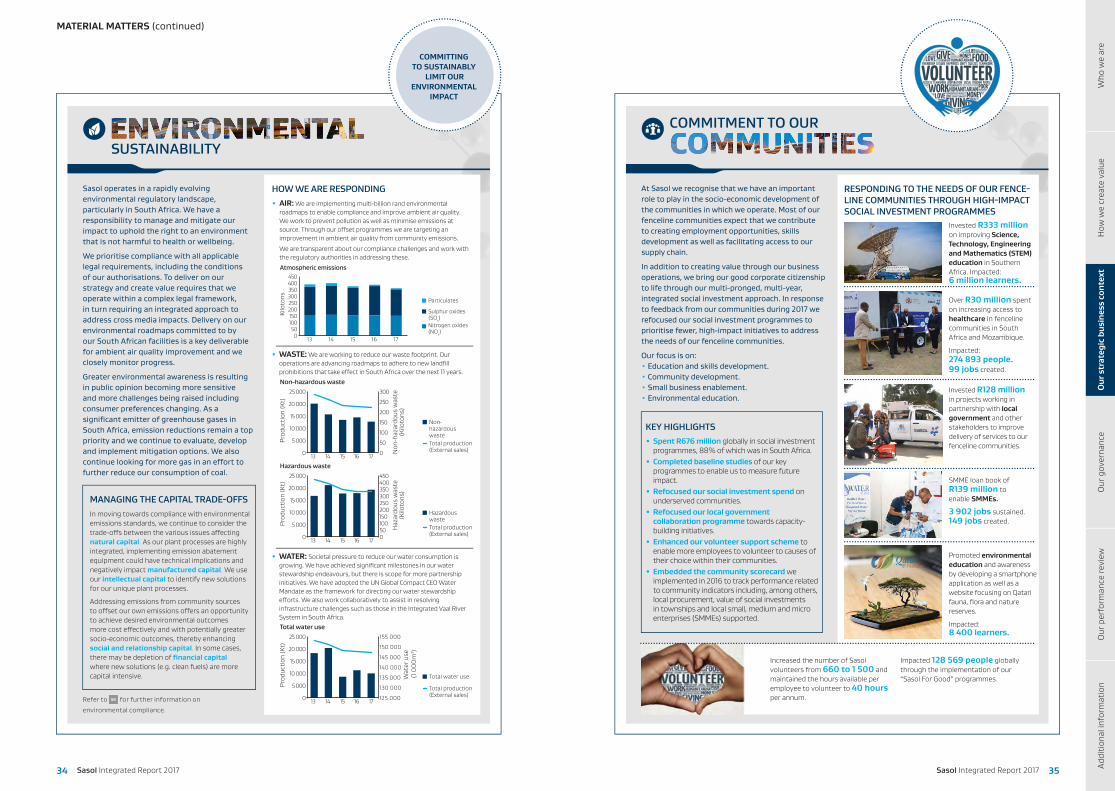
Sasol Integrated Report 2017 35
At Sasol we recognise that we have an important role to play in the socio-economic development of the communities in which we operate. Most of our fenceline communities expect that we contribute to creating employment opportunities, skills development as well as facilitating access to our supply chain.
In addition to creating value through our business operations, we bring our good corporate citizenship to life through our multi-pronged, multi-year, integrated social investment approach. In response to feedback from our communities during 2017 we refocused our social investment programmes to prioritise fewer, high-impact initiatives to address the needs of our fenceline communities.
Our focus is on:• Education and skills development.• Community development.• Small business enablement.• Environmental education.
KEY HIGHLIGHTS• Spent R676 million globally in social investment
programmes, 88% of which was in South Africa.• Completed baseline studies of our key
programmes to enable us to measure future impact.
• Refocused our social investment spend on underserved communities.
• Refocused our local government collaboration programme towards capacity- building initiatives.
• Enhanced our volunteer support scheme to enable more employees to volunteer to causes of their choice within their communities.
• Embedded the community scorecard we implemented in 2016 to track performance related to community indicators including, among others, local procurement, value of social investments in townships and local small, medium and micro enterprises (SMMEs) supported.
COMMITMENT TO OUR
Invested R333 million on improving Science, Technology, Engineering and Mathematics (STEM) education in Southern Africa. Impacted: 6 million learners.
RESPONDING TO THE NEEDS OF OUR FENCE- LINE COMMUNITIES THROUGH HIGH-IMPACT SOCIAL INVESTMENT PROGRAMMES
Over R30 million spent on increasing access to healthcare in fenceline communities in South Africa and Mozambique.
Impacted: 274 893 people.99 jobs created.
Invested R128 million in projects working in partnership with local government and other stakeholders to improve delivery of services to our fenceline communities.
SMME loan book of R139 million to enable SMMEs.
3 902 jobs sustained.149 jobs created.
Promoted environmental education and awareness by developing a smartphone application as well as a website focusing on Qatari fauna, flora and nature reserves.
Impacted:8 400 learners.
Increased the number of Sasol volunteers from 660 to 1 500 and maintained the hours available per employee to volunteer to 40 hours per annum.
Impacted 128 569 people globally through the implementation of our “Sasol For Good” programmes.
Sasol Integrated Report 201734
MATERIAL MATTERS (continued)
Sasol operates in a rapidly evolving environmental regulatory landscape, particularly in South Africa. We have a responsibility to manage and mitigate our impact to uphold the right to an environment that is not harmful to health or wellbeing.
We prioritise compliance with all applicable legal requirements, including the conditions of our authorisations. To deliver on our strategy and create value requires that we operate within a complex legal framework, in turn requiring an integrated approach to address cross media impacts. Delivery on our environmental roadmaps committed to by our South African facilities is a key deliverable for ambient air quality improvement and we closely monitor progress.
Greater environmental awareness is resulting in public opinion becoming more sensitive and more challenges being raised including consumer preferences changing. As a significant emitter of greenhouse gases in South Africa, emission reductions remain a top priority and we continue to evaluate, develop and implement mitigation options. We also continue looking for more gas in an effort to further reduce our consumption of coal.
HOW WE ARE RESPONDING• AIR: We are implementing multi-billion rand environmental
roadmaps to enable compliance and improve ambient air quality. We work to prevent pollution as well as minimise emissions at source. Through our offset programmes we are targeting an improvement in ambient air quality from community emissions.
We are transparent about our compliance challenges and work with the regulatory authorities in addressing these.
MANAGING THE CAPITAL TRADE-OFFSIn moving towards compliance with environmental emissions standards, we continue to consider the trade-offs between the various issues affecting natural capital. As our plant processes are highly integrated, implementing emission abatement equipment could have technical implications and negatively impact manufactured capital. We use our intellectual capital to identify new solutions for our unique plant processes.
Addressing emissions from community sources to offset our own emissions offers an opportunity to achieve desired environmental outcomes more cost effectively and with potentially greater socio-economic outcomes, thereby enhancing social and relationship capital. In some cases, there may be depletion of financial capital where new solutions (e.g. clean fuels) are more capital intensive.
SUSTAINABILITY
• WATER: Societal pressure to reduce our water consumption is growing. We have achieved significant milestones in our water stewardship endeavours, but there is scope for more partnership initiatives. We have adopted the UN Global Compact CEO Water Mandate as the framework for directing our water stewardship efforts. We also work collaboratively to assist in resolving infrastructure challenges such as those in the Integrated Vaal River System in South Africa.
• WASTE: We are working to reduce our waste footprint. Our operations are advancing roadmaps to adhere to new landfill prohibitions that take effect in South Africa over the next 11 years.
Atmospheric emissions
Kilo
tons
050
100150
200250300350400450
13 14 15 16 17
Nitrogen oxides (NOx)
Particulates
Sulphur oxides (SOx)
0
50
100
150
200
250
300
0
5 000
10 000
15 000
20 000
25 000
Non-hazardous wasteTotal production(External sales)
Non-hazardous waste
Prod
ucti
on (K
t)
Non
-haz
ardo
us w
aste
(Kilo
tons
)
13 14 15 16 17
Hazardous waste
050100150200250300350400450
0
5 000
10 000
15 000
20 000
25 000
Hazardous wasteTotal production(External sales)
Prod
ucti
on (K
t)
Haz
ardo
us w
aste
(Kilo
tons
)
13 14 15 16 17
Total water use
125 000
130 000
135 000
140 000
145 000
150 000
155 000
0
5 000
10 000
15 000
20 000
25 000
Total water use
Total production(External sales)
Prod
ucti
on (K
t)
Wat
er u
se
(1 0
00
m3 )
13 14 15 16 17
MAINTAINING OUR BPEP
AND RP INITIATIVES;ENTERING INTO
DERIVATIVE CONTRACTS
COMMITTINGTO SUSTAINABLY
LIMIT OUR ENVIRONMENTAL
IMPACT
Refer to for further information on
environmental compliance.
Our
str
ateg
ic b
usin
ess
cont
ext
How
we
crea
te v
alue
Our
gov
erna
nce
Our
per
form
ance
revi
ewA
ddit
iona
l inf
orm
atio
nW
ho w
e ar
e

Sasol Integrated Report 2017 37
Addressing stakeholders’ priority issuesWhile our stakeholders and the issues they raised are diverse, there are four main issues that emerged as a result of feedback from stakeholder engagements.
ISSUES RAISED STAKEHOLDER IMPACTED RESPONSE
TRANSFORMATION
• Sasol Inzalo Empowerment Scheme coming to end in 2018.
• Sasol’s B-BBEE contributor level 8.
• Suppliers.• Government.• Fenceline communities.• Customers.• Employees and labour.• Investors.
• A number of initiatives are being pursued that will improve our empowerment landscape sustainably to at least contributor level 4 status by 2020.
• We are considering a new B-BBEE scheme to replace the Sasol Inzalo transaction.
LOCALISATION AND LOCAL
CONTENT
• High barriers to entry into Sasol’s supply chain.
• Low procurement spend with SMME suppliers – particularly from our fenceline communities.
• Use of non-locals for employment opportunities ahead of locals.
• Fenceline communities – particularly the youth.
• Dedicated SMME team.• SMME loans from Sasol
Siyakha.• SMME incubator services
based in Sasolburg.• Procurement set asides
(South Africa, Mozambique and Louisiana, United States).
ENVIRONMENTAL COMPLIANCE AND
DISCLOSURE
• Compliance with environmental legislation particularly air quality.
• Transparency and ease of access to information.
• Perceived adverse health impacts of some emissions.
• Fenceline communities. • Non-governmental
organisations (NGOs).• National and local
government.
• Prioritise and enable compliance with applicable legal requirements.
• Continue to mitigate our environmental impacts.
• Implement environmental roadmaps.
• Implement offset programme.
PROGRESS ON LAKE CHARLES
CHEMICALS PROJECT
• Completion of Lake Charles Chemicals Project within revised cost and budget.
• Current shareholders and potential investors.
• Employees.• State and local government.
• Direct executive oversight of the project.
• Key project management changes.
• Initiatives implemented to improve productivity.
• Realignment of contracting strategies.
• Third party assurances for risk management and control.
• Assurance also provided by third parties for risk control and performance measurement.
Sasol Integrated Report 201736
BUILDING TRUST-BASED RELATIONSHIPS TO ENABLE GROWTH
We recognise that our success and ability to deliver growth depends on the support of all our stakeholders.
Broader environmentIndustry environmentMarket environmentInternal environment
As an international petrochemical company, Sasol is highly regulated at local, national and international levels. We also have to address expectations from diverse stakeholder groups with varying views of value creation.
Stakeholder engagement is fundamental to enabling Sasol’s strategic objectives as the process of protecting, creating and growing value is advanced through relationships with others.
It is a business imperative to understand and be responsive to the needs and interests of our stakeholders. Maintaining our socio-political licence to operate is core to how we work with our stakeholders.
Our stakeholder engagement approach is supported by open and effective communication, clear and agreed-on feedback processes, mutually benefi cial outcomes where possible and inclusiveness and integrity. We participate in initiatives to inform and ensure a best-practice approach in the areas of sustainability and social impact. We actively engage with our stakeholders to ensure the achievement of the best outcomes and strive towards a sustainable multi-stakeholder approach to solve diffi cult challenges.
Our strong commitment to the communities in which we operate drives our approach to sustainability. This includes socio-economic development, responsible business, transparency, health and partnership in infrastructure provision.
OUR STAKEHOLDER FOCUS IS TO POSITION SASOL AS A CREDIBLE PARTNER AND BUILD TRUST WITH ALL OUR STAKEHOLDERS
SALIENT FEATURESContinued engagement with governments on matters of mutual interest.
Through townhall engagement sessions, our Joint CEOs communicated and reached over 80% of employees.
Increased our SMMEs loan book funding to R139 million.
Refocused our social investment spend on underserved communities and spent R676 million globally on initiatives.
Stepped up our engagement with NGOs particularly regarding environmental matters.
Improved tonality and share of Sasol’s voice in the media through highlighted engagement.
Reinforced a stakeholder-focused mindset across the organisation by rolling out our Sasol Stakeholder Engagement Approach.
Our stakeholdersOur stakeholders are persons or groups who are directly or indirectly affected by our operations, as well as those who have interests in our business and/or the ability to infl uence outcomes – either positively or negatively.
Sasol has a complex network of stakeholders, often with competing interests.
Stakeholders may include local communities, national, provincial or local government authorities, politicians, religious leaders, civil society organisations and groups with special interests, the academic community and media. In addition, they include employees, investors, suppliers, customers and business partners.
*Non-governmental organisations
Customers
Organised labour
Employees
Shareholders
Business/JV partners
Suppliers
Organised business
and industry
Government, regulators and
political role players
Communities
NGOs*
Media
Our
str
ateg
ic b
usin
ess
cont
ext
How
we
crea
te v
alue
Our
gov
erna
nce
Our
per
form
ance
revi
ewA
ddit
iona
l inf
orm
atio
nW
ho w
e ar
e

Sasol Integrated Report 2017 39
Media roundtables:There is a strong interest in Sasol across a number of issues. The media roundtables gave deeper insight into our business.
Joint CEOs with South African and American media. Lake Charles Chemicals Project, United States.
Communities:Maintaining our socio-political licence to operate is core to how we work with our host communities. Our commitment to these communities includes social investment initiatives, partnership with local authorities to improve service delivery as well as “Sasol For Good” volunteers’ efforts to community projects.
Engaging with communities on environmental issues. Zamdela, Sasolburg, South Africa.
Mobile clinic. Sasolburg, South Africa.
“Sasol For Good” volunteers assisted in building a home for veterans, in support of the Habitat for Humanity initiative, which aims to provide local families with safe, decent and affordable housing. Louisiana, United States.
Investing in Nancefield Primary School. Kliptown, Johannesburg, South Africa.
Community-based tree planting project. Louisiana, United States.
Sasol Techno X is Sasol’s flagship career and education event that aims to encourage high school learners to choose Science, Technology and Mathematics at school. To date, the event has attracted more than 360 000 visitors. Secunda, South Africa.
Bokamosa Car Wash is a business supported by Sasol as part of our small business enablement initiative. It employs seven people and, on average, washes more than 40 cars per day. Sasol Place, Sandton, Johannesburg.
During the year six sessions were held
Joint CEOs walkabout. Sasol Place, Sandton, South Africa.
Sasol Integrated Report 201738
We actively engage with our stakeholders to ensure the achievement of our strategy and strive towards a multi-stakeholder approach towards solving difficult challenges.
ENGAGING WITH OUR STAKEHOLDERS
Government:We focused on maintaining good working relationships with governmental authorities keeping them informed of our activities, on-going projects and key concerns.
Employees:Our Joint CEOs set out to connect with employees to drive our values-driven, high-performance culture.
Mozambican President Filipe Nyusi visited the Sasol-sponsored Nhamacunda Housing Village. Inhambane, Mozambique.
Member of the South African Portfolio Committee on Environment Solomon Mabilo at an oversight visit by the committee. Secunda, South Africa.
South Africa’s Deputy President Cyril Ramaphosa accompanied by Health Minister Aaron Motsoaledi at the inauguration of eMbalenhle Extension 14 Clinic. Sasol, in collaboration with the National Department of Health, upgraded the healthcare facility. Secunda, South Africa.
Joint CEOs engaging staff at plant. Secunda, South Africa.
Joint CEOs visit to operations site. Brunsbüttel, Germany.
During the year our annual Sasol engagement plan was informed by Sasol’s and stakeholders’ priority issues. We responded both to progressing our strategic issues, addressing stakeholder concerns, as well as building more trust-based relationships with stakeholders. We expanded our engagement to include communities, environmental non-governmental organisations (NGOs), Parliamentary Portfolio Committees, senior government officials, the media and Sasol employees. In addition, our Joint CEOs actively increased their visibility globally with stakeholders, including staff. Most notably, in South Africa our Joint CEOs participated in the CEO Initiative aimed at shaping the economic trajectory of the country for the better. In addition, Sasol remains committed to Mozambique and participated in the “Advancing Mozambique” campaign as a key investor.
We continued our on-going engagements During the year more than 10 engagement sessions were held, reaching over 80% of staff globally
Then South African former Deputy Finance Minister Mcebisi Jonas with Joint CEOs at the inauguration of the C3 Expansion Project. Secunda, South Africa.
Our
str
ateg
ic b
usin
ess
cont
ext
How
we
crea
te v
alue
Our
gov
erna
nce
Our
per
form
ance
revi
ewA
ddit
iona
l inf
orm
atio
nW
ho w
e ar
e

Sasol Integrated Report 2017 41
OUTPUT:Risk profile. Response and controls per prioritised risk event
PROCESS:Identify the risk. Understand the risk
OUTPUT:Effective management of the risk
PROCESS:Manage and monitor the risk
OUTPUT:Improvement of action plans
PROCESS:Analyse and determine improvement focus
OUTPUT:Assurance on effectiveness of risk management
PROCESS:Govern and assure
Risk tolerance and risk appetiteWe understand and proactively manage risks within set risk appetite and risk tolerance levels, in order to optimise business returns. We define risk appetite as the amount and type of risk that we are willing to take in order to meet our strategic objectives. It is inextricably linked with expected returns. We define risk tolerance as the amount of uncertainty that we are prepared to accept and cope with. It identifies the maximum boundary, beyond which we are unwilling to operate.
Governance of risk management
The Board is responsible for the strategic direction and control of the company. Risk management is inextricably linked to our corporate strategy and control is exercised by way of a governance framework, which includes principles of effective risk management. The Board retains overall accountability for the governance of risk and effective risk management.
The Board reviews and assesses the integrity of the risk management processes, and in conjunction with the Audit Committee, it ensures that these processes comply with the relevant governance requirements and standards.
The Group Executive Committee (GEC) members are responsible and accountable for management of risks with delegated responsibility and ownership to their respective line managers, being the leaders of each Operating Model Entity (OME).
Oversight of risk management at OME level is executed through the relevant executive committees. Risk management is integrated with combined assurance to enhance assurance over our significant risks.
SasolLimitedBoard
Group Executive CommitteeExecutive oversight on Sasol’s
Group top risks
OME/Group functions top risks
Boardcommittees
Committees and othermandated committees
Group toprisks, risks on the “watch list” and material matters
OME and functionaltop risks
DOPLAN1 2
REVIEWIMPROVE
4 3
The ERM Framework includes our risk management process, which is aligned with Sasol’s operations excellence model (Plan, Do, Review, Improve) to efficiently manage and govern risk and enhance the monitoring of risk.
Review of risk appetite metrics considers the following:• Changes in business conditions
• Changes to the economic environment
• Evolving group and strategic principles and portfolio changes
• Changing competitive conditions
RISK APPETITE
MANAGEMENT PROCESS
Defi nerisk
appetite
Embed principles
Monitorapplication
Review metrics
Our financial risk appetite metrics:• Return on invested capital
• Earnings growth
• Net debt-to-EBITDA
• Gearing
Sasol Integrated Report 201740
RISK
Our approach to risk managementOur risk policy strengthens the link between strategy, risk and key decision-making processes that are required for effective risk management. In 2017 we evolved our risk management approach to ensure flexibility and relevance to Sasol’s business needs in a changing operating environment, by implementing the Enterprise Risk Management (ERM) Framework.
The ERM Framework enables effective risk management with measurable results ensuring continuous feedback to meet stakeholder requirements. We sustainably manage our risks by applying our ERM Framework, which is anchored in the five risk management fundamentals, namely: accountability, business knowledge, event-based risk management, risk-based responsiveness and risk assurance.
Our ERM Framework has improved our internal risk capabilities. It enables us to have line of sight of our full risk landscape through the utilisation of our risk categorisation tool named our risk breakdown structure. The risk breakdown structure has six categories namely: Financial, Operational, Market, People, Legal and Regulatory and Geopolitical and Corporate Affairs. We have adopted the bow-tie methodology to assist us in better analysing the risks we face.
Underpinned by our values, we proactively manage risk to enable the achievement of our strategic objectives and to maintain a positive reputation among our stakeholders. Risk management is inextricably linked to our strategy, is an essential element of sound corporate governance and a crucial enabler to exploit opportunities. Not only do we deal with the uncertainty in the business environment by minimising the downside, we also seek to capitalise on the upside potential to achieve our strategic objectives.
t
-
ENTERPRISE RISK MANAGEMENT FRAMEWORK
Feedback loop
Our
str
ateg
ic b
usin
ess
cont
ext
How
we
crea
te v
alue
Our
gov
erna
nce
Our
per
form
ance
revi
ewA
ddit
iona
l inf
orm
atio
nW
ho w
e ar
e

Sasol Integrated Report 2017 43
RISK AND RATIONALE KEY RESPONSES/MITIGATION STRATEGIC OBJECTIVES
1 Risk of macro-economic factors impacting our ability to sustain the business, manage our liquidity requirements and execute our growth strategy
• Actively managing the Group funding plan to ensure continued liquidity.• Implemented hedging strategy to limit downside risk to macro environment.• Continue to drive savings initiatives and new improvement initiatives.• On-going engagement with ratings agencies to improve their understanding of Sasol’s business.• Management of risk appetite and tolerance metrics.
2 Risk of our ability to remain competitive in the markets in which we operate and have growth aspirations
• The implementation of BPEP to sustainably ensure more effective, efficient and competitive response to changing global marketplace dynamics and intensifying of our RP.
• Update and implement sales and marketing strategies, including the development of new outlets and plans to grow new differentiated applications and to enhance logistics.
• Technology/application insight as the market entry strategy and maintaining a balanced portfolio.
3 Risk of not consistently achieving competitive capital project performance
• Robust integrated project management teams manage our capital projects. These teams combine our expertise with that of partner companies that have project management and deep local experience.
• Contracting strategy developed for capital projects to assist in mitigating potential cost and schedule risks.• Implemented various actions to strengthen the LCCP internal control environment.
4 Risk of non-compliance to laws, regulations and non-adherence to good governance practices
• Multi-disciplinary compliance programmes and identifying changes in the regulatory landscape, coupled with systems and processes to ensure compliance with applicable laws and other legal requirements.
• Tone at the top set through appropriate policies and procedures and annual compliance training and certification.
5 Risk of ineffective human capital management
• Various campaigns to drive attraction and retention of critical skills and targeted programmes to increase gender representation and inclusivity.
• Annual negotiations strive for multi-year agreements and a clear and well defined collective bargaining framework in combination with supporting procedures.
6 Risk of a major safety, health or environmental undesirable event or liability occurring
• Our zero harm philosophy and One Sasol SHE Excellence approach that standardises initiatives to enhance safety performance.• On-going emphasis of the importance of continuous risk awareness and the importance of life-saving behaviours, with strict
performance targets on safety, health and environment.• Continued focus on process safety management and the interaction with various global networks, regular internal and external audits
and the implementation of process safety roadmaps.
7 Risk of the impact of environmental challenges on the sustainability of our business model
• Prioritise and enable compliance with applicable legal requirements.• Implement committed environmental roadmaps and offsets. • Continued engagements with government departments on policy issues and challenges.• Proactive and appropriate disclosure of challenges faced.
8 Risk of major unplanned production interruptions impacting our integrated value chain
• Continued implementation and embedding of our operations’ standard framework and renewal and utilities expansion programmes.• Continued focus on achieving energy efficiency targets and the implementation of site water use efficiency measures.• Procurement of property damage, business interruption and liability insurance at acceptable levels.
9 Risk of not delivering on strategic growth objectives
• Capital allocation principles are applied to ensure optimal shareholder growth, taking balance sheet and funding risks into consideration.
• Proactive allowance for development funds and active portfolio management.
10 Risk of not building and sustaining trust-based relationship with our stakeholders
• Implementation of the B-BBEE strategy to achieve level 4 contributor status by 2020 including the tracking and monitoring of delivery against key stakeholder commitment and local content requirements.
• Regular engagement of key stakeholders by the Joint CEOs and engagements with government and regulators, media, NGOs and communities as defined in the systematic positioning plan.
11 Risk of undesirable geo-political and social events in countries in which we operate
• Continuous monitoring of developments and geopolitical events.• Response strategies implemented where required.
12 Risk of inadequate information security management of next generation cyber threats
• Group IM Information Security planning and monitoring of critical information security controls.• Global information security awareness campaigns and training and staying abreast of security technology requirements.• Regular governance review by the Board's committees.
Transitioning into the business of tomorrow
Sustaining our business of today
Our
str
ateg
ic b
usin
ess
cont
ext
How
we
crea
te v
alue
Our
gov
erna
nce
Our
per
form
ance
revi
ewA
ddit
iona
l inf
orm
atio
nW
ho w
e ar
e
Sasol Integrated Report 201742
THE WATCH LIST THEMES INCLUDE:
• Asset inflation;
• Major public health crisis and global pandemics;
• Global security incidents;
• Disruptive/new technologies; and
• Energy mix.
The risk “watch list” replaces our previous emerging risks. It contains risk areas not specifically covered in the revised group top risks and is constantly evolving. Jointly the top risks and “watch list” represent a comprehensive coverage of risks themes that could potentially impact Sasol.
Mitigating our top risks
RISK MANAGEMENT (continued)
Our top risks include:• risks and opportunities that have a direct potential impact on financial
risks which relate to revenue, earnings and capital as these financial risks are the main drivers of the approved risk appetite and tolerance metrics;
• risks that can impact our achievement of longer-term strategic objectives; and
• risks that can impact our near-to-medium term business plans and our reputation.
Incl
udes
qua
ntit
ativ
e an
d qu
alit
ativ
e ri
sk im
pact
s
LOW HIGHPROBABILITY
IMPA
CT
10 3 4 6
9
1
11
5 7 8
12
HIGH 2

Sasol Integrated Report 2017 45
Our
str
ateg
ic b
usin
ess
cont
ext
How
we
crea
te v
alue
Our
gov
erna
nce
Our
per
form
ance
revi
ewA
ddit
iona
l inf
orm
atio
nW
ho w
e ar
e
Sasol Integrated Report 201744
Sasol is a values-based organisation, committed to high standards of business integrity and ethics. The Board steers and sets the direction of the Group and brings independent, informed and effective judgement and leadership to bear on material decisions reserved for the Board, while ensuring that strategy, risk, performance and sustainable development considerations are effectively integrated and appropriately balanced. The Board is satisfied that it fulfilled all its duties and obligations in the 2017 financial year.
As a company listed on the Johannesburg Stock Exchange (JSE) and the New York Stock Exchange (NYSE), Sasol is subject to, and has implemented controls to provide reasonable assurance of compliance with all relevant requirements in respect of these listings. The Board confirms that Sasol's corporate governance practices do not in any significant way differ from those required of domestic companies under NYSE listing standards. We apply all the principles of the King Report on Corporate Governance for South Africa 2016 (King IV™).
The Board and its committees continue to closely monitor the implementation of Sasol’s legal compliance policy and processes and improve upon them, to mitigate the risk of non-compliance with the laws in the various jurisdictions in which we do business. Competition laws, anti-bribery and anti-corruption laws, sanction laws and safety, health and environmental laws, identified as key group legal compliance risk areas, remain our focus. We have implemented risk mitigation controls for each of these areas, aiming to achieve a balanced approach on compliance, by taking into consideration Sasol’s obligations as well as Sasol’s rights.
We regularly review and benchmark the Group’s governance structures and processes to ensure they support effective and ethical leadership, good corporate citizenship and sustainable development and ensure that they are applied in the best interests of Sasol and our stakeholders. We have the necessary policies and processes in place to ensure that all entities in the Sasol Group adhere to essential Group requirements and minimum governance standards. As a direct or indirect shareholder, Sasol exercises its rights and is involved in the decision-making of its subsidiaries on material matters and is satisfied that its delegation of authority framework contributes to role clarity and effective exercise of authority and responsibilities.
For more details on the responsibilities, powers, policies, practices and processes of the Board, directors and the Group’s executives and other officials, refer to the Board charter as well as the Group’s memorandum of incorporation on our website, www.sasol.com.
A statement on Sasol’s application of the principles of King IV™ is available on www.sasol.com.
Cont
rol/
Ass
uran
ce Disclosures
SASOL LIMITED SHAREHOLDERS
ETHICAL FOUNDATION
STAKEHOLDERS
SASOL LIMITED BOARD
JOINT PRESIDENTS AND CHIEF EXECUTIVE OFFICERS
GROUP EXECUTIVE COMMITTEE4
EXECUTIVE VICE PRESIDENTS
WHOLLY OWNED SUBSIDIARIES AND OPERATING MODEL ENTITIES
ASSOCIATES, JOINT VENTURES AND SHAREHOLDERS
Combined Assurance and
Disclosure Committee
Investment Committee
Sustainability and Stakeholder
Relations Committee
Sanctions Compliance Committee
Audit Committee
Risk and SHE Committee2
CapitalInvestmentCommittee
Remuneration Committee
Nomination, Governance,
Social and Ethics Committee1
Ris
k/O
ppor
tuni
ty
1 Changed from Nomination, Governance, Social and Ethics Committee to Nomination and Governance Committee with effect from 1 July 2017.2 The Risk and SHE Committee was reconstituted as the Safety, Social and Ethics Committee with effect from 1 July 2017.3 The Hedging Committee was broadened to the Digital, Information Management and Hedging Committee with effect from 1 July 2017.4 The Board appoints Group Executive Committee members on the recommendation of the Joint Presidents and Chief Executive Officers and
the Nomination, Governance, Social and Ethics Committee.
HedgingCommittee3
OUR GOVERNANCE FRAMEWORKOur directors and the composition of the Board and committees
1 In terms of our memorandum of incorporation, the Board shall consist of a maximum of 16 directors. Up to five may be executive directors. One-third of directors must retire at every Annual General Meeting and are eligible for re-election.
2 Lead independent director.3 Appointed as independent non-executive director on 1 March 2017.4 Appointed as executive director and Joint President and CEO with effect from 1 July 2016.5 Resigned as executive director and Executive Vice President, Strategy and Sustainability with effect from 31 December 2016.6 Appointed as executive director and CFO with effect from 1 July 2016.7 The Joint Presidents and Chief Executive Officers are not members of these committees but attend meetings by invitation. They are requested to leave
the meeting, where appropriate, before any decisions are made that relate to them personally.8 Appointed as a member with effect from 1 July 2017.9 Appointed as a member with effect from 9 September 2016.
The Board recognises and embraces the benefits of diversity at Board level, to enhance the range of directors’ perspectives. We appreciate that Board diversity is an essential component for sustaining a competitive advantage. Directors are chosen for their corporate leadership skills, experience and expertise. A combination of business, geographic and academic backgrounds as well as diversity in age, gender and race, enhance the composition of a truly diverse Board.
In the year, we announced the appointment of two new female non-executive independent directors, Mss GMB Kennealy and ME Nkeli. We also announced the resignation of Ms VN Fakude, executive director and Executive Vice President, Strategy and Sustainability.
The Nomination, Governance, Social and Ethics Committee assisted with the identification of suitable candidates to be proposed for appointment to the Board, taking into consideration the annual review of Board effectiveness, which includes among others, its composition. We consider all facets of diversity, in determining the optimal composition of the Board, having due regard to the Board’s gender diversity policy, which should be balanced appropriately and enable it to discharge its duties and responsibilities effectively.
We are comfortable that we have the right balance of skills, experience and independence to make a meaningful contribution to the business of the company.
BOARD OF DIRECTORS1
Independent non-executive directorsMSV Gantsho(Chairman)C BeggsMJ CuambeHG Dijkgraaf 2
NNA MatyumzaIN MkhizeZM MkhizeMJN NjekePJ Robertson
S WestwellGMB Kennealy 3
ME Nkeli 3
Executive directorsB Nqwababa 4
SR Cornell 4
VN Fakude 5
P Victor 6
7 Meetings/100% attendance22 Aug 2016 24 Feb 20179 Sept 2016 22 May 201724 Nov 2016 25 May 201725 Nov 2016
REMUNERATION COMMITTEE 7
Independent non-executive directorsHG Dijkgraaf (Chairman)MSV Gantsho IN MkhizeME Nkeli 8
PJ RobertsonNNA Matyumza
5 meetings100% attendance
NOMINATION, GOVERNANCE, SOCIAL AND ETHICS COMMITTEE 7
Independent non-executive directorsMSV Gantsho (Chairman)HG DijkgraafZM MkhizeMJN Njeke
5 meetings100% attendance
AUDIT COMMITTEE 7
Independent non-executive directorsC Beggs (Chairman)GMB Kennealy 8
NNA MatyumzaIN MkhizeMJN NjekeS Westwell
6 meetings100% attendance
RISK AND SHE COMMITTEE
Independent non-executive directorsIN Mkhize (Chairman)C BeggsMJ Cuambe 9
MSV GantshoPJ Robertson S Westwell
4 meetings100% attendance
Executive directorsB NqwababaSR CornellP Victor
CAPITAL INVESTMENT COMMITTEEIndependent non-executive directorsPJ Robertson (Chairman)MJ CuambeGMB Kennealy 8
NNA Matyumza S Westwell
4 meetings100% attendance
Executive directorsSR CornellB NqwababaP Victor
HEDGING COMMITTEE
Independent non-executive directorsS Westwell (Chairman)C BeggsIN MkhizePJ Robertson
4 meetings100% attendance
Executive directorsSR CornellB NqwababaP Victor

Sasol Integrated Report 2017 47Sasol Integrated Report 201746
OUR GOVERNANCE FRAMEWORK (continued)
The Board determined a target of
30% representation of women on the Board by 30 June 2019.
• Reliable and effective reporting remains the greatest enabler to empower the Board to execute its responsibilities and focus on appropriate matters.
• With a few exceptions indicated below, the Board is working well; the structure, mandate and decision roles are appropriate for the size/complexity of Sasol and the Chairman’s performance is satisfactory.
• The Board will focus on allocating more time to top talent discussions and restructuring Board committees – the social and ethics aspect of the Nomination, Governance, Social and Ethics Committee has been carved out as a separate committee going forward. The Risk and SHE Committee has been disbanded, with the Board assuming direct responsibility for the governance of risk, supported by all the Board Committees, responsible for ensuring the effective monitoring of risks within the ambit of the Committees’ scope.
Diversity and size
Mandates and decision
roles
Meeting mix and
frequency
Preparation process and
time
Templates and visuals
Quantity and synthesis of
material
Strategic vs.
operational focus
Committees and
membership
Assessed on eight dimensions of effective
Board enablers
PerformanceThe evaluation of the effectiveness and performance of the Board, its committees, individual directors and the Chairman was externally assessed this financial year. We are satisfied that the evaluation process is improving the Board’s performance and effectiveness.
DevelopmentThe development of industry and group knowledge is a continuous process and we brief directors on legal developments and changes in the risk and general business environment on an on-going basis. We apprise newly appointed directors of Sasol’s business and their duties and responsibilities as directors and give them the opportunity to visit Sasol’s plants and operations.
The Board, its committees as well as any director are entitled to seek independent professional advice concerning the company’s affairs and to gain access to any information they may require in discharging their duties as directors.
The roles and functions of the Chairman, the Lead Independent Director and the Joint Presidents and Chief Executive Officers are described in the Board charter available on our website at www.sasol.com.
The complete terms of reference of the committees are available on Sasol’s website, www.sasol.com.
A summary of the terms of reference of the Audit Committee, including its duties and the execution thereof, are set out in the Audit Committee report included in the Annual Financial Statements and the functions of the Remuneration Committee, as well as directors’ remuneration and other relevant remuneration information are available in the Remuneration Report.
The committees established by the Board play an important role in enhancing standards of governance and effectiveness within the Group. The terms of reference of the Board and its committees form part of the Board charter and are reviewed every year.
2017
26,7%
2016
21,4%
Target
30% Dr Mandla SV Gantsho, Chairman
We, specifically, consider the independence of directors and their other commitments when they are first appointed, as well as annually, or at any other time when a director’s circumstances change and warrant re-evaluation. This is done to determine whether a director has sufficient time to discharge his or her duties effectively and is free from conflicts that cannot be managed satisfactorily. Should the Nomination, Governance, Social and Ethics Committee be of the view that a director is over-committed or has an unmanageable conflict, the Chairman will meet with that director to discuss the resolution of the matter, to the satisfaction of the Committee.
It was also decided and the memorandum of incorporation accordingly amended, that no director going forward, would hold office for longer than nine years. The Board may nominate a director who served for nine years for re-election for additional periods of one year at a time, but no such director’s term of office shall exceed twelve years. In order to retain necessary skills and experience, it was also agreed to remove the age restriction and directors are now allowed to serve irrespective of their age.
The Board is of the view that all non-executive directors are independent, in accordance with King IV™ and the rules of the NYSE. We have reconfirmed the independence of our non-executive directors who have been in office for more than nine years, namely Dr MSV Gantsho, Ms IN Mkhize and Mr HG Dijkgraaf. We did this after taking into account, among other considerations, the extent to which the diversity of their views, skills and experience continue to enhance the Board’s effectiveness. Succession planning is a current key focus area.
Dear stakeholder,
On behalf of the Nomination, Governance, Social and Ethics Committee, I am pleased to present the report on social and ethics matters.
In executing our social and ethics responsibilities, as required by the South African Companies Act, the Nomination, Governance, Social and Ethics Committee considered and monitored Sasol’s activities, having regard to relevant legislation, human rights and prevailing best practice, in matters relating to:
• Social and economic development, including Sasol’s compliance with the 10 principles of the United Nations Global Compact as well as the purpose of the Organisation for Economic Co-operation and Development recommendations regarding corruption. The Committee also considered Sasol’s activities in relation to good corporate citizenship, with an emphasis on Sasol’s social investment and global programmes embarked on within education, skills development, environment, community development and employee volunteerism.
The Board was responsible for considering and monitoring Sasol’s activities in relation to all environmental, health and public safety matters, including the impact of the company’s products and services on stakeholders.
• Labour and employment activities, taking into consideration employment relationships, organised labour and the International Labour Organisation Protocol on decent work and working conditions. The Committee also considered Sasol’s progress in terms of the South African Employment Equity Act, No 55 of 1998, focusing on gender diversity and women empowerment and Sasol’s contribution towards the educational development of employees. Sasol is committed to promoting equal opportunities and fair employment practices, globally, across all its businesses. We have implemented several programmes to ensure the practical application of our commitment to human rights, including worker participation and employment equity, always maintaining our high standards and statutory compliance.
Sasol’s code of ethics applies to all our directors and employees, it emphasises that ethical behaviour in everything Sasol does, globally, is an essential building block to embed a values-driven organisation and high-performance culture. We have translated the revised code into the most common languages of the major countries in which we operate. Our values are included in employee’s performance assessments. We also conduct extensive awareness campaigns for our employees, service providers and customers and have implemented a supplier code of ethics.
• Stakeholder relationships, including supplier and consumer relationships and the governance of the Group’s stakeholder engagement activities as well as Sasol’s standing in terms of the South African Broad-Based Black Economic Empowerment (B-BBEE) Act, No 53 of 2003, including Sasol’s proposed response to the revised B-BBEE Codes.
The Board, assisted by the Committee, ensures that disputes with Sasol’s stakeholders are resolved as effectively, efficiently and expeditiously as possible. It considered the legitimate interests and expectations of stakeholders in all its decision-making. We regularly communicate with our stakeholders, including by presenting the Group’s strategy and performance. In terms of the Promotion of Access to Information Act, 2 of 2000, Sasol considers and responds to all requests for access to information. We ensure appropriate engagement with requesting parties, without compromising Sasol’s rights with respect to the protection of certain information.
Dr Mandla SV GantshoChairman
28 August 2017
The code of ethics is available on our website http://www.sasol.com/sustainability/ethics.
Further details on our sustainability reporting, including social and ethics matters are provided on our website at www.sasol.com.
REPORT OF THE NOMINATION, GOVERNANCE, SOCIAL AND ETHICS COMMITTEE
Our
str
ateg
ic b
usin
ess
cont
ext
How
we
crea
te v
alue
Our
gov
erna
nce
Our
per
form
ance
revi
ewA
ddit
iona
l inf
orm
atio
nW
ho w
e ar
e

CHAIRMANDr Mandla SV Gantsho
Sasol Integrated Report 2017 49
65%7%
7%
7%
7%7%
Nationalities
%
South African: 10American/British: 1British: 1Mozambican: 1Dutch: 1American: 1
Upstream oil and gas
Mining
Chemicals
Finance, mergers and acquisitions
Strategy
Risk
Corporate governance
Sasol Integrated Report 201748
BOARD DIVERSITYThe diversity and skills of the Board ensures that Sasol is steered to deliver growth to all our stakeholders.
FROM LEFT:Bongani Nqwababa, Stephen Cornell, Paul Victor, Mpho Nkeli, Trix Kennealy, Nomgando Matyumza, Henk Dijkgraaf
OUR BOARD OF
Tenure
20%
40%
20%
20%
0-3 years: 63-5 years: 36-8 years: 39+ years: 3
Average 7 years
Demographics
3
12
4
11
7
8
Executives:
Independent non-executives:
Female:
Male:
Historically disadvantaged:
Non-historically disadvantaged:
The Board is responsible for the strategic direction and ultimate control of the company according to its memorandum of incorporation and board charter. Through its oversight and strategic steer, it ensures that Sasol capitalises on its opportunities as an ethical, decisive and responsible corporate citizen.
The careful selection of individual directors, to ensure the most appropriate combination of expertise and experience, underpins the effectiveness of the Board in fulfi lling its role.
FROM LEFT:Colin Beggs, Stephen Westwell, Moses Mkhize, JJ Njeke, Imogen Mkhize, Peter Robertson and Manuel Cuambe
Experience
Our
str
ateg
ic b
usin
ess
cont
ext
How
we
crea
te v
alue
Our
gov
erna
nce
Our
per
form
ance
revi
ewA
ddit
iona
l inf
orm
atio
nW
ho w
e ar
e

Sasol Integrated Report 2017 51
The Board of Directors CVs are available on Sasol's website, www.sasol.com.
STEPHEN WESTWELLBorn: 1958
INDEPENDENT NON-EXECUTIVE DIRECTOR
BSc (Mech Eng), MSc (Management), MBA
Appointed to the Board in 2012
Board committee:– Audit Committee– Capital Investment Committee– Digital, Information Management and
Hedging Committee– Safety, Social and Ethics Committee
MOSES MKHIZEBorn: 1961
INDEPENDENT NON-EXECUTIVE DIRECTOR
BCom (Hons), Higher Diploma (Electrical Engineering)
Appointed to the Board in 2011
Board committee:– Nomination and Governance Committee
MPHO NKELIBorn: 1964
INDEPENDENT NON-EXECUTIVE DIRECTOR
BSc (Environmental Science), MBA
Appointed to the Board in 2017
Board committee:– Remuneration Committee**– Safety, Social and Ethics Committee**
* Ms Imogen Mkhize will retire as a non-executive director on 17 November 2017, having served the Board for a period of 12 years.
** Appointed as member on 1 July 2017.
STEPHEN CORNELL Born: 1956
JOINT PRESIDENT AND CEO
BSc Chem Eng
Appointed to the Board in 2016
Board committee:– Capital Investment Committee– Digital, Information Management and
Hedging Committee– Safety, Social and Ethics Committee
Sasol Integrated Report 201750
OUR BOARD OF DIRECTORS (continued)
JJ NJEKEBorn: 1958
INDEPENDENT NON-EXECUTIVE DIRECTOR
BCompt (Hons), CA(SA), HDip Tax Law
Appointed to the Board in 2009
Board committee:– Audit Committee– Nomination and Governance Committee
COLIN BEGGSBorn: 1948
INDEPENDENT NON-EXECUTIVE DIRECTOR
BCom (Hons), CA(SA)
Appointed to the Board in 2009
Board committee:– Audit Committee– Digital, Information Management and
Hedging Committee– Safety, Social and Ethics Committee
HENK DIJKGRAAF Born: 1946
LEAD INDEPENDENT NON-EXECUTIVE DIRECTOR
MSc Eng (Mining)
Appointed to the Board in 2006
Board committee:– Nomination and Governance Committee– Remuneration Committee
PETER ROBERTSONBorn: 1947
INDEPENDENT NON-EXECUTIVE DIRECTOR
BSc (Mech Eng), MBA
Appointed to the Board in 2012
Board committee:– Capital Investment Committee– Digital, Information Management and
Hedging Committee– Remuneration Committee– Safety, Social and Ethics Committee
IMOGEN MKHIZE*Born: 1963
INDEPENDENT NON-EXECUTIVE DIRECTOR
BSc (Information Systems), MBA
Appointed to the Board in 2005
Board committee:– Audit Committee– Digital, Information Management and
Hedging Committee– Remuneration Committee– Safety, Social and Ethics Committee
MANDLA GANTSHO Born: 1962
CHAIRMANINDEPENDENT NON-EXECUTIVE DIRECTOR
BCom (Hons), CA(SA), MSc, MPhil, PhD
Appointed to the Board in 2003 and Chairman to the Board in 2013
Board committee:– Nomination and Governance Committee– Remuneration Committee– Safety, Social and Ethics Committee
PAUL VICTOR Born: 1972
CHIEF FINANCIAL OFFICER
BCompt (Hons), CA(SA), International Tax Law (Hons)
Appointed to the Board in 2016
Board committee:– Capital Investment Committee– Digital, Information Management and
Hedging Committee– Safety, Social and Ethics Committee
BONGANI NQWABABABorn: 1966
JOINT PRESIDENT AND CEO
BAcc (Hons), CA(Z), MBA
Appointed to the Board in 2013 and as an executive director in 2015
Board committee:– Capital Investment Committee– Digital, Information Management and
Hedging Committee– Safety, Social and Ethics Committee
MANUEL CUAMBEBorn: 1962
INDEPENDENT NON-EXECUTIVE DIRECTOR
B Eng
Appointed to the Board in 2016
Board committee:– Capital Investment Committee– Safety, Social and Ethics Committee
TRIX KENNEALYBorn: 1958
INDEPENDENT NON-EXECUTIVE DIRECTOR
BCom (Hons), CA(SA)
Appointed to the Board in 2017
Board committee:– Audit Committee**– Capital Investment Committee**
NOMGANDO MATYUMZA Born: 1963
INDEPENDENT NON-EXECUTIVE DIRECTOR
LLB, CA(SA)
Appointed to the Board in 2014
Board committee:– Audit Committee– Capital Investment Committee– Remuneration Committee
Our
str
ateg
ic b
usin
ess
cont
ext
How
we
crea
te v
alue
Our
gov
erna
nce
Our
per
form
ance
revi
ewA
ddit
iona
l inf
orm
atio
nW
ho w
e ar
e

Sasol Integrated Report 2017 53
The Joint Presidents and CEOs are jointly and severally liable and accountable and there is joint oversight in all decision-making. However, to ensure that the business is managed effectively, our leadership model uses dual reporting lines, allocating responsibilities into portfolios which comprise a balance across business, functions and regions.
STEPHAN SCHOEMANEXECUTIVE VICE PRESIDENT: TECHNOLOGY
BEng• South African: Born 1964• Appointed to the GEC in 2014
Prior to his current role Mr Schoeman was the Managing Director of Sasol Synfuels from May 2011 to March 2014. Prior to that, he was the Managing Director of Sasol Infrachem. Mr Schoeman has served in most of our South African operating facilities and has extensive international experience.
VUYO KAHLA*** EXECUTIVE VICE PRESIDENT: ADVISORY AND ASSURANCE AND SUPPLY CHAIN
BA, LLB• South African: Born 1970• Appointed to the GEC in 2011
From June 2004 to November 2010, Mr Kahla held executive positions in Transnet SOC Limited, with responsibility for legal services, risk management, compliance, company secretarial services, strategy and business modelling, corporate and public affairs and public policy and regulation. The World Economic Forum recognised him as a Young Global Leader and he is an alumnus of the Prince of Wales University of Cambridge Programme on Sustainability Leadership. He is the Chairman of the Council of Rhodes University.
Research and Technology
Capital Projects
Engineering
Planning and Optimisation
US Mega Projects
Legal, IP and Regulatory Services
Governance, Compliance and Ethics
Assurance Services
Supply Chain
Financial Control Services
Corporate Finance, Business Development and Portfolio
Management
Investor Relations
Information Management
HR: Human Capital
HR: Global Operations
Corporate Affairs
PAUL VICTOR* EXECUTIVE DIRECTOR AND CHIEF FINANCIAL OFFICER
BCompt (Hons), CA (SA), International Tax Law (Hons)• South African: Born 1972• Appointed to the GEC in 2016
Mr Victor became our Chief Financial Officer (CFO) on 1 July 2016. He was previously Senior Vice President: Financial Control Services at Sasol, and served as Acting CFO from 10 September 2013 to 28 February 2015. Prior to this, Mr Victor gained invaluable experience during his 10 years as Chief Financial Officer of Sasol Synfuels – a position he held until 2011.
CHARLOTTE MOKOENAEXECUTIVE VICE PRESIDENT: HUMAN RESOURCES AND CORPORATE AFFAIRS
BA (Human Resources Development and Social Sciences)• South African: Born 1965• Appointed to the GEC in 2017
Prior to this role, Ms Mokoena was the Human Resources Executive at Tongaat Hulett Limited. She held this position from July 2013. Prior to this, Ms Mokoena spent 11 years at Telkom South Africa Limited, during which time she held several senior positions spanning the human resources, business consulting and customer services disciplines.
Business Control Enablement
Business Enablement
Financial Disclosures and Corporate Transaction Support
* Executive Director of Sasol Limited.
*** Company Secretary of Sasol Limited.
RESPONSIBILITIES OF OUR GROUP EXECUTIVE COMMITTEE
Sasol Integrated Report 201752
JOINT PRESIDENTS AND CHIEF EXECUTIVE OFFICERSBongani Nqwababa* and Stephen Cornell*
Mining
Exploration and Production
US Operations
Eurasian Operations
Secunda Synfuels Operations
Secunda Chemicals Operations
Sasolburg Operations
Natref
Satellite Operations
Base Chemicals
Performance Chemicals
MAURICE RADEBE EXECUTIVE VICE PRESIDENT: ENERGY BUSINESS AND SUSTAINABILITY
BSc, MBA• South African: Born 1960• Appointed to the GEC in 2010
Mr Radebe joined Sasol Oil in January 2004, when Sasol Oil purchased Exel Petroleum, where he was the Managing Director. He served as the Managing Director of Sasol Oil from December 2006 until October 2010. He was chairman of the South African Petroleum Industry Association for the 2015 and 2016 calendar years. Prior to his current role, Mr Radebe was our Group Executive responsible for global corporate affairs, government relations and enterprise development.
RIAAN RADEMAN**
EXECUTIVE VICE PRESIDENT: UPSTREAM
BEng (Mech), MBL• South African: Born 1957• Appointed to the GEC in 2009
Prior to his current role Mr Rademan was responsible for mining, safety, health and environment, supply chain and information management, shared services, group information management and procurement and supply chain. He previously served as Managing Director of Sasol Nitro and Sasol Mining.
FLEETWOOD GROBLEREXECUTIVE VICE PRESIDENT: CHEMICALS BUSINESS
BEng (Mech)• South African: Born 1961• Appointed to the GEC in 2013
Prior to his appointment to the GEC, he was the Managing Director of Sasol Olefins & Surfactants. Mr Grobler joined Sasol in 1984 and has served in most of our South African operating facilities and has extensive experience in our international businesses.
BERNARD KLINGENBERGEXECUTIVE VICE PRESIDENT: OPERATIONS
MSc Eng (Mech)• South African: Born 1962• Appointed to the GEC in 2009
Since joining the Sasol Group in 1986, he has held various positions in maintenance, technical and general management fields in some of the South African Energy and the global chemical businesses of the Group. Mr Klingenberg was the Managing Director of Sasol Polymers from April 2007 to March 2009 responsible for Group human resources for two years from 2009 and before that the Managing Director of Sasol Nitro.
Energy
Risk & SHE
** Mr Rademan will retire on 30 September 2017, he will be replaced by Mr Harris who joined on 7 August 2017.
Our
str
ateg
ic b
usin
ess
cont
ext
How
we
crea
te v
alue
Our
gov
erna
nce
Our
per
form
ance
revi
ewA
ddit
iona
l inf
orm
atio
nW
ho w
e ar
e

Dear stakeholder,
On behalf of the Remuneration Committee, I am pleased to present the 2017 summarised remuneration report, which highlights the key components of our policy which align to the Group’s strategy and how the policy translated into reward outcomes. The detailed report is available on pages 27 to 45 of the Annual Financial Statements.
The committee is tasked by the Sasol Limited Board to independently approve and oversee the implementation of a remuneration policy that will encourage the achievement of the Group’s strategy and grow stakeholder value sustainably. Our policy should enable the attraction and retention of skilled resources and result in rewards aligned with shareholder interests.
In the year, we welcomed the King IV Code™ for South Africa and specifically Principle 14 addressing fair, responsible and transparent remuneration practices that promote the achievement of strategic objectives and positive outcomes in the short, medium and long term. We debated the matter of fair and responsible remuneration of employees across the organisation to ensure that remuneration is externally comparable and internally equitable.
Since 2011, the committee has engaged actively with Sasol’s large institutional investors who we consider important stakeholders and our remuneration policy has undergone significant changes.
WE HAVE CONSIDERED SHAREHOLDERS’ CONTRIBUTIONS THOROUGHLY and incorporated them into the policy where these enhancements align with the Group’s strategy. I would like to thank all Sasol’s shareholders for their continued support of our remuneration policy. At the November 2016 Annual General Meeting (AGM), 90,93% of votes cast were in favour of the policy.
Changes to our remuneration policyOver the past year we converted the cash-settled long-term incentive plan into an equity-settled scheme, replaced the corporate performance target of ‘attributable headline earnings’ with a ‘return on invested capital’ target and introduced an ‘energy efficiency’ target into the short-term incentive plan. In addition, we aligned the minimum shareholding requirements for executive directors to global norms. These amendments further support the delivery of Sasol’s strategic objectives and further incorporate environmental, social and governance matters into the Group’s remuneration policy.
Following the various policy changes made over the past few years, the committee believes that Sasol’s remuneration policy has matured and compares well with relevant market practice. For this reason, we do not consider it necessary at this time to make changes to the policy for the next financial year. We have, however, reviewed the targets in the short- and long-term incentive plans to ensure on-going relevance and appropriateness in the context of the macro-economic climate and Sasol’s business objectives.
Sasol Integrated Report 2017 55
WE ARE COMMITTED TO ENSURING THAT THE REMUNERATION POLICY AND PRACTICES ARE FAIR AND RESPONSIBLE and welcome the opportunity to discuss the policy and its outcomes with our stakeholders.
The committee, in response to questions by some of our shareholders, reviewed the vesting periods of long-term incentives and concluded that these are consistent with our major capital programmes.
Pay for performanceSasol’s financial results for 2017 were severely impacted by the volatile macro-economic environment. The unexpected strengthening of the rand against hard currencies, combined with the continued low crude oil price, impacted significantly on Sasol’s ability to meet earnings targets. The prolonged strike action at the Secunda mining operations also resulted in significant additional costs. Despite these challenges, Sasol maintained a resilient performance due to the Business Performance Enhancement Programme (BPEP) and Response Plan (RP) initiatives and was able to meet some of the targets set for the short-term incentive plan. The Group’s ‘total shareholder return’ performance was below target which resulted in a below-target long-term incentive plan vesting percentage. The committee believes that the policy and the incentive targets achieved their stated objectives, resulting in balanced reward outcomes in line with the organisation’s performance over the short and long term. The committee also requested an independent review on the relationship between executive pay and organisational performance and is comfortable that there is strong alignment. There were no exceptions to the policy which required the committee’s approval.
Henk DijkgraafChairman of the Remuneration Committee
17 August 2017
Sasol Integrated Report 201754
SUMMARISED REPORT OF THE REMUNERATION COMMITTEEHenk Dijkgraaf, Chairman of the Remuneration Committee
Committed to fair and responsible pay practices
Solicit and welcome feedback from shareholders
Remuneration outcomes reflectthe business realities
KEY MESSAGES:
Our
str
ateg
ic b
usin
ess
cont
ext
How
we
crea
te v
alue
Our
gov
erna
nce
Our
per
form
ance
revi
ewA
ddit
iona
l inf
orm
atio
nW
ho w
e ar
e

Sasol Integrated Report 2017 57
Our remuneration policy is linked to our strategy and is a key enabler for the achievement of the Group’s key performance indicators. The threshold, target and maximum reward outcomes that could be derived under the terms of the policy are indicated in the following graph:
Share ownership by executive directors We require our executive directors to hold shares in the Group. These are to be acquired over a five-year period from the date of appointment, to the following value:
• Joint Presidents and CEOs: 300% of annual pensionable remuneration
• Chief Financial Officer and other executive directors: 200% of annual pensionable remuneration
Clawback policy We have a clawback policy that may be implemented by the Board where there were material misstatements of financial results or other calculation errors that resulted in the overpayment of incentives and gross misconduct on the part of the employee leading to dismissal.
Short-term incentive plan The configuration and weightings attached to the different parts of the STI formula differ to the extent that employees can influence the achievement of performance objectives either directly or indirectly. For executive management, the following STI formula is used to calculate the awards:
Basic salary/TGP x STI Target % x Group performance % x Individual performance % = STI Award
The following table sets out the targets and weightings approved for the 2017 STI plan. The only change from 2016 is the inclusion of the energy efficiency target:
2017 STI targets Weighting
Year-on-year growth in headline earnings 30%
Year-on-year growth in cash fixed costs (CFC) 20%
Year-on-year production volume growth (fuel-equivalent tons) 20%
Improvement in working capital and gross margin 10%
B-BBEE:10%Preferential procurement (5%)
Employment equity (5%)
Safety, health and environment:10%
FERs (3,3%); RCR (3,3%); energy efficiency (3,4%)
0
100
200
300
400
500
600
700
Joint Presidents & CEOs at
Target
Joint Presidents & CEOs at Maximum
Executive Director at
Target
Executive Director at Maximum
GEC at Target
GEC at Maximum
100% 100% 100%100% 100% 100%
115% 90% 75%
259%203% 169%
150%135%
110%
300%
270%220%
TGP*
STILTI
* Joint President and CEO, Executive Director and GEC at threshold performance will only receive TGP.
Sasol Integrated Report 201756
SUMMARISED REPORT OF THE REMUNERATION COMMITTEE (continued)
Overview of our remuneration policy The key components of our remuneration policy, structure and incentive targets are set out in the table below:
Remuneration component Policy principles Policy application
• TGP = base salary + cost of all employer contributions. • Broad pay bands are set with reference to location and
sector-specific median benchmark points.• For executive management, the benchmark is derived from
a comparator peer group resembling a similar geographic footprint, market capitalisation and business model as Sasol’s.
• The total cost of annual increases for employees below executive management is approved by the committee and set in accordance with expected market movement, affordability and forecast inflation.
• Distribution of increases to employees outside the bargaining forums is done with reference to individual performance, internal equity, competence and potential with an effective date of 1 October.
• Performance-based increases are not applied for the bargaining sector as across-the-board increases are applied with effect from 1 July.
• Employees in countries other than South Africa are paid a base salary rather than a TGP.
• Salaries are paid monthly to all employees except for employees in the United States and Canada who receive salary payments on a bi-weekly basis in line with local market practice.
• Employees who are promoted are considered for adjustments if justified.
• The company’s expatriate remuneration policy enables global mobility of key management and specialists. Salaries are adjusted for cost-of-living and location differences and tax equalisation is applied.
• Benefits include, but are not limited to, membership of a retirement plan and health insurance, disability and death cover to which contributions are made by both the company and the employee.
• Allowances are paid in terms of statutory compliance or as is prevalent in a sector/jurisdiction.
• Benefits are offered on retirement, for reasons of sickness, disability or death.
• The beneficiaries of employees who pass away while in service receive additional insurance depending on the retirement plan of which they were a member during service.
• Allowances are linked to roles within specific locations, and paid together with salaries. There are no allowances paid to those in senior management and higher levels.
• A number of special allowances including inter alia housing, cost of living, home leave and child education are included in the company’s expatriate remuneration policy.
• A single STI structure applies to all employees globally excluding certain employees who participate in mining production bonus or sales commission arrangements.
• Target incentives are set in accordance with median benchmarks.
• The STI structure consists of group, entity and individual performance targets set in advance of every financial year.
• Annual payment of STIs is in September, after approval by the committee.
• Production bonuses and commission schemes are paid out monthly.
• Group targets for 2017: a) Growth in headline earnings b) Growth in cash fixed costs c) Growth in production volumes d) Improvement in working capital and gross margin e) B-BBEE targets (for South African entities) in respect of
preferential procurement and employment equity f) Safety and sustainability targets – recordable case
rate (RCR), fires, explosions and releases (FERs) and improvement in energy efficiency in our manufacturing operations.
• Entity targets are set in line with business plans approved by the responsible Executive Vice President (EVP).
• Sustainability (including entity-specific environmental targets) are also set at entity level.
• Individual targets are included in the performance agreement and refer to the requirements of the role. These include major project milestones where relevant.
The LTI consists of future equity-settled payments calculated with reference to the market value of a Sasol ordinary share (or American Depositary Receipt (ADR) for international employees), subject to the vesting conditions.
The committee is responsible for governing all LTI awards and considers these in respect of:• Internal and external promotions to qualifying roles;• Annual awards to eligible employees; and• Discretionary awards for purposes of retention.
Awards are directly linked to the role and individual performance, and vesting is subject to service and performance targets. The vesting period is three years for participants in leadership and senior management. A split vesting period of three and five years applies to participants in top management (EVPs and Senior Vice Presidents (SVPs)).
Of the total award, the following portion is linked to corporate performance targets (CPTs) • Group Executive Committee (GEC): 100%.• Other participants: 60%.Corporate performance targets include: • Total shareholders’ return vs. two indices, namely the
MSCI World Energy Index and the MSCI World Chemicals Index.
• Efficiencies measuring increase in tons produced over staff growth.
• Return on invested capital (ROIC).
TOTAL GUARANTEED
PACKAGE (TGP)/BASE SALARY
BENEFITS AND ALLOWANCES
SHORT-TERM INCENTIVE (STI)
PLAN
LONG-TERM INCENTIVE (LTI)
PLAN
Our
str
ateg
ic b
usin
ess
cont
ext
How
we
crea
te v
alue
Our
gov
erna
nce
Our
per
form
ance
revi
ewA
ddit
iona
l inf
orm
atio
nW
ho w
e ar
e

Sasol Integrated Report 2017 59
KPIs Group targetsWeight-ing
Threshold (Rating = 0%)
Target (Rating = 100%)
Stretch Target (Rating = 150%)
Achieve-ment
Weighted achieve-ment
QUALITY-BASED EARNINGS GROWTH Target: 8% USD EBIT growth
Year-on-year growth in headline earnings
30% 2016 headline earnings + CPI (measured over the fiscal year)
2016 headline earnings + CPI (measured over the fiscal year) + 2%
2016 headline earnings + CPI (measured over the fiscal year) + 8%
Below threshold
0%
GEARING Target: Achieve a gearing level of 20% – 40% (Temporarily lifted to 44% until the end of 2018)
Year-on-year growth in cash fixed costs (CFC)
20% Approved group 2017 CFC budget including BPEP savings of R9,6bn
Approved group 2017 CFC budget including BPEP savings of R10,6bn
Approved group 2017 CFC budget including BPEP savings of R11,6bn
In-line with target
19,37%
Year-on-year growth in production volumes (fuel-equivalent tons)
20% 2016 volumes 2016 volumes + 1%
2016 volumes + 2%
1,8% growth 28,00%
Improvement in working capital and gross margin
10% 15% below 2017 absolute working capital and gross margin budget
100% of 2017 absolute working capital and gross margin budget
15% better than 2017 absolute working capital and gross margin budget
8,8% below target
4,10%
BROAD-BASED BLACK ECONOMIC EMPOWERMENT Target: Level 4 by 2020
B-BBEE: Preferential procurement
5% 0% improvement on 51% Black-owned spend in South Africa of R3,2bn
51% Black-owned spend in South Africa of R4,5bn
51% Black-owned spend in South Africa of R5,0bn
Exceed stretch target
7,50%
Employment equity (Senior African and Coloured appointments)
5% 30% of all opportunities employed in the targeted groups
60% of all opportunities employed in the targeted groups
75% of all opportunities employed in the targeted groups
53% of opportunities utilised
3,77%
SAFETY, HEALTH AND ENVIRONMENT Target: RCR of less than 0,30 by 2020
Improvement in energy efficiency
SHE safety lagging indicator – occupational safety
3,3%
3,3%
0,36 RCR
> 27 FERs
0,30 RCR
27-24 FERs
0,27 RCR
23-21 FERs
RCR of 0,28 modified for five fatalities
Achieved stretch target
0%
4,95%
SHE environmental & sustainability
3,4% Energy efficiency improvement of 0,5% in South African operations
Energy efficiency improvement of 0,933% in South African operations
Energy efficiency improvement of 1,5% in South African operations
1,67% improvement
5,10%
Total: 72,79% (2016: 81,99%)
Implementation reportHere we provide an overview of achievements against the STI targets set for 2017, as well as the performance over the vesting periods for LTI awards that vest with reference to 2017’s performance:
Achievements against the 2017 STI targets:
Sasol Integrated Report 201758
SUMMARISED REPORT OF THE REMUNERATION COMMITTEE (continued)
Long-term incentive planWe decided to convert the cash-settled LTIs awarded since 2014 to equity-settled LTIs to strike a better balance between flexible reward for employees and shareholder preference for increased employee shareholding. The equity-settled LTI gives participating employees the opportunity, subject to the vesting conditions, to receive Sasol ordinary shares or American Depositary Receipts (ADR) for international employees in large businesses located outside of Southern Africa. Employees have the option to sell the shares after the vesting period.
A split vesting period applies to top management, where 50% of the award vests subject to the achievement of corporate performance targets after three years from the date of grant (performance period). The balance is released to the participant after a five-year period subject to the vesting conditions. Accelerated vesting principles in cases of termination for ‘good leavers’, do not apply to top management. A service penalty is applied for all participants whose services are terminated under ‘good leaver’ conditions before the end of the performance period.
The following table summarises the weightings and performance targets under which we granted the 2017 LTI awards. Vesting is considered in terms of the weighted performance measured against these four targets. There is no opportunity for the retesting of targets.
Measures1 Weighting Threshold
Target (at which 100% of the award vest)
Stretch (at which 200% of the award vest)
Increase in tons produced per head
25% 0% improvement on base
1% improvement on base
2% improvement on base
Return on invested capital2 (ROIC)
25% 3-year average ROIC (excluding AUC4) at 1 times WACC5
3-year average ROIC (excluding AUC4) at 1.3 times WACC5
3-year average ROIC (excluding AUC4) at 1.5 times WACC5
TSR3 – MSCI World Energy Index
25% 40th percentile of the index
60th percentile of the index
75th percentile of the index
TSR3 – MSCI World Chemicals Index
25% 40th percentile of the index
60th percentile of the index
75th percentile of the index
1 Vesting on a straight-line basis between threshold and target and between target and maximum.2 ROIC replaced compound growth in attributable earnings in 2017.3 TSR = Total shareholders’ return measured separately against the two indices; vests on a ranked relative basis between threshold and target and
between target and maximum.4 AUC = Assets under construction.5 WACC = Weighted average cost of capital.
No Share Appreciation Rights Awards have been made since 2013. More details on the plan and vesting percentages are included in the Annual Financial Statements.
Non-executive director feesNon-executive directors are appointed to the Sasol Limited Board based on their ability to contribute competence, insight and experience appropriate to assisting the Group to set and achieve its objectives. Consequently, fees are set at levels to attract and retain the calibre of director necessary to contribute to a highly effective Board. They do not receive short-term incentives, nor do they participate in long-term incentive plans. No arrangement exists for compensation in respect of loss of office.
Non-executive directors are paid a fixed annual fee in respect of their Board membership, as well as supplementary fees for committee membership and an additional committee fee for formally scheduled Board and committee meetings which do not form part of the annual calendar of meetings. Actual fees and the fee structure are reviewed annually. The comparator group used for benchmarking of fees is the same as for executive remuneration benchmarking. The Committee has undertaken to do a comprehensive review of non-executive director fees in 2018 with a view to narrow the difference between the resident and non-resident non-executive director fees.
The Board recommends the fees payable to the Chairman and non-executive directors for approval by the shareholders.
Non-binding advisory votes on the remuneration policy and implementation reportIn the event that less than 75% support for the abovementioned reports are achieved at the AGM, Sasol will invite dissenting shareholders to send reasons for such votes in writing whereafter further engagements may be scheduled.
Our
str
ateg
ic b
usin
ess
cont
ext
How
we
crea
te v
alue
Our
gov
erna
nce
Our
per
form
ance
revi
ewA
ddit
iona
l inf
orm
atio
nW
ho w
e ar
e

Sasol Integrated Report 2017 61
PRESCRIBED OFFICERS CK Mokoena5 M Radebe6 CF Rademan SJ Schoeman7
R’000 2017 2016 2017 2016 2017 2016 2017 2016
Total salary and benefits 6 378 – 5 394 5 005 6 319 5 991 10 118 4 869
Annual short-term incentive1 1 137 – 2 575 2 672 3 314 3 414 3 366 2 770
Long-term incentive gains2 – – 3 713 4 233 4 538 5 019 3 094 6 825
Total annual remuneration 7 515 – 11 682 11 910 14 171 14 424 16 578 14 464
1 Short-term incentives approved based on the Group results for the 2017 financial year and payable in the 2018 financial year. Incentives are calculated as a percentage of total guaranteed package/base salary as at 30 June 2017.
2 Long-term incentives for the 2017 financial year represent the number of units x corporate performance target achieved (2017) x closing share price on 17 August 2017. The actual vesting date for the annual awards made on 11 September 2014 is 11 September 2017. Dividend equivalents implemented for all awards with effect from September 2014. Dividend equivalents accrue at the end of the vesting period, to the extent that the LTI units will vest. It represents: number of units awarded x corporate performance targets achieved during financial year 2017 x dividend equivalents up to 11 September 2017.
3 Mr SR Cornell became an executive director on 1 July 2016.4 With effect from 1 April 2017, Mr FR Grobler is being paid in Euros in accordance with Sasol’s expatriate policy. The increase in salary and benefits
reflect the impact of the rand/Euro exchange rate. Benefits for Mr FR Grobler include (Upset allowance R549 020) (Expatriate allowances R1 395 023). Medical benefits include international cover for dependents.
5 Ms CK Mokoena was appointed as EVP Human Resources and Corporate Affairs effective 1 February 2017. A sign-on payment totalling R7 500 000 and payable over two years was concluded with Ms CK Mokoena as part of her employment contract compensating partially for incentives and benefits forfeited when she resigned from her previous employer. This amount reflects the first tranche, paid in February 2017. The remaining balance will be paid in 2018. Benefits include accommodation for six months.
6 Benefits include Inzalo dividends earned during the financial year.7 Mr SJ Schoeman became an expatriate effective 1 January 2017 and is paid in US dollars, the increase in salary and benefits reflect the impact of
the rand/US dollar exchange rate. Benefits for Mr SJ Schoeman include (Upset allowance R552 603) (Expat allowances R631 370) (Accommodation R1 663 660). Medical benefits include international cover for Mr SJ Schoeman.
Remuneration and benefits paid (disclosed in rands) and approved in respect of 2017 for Prescribed Officers were as follows:
PRESCRIBED OFFICERS SR Cornell3 FR Grobler4 VD Kahla BE Klingenberg
R’000 2017 2016 2017 2016 2017 2016 2017 2016
Total salary and benefits – 16 066 7 832 4 653 6 370 5 873 7 410 6 631
Annual short-term incentive1 – 3 243 3 515 2 542 3 292 3 002 3 929 3 632
Long-term incentive gains2 – 12 736 3 094 6 825 3 713 4 233 3 713 6 023
Total annual remuneration – 32 045 14 441 14 020 13 375 13 108 15 052 16 286
NON-EXECUTIVE DIRECTORS
Board meeting
fees R’000
Lead Independent Director fees
R’000
Committee fees
R’000
Shareincentive
Trust fees6
R’000
Ad hoc or special
meeting R’000
Total 2017
R’000
Total 2016
R’000
MSV Gantsho (Chairman) 4 900 – – – – 4 900 4 900
HG Dijkgraaf 1, 2 (Lead Independent Director) 1 983 688 869 17 10 3 567 3 955
JE Schrempp1, 3 (Lead Independent Director) – – – – – – 1 731
C Beggs 660 – 515 – 126 1 301 1 196
MJ Cuambe1, 4 1 983 – 433 – 21 2 437 186
GMB Kennealy5 165 – – – 165 –
NNA Matyumza 660 – 452 – 63 1 175 1 010
IN Mkhize 660 – 569 34 147 1 410 1 384
ZM Mkhize 660 – 117 – 42 819 819
MJN Njeke 660 – 316 – 63 1 039 888
ME Nkeli5 165 – – – – 165 –
PJ Robertson1 1 983 – 1 025 17 115 3 140 3 411
S Westwell1 1 983 – 863 – 115 2 961 3 165
Total 16 462 688 5 159 68 702 23 079 22 645
1 Board and committee fees paid in US dollars, except for Share Incentive Trust and Ad hoc or special meeting fees which are paid in rands.2 Mr HG Dijkgraaf appointed as Lead Independent Director on 4 December 2015.3 Prof JE Schrempp retired from the Board on 4 December 2015.4 Mr MJ Cuambe appointed on 1 June 2016.5 Mss GMB Kennealy and ME Nkeli appointed effective 1 March 2017.6 Share Incentive Trust dissolved on 17 November 2016.
All remuneration decisions for executive vice presidents are approved by the committee and by the Board for executive directors. No changes to formulaic calculations have been approved.
Sasol Integrated Report 201760
SUMMARISED REPORT OF THE REMUNERATION COMMITTEE (continued)
Achievements against the 2017 LTI targets:
The following table provides a summary of outstanding LTI awards and vesting percentages:
Financial year of allocation
Vesting year
(financial year)
Vesting range
WEIGHTING OF PERFORMANCE TARGETS
Vesting results
Growth in attributable
earnings
Return on invested
capital
Increase in tons
produced/head
TSR vs. MSCI
World Chemical
Index
TSR vs. JSE
RESI 10
TSR vs. MSCI
World Energy
Index
2014 20171 30% to 170%2
40% to 160%3
25% – 25% – 25% 25% 93,4%
94,3%
2015 2018 0% to 200%2
40% to 160%3
25% – 25% – 15% 35% 90,4%
94,3%
2016 2019 & 20214
0% to 200%2
40% to 160%3
25% – 25% 25% – 25% Unvested
2017 2020 & 20224
0% to 200%2
40% to 160%3
– 25% 25% 25% – 25% Unvested
1 Vested on the 30 June 2016 results and settled in 2017.2 EVPs, CFO and Joint CEOs.3 All other participants.4 Split vesting periods applicable to EVPs and SVPs after three and five years respectively.
Remuneration in 2017The following tables provide the outcome of rewards based on the application of the policy:
Remuneration and benefits paid (disclosed in rands) and approved in respect of 2017 for Executive Directors were as follows:
1 Short-term incentives approved based on the Group results for the 2017 financial year and payable in the 2018 financial year. Incentives are calculated as a percentage of total guaranteed package/base salary as at 30 June 2017.
2 Long-term incentives for the 2017 financial year represent the number of units x corporate performance target achieved (2017) x closing share price on 17 August 2017. The actual vesting date for the annual awards made on 11 September 2014 is 11 September 2017. Dividend equivalents implemented for all awards with effect from September 2014. Dividend equivalents accrue at the end of the vesting period, to the extent that the LTI units will vest. It represents: number of units awarded x corporate performance targets achieved during financial year 2017 x dividend equivalents up to 11 September 2017.
3 Mr SR Cornell was appointed as Joint President and Chief Executive Officer on 1 July 2016 and is paid in dollars, the increase in salary and benefits reflect the impact of the rand/US dollar exchange rate. Benefits include a portion of R2 031 061 of a $750 000 sign-on bonus paid and not previously disclosed due to the retention period. Included in other are benefits allowance (R387 038) accommodation (R1 288 998), home leave (R450 000), school fees (R160 236), settling in (R1 044 546), tax on benefits offered (R5 085 138) and relocation costs (R403 777).
4 Mr SR Cornell participates in an individual Senior Executive Retirement Plan (SERP) in order to adjust for differences between the benefits that would have been payable under his previous employer’s retirement fund and the benefits payable under the retirement programmes of Sasol (USA) Corporation. The value accrued to 30 June 2017 under the SERP is $92 236. The SERP benefit is payable to Mr SR Cornell following his death, disability or termination of employment for any reason other than cause.
5 Mr B Nqwababa was appointed as Joint President and Chief Executive Officer on 1 July 2016. A sign-on payment totalling R9 000 000 has been paid in 3 tranches over three years compensating partially for incentives and benefits forfeited when he resigned from his previous employer. Included in benefits is the amount relating to the final tranche and amounts not previously disclosed. This balance is disclosed to align with the King IV™ recommended practice.
6 Ms VN Fakude resigned as Executive Vice President Strategy and Sustainability with effect from 31 December 2016. Benefits include Inzalo dividends (R96 688) earned during the financial year and leave encashment (R192 781).
7 Mr P Victor was appointed as Chief Financial Officer with effect from 1 July 2016. Included in salary and benefits is the final tranche of a retention payment of R3 000 000 paid in two tranches.
8 Mr DE Constable resigned from the Group with effect 30 June 2016.
EXECUTIVE DIRECTORS SR Cornell3,4 B Nqwababa5 VN Fakude6 P Victor7 DE Constable8
R'000 2017 2016 2017 2016 2017 2016 2017 2016 2017 2016
Total salary and benefits 25 833 – 16 678 8 906 4 651 8 636 8 611 – – 29 600
Annual short-term incentive1 9 291 – 7 318 4 413 – 5 049 4 951 – – 12 437
Long-term incentive gains2 2 107 – 12 013 – 6 312 10 320 4 538 – – 14 352
Total annual remuneration 37 231 – 36 009 13 319 10 963 24 005 18 100 – – 56 389
Our
str
ateg
ic b
usin
ess
cont
ext
How
we
crea
te v
alue
Our
gov
erna
nce
Our
per
form
ance
revi
ewA
ddit
iona
l inf
orm
atio
nW
ho w
e ar
e

Capital expenditure
R60,3 billion
Maintained investment
grade credit rating
Core headline earnings up
6%refl ects sustainable
operations
Overview2017 marked the start of an exciting era for Sasol, as we focused on driving value-based growth to enable us to deliver superior returns to our shareholders.
Sasol Integrated Report 2017 63
Our
str
ateg
ic b
usin
ess
cont
ext
How
we
crea
te v
alue
Our
gov
erna
nce
Our
per
form
ance
revi
ewA
ddit
iona
l inf
orm
atio
nW
ho w
e ar
e
Our current operations, which form the foundation of our business, are robust, and we are focused on enhancing their performance by: • optimising margins by improving our customer
experience and reducing variable costs; • containing costs below inflation; and• improving the effectiveness and efficiency of our assets
by targeting higher volumes and greater reliability and availability of our plant operations.
In addition, we are continuing with the diversification of our asset base into value-accretive, higher-margin businesses that place us in the best possible position to deliver sustainable value to our shareholders and stakeholders.
The cash flows generated from our robust foundation businesses will enable us to realise our growth aspirations in Southern Africa and North America. Our Lake Charles Chemicals Project (LCCP) in the US is of strategic importance to Sasol and will diversify our earnings base both from a geographic and product-slate perspective. The first units of the LCCP are on track to reach beneficial operation in the second half of calendar year 2018. The funding of the LCCP has been secured by using cash generated from our own operations and various borrowing facilities. The Production Sharing Agreement (PSA) project in Mozambique is progressing according to plan, with six of the 13 wells already drilled. We plan to use the gas from this project both in Mozambique and for our South African operations as we explore opportunities to operate in a lower-carbon economy and extend our gas-fed value chain operations to beyond 2034.
We expect Sasol’s balance sheet to deleverage two years post the completion of the LCCP. Hence we are refining our capital allocation principles to guide how we allocate capital in a disciplined and transparent manner.
To ensure that we remain competitive and cost agile, we adopted a continuous improvement culture that aims to enhance our systems, capital allocation process and further achieve efficiency in our operations to reduce our cost base. This will be achieved by challenging ourselves to work smarter and more efficiently. The use of digital technologies and systems will be a key driver in achieving these efficiencies. We adopted a formal and focused digital initiative to align and guide the organisation forward. To ensure we can unlock maximum value, we engaged with partners who know the digital industry best. Digital technologies are transforming how we work and we aspire to deliver even more superior returns using these.
Steering through volatile external marketsVolatility in economic, political and social factors continued to add pressure to Sasol’s results. Oil prices traded at an average of US$50/bbl on the back of geopolitical factors and the rand/US dollar exchange rate strengthened as global macro-economic dynamics overshadowed increased domestic political and economic risks. Both of these factors had a significant impact on our earnings. To mitigate the impact of financial risks on our business, we entered into various hedging contracts to protect the Group against volatility in commodity prices, currencies and interest rates.
Against this backdrop, we showed great resilience and character: we delivered record production volumes at Secunda Synfuels of 7,83mt, and increased our production from our Eurasian Operations by 6%, due largely to management turnaround programmes to increase the efficiency of our operations. Earnings attributable to shareholders for the year ended 30 June increased by 54% to R20,4 billion from R13,2 billion in the prior year. Headline earnings per share (HEPS) decreased by 15% to R35,15 and earnings per share (EPS) increased by 54% to R33,36 compared to the prior year. The prior year EPS was negatively impacted by the R9,9 billion impairment of our Canadian shale gas assets. Core headline earnings, which reflects the sustainable operating performance of the Group, increased by 6% (R2,29 per share) compared to the prior year. We continued to deliver a strong cost performance and managed to contain our cash fixed costs to below inflation in nominal terms, despite the additional once-off costs incurred due to the Mining strike. Through our continued focus on cost control and the commitment of our people, we achieved our Business Performance Enhancement Programme (BPEP) sustainable savings exit run-rate target of R5,4 billion per annum in 2017, a year earlier than planned. We have now closed out our BPEP programme, having achieved the targeted sustainable savings. Going forward we are committed to further drive continuous improvement to identify opportunities to sustainably drive down costs and deliver improved returns to our shareholders and stakeholders.
Sustainably reducing our cost base through continuous improvementOur significant cash and cost change programmes, implemented since 2014, have placed Sasol in the strongest possible position to respond to the volatile macro-economic environment and staying profitable in a low oil price environment. We are among very few oil and chemical companies globally who are able to generate positive free cash flows from our core operations at oil prices of $40/bbl. We are focused and committed to ensuring that we protect our competitive advantage by being innovative and continuously delivering on our effectiveness and efficiency initiatives, while mitigating our financial risks to create headroom on the balance sheet.
Operating profi t up
31%
Sasol Integrated Report 201762
Paul Victor, Chief Financial Offi cer
KEY MESSAGES:
Steering through volatile external markets
Sustainably reducing our cost basethrough continuous improvement
Allocating capital to enable value-based growth
Protecting and strengthening the balance sheet
Making digital a part of our DNA
CHIEF FINANCIAL OFFICER’S REVIEW

Sasol Integrated Report 2017 65
Key risks impacting our financial performanceIn order to assess the impact of the operating environment on our business, it is important to understand those factors that affect the delivery of our results.
Sasol’s integrated risk management process has enabled us to remain resilient in the volatile macro-economic environment. We closely monitor the progress of our strategic objectives by considering and planning for various likely financial scenarios in determining whether the risk is within the limits of our risk tolerance and risk appetite as well as testing the robustness of our mitigation actions.
KEY PERFORMANCE INDICATORS
Quality-based earnings growth
Target: 8% US dollar EBIT growth
Net debt-to-EBITDA Target: Net debt-to-EBITDA ratio
of <2,0 times
Gearing Target: Achieve a gearing level of 20% to 40% (Temporarily lifted
to 44% until the end of 2018)
Return on invested capital Target: Capital portfolio to
deliver return on capital invested of 18,3% in rand terms
Financial landscape
RETURN ON INVESTED CAPITAL
GEARING
NET DEBT TO
EBITDA
EARNINGS GROWTH
GROW SHAREHOLDER VALUE SUSTAINABLY
KEY FINANCIAL RISKS AFFECTING
OUR PERFORMANCE
• Current economic climate
• Credit market risk and its impact on our debt profile
• Volatile markets and exchanges rates
• Crude oil, gas and chemical prices
• Executing on capital projects
• Improving our cost base given inflationary pressures
• Tax risk
RISK IMPACT ON SASOL HOW TO WIN
• The volatile macro-economic environment impacts our ability to deliver sustainable value to stakeholders.
• Focus on factors that remain within our control: cost, volumes and safe and reliable operations.
• Global financial markets remain volatile, with the economies of Europe and the US in the spotlight, as well as developments in the oil market. For most of the 2017 calendar year, the markets have been anticipating an interest rate increase in the US, but the timing, pace and size thereof remains uncertain.
• Despite the volatility, markets have remained open, with liquidity available to quality borrowers. Market volatility can have a more pronounced impact on the availability of liquidity to sub-investment grade borrowers than to investment grade borrowers.
• We monitor our funding requirements continuously as part of our enterprise risk management activities to ensure that we maintain appropriate levels of liquidity to minimise any adverse impact on our investment rating.
CREDIT MARKET RISK
AND ITS IMPACT ON OUR DEBT
PROFILE
CURRENT ECONOMIC
CLIMATE
Sasol Integrated Report 201764
Market overviewGlobal growth remained weak, with International Monetary Fund (IMF) estimates showing that world GDP growth slowed to 3,1% in the 2016 calendar year from 3,4% in the 2015 calendar year. Economic growth in the Eurozone and US was moderate, but broadly better than expected. While China’s economic growth stabilised, large emerging market economies such as Brazil and Russia experienced recessionary conditions. South Africa’s economy grew by only 0,3% in the 2016 calendar year, the slowest growth rate since 2009, mainly due to severe drought conditions, weak business and consumer confidence and policy uncertainty. Commodity and financial market volatility persisted throughout the financial year.
CHIEF FINANCIAL OFFICER’S REVIEW (continued)
Crude oilThe crude oil price averaged US$49,77 per barrel (/bbl) for the 2017 financial year, touching a high of US$56,30/bbl, a low of US$40,26/bbl, and closing at US$47,39/bbl on 30 June 2017. This compares to an average of US$43,37/bbl for 2016.
Crude oil
(US$
/bbl
)
07 08 09 10 11 12 13 14 15 16 17
BrentYearly average BFP Product BFP
0
30
60
90
120
150
180
Gas pricesGas prices in North America remained depressed. In 2017, gas prices averaged US$3,00/million British thermal units (MMBtu) relative to the very low average of US$2,25/MMBtu in 2016. At 30 June 2017, the spot Henry Hub gas price was US$2,98/MMBtu from US$2,94/MMBtu at 30 June 2016.
Henry Hub gas prices
(US$
MM
Btu)
07 08 09 10 11 12 13 14 15 16 170
2
4
6
8
10
Chemical pricesThe continued softness in oil prices and feedstock costs for most of the chemical value chain led to corresponding softness in chemical sales prices. However, strong demand for chemicals supported margins. In South Africa, chemicals prices showed continued resilience when compared to the decline in average crude oil prices. Global and local demand/supply dynamics, as well as the competitive forces at play in markets within
which we sell our Base Chemicals products, had a positive impact on the overall sales price levels achieved.
07 08 09 10 11 12 13 14 15 16 17
PolymersSolvents Brent
Chemical prices(expressed as a percentage of July 1997)
(60)(50)(40)(30)(20)(10)
01020304050607080
Exchange ratesDuring 2017, the rand/US dollar exchange rate averaged R13,61/US$. The exchange rate was influenced by domestic political developments, sovereign credit rating downgrades, an uptick in export commodity prices, improved emerging market risk perceptions and domestic and US interest rate expectations.
From a long-term perspective, the rand/US dollar exchange rate is still considered to be slightly undervalued. Despite this, the rand still faces a number of global and domestic risks that could lead to on-going currency volatility. These risks include an uncertain political environment, sovereign credit rating developments, the strength and sustainability of the recent global upturn, key commodity price trends, the domestic and US interest rate cycles and emerging market risk perceptions.
Yearly average (fuel sales)
Rate applicable to fuel sales
Rand/US dollar exchange rate
(US$
1=R)
1110090807 12 13 14 15 16 170
3
6
9
12
15
18
Average monthly exchange rate
BRENT DATED AVERAGE CRUDE
OIL PRICES
$50
2017
$43
2016
$73
2015
Our
str
ateg
ic b
usin
ess
cont
ext
How
we
crea
te v
alue
Our
gov
erna
nce
Our
per
form
ance
revi
ewA
ddit
iona
l inf
orm
atio
nW
ho w
e ar
e

Sasol Integrated Report 2017 67
RISK IMPACT ON SASOL HOW TO WIN
• The risk of inflationary increases in the countries in which we operate could place further pressure on our cost base. Generally, the rate of inflation in most major countries has been relatively low. In South Africa, the PPI index declined from its highs of 11,5% in 2008 to 6,0% in 2017.
• Our cost-containment, capital conservation and cash-savings initiatives, implemented since 2014, have managed to reduce our cost base by approximately R7 billion.
• We focus on minimising our tax risk in order to deliver sustainable value to our shareholders.
• Sasol received revised tax assessments from the South African Revenue Service (SARS) in respect of our crude oil procurement process. These assessments could result in an additional tax liability (including interest and penalties) of approximately R1,2 billion for the periods 2005 to 2014 and R11,6 billion for the periods 2013 to 2014 based on varying tax principles. Sasol co-operated fully with SARS during the course of the audit but, supported by our specialist tax and external legal advisors, disagrees with the SARS audit findings. Accordingly, we submitted objections to the revised assessments and requested suspension of payment. Sasol Oil and SARS have come to a resolution with regards to the request for suspension of payment, resulting in SARS suspending payment for the vast majority of the disputed tax.
• The Group tax approach outlines the framework by which our tax obligations are met from an operational and risk management perspective.
• We are committed to fostering transparent and constructive relationships to ensure accurate, transparent and timely compliance with tax laws.
• The tax litigation process for the 2005 to 2007 years of assessment was concluded and judgement was delivered on 30 June 2017 in favour of SARS. Sasol, in consultation with our tax and legal advisors, does not support the basis of the judgement and has issued a Notice of Intention to appeal. The appeal was granted on 14 August 2017. A provision amounting to R1,2 billion has been recognised in the annual financial statements in respect of the litigation claim. The R11,6 billion tax exposure has been disclosed as a contingent liability at 30 June 2017.
OUR COST BASE
TAX RISK
Financial performanceOverall in 2017, Sasol has delivered a strong business performance across most of the value chain, with our Secunda Synfuels Operations (SSO) reporting record volumes and our Eurasian Operations delivering their highest production volumes since 2015. Continued volatility in the macro-economic environment, particularly the stronger rand and low oil price, adversely impacted our financial performance.
Earnings attributable to shareholders for the year ended 30 June increased by 54% to R20,4 billion from R13,2 billion in the prior year.
Headline earnings per share (HEPS) decreased by 15% to R35,15 and earnings per share (EPS) increased by 54% to R33,36 compared to the prior year. The prior year EPS was negatively impacted by the R9,9 billion impairment of our Canadian shale gas assets.
Core HEPS, adjusted for remeasurement and once-off items and the impact of the currency re-evaluation amounted to R39,06 per share which is 6% (R2,29 per share) higher compared to the prior year.
Profit attributable to shareholders (R billion)
13 14 15 16 170
10
20
30
40
50
60
Profit attributable to shareholders Earnings per share
Headline earnings per share (Rand per share)
13 14 15 16 170
10
20
30
40
50
60
70
Headline earnings per share
Core headline earnings per share (Rand per share)
15 16 170
10
20
30
40
50
60
Core headline earnings per share
Sasol Integrated Report 201766
CHIEF FINANCIAL OFFICER’S REVIEW (continued)
RISK IMPACT ON SASOL HOW TO WIN
• A large portion of our turnover and capital investments are significantly impacted by the rand/US dollar exchange rate. This is also a significant variable in the basic fuel price (BFP). Our chemical products are mostly commodity products whose prices are based largely on global prices quoted in US dollars.
• In 2018, a 10c change in the annual average rand/US dollar exchange rate will impact our operating profit by approximately R710 million (US$52 million) excluding impacts of derivative financial instruments.
• To protect our South African operations from the effects of exchange rate volatility, we hedge both our capital investments and foreign currency-denominated imports by way of forward exchange contracts.
• In 2017, we entered into zero-cost collars for approximately 70% of our exposure which equates to US$4 billion. This hedging strategy enables us to better predict cash flows and thus manage our working capital and debt more effectively.
• Our Energy business is exposed to the volatility associated with the selling price of fuel. The BFP forms part of the final selling price which is regulated by the South African government. The key factors influencing the BFP include the crude oil price, rand/US dollar exchange rate and refining margins.
• In 2018, for every US$1/bbl change in the annual average crude oil price, operating profit will be impacted by approximately R850 million (US$62 million) excluding impacts of derivative financial instruments..
• To protect the Group against the adverse effects of short-term oil price volatility and rand/US dollar exchange rate fluctuations on the purchase cost of crude oil, we use a combination of forward exchange contracts and crude oil futures. In 2017, we entered into hedges for approximately 75% of the Group's liquid fuels sales.
• Natural gas is a key feedstock in our gas-to-liquid projects. A higher gas price would reduce our profitability and earnings generation.
• In Canada, our revenue is derived from the natural gas price. Lower gas prices would result in reduced cash flows and profitability.
• We will only enter into a GTL project when there is a favourable price differentiation between gas and oil prices. Accordingly, we have delayed the execution of our US GTL project. In Canada, we agreed with our partner to reduce further drilling activities and capital expenditure until such time that we see a sustainable recovery in North American gas prices.
• Our chemical products follow a typical demand cycle. Higher demand results in higher margins until new production capacity is introduced, at which point margins decrease. Over the longer term, most commodity chemical prices tend to track crude oil-based feedstock prices.
• The approach for our commodity chemicals business is to have a diverse portfolio of assets and, wherever possible, to invest in the value chain from raw materials to final products. This is aimed at ensuring resilience under a number of different oil price scenarios and industry cycles.
• In our current business, one of the most significant challenges is capital excellence – delivery of projects within cost and schedule. Failure to achieve this destroys our return on invested capital and could result in impairments.
• We believe our share price is undervalued because of our record on project execution and hence does not represent the true value of our business.
• Our capital allocation principles will be used to guide how we systematically invest capital.
• We have taken actions to document the lessons learnt from past projects and will apply them in future projects. The Investment Committee reviews the robustness of assumptions and tracks milestones.
CRUDE OIL PRICES
VOLATILE MARKETS AND
EXCHANGE RATES
GAS PRICES
CHEMICAL PRICES
EXECUTING ON CAPITAL
PROJECTS
Further information on the tax litigation matter is provided in note 11 of the Annual Financial Statements.
Our
str
ateg
ic b
usin
ess
cont
ext
How
we
crea
te v
alue
Our
gov
erna
nce
Our
per
form
ance
revi
ewA
ddit
iona
l inf
orm
atio
nW
ho w
e ar
e

Sasol Integrated Report 2017 69Sasol Integrated Report 2017 69
Free cash flow
(20 000)
(10 000)
0
10 000
20 000
30 000
40 000
50 000
60 000
Cash flow from
operations
Working capital
changes
Finance income received
Free cash flow
Cash generated in
other investing activities
Additions tonon-current
assets
Tax paid
(2 167) 3 003(6 352)
(56 812)135
46 236
(15 957)
(R m
illio
n)
Cash generated by operating activities
Cash generated by operating activities decreased by 19% to R44,1 billion compared with R54,7 billion in the prior year. Our net cash position decreased significantly by 44%, from R52,2 billion in June 2016 to R29,3 billion as at 30 June 2017, mainly due to the funding of the LCCP and the effect of a stronger closing rand/US dollar exchange rate.Cash generated by operating activities(R billion)
1413 15 16 170
10
20
30
40
50
60
70
Capital investmentsOver the past three years, we have made capital investments of R179 billion, of which R60,3 billion was invested in 2017. We focused our investment mainly in projects in South Africa, Mozambique and the United States, with some investments in Canada, Germany and Qatar. This relates primarily to the LCCP in the US and the Mozambican PSA project.Additions to non-current assets (including capital accruals)(R billion)
1413 15 16 17
Growth
Sustenance0
10
20
30
40
50
60
70
80
Capital investments by geographic region (R billion)
Rest of AfricaNorth AmericaEuropeSouth Africa
2016 20172015
0
5
10
15
20
25
30
35
40
45
50
Our capital investment in South Africa was R17 billion in 2017, which is approximately 28% of the total capital investment for the year. Further details of additions to our non-current assets is provided in notes 16 and 17 to our Annual Financial Statements.
Cash utilisation
In 2017, the cash outflow of our capital investment programme exceeded the cash retained from operating activities by R28 billion.Cash utilisation(R billion)
13 14 15 16 170
10
20
30
40
50
60
70
80
Cash retained from operating activities
Additions to non-current assets
Sasol Integrated Report 201768
CHIEF FINANCIAL OFFICER’S REVIEW (continued)
The Sasol Limited Board (“the Board”) considers core headline earnings as an appropriate indicator of the sustainable operating performance of the Group, as it adjusts for period close and once-off items as noted below.
2017 2016
Headline earnings R35,15 R41,40Translation losses/(gains) (including foreign exchange contracts) arising from a stronger closing rand/US dollar market exchange rate at 30 June 2017 R2,70 (R0,86)Mark-to-market valuation of oil and foreign exchange derivatives using forward curves and other market factors at 30 June 2017 (R1,73) –Provision/(reversal of provision) for tax litigation R1,49 (R3,77)Impact of prolonged labour actions at Mining in the first half of the year R1,45 –
Core headline earnings R39,06 R36,77
Included in remeasurement items is a partial impairment of our US Gas-to-Liquids (GTL) project amounting to R1,7 billion (US$130 million) due to the uncertainty around the probability and timing of project execution and the reversal of a partial impairment of the Lake Charles Chemicals Project (LCCP) amounting to R0,8 billion (US$65 million), which resulted from lower spot discount rates and the extension of the useful life of the project to 50 years.
The highlights of our operational performance can be summarised as follows:• SSO increased production volumes by 1% to a record
7,83 million tons; • Natref production volumes decreased by 5%. Plant
shutdowns during the first half of the year contributed to a 3% decrease in production volumes and unplanned downtime during May 2017 led to a 2% reduction in production volumes;
• Our Eurasian Operations increased production volumes by 6% due to stronger product demand;
• ORYX GTL achieved a utilisation rate of 95%, compared to 81% in the previous year, which is higher than market guidance;
• Our Performance Chemicals business reported a 2% increase in sales volumes, which is at the upper end of our market guidance, mainly as a result of stronger demand and improved plant stability;
• Our Base Chemicals sales volumes increased by 3%, slightly below market guidance, due to extended shutdowns at our chlor vinyls and polypropylene plants and a fire at a third party warehouse; and
• Liquid fuels sales volumes in our Energy business decreased by 2% due to a greater portion of production volumes from SSO being allocated to our higher-margin yielding chemical businesses and lower Natref production volumes. Excluding the effect of the Natref downtime and lower allocated volumes from SSO, our liquid fuels sales volumes increased by 1%.
The decrease in the effective corporate tax rate from 36,6% to 28,3% was mainly as a result of the R9,9 billion partial impairment of our Canadian shale gas assets in the prior year. The adjusted effective tax rate, excluding equity accounted investments, remeasurements and once-off items, was 26,5% compared to 28,2% in the prior year.
Profit from operations - price volume variance analysis
0
5 000
10 000
15 000
20 000
25 000
30 000
35 000
2016 Exchangerate
Crude oil and product prices
2017Sales volumesOnce-off items and year-end adjustments
(38%) 30%
38%1%
24 23931 705(R
mill
ion)
Our cash flow generation and utilisation Free cash flow generation is one of the most important drivers of sustaining and increasing shareholder value. We define free cash flow as consisting of both operating components (operating profit, change in operating working capital and capital investment) as well as non-operating components, including financial income and taxes.
We had negative free cash flow of R16 billion in the year (2016 – R23,2 billion) mainly due to the significant capital expenditure in the year of R60,3 billion. We apply cash generated from operating activities to repay our debt and tax commitments and then provide a return to our shareholders in the form of dividends.
Our
str
ateg
ic b
usin
ess
cont
ext
How
we
crea
te v
alue
Our
gov
erna
nce
Our
per
form
ance
revi
ewA
ddit
iona
l inf
orm
atio
nW
ho w
e ar
e

Sasol Integrated Report 2017 71
arising from potential increases in capital costs associated with these projects.
In April 2017, S&P downgraded South Africa’s sovereign credit rating from BBB- investment grade to BB+ with a negative outlook. Based on Sasol’s exposure to the political and economic risks of South Africa, the company’s long- and short-term foreign currency corporate rating was downgraded from BBB/A-2 to BBB-/A-3 with a stable outlook.
Similarly, Moody’s Investors Service downgraded Sasol’s long-term issuer rating to Baa3 (negative outlook) from Baa2 (negative outlook), and raised the national scale issuer rating to Aaa.za from Aa1.za in June 2017.
Delivering on our growth projectsOur rigorous focus on capital discipline and the implementation of our capital allocation framework in 2017 assisted us to optimise our capital expenditure and ensure that the project pipeline is focused and value accretive for our shareholders. The Capital Investment Committee played a significant role in reviewing the project pipeline and opportunities for growth and expansion against stringent criteria.
Our near-to-medium-term strategy focuses on two regions: Southern Africa and North America. Therefore, our focus remains on the execution of our world-scale ethane cracker and derivatives complex – the LCCP – in the United States (US) as well as further developing our footprint in Mozambique.
Overall construction on the LCCP continues on all fronts, with most engineering and procurement activities nearing completion. At 30 June 2017, capital expenditure amounted to US$7,5 billion, and the overall project completion was 74%. The total forecast capital cost for the project remains within the approved US$11 billion budget and project progress is tracking the approved schedule. This budget includes a contingency which, measured against industry norms for this stage of project completion, is considered sufficient to effectively complete the project to beneficial operation (BO) within the approved budget. Various savings opportunities have been identified and are continuously being implemented to mitigate project risks. Although unplanned event-driven risks may still impact the execution and cost of the project, we are confident that the remaining construction, procurement, execution and business readiness risks can be managed within the budget. We continue to monitor the economics of the project against the backdrop of a challenging macro-economic environment. We rely extensively on the views of independent market consultants in formulating our views on our long-term assumptions. Their views differ significantly, from period to period, which again is indicative of the volatility in the market. For these reasons, the internal rate of return (IRR) for the LCCP, based on these different sets of price assumptions, varies between a range of returns which is both higher and lower than our weighted average cost of capital (WACC). At spot market prices, using the last quarter of 2017 as a reference, the IRR is between 8% to 8,5%. We are of the view that limited structural changes have occurred to market fundamentals since February 2017, when we last published the expected long-term IRR of the project, hence, based on our assessment, we are of the view that the IRR is in a range of 7% to 8% (Sasol WACC at 8% in US$ terms) based on conservative ethane prices. The cracker, however, remains cost competitive and is at the lower end of the cost curve for ethylene producers. We will continue to focus on factors that we can control, which are progressing the cost and schedule of the project according to plan. The updated economics, earnings profile, capital spend and sensitivities are detailed in the Analyst Book available on our website, www.sasol.com.
Construction of our 50% joint venture high-density polyethylene plant with Ineos Olefins and Polymers USA is essentially complete and is on track for start-up during the second half of the 2017 calendar year. Our strategic R14,0 billion mine replacement programme, which will ensure uninterrupted coal supply to SSO in order to support Sasol’s strategy to operate its Southern African facilities until 2050, is nearing completion. The development of the Production Sharing Agreement (PSA) licence area remains on budget and schedule. We have successfully drilled and tested four oil wells and two gas wells, and captured 3D seismic over parts of the PSA area.
Managing cash fixed costs We continued to drive our cost-containment programme and managed cash fixed costs well below inflation in nominal terms, when compared to the prior year. The strong cost performance was achieved by an accelerated sustainable delivery of our BPEP and RP.
Our BPEP achieved sustainable cost savings of R5,4 billion in 2017, a year earlier than expected. This was enabled through focused management actions and the accelerated delivery on certain key levers. We will close out the BPEP and track the sustainable savings on key elements, such as headcount, to ensure that we do not diminish the savings achieved. We will also apply the same amount of diligence to our low oil price RP. Accordingly, we have increased our sustainable cash cost savings target from R2,5 billion to at least R3,0 billion by 2019.
Going forward, our objective to keep our costs in line with inflation may be negatively impacted by:• expenditure to ensure continued plant stability and
reliability;• labour and electricity costs which escalate above inflation;• costs incurred on growth initiatives and new projects; and• currency effects.
To mitigate these risks, we are focusing on continuous improvement to address the structural shift of the energy prices by sustainably improving our margin contribution and cost base delivery.
Embracing digital technology to drive effectiveness and efficiencyTo improve effectiveness and efficiency in how we do business, we are focused on using technology to redefine our customer experiences, improve operational efficiency, and embed digital advantages throughout Sasol’s business. To embrace digital in the company, we are evaluating our resources and capabilities to ensure that we can deliver on the digital roadmap for Sasol. We have started to implement digital solutions in some areas of our business. These include our supply chain function and our Digital Catalyst pilot which is aimed at transforming how our chemicals customers do business with us across the full value chain.Our objective is to embed digital across our value chain to improve the effectiveness and efficiency of our operations, while ensuring we remain within our risk and governance structures.
CHIEF FINANCIAL OFFICER’S REVIEW (continued)
Sasol Integrated Report 201770
Managing our funding plan, debt profile and credit rating
FundingWe have prioritised our growth aspirations as we steadily advance our growth strategy, particularly in Southern Africa and North America. Capital investments in these regions will constitute a significant portion of our total capital expenditure over the next 10 years. Following the completion of the LCCP, we expect our gearing to reduce and we have sufficient headroom in our balance sheet to fund these opportunities, and provide a buffer against volatilities.
Solvency and liquidityCurrently the Group is maintaining a positive cash position, conserving the Group’s cash resources through a renewed focus on working capital improvement and capital reprioritisation. The Group meets its financing requirements through a mixture of cash generated from its operations and short- and long-term borrowings. We maintain adequate banking facilities and reserve borrowing capacities. Sasol is in compliance with all of the financial covenants of its loan agreements, none of which is expected to present a material restriction on funding or its investment policy in the near future.
We believe that cash on hand and funds from operations, together with our existing borrowing facilities, will be sufficient to cover our working capital and debt service requirements in the year ahead.
Debt profileOur long-term capital expansion projects are financed by a combination of floating and fixed-rate long-term debt, as well as internally generated funds. We endeavour to match debt to the currency of the underlying revenue generation.
Net debt increased by R26 344 million in 2017, from R30 166 million at the end of 2016. This was mainly due to the funding of the LCCP. Our debt was made up as follows:
2017 2016 2015Rm Rm Rm
Long-term debt 81 405 79 877 42 066Short-term debt 2 625 138 534Bank overdraft 123 136 319
Total debt 84 153 80 151 42 919Less cash (excluding cash restricted for use) 27 643 49 985 48 329
Net debt/(cash) 56 510 30 166 (5 410)
Increase in funding (proceeds minus repayments of debt) 9 536 30 420 13 286
The average tenure of our debt portfolio is eight years. Our debt comprises different instruments, which bear interest at a floating or a fixed rate. To mitigate our interest rate risk, we use interest rate swaps, where appropriate, to convert some of our debt into either floating or fixed-rate debt to manage the composition of our portfolio. In July 2015, we entered into an interest rate swap to convert 50% of the US$4 billion term loan facility incurred by Sasol Chemicals (USA) LLC (to part fund the capital expenditure of the LCCP) from a variable to a fixed rate.
Our debt profile at 30 June analysed by currency was:
2017 2016Rm % Rm %
Rand 20 922 25 20 138 25US dollar 59 391 70 58 686 73Euro 3 063 4 473 1Other 777 1 854 1
Total debt 84 153 100 80 151 100
As we execute our growth initiatives in the US, we expect that our debt exposure will be biased towards the US dollar, matching the currency in which marginal revenues will be earned.
Net debt: EBITDA (times)
(0,5)
0,0
0,5
1,0
1,5
2,0
(0,09)
1,13
171615
Threshold*Net debt: EBITDA
0,56
2,5
Total debt to EBITDA
13 14 15 16 170
10 000
20 000
30 000
40 000
50 000
60 000
70 000
80 000
90 000
-0,4
0,1
0,6
1,1
1,6
2,1
Total debt (R million) Total debt to EBITDA (times)
(R million)
Looking forward, we expect a significant cash contribution from the LCCP and our balance sheet to de-leverage by at least 2021. However, to fund our future growth ambitions, we aim to have a gearing ratio of at least 30%. This will mean having to source the appropriate funding mix at the most attractive rates in the market. We have implemented a dynamic funding plan which is based on our latest assumptions and capital requirements. We review the plan on an on-going basis and report on it to the Audit Committee to ensure that we have sufficient liquidity and headroom on the balance sheet in the foreseeable future.
Credit ratingsOur credit rating is influenced by some of our more significant risks. These include crude oil price volatility, movements in the sovereign credit rating of South Africa, our investments in developing countries and their particular associated economic risks, the potential for significant debt increase and the execution challenges associated with a number of our planned growth projects if they materialise simultaneously, as well as the risks
Our
str
ateg
ic b
usin
ess
cont
ext
How
we
crea
te v
alue
Our
gov
erna
nce
Our
per
form
ance
revi
ewA
ddit
iona
l inf
orm
atio
nW
ho w
e ar
e

Sasol Integrated Report 2017 73
2017 2016 Rm Rm
Assets
Property, plant and equipment 158 773 155 054
Assets under construction 130 734 104 011
Goodwill and other intangible assets 2 361 2 680
Equity accounted investments 11 813 13 118
Post-retirement benefit assets 622 614
Deferred tax assets 3 082 3 389
Other long-term assets 3 600 3 715
Non-current assets 310 985 282 581
Assets in disposal groups held for sale 216 1 064
Inventories 25 374 23 798
Tax receivable 2 538 2 487
Trade and other receivables 27 641 28 426
Short-term financial assets 2 739 42
Cash and cash equivalents 29 446 52 316
Current assets 87 954 108 133
Total assets 398 939 390 714
Equity and liabilities
Shareholders’ equity 211 711 206 997
Non-controlling interests 5 523 5 421
Total equity 217 234 212 418
Long-term debt 74 312 78 015
Long-term provisions 16 648 18 810
Post-retirement benefit obligations 11 069 12 703
Long-term deferred income 910 631
Long-term financial liabilities 733 2 844
Deferred tax liabilities 25 860 23 691
Non-current liabilities 129 532 136 694
Short-term debt 9 718 2 000
Other current liabilities 41 592 38 611
Short-term financial liabilities 740 855
Bank overdraft 123 136
Current liabilities 52 173 41 602
Total equity and liabilities 398 939 390 714
ADDITIONS TO ASSETSCapital expenditure including accruals amounted to R60,3 billion. This includes R36,8 billion (US$2,7 billion) relating to the LCCP. Our actual capital expenditure for the full year is below previous market guidance of R66 billion, largely due to the stronger exchange rate, re-phasing of the LCCP capital cash flow and active management of the capital portfolio.
IMPAIRMENT OF ASSETS
Included in remeasurement items is a partial impairment of our US Gas-to-Liquids (GTL) project amounting to R1,7 billion (US$130 million) and the reversal of a partial impairment of the Lake Charles Chemicals Project (LCCP) amounting to R0,8 billion (US$65 million), which resulted from lower spot discount rates and the extension of the useful life of the project to 50 years.
WORKING CAPITALOur working capital ratio for 2017 was 17,2% compared with 16,6% in the prior year. Our target working capital ratio of 16% remains in place for 2018. The Response Plan, which we entered into in 2015, aim to better position the Group in tough credit markets. We have increased our RP sustainable annual cash cost savings target from R2,5 billion to at least R3,0 billion by 2019.
EQUITY Shareholders’ equity benefited from increased profits by R5 billion after dividends paid.
DEBTThe movement in long-term debt comprises mainly of proceeds of new debt raised of R13,3 billion, offset by payments of debt totalling R3,8 billion for the year. The new debt relates mainly to the funding of the LCCP.
Financial Statement Analysis at 30 June
Commentary
Total assets
R398 939million
Current assets
R87 954million
Non-current assets
R310 985million
CHIEF FINANCIAL OFFICER’S REVIEW (continued)
Sasol Integrated Report 201772
Analysing our shareholding and returns to shareholdersShareholdingSasol’s shareholder base consists primarily of large institutional shareholders, as well as a significant number of value investors. The top 20 shareholders collectively own more than 60% of Sasol’s outstanding shares. Approximately two-thirds of our shareholder base is in South Africa.
Total shareholder returnWe return value to our shareholders by way of both dividends and share price appreciation.
Total shareholder return (TSR) is a measure of the performance of the Group's shares over time, and combines both share price appreciation and dividends paid to indicate the total return to a shareholder over the period. Sasol’s TSR for the five-year period ending 30 June 2017 was 38% in rand terms and a negative 37% in US dollar terms, which is in the mid-range of our peers.
The performance of the share price over this period was influenced by a combination of factors which we could control (directly related to improved operational efficiency and various cost-containment initiatives) as well as factors beyond our control, such as market sentiment and the partial recovery of the global economy following the 2008 economic crisis and continuous macro-economic uncertainties. The volatility of the crude oil price, coupled with the rand/US dollar exchange rate, further contributed to the lower share price performance.
To address this, the Group has put a number of measures in place to:• improve project execution by implementing lessons learnt
from previous projects;• actively manage the balance sheet to address external
volatility;• focus on continuous improvement to address the
structural shift in the energy price by improving the efficiency of our operations; and
• work with the government and other stakeholders to manage the impact of regulations on Sasol’s South African business.
DividendsOur dividend policy is to pay dividends within a dividend cover range based on HEPS. Taking into account the current volatile macro-economic environment, capital investment plans, our cash-conservation initiative, the current strength of our balance sheet, and the dividend cover range, the Board has declared a gross dividend of R12,60 per share (15% lower compared to the prior period). The dividend declared is in accordance with our dividend cover policy of 2,2x to 2,8x of annual HEPS.
The dividend demonstrates our commitment to return value to shareholders through dividend payments.
Outlook for 20182018 is likely to be a watershed year for Sasol as we prepare for the first units of the LCCP to come on line. Our core focus will be on project execution, to ensure that the cost and schedule milestones are adhered to and that the business processes and systems are ready for this mega project. Once the LCCP is fully operational it will reshape Sasol to be more of a chemicals company, drive our strategy and accelerate growth for our shareholders.
We expect economic conditions to be very similar to 2017, with average oil and commodity prices remaining low, the rand exchange rate remaining volatile and global chemicals demand increasing. While the rand has strengthened in recent months, the currency still faces a number of near-term risks as the potential for a further sovereign credit downgrade has not been eliminated and domestic growth prospects remain challenging. Global political uncertainties will remain high, providing a downside risk to the global economic outlook.
The Group’s strategic positioning, the execution of our hedging strategy and our strong balance sheet will enable us to withstand these uncertainties for the sustained benefit of our shareholders. Through our committed employees, we will continue with our strict discipline in managing factors within our control, including volume growth, cash and cost control, project execution and effective capital allocation.
We expect an overall strong operational performance for 2018, with: • Base Chemicals US dollar product prices to recover during
the year and our South African Base Chemicals sales volumes to be between 3% to 5% higher than the prior year; in addition our US high-density polyethylene plant will contribute an additional 80kt to 110kt during the second half of the year. Normalised operating profit is estimated to be between R3 billion to R5 billion;
• Performance Chemicals sales volumes, excluding merchant ethylene which will now be accounted for in Base Chemicals, to be between 2% to 3% higher, with average margins for the business remaining resilient;
• Liquid fuels sales volumes to be marginally below 60 million barrels due to planned shutdowns at Natref;
• Gas production volumes from the Petroleum Production Agreement to be between 114 bscf to 118 bscf;
• Average utilisation rate at ORYX GTL in Qatar to exceed 90%; • Normalised cash fixed costs to remain in line with SA PPI; • Cumulative capital conservation and cash flow contribution
from our RP to be close to the upper end of our targeted range of R65 billion to R75 billion by the end of 2018;
• Capital expenditure, including capital accruals, of R59 billion for 2018 and R37 billion for 2019 as we progress with the execution of our growth plan and strategy. Capital estimates may change as a result of exchange rate volatility;
• Our balance sheet gearing up to a level of between 35% and 44%;
• Rand/US dollar exchange rate to range between R13,00 and R14,50; and
• Average Brent crude oil prices to remain between US$45/bbl and US$55/bbl.
Sasol is well positioned to achieve its targets and visions and I would like to thank our employees and stakeholders for their important contributions throughout the year. Through the delivery of our cost-containment programmes, technology improvements, innovation and stability in operations, we will continue to focus on improving our profitability and delivering superior returns to shareholders. We will continue with disciplined capital allocation and prioritising dividends for our shareholders. Our balance sheet remains strong and is again testament to our commitment to deliver value. We will continue to diligently manage each of our value drivers, to create value for our shareholders on a sustainable basis.
P VictorChief Financial Officer
Our
str
ateg
ic b
usin
ess
cont
ext
How
we
crea
te v
alue
Our
gov
erna
nce
Our
per
form
ance
revi
ewA
ddit
iona
l inf
orm
atio
nW
ho w
e ar
e

Cash generated by operating activities
R44 069million
Earnings per share
R33,36
Profi t before tax
R30 008million
Operating profi t
R31 705million
Sasol Integrated Report 2017 75
2017 2016 2015 Rm Rm Rm
Cash receipts from customers 172 061 175 994 186 839
Cash paid to suppliers and employees (127 992) (121 321) (125 056)
Cash generated by operating activities 44 069 54 673 61 783
Cash flow from operations 46 236 52 973 56 422
Decrease/(increase) in working capital (2 167) 1 700 5 361
Dividends received from equity accounted investments 1 539 887 2 812
Finance income received 1 464 1 633 1 234
Finance costs paid (3 612) (3 249) (2 097)
Tax paid (6 352) (9 329) (10 057)
Dividends paid (8 628) (10 680) (12 739)
Cash retained from operating activities 28 480 33 935 40 936
Total additions to non-current assets (56 812) (70 497) (42 645)
Additions to non-current assets (60 343) (73 748) (45 106)
Increase in capital project-related payables 3 531 3 251 2 461
Additional investment in equity (444) (548) (588)
Proceeds on disposals 788 569 1 210
Net cash disposed of on disposal of business – – (105)
Purchase of investments (96) (233) (224)
Proceeds from sale of investments 28 171 264
(Increase)/decrease in long-term receivables (141) (506) 3
Cash used in investing activities (56 677) (71 034) (42 085)
Share capital issued on implementation of share options – 54 144
Dividends paid to non-controlling shareholders in subsidiaries (989) (1 296) (365)
Proceeds from long-term debt 9 277 34 008 14 543
Repayments of long-term debt (2 364) (3 120) (1 663)
Proceeds from short-term debt 4 033 2 901 2 686
Repayments of short-term debt (1 410) (3 369) (2 280)
Cash generated by financing activities 8 547 29 178 13 065
Translation effects on cash and cash equivalents (3 207) 7 069 3 095
(Decrease)/increase in cash and cash equivalents (22 857) (852) 15 011
Cash and cash equivalents at beginning of year 52 180 53 032 38 021
Cash and cash equivalents at end of year 29 323 52 180 53 032
ADDITIONS TO NON-CURRENT ASSETSIncluded in additions to non-current assets of R60,3 billion is R36,8 billion relating to the construction of the Lake Charles Chemicals Project (LCCP).
PROCEEDS FROM LONG-TERM DEBTLoans raised during the year amounted to R13,3 billion, mainly for the funding of our growth projects. We have sufficient liquidity in place to fund the LCCP and our business operations.
CASH AND CASH EQUIVALENTSOur net cash position decreased by 44%, from R52,2 billion in June 2016 to R29,3 billion mainly due to the funding of the LCCP and the effect of a stronger closing rand/US dollar exchange rate.
Statement of cash fl ows for the year ended 30 June
Commentary
2017 2016 2015 Rm Rm Rm
Turnover 172 407 172 942 185 266
Materials, energy and consumables used (71 436) (71 320) (80 169)
Selling and distribution costs (6 405) (6 914) (6 041)
Maintenance expenditure (8 654) (8 453) (7 628)
Employee-related expenditure (24 417) (23 911) (22 096)
Exploration expenditure and feasibility costs (491) (282) (554)
Depreciation and amortisation (16 204) (16 367) (13 567)
Other expenses and income (12 550) (9 073) (9 912)
Translation gains/(losses) (1 201) 150 (959)
Other operating expenses and income (11 349) (9 223) (8 953)
Remeasurement items (1 616) (12 892) (807)
Equity accounted profits, net of tax 1 071 509 2 057
Operating profi t 31 705 24 239 46 549
Finance income 1 568 1 819 1 274
Finance costs (3 265) (2 340) (2 230)
Profi t before tax 30 008 23 718 45 593
Taxation (8 495) (8 691) (14 431)
Profi t for the year 21 513 15 027 31 162
Attributable to
Owners of Sasol Limited 20 374 13 225 29 716
Non-controlling interests in subsidiaries 1 139 1 802 1 446
21 513 15 027 31 162
Earnings per share Rand Rand Rand
Basic earnings per share 33,36 21,66 48,71
Diluted earnings per share 33,27 21,66 48,70
Sasol Integrated Report 201774
TURNOVERTurnover remained flat. Performance Chemicals and Base Chemicals sales volumes were up by 2% and 3% while Energy’s sales volumes decreased by 2%.
EMPLOYEE-RELATED EXPENDITURE
Excluding the impact of the share-based payment, our employee costs increased by 3% compared to 2016. During the year, 800 employees were employed by the organisation mainly in the US and the in-sourcing and the conversion of hired employees to permanent employees.
REMEASUREMENT ITEMSMost significant remeasurement items include a partial impairment of our US Gas-to-Liquids (GTL) project amounting to R1,7 billion (US$130 million) and the reversal of a partial impairment of the Lake Charles Chemicals Project (LCCP) amounting to R0,8 billion (US$65 million).
TAXATIONThe decrease in the effective corporate tax rate from 36,6% to 28,3% was mainly as a result of the R9,9 billion partial impairment of our Canadian shale gas assets in the prior year. The adjusted effective tax rate, excluding equity accounted investments, remeasurements and once-off items, was 26,5% compared to 28,2% in the prior year.
EARNINGS ATTRIBUTABLE TO SHAREHOLDERSEarnings attributable to shareholders increased by 54% to R20,4 billion from R13,2 billion in the prior year. Earnings per share (EPS) increased by 54% to R33,36. The prior year EPS was negatively impacted by the R9,9 billion impairment of our Canadian shale gas assets.
Income statementfor the year ended 30 June
Commentary
CHIEF FINANCIAL OFFICER’S REVIEW (continued)
Our
str
ateg
ic b
usin
ess
cont
ext
How
we
crea
te v
alue
Our
gov
erna
nce
Our
per
form
ance
revi
ewA
ddit
iona
l inf
orm
atio
nW
ho w
e ar
e

Sasol Integrated Report 2017 77
Exploration and Production International (E&PI) develops and manages the Group’s upstream interests in oil and gas exploration and production in Mozambique, Canada, Gabon, South Africa and Australia.
LOOKING AHEADFocused on creating a portfolio of producing and exploration oil and gas assets for near-term cash generation and long-term value, we are targeting growth opportunities in Southern and West Africa, while adhering to operational and safety standards in our current assets. Cash containment remains a priority in all of our assets, and we will work closely with our partners in Mozambique to mitigate the impact of fiscal challenges. We expect to drill seven more wells in the PSA licence area in the near term, and finalise the terms of two new exploration licences. In Gabon, we will focus on progressing the Etame Marin Permit, the DE 8 Permit acquisition and other opportunities. In Canada, the priority is to continue the appraisal of our assets and re-start drilling activities on a limited basis. In South Africa, we continue to interpret the results of a 3D seismic survey in block ER236, offshore Durban basin.
PERFORMANCE SUMMARYWe made a significant turnaround in our operating profit through decisive management interventions across all assets and we benefited from more favourable macro-economics with translation differences accounting for R1 billion of the turnaround.In Mozambique, we remain committed to our growth plans, despite the fiscal challenges the country is facing. By drilling the first six wells in the Production Sharing Agreement (PSA) licence area within our approved budget and schedule, we advanced our project to develop an integrated oil, liquefied petroleum gas and gas project in the area adjacent to our Petroleum Production Agreement (PPA) facilities. In line with our strategy of joint value creation for the Government of Mozambique and Sasol, we signed a term sheet to farm down 30% of Sasol’s rights and interests in the PSA to Empresa Nacional de Hidrocarbonetos (ENH). We also completed a project to debottleneck the PPA’s Central Processing Facility. This, along with the completion of Loopline 2 on the Mozambique-to-South Africa pipeline, supported an 8% increase in gas production capacity and an increase of 2% in production volumes for the year. In terms of Mozambique exploration, we drilled an exploration well in Area A, but did not find any hydrocarbons. We also progressed negotiations with the government on the terms of two new exploration licences in Mozambique.In Gabon, we focused on maximising the efficiency of the Etame Marin Permit (EMP) asset while reducing cost. We also reversed the remaining portion of the impairment previously booked. Amid continued low gas prices, we did not have any active drilling rigs in Canada, but we successfully completed 10 existing wells that resulted in a 6% increase in gas production.In line with our strategy, we have commenced with the exit from the Beetaloo licence in Australia.
SALIENT FEATURESReported a R2,4 billion turnaround in profitability (excluding the R9,9 billion Canadian impairment in the prior year), through decisive management interventions across all assets and favourable macro-economics
Contributed more than R16 billion to Sasol’s cash-conservation programme
Advanced our proactive, behaviour-based safety approach
Drilled first six wells in PSA licence area in Mozambique and signed a 30% farm-down term sheet with ENH
Increased Mozambique PPA gas production by 2% on plant debottlenecking and Loopline 2 completion
Gabon Etame Marine Permit exceeded 100 million barrels from inception to date
Completed 10 wells in the Canadian shale gas assets, lifting gas production by 6%
Spent R72 million on social investment in Mozambique, including launch of youth development programme
Awarded Best Corporate Taxpayer by Mozambique’s Tax Authority
STRATEGIC OBJECTIVES FOR WHICH WE ARE ACCOUNTABLE• Secure and develop gas feedstock in
Southern Africa
• Grow economically attractive upstream portfolio
Mozambique
Ope
rati
ng p
rofit
Rm
0200400600800
1 0001 2001 4001 6001 8002 000
14 15 16 17
1 586
1 847
1 128
1 990
Canada
(2 449)
1514 16 17
(1 075)1(746)
Ope
rati
ng lo
ss R
m
(7 003)(7 000)
(6 000)
(5 000)
(4 000)
(3 000)
(2 000)
(1 000)
0
Gabon
Ope
rati
ng p
rofit
/(lo
ss) R
m
(1 200)(1 000)(800)(600)(400)(200)
0200400600800
1 000 888
295
(1 124) (994)
1 Excluding impact of partial impairment of our Canadian shale gas assets of R9 882 million.
Sasol Integrated Report 201776
Mining is responsible for securing the coal feedstock for the Southern African integrated value chain, mainly for gasification but also to generate electricity and steam. By doing this we convert low-cost coal into higher-value products.
SALIENT FEATURESRegrettably our safety performance deteriorated, with two tragic fatalities during the period
Experienced a prolonged strike, leading to lower production volumes, reduced profitability and additional costs of R1,4 billion
Increased external purchases of coal to replenish our stockpiles to pre-strike levels to ensure uninterrupted supply to the integrated Sasol value chain
Lower export sales as some export coal was diverted to Secunda Synfuels
Worked to rebuild relationships with our people through team building and targeted engagements to enable a return to stable operations
Geological challenges at new Impumelelo mine resulted in lower-than-expected production
82 new homeowners registered in eMbalenhle as part of our home ownership initiative
Reported 19% increase in normalised unit cost of production due to slower-than-anticipated production ramp- up post the strike and higher costs to increase production
LOOKING AHEADIn the year ahead, we expect the Shondoni colliery to be completed and to further advance the second phase of the Impumelelo mine. In 2018, we will have renewed focus on our business improvement programme to improve productivity and cost efficiency. We continue to track developments in the regulatory arena, particularly regarding the Mining Charter and the Mineral and Petroleum Resources Development Act Amendment Bill.
Strengthening our relationships with recognised trade unions, as well as with government officials and our neighbouring communities, remains key. Extending our home ownership scheme for eligible employees is another focus area.
PERFORMANCE SUMMARYOur Secunda mining operations experienced a challenging year with the onset of protected strike action, which commenced in August 2016, by the Association of Mineworkers and Construction Union (AMCU). Notwithstanding a 11% decrease in mining production volumes resulting from the strike action and lower-than-expected production ramp-up post strike action we continued to deliver our full coal supply commitment to the integrated Sasol value chain through external coal purchases. The profitability of the mining business was significantly impacted by the R1,4 billion net additional cost as a result of the strike and external purchases to ensure continuous supply to Secunda Synfuels. We worked hard to reintegrate teams after the strike and extended our community upliftment efforts, focusing particularly on greater home ownership among employees. Regrettably, we reported two work-related fatalities in the year, those of Mr Johannes Mpho Mashili on 4 July 2016 and Mr Themba Mahlangu on 2 April 2017. Safety remains a top priority.
STRATEGIC OBJECTIVES FOR WHICH WE ARE ACCOUNTABLE • Continuously improve existing asset base
and maintain technological lead
• Drive world-class safe operations to support growth
Unit cost per production ton
R/to
n
0
100
200
300
400
14 15 16 17
231 226 227
2701
1 Normalised for the effect of labour actions in 2017.
External purchases
mm
ton
s
0
1
2
3
4
5
6
7
8
14 15 16 17
5,4 5,1 5,0
8,0
Saleable production
mm
ton
s0
10
20
30
40
50
60
70
14 15 16 17
39,7 39,2 40,336,0
OPERATIONAL REVIEWS
Our
str
ateg
ic b
usin
ess
cont
ext
How
we
crea
te v
alue
Our
gov
erna
nce
Our
per
form
ance
revi
ewA
ddit
iona
l inf
orm
atio
nW
ho w
e ar
e

Sasol Integrated Report 2017 79
In Southern Africa, the Energy Business markets and sells liquid fuels, pipeline gas and electricity. Internationally, we develop, implement and manage Sasol’s gas-to-liquids (GTL) business ventures based on our proprietary technology, creating higher-value products.
SALIENT FEATURESReported an increase in our recordable case rate, however, we did not experience any serious injuries or significant transportation incidents
Maintained resilient operating margins despite macro-economic headwinds and fuel transport sector strike; benefited from sales channel optimisation
Extended our retail sales presence, Sasol recognised as one of South Africa’s most valuable brands by Brand Finance
Recorded strong cost performance, cash fixed costs decreased 5% in real terms
Completed Loopline 2 ahead of schedule and below budget, increasing capacity of Mozambique-to-South Africa gas pipeline
Supported our partners in Mozambique gas-to-power plant amid country’s fiscal crisis
B-BBEE partner Tshwarisano disbursed R132,7 million in dividends to the Batho Trust’s broad-based beneficiaries
Partial impairment of our US gas-to-liquids project amounting to R1,7 billion
ORYX GTL increased capacity utilisation, excellent safety and cost performance
EGTL successfully restarted after scheduled maintenance
Provision raised of R1,2 billion for taxation payable subject to on-going litigation in respect of crude oil procurement activities
Licensed out proprietary Sasol Slurry Phase LTFT™ technology to Uzbekistan GTL project
LOOKING AHEADWe have launched a project to maintain competitive advantage of ‘reliability of supply’ by executing a customer excellence approach. We continue to drive South African liquid fuels sales to the higher-margin retail and commercial sectors. Engaging with stakeholders in the energy sector on the evolving energy landscape is a priority. In Qatar, the focus remains on maintaining high utilisation rates and an excellent safety record. In Nigeria, we are supporting the ramp-up of EGTL to design capacity. Following the commissioning of Loopline 2, we look forward to the first full year of the gas pipeline’s increased transmission capacity. In 2018, CTRG’s electricity production will decline, as planned, to an average of 135 MW, from 2017’s average of above 152 MW as an agreement to process additional gas comes to an end.
PERFORMANCE SUMMARYWe continued to pursue our work to increase our retail footprint and maximise margin. In the year we opened 10 new retail convenience centres and plan on opening 10 in 2018. We increased our share in the liquid fuels market however the macro-economic headwinds including a weak economy, a stronger rand and only marginally firmer oil price as well as a strike in the fuel transport sector and lower fuel differentials led to a 20% decline in operating profit. Excluding the effect of the Natref downtime and lower allocated volumes from SSO, our liquid fuels sales volumes increased by 1%. Normalised operating margins remained resilient as we continued to sell more liquid fuels through higher-margin sales channels, including non-refining wholesalers, commercial buyers and our growing retail presence.
We partially impaired our US gas-to-liquids project by R1,7 billion. Our joint venture power plant in Mozambique, Central Térmica de Ressano Garcia (CTRG), operated well at design capacity. Our power purchase agreement to supply Eskom came to an end in 2017. ORYX GTL, our joint venture in Qatar, achieved a utilisation rate of 95%.
STRATEGIC OBJECTIVES FOR WHICH WE ARE ACCOUNTABLE• Optimise liquid fuels marketing channels
• Deliver selective GTL opportunities and grow low-carbon power generation
Liquid fuel sales
mm
bbl
0
10
20
30
40
50
60
70
80
14 15 16 17
58,8 61,5 61,3 60,0
Retail centres
Num
ber o
f ret
ail c
entr
es
0
50
100
150
200
250
300
350
400
14 15 16 17
380 382 388 397
Gas sales
bscf
0
10
20
30
40
50
60
70
80
14 15 16 17
57,7 57,8 58,1 56,8
STRATEGIC OBJECTIVES FOR WHICH WE ARE ACCOUNTABLE • Continuously improve existing asset base
and maintain technological lead
• Drive world-class safe operations to support growth
Sasol Integrated Report 201778
Operations consists of our core petroleum and chemical product manufacturing assets. In Southern Africa, these are Secunda Synfuels, Secunda Chemicals, Sasolburg, Satellite and Natref Operations. Internationally, they include facilities in the United States, Europe and Asia. The value proposition of these regional operating hubs lies in our ability to integrate and operate complex technologies at scale, with world-class product quality and cost advantages.
LOOKING AHEADWe are working towards solutions to meet air quality new plant standards in South Africa that take effect in 2020. At Secunda, we plan to complete the first phase of our sixth fine ash dam, commission the 17th air separation unit, realise further volume benefits of the C3 (polypropylene) expansion and make inroads in insulating low-cost houses for our air emissions offsets programme. At Sasolburg, we are continuing with our offset programme to avoid community waste-burning by establishing a waste-recycling programme and improving management of non-recyclable domestic waste. We also continue to ramp up wax production. Natref has two major shutdowns in the next financial year that will impact on production volumes, and estimates to spend up to R800 million on ensuring compliance with air quality regulations up to 2021. In the US, our HDPE joint venture is due to reach beneficial operation in the second half of calendar 2017. The first units of the LCCP are on track to start up in the second half of calendar 2018. The new spraydryer in Brunsbüttel will start-up during the second half of calendar 2017.
PERFORMANCE SUMMARYFocused on ensuring safe, stable, reliable and efficient facilities, we continued work to optimise our global operations, recording a 1% and 6% increase in production volumes for Secunda Synfuels Operations and Eurasian Operations respectively. We improved the performance of many of our assets, including Secunda’s selective catalytic cracker following modifications, the chemicals operations in the US and Europe, and at Natref, where we replaced the fluidised catalytic cracker (FCC) cyclones and carried out a maintenance shutdown of the FCC and alkylation unit, significantly reducing the crude refinery’s FCC catalyst use.
We progressed a number of capital projects in South Africa to meet our environmental compliance targets. The VOC abatement project will reach beneficial operation in the second half of calendar 2017. In the US, we made progress in our work to prepare commercially and operationally for the start-up of the LCCP. In Germany we started up the main units of the Disperal® project in Brunsbüttel. In Southern Africa, we stepped up engagement with all stakeholders, and continued our extensive support of social value within communities near our operations, including through support to municipalities to implement sound business processes and the handover of two state-of-the-art clinics in eMbalenhle and Sasolburg.
SALIENT FEATURESImproved overall safety performance across our operationsIncreased production volumes, led by record output at Secunda Synfuels, benefits of Secunda C3 expansion, start-up of second phase of Sasolburg wax expansion and record production at some US and German sitesProject to reduce emissions of volatile organic compounds (VOCs) in Secunda will reach beneficial operation in the second half of calendar 2017 and cost and schedule to be managedAdvanced operational and business readiness work in North America ahead of start-up of the LCCPIncreased community engagement and social investment in Southern Africa and the USCommenced emissions offset programme, focused on reducing the burning of waste and domestic solid fuels in South African fenceline communities to improve ambient air qualityResponded to South African water restrictions with Sasolburg achieving a 29% potable water saving that will be sustained into the futureProgressed efforts to improve gender diversity at operations, stepped up trainingExceeded our utility Energy Intensity Index (EII) improvement target 1% for the year achieving 1,67% improvement for our South African operations
Production Secunda Synfuels Operations
ktpa
0
1 000
2 000
3 000
4 000
5 000
6 000
7 000
8 000
14 15 16 17
7 6827 610 7 779 7 834
Saleable chemical production
ktpa
0
1 000
2 000
3 000
4 000
5 000
6 000
7 000
8 000
15 16 17
6 179 6 264 6 592
OPERATIONAL REVIEWS (continued)
Our
str
ateg
ic b
usin
ess
cont
ext
How
we
crea
te v
alue
Our
gov
erna
nce
Our
per
form
ance
revi
ewA
ddit
iona
l inf
orm
atio
nW
ho w
e ar
e

STRATEGIC OBJECTIVES FOR WHICH WE ARE ACCOUNTABLE• Continuously improve existing asset base
and maintain Sasol’s technological lead
• Drive selective growth based on our technology advantage
• Project execution excellence
Sasol Integrated Report 2017 81
Our Group Technology function is made up of Research and Technology, Capital Projects as well as Engineering and Project Services. Mega Projects includes all projects of over US$1 billion, with a particular focus on the LCCP and the PSA. Together these functions create value by refining technologies, maintaining existing operations and establishing new ones, growing the business.
LOOKING AHEADWe expect to close out engineering for most of the units on the LCCP by the end of the third quarter of calendar 2017. Given the on-going detailed assurance processes we follow, we are confident about meeting the cost and schedule targets and that risks can be managed within these. On the PSA project, site construction activities and the balance of procurement commences early in the new financial year. The civil and structural construction works are expected to near completion at the end of the financial year. We continue to support Sasolburg Operations to ramp up the wax expansion project.
Our focus is on technology as an enabler of the Group strategy, nurturing and growing the existing Southern African and global value chain while ensuring long-term sustainability. We aim to improve project execution by implementing lessons learnt from previous projects. Our research of the application of renewable energy within the existing Sasol business is on-going. We also continue to engage with potential GTL technology licensees.
PERFORMANCE SUMMARYWe continued to improve our capital and project management processes. Mega Projects made good progress on the LCCP and PSA and completed the second phase of the wax expansion project at Sasolburg within cost and schedule. By year-end, the LCCP was 74% complete and on track for the start-up of the first units in the second half of calendar 2018. Regrettably, we reported a fatality on the LCCP, that of a service provider Mr Tyler Truett on 5 April 2017. We have investigated the matter and lessons learnt are being shared with the teams. The PSA surface facilities project was on track, having achieved 74,5% progress on detail engineering and procurement activities required in support of the detail design and preparation for site construction. Since 2011, around 80% of our capital projects have been completed on or under budget and half have been on or ahead of schedule.
Group Technology worked with operations to secure Sasol’s volume base by focusing on plant stability, energy efficiency and reliability. We continued to hone our business processes and nurture talent, running the graduate development programme and overseeing the development and placement of engineers and scientists. We extended our research to improve our proprietary technologies. By the non-equity licensing out of Sasol’s LTFT™ GTL technology to Uzbekistan, we are securing our GTL resources and have an opportunity to continue to optimise the technology.
SALIENT FEATURESRegrettably Mega Projects had one fatality at LCCP; Group Technology recorded an improved safety performance
Progressed LCCP: 74% complete by year-end; advanced PSA to detailed engineering stage within budget and schedule
Completed second phase of Sasolburg wax expansion, within cost and schedule, producing on-spec product
Brought Mozambique-South Africa gas pipeline capacity expansion project (Loopline 2) on line ahead of schedule and below budget
Advanced a number of projects to support existing operations, securing base volumes
Licensed out (in a non-equity manner) our proprietary Sasol Slurry Phase LTFT™ and associated water technologies
Extended our research to continuously improve technologies, invested R1 billion in research and development
Started commercial utilisation of our next generation Fischer-Tropsch GTL catalyst in the EGTL plant in Nigeria
Continued to focus on securing competent skills through graduate development programme, bursaries and support to universities
STRATEGIC OBJECTIVES FOR WHICH WE ARE ACCOUNTABLE • Drive value chain optimisation
• Drive selective growth based on feedstock, market and/or technology advantage
Sasol Integrated Report 201780
Base Chemicals markets commodity chemicals from our upstream Fischer-Tropsch, ethylene and propylene value chains. Performance Chemicals markets commodity and differentiated performance chemical products which include organics, inorganics and wax value chains. We are able to adjust our product slate somewhat in response to market dynamics.
LOOKING AHEADWe continue with our business readiness work for the HDPE joint venture and the LCCP. This work includes streamlining of business processes and systems, as well as building organisational capacity. The HDPE joint venture is due to reach beneficial operation in the second half of calendar 2017. While some 92% of the new LCCP Performance Chemicals output will be placed with existing customers, Base Chemicals is making good progress to secure new customers for most of the new US output.
In 2018, we expect greater sales volumes of wax and co-monomers as the Sasolburg wax plant and the Lake Charles ethylene tetramerisation plant continue to ramp up. We also look forward to greater sales of polypropylene as we continue to benefit from the C3 expansion at Secunda. Demand for commodity chemicals is expected to keep growing in line with global GDP, but in differentiated chemicals, new applications and polyethylene, demand is seen outpacing GDP growth. We will continue to pilot the Digital Catalyst programme to transform the customer experience using digital platforms.
PERFORMANCE SUMMARYThe stronger rand and lower ammonia prices contributed to a 11% decline in Performance Chemicals’ operating profit, however sales volumes, normalised for planned shutdowns and the disposal of the US wax facility, rose 2%. Management interventions improved our cost position across a number of value chains and an increase in ethylene prices supported improved margins in the US. Demand for inorganics products remained healthy as we continued to differentiate our product offering. In Germany, we achieved beneficial operation of a project to increase our production capacity of Disperal®. We are also undertaking a number of incremental debottlenecking projects that have attractive returns and a short payback period on capital invested. After several years of strong growth in our Chinese surfactants business, we received approval to more than double the production capacity of ethoxylates in the region.
Base Chemicals benefited from a full year of additional volumes from the C3 expansion project in Secunda, as well as planned stock builds at the end of the previous financial year. This contributed to a 3% increase in sales volumes. Operating profit increased 25%, largely due to the reversal of the impairment of our low-density polythylene cash-generating unit in the US, stronger sales volumes, better dollar prices offset by the stronger rand/US dollar exchange rate.
SALIENT FEATURESAdvanced on business readiness ahead of start-up of the HDPE joint venture and the LCCP
Base Chemicals recorded improved safety performance and fewer transport incidents; Performance Chemicals reported a deterioration
Performance Chemicals delivered resilient average gross margins, while Base Chemicals gross margins were largely in line with the previous year
Reported 2% increase in sales volumes at Performance Chemicals, 3% increase at Base Chemicals
Performance Chemicals benefited from start-up of second phase of Sasolburg wax expansion and made significant progress on business improvement initiatives
Base Chemicals benefited from increased polypropylene volumes flowing from Secunda C3 expansion project
Performance Chemicals secured final investment decision for new ethoxylation plant in China
Launched Digital Catalyst pilot programme to improve customer experience using digital platforms Operating profit margin
%
0
5
10
15
20
25
30
14 15 16 17
15 16
26
18
13
15 1614
3 10
6 3 54
1
Sales volumes
ktpa
0
500
1 000
1 500
2 000
2 500
3 000
3 500
4 000
14 15 16 17
3 5
52
3 4
18
3 2
763
48
7
3 0
26 3 4
58
3 1
06 3 5
41
Operating profit
Ope
rati
ng p
rofit
Rm
0
3 000
6 000
9 000
12 000
15 000
14 15 16 17
6 7
42
11 8
48
10 2
08 12
714
4 4
86
11 2
76
5 62
5
10 0
00
Base Chemicals Performance Chemicals
OPERATIONAL REVIEWS (continued)
Our
str
ateg
ic b
usin
ess
cont
ext
How
we
crea
te v
alue
Our
gov
erna
nce
Our
per
form
ance
revi
ewA
ddit
iona
l inf
orm
atio
nW
ho w
e ar
e

STAKEHOLDER BENEFITS
• Share price appreciation
• Returning cash to shareholders via dividends
• Contributing to social and economic development in the regions where we operate
• Providing 30 900 people with jobs and stimulating the economies in which we operate
Value to stakeholders translates as
Low cost of production
makes us competitive and resilient
High margin, cash-generative
business compared with peers
TO GROW SHAREHOLDER
VALUE SUSTAINABLY
UNDERPINNED BY CURRENTLY UNDEMANDING VALUATION OF THE SASOL SHARE
Investing in Sasol provides exposure to our robust portfolio, comprising feedstock-advantaged operations, combined with human talent and unique technology, creating long-term shareholder return.
Sasol Integrated Report 2017 83
CASE
OUR
DESPITE THE LOW OIL
PRICE
OUR INVESTMENT CASE REMAINS COMPELLING
ROBUST PORTFOLIO• Integrated value chains (backward integrated where
possible)• Diversified business (chemicals, energy, upstream
and electricity)
FEEDSTOCK ADVANTAGE• Low cost feedstock
(low oil price break-even)• Long life resource (Secunda coal, Mozambique gas,
Qatar gas, US ethane)
MANAGEMENT ACTIONS• Stable operations (volumes stable and cost control)• Business intervention (Response Plan and Business
Performance Enhancement Programme)• Increased focus on execution of capital projects• Focused actions to deliver LCCP within budget and
approved schedule
EMERGING MARKET STOCK• Rand hedge stock• Emerging market exposure with developed market
governance
ADVANCED TECHNOLOGY• Proprietary chemical technologies• Gas-to-liquids (convert stranded gas to high value
products)• Existing coal-to-liquids (convert low quality coal to
fuel and chemicals)
Sasol Integrated Report 201782
Our
str
ateg
ic b
usin
ess
cont
ext
How
we
crea
te v
alue
Our
gov
erna
nce
Our
per
form
ance
revi
ewA
ddit
iona
l inf
orm
atio
nW
ho w
e ar
e

Shareholders' diary
Annual General Meeting Friday, 17 November 2017
DividendInterim dividend
SA rand per ordinary share R4,80
– paid 20 March 2017
Final dividend
– rand per share R7,80
– date declared 21 August 2017
– last date to trade cum dividend 5 September 2017
– payable 11 September 2017
Shareholder helplineInformation helpline: 0800 000 222Email: [email protected]
Assistance with AGM queries and proxy formsTelephone: +27 (0) 11 373 0033Email: [email protected]: +27 (0) 11 688 5238
Shareholder enquiriesTelephone: +27 (0) 86 110 0926Telefax: +27 (0) 11 688 5237Email: #[email protected]
Depositary bankThe Bank of New York MellonDepositary Receipts Division101 Barclay StreetNew York, NY 10286United States of America
Direct purchase planThe Bank of New York Mellon maintains a sponsored dividend reinvestment and direct purchase programme for Sasol’s depositary receipts. As a participant in Global BuyDIRECTSM, investors benefit from the direct ownership of their depositary receipts, the efficiency of receiving corporate communications directly from the depositary receipt issuer, and the savings resulting from the reduced brokerage and transaction costs. Additional information is available at www.mybnymdr.com.
Questions or correspondence about Global BuyDIRECTSM should be addressed to:The Bank of New York Mellon Shareowner ServicesPO Box 505000 LouisvilleKY 40233-5000United States of America
Toll-free telephone for US Global BuyDIRECTSM participants:1-888-BNY-ADRSTelephone for international callers: 1-201-680-6825Email: [email protected]: www.mybnymdr.com
Share registrarsComputershare Investor Services (Pty) LtdRosebank Towers15 Biermann AvenueRosebank 2196Republic of South Africa
PO Box 61051Marshalltown 2107Republic of South Africa
Telephone: +27 (0) 11 370 5000 Email: #[email protected]
Sasol contacts
Postal and electronic addresses and telecommunication numbersPO Box 5486Johannesburg 2000Republic of South Africa
Telephone: +27 (0) 10 344 5000Website: www.sasol.com
Business address and registered officeSasol Place50 Katherine StreetSandton 2090Republic of South Africa
Company registration number1979/003231/06
Investor RelationsSasol's contacts with the security analyst community are through the Investor Relations office:
Email: [email protected]: +27 (0) 10 344 9280
Corporate AffairsTelephone: +27 (0) 10 344 6505
Contact information
Sasol Integrated Report 201784
CONTACT DETAILS AND SHAREHOLDERS’ DIARY
Disclaimer – Forward-looking statements:Sasol may, in this document, make certain statements that are not historical facts and relate to analyses and other information which are based on forecasts of future results and estimates of amounts not yet determinable. These statements may also relate to our future prospects, developments and business strategies. Examples of such forward-looking statements include, but are not limited to, statements regarding exchange rate fluctuations, volume growth, increases in market share, total shareholder return, executing our growth projects (including LCCP), oil and gas reserves and cost reductions, including in connection with our BPEP, RP and our business performance outlook. Words such as “believe”, “anticipate”, “expect”, “intend", “seek”, “will”, “plan”, “could”, “may”, “endeavour”, “target”, “forecast” and “project” and similar expressions are intended to identify such forward-looking statements, but are not the exclusive means of identifying such statements. By their very nature, forward-looking statements involve inherent risks and uncertainties, both general and specific, and there are risks that the predictions, forecasts, projections and other forward-looking statements will not be achieved. If one or more of these risks materialise, or should underlying assumptions prove incorrect, our actual results may differ materially from those anticipated. You should understand that a number of important factors could cause actual results to differ materially from the plans, objectives, expectations, estimates and intentions expressed in such forward-looking statements. These factors are discussed more fully in our most recent annual report on Form 20-F filed on 28 August 2017 and in other filings with the United States Securities and Exchange Commission. The list of factors discussed therein is not exhaustive; when relying on forward-looking statements to make investment decisions, you should carefully consider both these factors and other uncertainties and events. Forward-looking statements apply only as of the date on which they are made, and we do not undertake any obligation to update or revise any of them, whether as a result of new information, future events or otherwise.
Please note: A billion is defined as one thousand million. All references to years refer to the financial year ended 30 June. Any reference to a calendar year is clearly articulated as such.
Abbreviationsmm bbl – million barrels
mm tons – million tons
bscf – billion standard cubic feet
m bbl – thousand barrels
ktpa – thousand tons per annum
Rm – rand millions
$/ton – US dollar per ton
R/ton – rand per ton
mm3 – million cubic meters
Our
str
ateg
ic b
usin
ess
cont
ext
How
we
crea
te v
alue
Our
gov
erna
nce
Our
per
form
ance
revi
ewA
ddit
iona
l inf
orm
atio
nW
ho w
e ar
e
BPEP – Business Performance Enhancement Project
EGTL – Escravos Gas-to-Liquids
LCCP – Lake Charles Chemicals Project
RP – Response Plan
PSA – Production Sharing Agreement
HEPS – Headline Earnings Per Share
Core headline earnings are calculated by adjusting headline earnings with once-off items, period close adjustments and depreciation and amortisation of significant capital projects, exceeding R4 billion which have reached beneficial operation and are still ramping up and share-based payments on implementation of BBBEE transactions. We believe core headline earnings is a useful measure of the group’s sustainable operating performance. However, this is not a defined term under IFRS and may not be comparable with similarly titled measures reported by other companies.

www.sasol.com