OMEGASCOPE™ User's Guide - Omega Engineering · 1 Oscilloscope basics ... With an...
189
OMSP-2000 OMSP-3000 OMSP-4224 OMSP-4227 ® OMEGASCOPE TM Software for OMSP-2000/3000/4000 Series PC Oscilloscopes Rev. _____ Includes: Software Manuals omega.com 800-DAS-IEEE (800-327-4333) © COPYRIGHT 2011 OMEGA ENGINEERING, INC. OMEGASCOPE™ PC OSCILLOSCOPE SOFTWARE For OMSP-2000/3000/4000 Series e-mail: [email protected] For latest product manuals: omegamanual.info Shop online at omega.com ® User’s Guide ®
Transcript of OMEGASCOPE™ User's Guide - Omega Engineering · 1 Oscilloscope basics ... With an...

OMSP-2000
OMSP-3000
OMSP-4224
OMSP-4227
®
OMEGASCOPETM Software for OMSP-2000/3000/4000 Series PC Oscilloscopes
Rev. _____
Includes:SoftwareManuals
omega.com800-DAS-IEEE (800-327-4333)
© COPYRIGHT 2011 OMEGA ENGINEERING, INC.
OMEGASCOPE™PC OSCILLOSCOPE SOFTWARE
For OMSP-2000/3000/4000Series
e-mail: [email protected] latest product manuals:
omegamanual.info
Shop online atomega.com ®
User’s Guide®

Servicing North America:U.S.A.: Omega Engineering, Inc., One Omega Drive, P.O. Box 4047ISO 9001 Certified Stamford, CT 06907-0047 USA
Toll Free: 1-800-826-6342 TEL: (203) 359-1660FAX: (203) 359-7700 e-mail: [email protected]
Canada: 976 BergarLaval (Quebec), H7L 5A1 Canada Toll-Free: 1-800-826-6342 TEL: (514) 856-6928FAX: (514) 856-6886 e-mail: [email protected]
For immediate technical or application assistance:U.S.A. and Canada: Sales Service: 1-800-826-6342/1-800-TC-OMEGA®
Customer Service: 1-800-622-2378/1-800-622-BEST®
Engineering Service: 1-800-872-9436/1-800-USA-WHEN®
Mexico/ En Español: 001 (203) 359-7803 FAX: 001 (203) 359-7807Latin America [email protected] e-mail: [email protected]
Servicing Europe:Benelux: Managed by the United Kingdom Office
Toll-Free: 0800 099 3344 TEL: +31 20 347 21 21FAX: +31 20 643 46 43 e-mail: [email protected]
Czech Republic: Frystatska 184733 01 Karviná, Czech RepublicToll-Free: 0800-1-66342 TEL: +420-59-6311899FAX: +420-59-6311114 e-mail: [email protected]
France: Managed by the United Kingdom OfficeToll-Free: 0800 466 342 TEL: +33 (0) 161 37 29 00FAX: +33 (0) 130 57 54 27 e-mail: [email protected]
Germany/Austria: Daimlerstrasse 26D-75392 Deckenpfronn, GermanyToll-Free: 0800 6397678 TEL: +49 (0) 7056 9398-0FAX: +49 (0) 7056 9398-29 e-mail: [email protected]
United Kingdom: OMEGA Engineering Ltd.ISO 9001 Certified One Omega Drive, River Bend Technology Centre, Northbank
Irlam, Manchester M44 5BD United KingdomToll-Free: 0800-488-488 TEL: +44 (0) 161 777-6611FAX: +44 (0) 161 777-6622 e-mail: [email protected]
OMEGAnet® Online Service Internet e-mailomega.com [email protected]
It is the policy of OMEGA Engineering, Inc. to comply with all worldwide safety and EMC/EMIregulations that apply. OMEGA is constantly pursuing certification of its products to the European NewApproach Directives. OMEGA will add the CE mark to every appropriate device upon certification.The information contained in this document is believed to be correct, but OMEGA accepts no liability for anyerrors it contains, and reserves the right to alter specifications without notice.WARNING: These products are not designed for use in, and should not be used for, human applications.
®

Table of ContentsI
M5064
Table of Contents....................................................................................................................................11 Welcome
....................................................................................................................................22 OMEGASCOPE™ overview
....................................................................................................................................33 Introduction
........................................................................................................................................31 Trademarks
........................................................................................................................................32 Contact information
........................................................................................................................................33 How to use this manual
........................................................................................................................................54 System requirements
....................................................................................................................................64 Using OMEGASCOPE™ for the first time
....................................................................................................................................75 OMEGASCOPE™ and oscilloscope primer
........................................................................................................................................71 Oscilloscope basics
........................................................................................................................................82 PC Oscilloscope basics
........................................................................................................................................93 OMEGASCOPE™ basics ......................................................................................................................................................................101 Capture modes ......................................................................................................................................................................112 How do capture modes work with views?
........................................................................................................................................124 OMEGASCOPE™ window
........................................................................................................................................135 Scope view
........................................................................................................................................146 XY view
........................................................................................................................................157 Trigger marker
........................................................................................................................................158 Post-trigger arrow
........................................................................................................................................169 Spectrum view
........................................................................................................................................1710 Persistence mode
........................................................................................................................................1811 Measurements table
........................................................................................................................................1912 Resolution enhancement
........................................................................................................................................2013 Pointer tool tip
........................................................................................................................................2114 Signal rulers
........................................................................................................................................2215 Time rulers
........................................................................................................................................2316 Ruler legend
........................................................................................................................................2317 Frequency legend
........................................................................................................................................2418 Properties sheet
........................................................................................................................................2419 Custom probes
........................................................................................................................................2520 Maths channels
........................................................................................................................................2621 Reference waveforms
........................................................................................................................................2722 Serial decoding
........................................................................................................................................2823 Mask limit testing
........................................................................................................................................2924 Alarms
........................................................................................................................................3025 Buffer Navigator
....................................................................................................................................316 Menus
........................................................................................................................................321 File menu ......................................................................................................................................................................331 Save As dialog

IIOMEGASCOPE™ User's Guide
M5064
......................................................................................................................................................................382 Startup Settings menu ........................................................................................................................................382 Edit menu
......................................................................................................................................................................391 Notes area ........................................................................................................................................403 Views menu
......................................................................................................................................................................421 Custom grid layout dialog ........................................................................................................................................434 Measurements menu
......................................................................................................................................................................441 Add / Edit Measurement dialog
......................................................................................................................................................................452 Advanced measurement settings ........................................................................................................................................475 Tools menu
......................................................................................................................................................................481 Custom Probes dialog
......................................................................................................................................................................632 Maths Channels dialog
......................................................................................................................................................................733 Reference Waveforms dialog
......................................................................................................................................................................754 Serial Decoding dialog
......................................................................................................................................................................835 Alarms dialog
......................................................................................................................................................................856 Masks menu
......................................................................................................................................................................887 Macro Recorder
......................................................................................................................................................................898 Preferences dialog ........................................................................................................................................1006 Help menu
........................................................................................................................................1017 Connect Device dialog
........................................................................................................................................1028 Converting files in Windows Explorer
....................................................................................................................................1047 Toolbars and buttons
........................................................................................................................................1051 Buffer Navigation toolbar
........................................................................................................................................1062 Channel Setup toolbar ......................................................................................................................................................................1071 Channel Options menu
........................................................................................................................................1123 Capture Setup toolbar ......................................................................................................................................................................1141 Spectrum Options dialog ......................................................................................................................................................................1162 Persistence Options dialog
........................................................................................................................................1184 Measurements toolbar
........................................................................................................................................1195 Signal Generator button ......................................................................................................................................................................1191 Signal Generator dialog ......................................................................................................................................................................1212 Arbitrary waveform files ......................................................................................................................................................................1223 Arbitrary Waveform Generator window ......................................................................................................................................................................1254 Demo Signals dialog ......................................................................................................................................................................1255 Demo Signals menu
........................................................................................................................................1266 Start / Stop toolbar
........................................................................................................................................1277 Triggering toolbar ......................................................................................................................................................................1291 Advanced Triggering dialog ......................................................................................................................................................................1302 Advanced trigger types
........................................................................................................................................1338 Zooming and Scrolling toolbar ......................................................................................................................................................................1341 Zoom Overview
....................................................................................................................................1358 How to...
........................................................................................................................................1361 How to change to a different device
........................................................................................................................................1372 How to use rulers to measure a signal
........................................................................................................................................1383 How to measure a time difference
........................................................................................................................................1394 How to move a view
........................................................................................................................................1405 How to scale and offset a signal
........................................................................................................................................1456 How to set up the spectrum view
........................................................................................................................................1467 How to find a glitch using persistence mode

Table of ContentsIII
M5064
........................................................................................................................................1508 How to set up a Mask Limit Test
........................................................................................................................................1539 How to save on trigger
....................................................................................................................................1579 Reference
........................................................................................................................................1571 Measurement types ......................................................................................................................................................................1581 Scope measurements ......................................................................................................................................................................1592 Spectrum measurements
........................................................................................................................................1612 Signal generator waveform types
........................................................................................................................................1623 Spectrum window functions
........................................................................................................................................1634 Trigger timing (part 1)
........................................................................................................................................1645 Trigger timing (part 2)
........................................................................................................................................1656 Serial protocols ......................................................................................................................................................................1661 CAN Bus protocol ......................................................................................................................................................................1682 I²C Bus protocol ......................................................................................................................................................................1693 RS232/UART protocol ......................................................................................................................................................................1704 SPI Bus protocol
........................................................................................................................................1717 Command-line syntax
........................................................................................................................................1738 Glossary
....................................................................................................................................17510 Application Error dialog
....................................................................................................................................176Index
OMEGASCOPE™ User's Guide 1
M5064
1 WelcomeWelcome to the OMEGASCOPE™ PC Oscilloscope software.
With an OMSP-2000/3000/4000 Series device, OMEGASCOPE™turns your PC into a powerful PC Oscilloscope with all the featuresand performance of a bench-top oscilloscope at a fraction of thecost.
How to use this manualWhat's new in this version?Using OMEGASCOPE™ for the first time
M5064-1111 : 2012-02-27, S/W 6.6.1
9
8
7
3
2
6

OMEGASCOPE™ overview2
M5064
2 OMEGASCOPE™ overviewHigher performance
Faster capture rates, making it easier to see fast-moving signalsFaster data processingBetter support for the latest OMEGASCOPE™ USB oscilloscopes
Improved usability and appearance
Clearer graphics and textTool tips and help messages to explain all featuresEasy point-and-click tools for panning and zooming
Features
The latest Windows .NETtechnology enabling us todeliver updates more quickly
Multiple views of the samedata, with individual zoomand pan settings for eachview
Custom probes managerto make it easy for you touse your own probes andsensors with OMEGASCOPE™
Advanced triggeringconditions including pulse,window and logic
Properties sheetdisplaying all settings at aglance
Spectrum mode with afully optimized spectrumanalyzer
Per-channel lowpass filtering Math channels for creating mathematical functions ofinput channels
Reference waveforms forstoring copies of inputchannels
Arbitrary waveform designer for oscilloscopes with a
built-in arbitrary waveformgenerator
Rapid trigger mode tocapture a sequence ofwaveforms with theminimum possible dead time
Windows Explorer integration to show files as pictures
and convert to other formats
Command-line options forconverting files
Zoom overview for rapidlyadjusting the zoom to showany part of the waveform
Serial decoding for RS232,
I2C and other formats, in realtime
Mask limit testing to showwhen a signal goes out ofbounds
Buffer navigator forsearching the waveformbuffer
Alarms to alert you whena specified event occurs
13
48
129
24 10
110
25
26
122
127
173
102
171 134
27 28
30 29

OMEGASCOPE™ User's Guide 3
M5064
3 IntroductionOMEGASCOPE™ is a comprehensive software application for OMSP-2000/3000/4000Series PC Oscilloscopes. It creates a virtual oscilloscope, spectrum analyser andmultimeter on your PC.
OMEGASCOPE™ supports the following scope devices:
OMSP-4000 SeriesOMSP-3000 SeriesOMSP-2000 Series
OMEGASCOPE™ runs on any computer with Windows XP SP2 or later, Windows Vistaor Windows 7. (See System requirements for further recommendations.)
Contact informationHow to use this manual
How to use OMEGASCOPE™
Getting started: see using OMEGASCOPE™ for the first time , andOMEGASCOPE™'s Features.For further information: see descriptions of Menus and Toolbars , and theReference section.For step-by-step tutorials, see the "How to " section.
3.1 TrademarksWindows is a registered trade mark of Microsoft Corporation. OMEGASCOPE™ is atrademark of Omega Engineering, Inc.
3.2 Contact informationAddress: Omega Engineering, Inc.
One Omega DriveP.O. Box 4047Stamford, CT 06907USA
Phone:Fax:
203-359-1660203-359-7700
Technical support email:Sales email:
[email protected]@omega.com
Web site: www.omega.com
3.3 How to use this manualIf you are using a PDF viewer to read this manual, you can turn the pages of themanual as if it were a book, using the Back and Forward buttons in your viewer.These buttons should look something like this:
Back
Forward
You can also print the entire manual for reading away from your computer. Look for a Print button similar to this:
5
3
3
6
7
31 104
157
135

Introduction4
M5064
For your first introduction to OMEGASCOPE™, we suggest that you start with thesetopics:
Using OMEGASCOPE™ for the first timeOscilloscope basicsPC Oscilloscope basicsOMEGASCOPE™ basics
6
7
8
9

OMEGASCOPE™ User's Guide 5
M5064
3.4 System requirementsTo ensure that OMEGASCOPE™ operates correctly, you must have a computer with atleast the minimum system requirements to run one of the supported operatingsystems, as shown in the following table. The performance of the oscilloscope will bebetter with a more powerful PC, and will benefit from a multi-core processor.
Item Absoluteminimum
Recommendedminimum
Recommendedfull specification
Operating system Windows XP SP2Windows Vista
Windows 7
Windows XP SP2Windows Vista
Windows 7
Windows XP SP2Windows Vista
Windows 7
ProcessorAs required by Windows
300 MHz 1 GHz
Memory 256 MB 512 MB
Free disk space* 1.5 GB 2 GB
Ports USB 1.1 compliant port USB 2.0 compliant port
* The OMEGASCOPE™ software does not use all the disk space specified in the table.The free space is required to make Windows run efficiently.

Using OMEGASCOPE™ for the first time6
M5064
4 Using OMEGASCOPE™ for the first timeWe have designed OMEGASCOPE™ to be as easy as possible to use, even fornewcomers to oscilloscopes. Once you have followed the introductory steps listedbelow, you will soon be on your way to becoming a OMEGASCOPE™ expert.
1. Install the software. Load the CD-ROM that is included with your scopedevice, then click the "Install Software" link and follow the on-screeninstructions.
2. Plug in your scope device. Windows will recognise it and prepare yourcomputer to work with it. Wait until Windows tells you that the device isready to use.
3. Click the new OMEGASCOPE™ icon on your Windows desktop.
4. OMEGASCOPE™ will detect your scope device and prepare to display awaveform. The green Start button will be highlighted to show thatOMEGASCOPE™ is ready.
5. Connect a signal to one of the scope device's input channels and seeyour first waveform! To learn more about using OMEGASCOPE™, pleaseread the OMEGASCOPE™ Primer.
Problems?
Help is at hand! Our technical support staff are always ready to answer your telephonecall during office hours. At other times, please send us an email.
126
7

OMEGASCOPE™ User's Guide 7
M5064
5 OMEGASCOPE™ and oscilloscope primerThis chapter explains the fundamental concepts that you will need to know beforeworking with the OMEGASCOPE™ software. If you have used an oscilloscope before,then most of these ideas will be familiar to you. You can skip the Oscilloscope basics
section and go straight to the OMEGASCOPE™-specific information . If you arenew to oscilloscopes, please take a few minutes to read at least the Oscilloscopebasics and OMEGASCOPE™ basics topics.
5.1 Oscilloscope basicsAn oscilloscope is a measuring instrument that displays a graph of voltage againsttime. For example, the picture below shows a typical display on an oscilloscope screenwhen a varying voltage is connected to one of its input channels.
Oscilloscope displays are always read from left to right. The voltage-timecharacteristic of the signal is drawn as a line called the trace. In this example, thetrace is blue and begins at point A. If you look to the left of this point, you will see thenumber "0.0" on the voltage axis, which tells you that the voltage is 0.0 V (volts).If you look below point A, you will see another number "0.0", this time on the timeaxis, which tells you that the time is 0.0 ms (milliseconds) at this point.
At point B, 0.25 milliseconds later, the voltage has risen to a positive peak of 0.8volts. At point C, 0.75 milliseconds after the start, the voltage has dropped to anegative peak of -0.8 volts. After 1 millisecond, the voltage has risen back to 0.0 voltsand a new cycle is about to begin. This type of signal is called a sine wave, and is oneof a limitless range of signal types that you will encounter.
Most oscilloscopes allow you to adjust the vertical and horizontal scales of the display.The vertical scale is called the voltage range (in this example at least, althoughscales in other units, such as milliamperes, are possible). The horizontal scale is calledthe timebase and is measured in units of time - in this example, thousandths of asecond.
7 8
7 9
173

OMEGASCOPE™ and oscilloscope primer8
M5064
5.2 PC Oscilloscope basicsA PC Oscilloscope is a measuring instrument that consists of a hardware scopedevice and an oscilloscope program running on a PC. Oscilloscopes were wereoriginally stand-alone instruments with no signal processing or measuring abilities,and with storage only available as an expensive extra. Later oscilloscopes began touse new digital technology to introduce more functions, but they remained highlyspecialised and expensive instruments. PC Oscilloscopes are the latest step in theevolution of oscilloscopes, combining the measuring power of OMSP-2000/3000/4000scope devices with the convenience of the PC that's already on your desk.
+ =PC scope device PC Oscilloscope

OMEGASCOPE™ User's Guide 9
M5064
5.3 OMEGASCOPE™ basicsOMEGASCOPE™ can produce a simple display such as the example in the Oscilloscopebasics topic, but it also has many advanced features. The screen shot below showsthe OMEGASCOPE™ window. Click on any of the underlined labels to learn more. See OMEGASCOPE™ window for an explanation of these important concepts.
Note: Other buttons may appear in the OMEGASCOPE™ main window depending onthe capabilities of the oscilloscope that is connected, and on the settings applied tothe OMEGASCOPE™ program.
7
12

OMEGASCOPE™ and oscilloscope primer10
M5064
5.3.1 Capture modesOMEGASCOPE™ can operate in three capture modes: scope mode, spectrum modeand persistence mode. The mode is selected by buttons in the Capture SetupToolbar .
In scope mode, OMEGASCOPE™ displays a main scope view, optimises itssettings for use as a PC Oscilloscope, and allows you to directly set the capturetime. You can still display one or more secondary spectrum views.
In spectrum mode, OMEGASCOPE™ displays a main spectrum view, optimisesits settings for spectrum analysis, and allows you to directly set the frequencyrange in a similar way to a dedicated spectrum analyser. You can still display oneor more secondary scope views.
In persistence mode , OMEGASCOPE™ displays a single, modified scope view inwhich old waveforms remain on the screen in faded colors while new waveforms aredrawn in brighter colors. See also: How to find a glitch using persistence modeand the Persistence Options dialog .
When you save waveforms and settings , OMEGASCOPE™ only saves data for themode that is currently in use. If you wish to save settings for both capture modes,then you need to switch to the other mode and save your settings again.
See also: How do capture modes work with views?
112
13
16
17
146
116
32
11

OMEGASCOPE™ User's Guide 11
M5064
5.3.2 How do capture modes work with views?The capture mode tells OMEGASCOPE™ whether you are mainly interested inviewing waveforms (scope mode ) or frequency plots (spectrum mode ). Whenyou select a capture mode, OMEGASCOPE™ sets up the hardware appropriately andthen shows you a view that matches the capture mode (a scope view if youselected scope mode or persistence mode , or a spectrum view if you selectedspectrum mode). The rest of this section does not apply in persistence mode, whichallows only a single view.
Once OMEGASCOPE™ has shown you the first view, you can, if you wish, add morescope or spectrum views, regardless of the capture mode you are in. You can add andremove as many extra views as you wish, as long as one view remains that matchesthe capture mode.
Examples showing how you might select the capture mode and open additional views inOMEGASCOPE™. Top: persistence mode (one view only). Middle: scope mode. Bottom:
spectrum mode.
When using a secondary view type (a spectrum view in scope mode, or a scope viewin spectrum mode), you may see the data compressed horizontally rather thandisplayed neatly as in a primary view. You can usually overcome this by using thezoom tools.
10
10 10
13
17 16

OMEGASCOPE™ and oscilloscope primer12
M5064
5.4 OMEGASCOPE™ windowThe OMEGASCOPE™ window shows a block of data captured from the scope device
. When you first open OMEGASCOPE™ it contains one scope view , but you canadd more views by clicking Add view in the Views menu . The screen shot belowshows all the main features of the OMEGASCOPE™ window. Click on the underlinedlabels for more information.
To arrange the views within the OMEGASCOPE™ window
If the OMEGASCOPE™ window contains more than one view , OMEGASCOPE™arranges them in a grid. This is arranged automatically, but you can customize it ifyou wish. Each rectangular space in the grid is called a viewport . You can move aview to a different viewport by dragging its name tab (show me ), but you cannotmove it outside the OMEGASCOPE™ window. You can also put more than one view ina viewport, by dragging a view and dropping it on top of another.
For further options, right-click on a view to obtain the View menu , or select Viewfrom the Menu bar , then select one of the menu options to arrange the views.
174 13
40
174
174
174 139
40
31

OMEGASCOPE™ User's Guide 13
M5064
5.5 Scope viewA scope view shows the data captured from the scope as a graph of signal amplitudeagainst time. (See Oscilloscope basics for more on these concepts.)OMEGASCOPE™ opens with a single view, but you can add more views by using the views menu . Similar to the screen of a conventional oscilloscope, a scope viewshows you one or more waveforms with a common horizontal time axis, with signallevel shown on one or more vertical axes. Each view can have as many waveforms asthe scope device has channels. Click on one of the labels below to learn more about afeature.
Scope views are available regardless of which mode - scope mode or spectrummode - is active.
7
40
10
10

OMEGASCOPE™ and oscilloscope primer14
M5064
5.6 XY viewAn XY view, in its simplest form, shows a graph of one channel plotted againstanother. XY mode is useful for showing phase relationships between periodic signals(using Lissajous figures) and for plotting I-V (current-voltage) characteristics ofelectronic components.
In the example above, two different periodic signals have been fed into the two inputchannels. The smooth curvature of the trace tells us that the inputs are roughly orexactly sine waves. The three loops in the trace show that Channel B has about threetimes the frequency of Channel A. We can tell that the ratio is not exactly threebecause the trace is slowly rotating, although you cannot see that in this staticpicture. Since an XY view has no time axis, it tells us nothing about the absolutefrequencies of the signals. To measure frequency, we need to open a Scope view .
How to create an XY view
There are two ways to create an XY view.
Use the Add View > XY command on the Views menu . This adds a new XY viewto the OMEGASCOPE™ window without altering the original scope or spectrum
view or views. It automatically chooses the two most suitable channels to placeon the X and Y axes. Optionally, you can change the X axis channel assignmentusing the X-Axis command (see below).
Use the X-Axis command on the Views menu . This converts the current scopeview into an XY view. It maintains the existing Y axes and allows you to choose anyavailable channel for the X axis. With this method, you can even assign a mathchannel or a reference waveform to the X axis.
13
40
13
16
40
25 26

OMEGASCOPE™ User's Guide 15
M5064
5.7 Trigger markerThe trigger marker shows the level and timing of the trigger point.
The height of the marker on the vertical axis shows the level at which the trigger isset, and its position on the time axis shows the time at which it occurs.
You can move the trigger marker by dragging it with the mouse or, for more accuratecontrol, by using the buttons on the Triggering toolbar .
Other forms of trigger marker
If the scope view is zoomed and panned so that the trigger point is off the screen, theoff-screen trigger marker (shown above) appears at the side of the graticule toindicate the trigger level.
In post-trigger delay mode, the trigger marker is temporarily replaced by the post-trigger arrow while you adjust the post-trigger delay.
When some advanced trigger types are in use, the trigger marker changes to awindow marker, which shows the upper and lower trigger thresholds.
For more information, see the section on Trigger timing .
5.8 Post-trigger arrowThe post-trigger arrow is a modified form of the trigger marker that appearstemporarily on a scope view while you are setting up a post-trigger delay, ordragging the trigger marker after setting up a post-trigger delay. (What is a post-trigger delay? )
The left-hand end of the arrow indicates the trigger point, and is aligned with zero onthe time axis. If zero on the time axis is outside the scope view, then the left-handend of the post-trigger arrow appears like this:
127
15
130
163
15
13
164
13

OMEGASCOPE™ and oscilloscope primer16
M5064
The right-hand end of the arrow (temporarily replacing the trigger marker )indicates the trigger reference point.
Use the buttons on the Triggering toolbar to set up a post-trigger delay.
5.9 Spectrum viewA spectrum view is one view of the data from a scope device. A spectrum is adiagram of signal level on a vertical axis plotted against frequency on the horizontalaxis. OMEGASCOPE™ opens with a scope view, but you can add a spectrum view byusing the views menu . Similar to the screen of a conventional spectrum analyser, aspectrum view shows you one or more spectra with a common frequency axis. Eachview can have as many spectra as the scope device has channels. Click on one of thelabels below to learn more about a feature.
Unlike in the scope view, in the spectrum view the data is not clipped at the limits ofthe range displayed on the vertical axis, so you can apply axis scaling or offset to seemore data. Vertical axis labels are not provided for data outside what is considered tobe the 'useful' range, but rulers will still work outside this range.
Spectrum views are available regardless of which mode - Scope Mode or SpectrumMode - is active.
For more information, see: How to set up the spectrum view and SpectrumOptions dialog.
15
127
40
10
10
145
114

OMEGASCOPE™ User's Guide 17
M5064
5.10 Persistence modePersistence mode superimposes multiple waveforms on the same view, with morefrequent data or newer waveforms drawn in brighter colors than older ones. This isuseful for spotting glitches, when you need to see a rare fault event hidden in a seriesof repeated normal events.
Enable persistence mode by clicking the Persistence Mode button on theCapture Setup toolbar . With the persistence options set at their defaultvalues, the screen will look something like this:
The colors indicate the frequency of the data. Red is used for the highest-frequencydata, with yellow for intermediate frequencies and blue for the least frequent data. Inthe example above, the waveform spends most of its time in the red region, but noisecauses it to wander occasionally into the blue and yellow regions. These are thedefault colors, but you can change them using the Persistence Options dialog .
This example shows persistence mode in its most basic form. See the PersistenceOptions dialog for ways to modify the display to suit your application, and How tofind a glitch using persistence mode for a worked example.
112 116
116
116
146

OMEGASCOPE™ and oscilloscope primer18
M5064
5.11 Measurements tableA measurements table displays the results of automatic measurements. Each view
can have its own table, and you can add, delete or edit measurements from thistable.
Columnheading
Explanation
Name The name of the measurement that you selected in the AddMeasurement or Edit Measurement dialog. An "F" after thename indicates that the statistics for this measurement are filtered .
Span The section of the waveform or spectrum that you want to measure.This is 'Whole trace' by default.
Value The live value of the measurement, from the latest capture
Min The minimum value of the measurement since measuring began
Max The maximum value of the measurement since measuring began
Average The arithmetic mean of the measurements from the last n captures,where n is set in the General page of the Preferences dialog
StandardDeviation
The standard deviation of the measurements from the last ncaptures, where n is set in the General page of the Preferencesdialog
CaptureCount
The number of captures used to create the statistics above. This startsat 0 when triggering is enabled, and counts up to the number ofcaptures specified in the General page of the Preferences dialog.
To add, edit or delete measurements
See: Measurements toolbar .
To change the width of a measurement column
Drag the vertical separator between column headings to createthe column width you need, as shown opposite.
To change the update rate of the statistics
The statistics (Min, Max, Average, Standard Deviation) are based on the numberof captures shown in the Capture Count column. You can change the maximumcapture count using the Capture Size control in the General page of thePreferences dialog.
13
44 44
46
90 89
174
90 89
90 89
118
90
89

OMEGASCOPE™ User's Guide 19
M5064
5.12 Resolution enhancementResolution enhancement is a technique for increasing the effective verticalresolution of the scope at the expense of high-frequency detail. Selecting resolutionenhancement does not change the scope's sampling rate or the number of samplesavailable.
For this technique to work, the signal must contain a very small amount of Gaussiannoise, but for many practical applications this is generally taken care of by the scopeitself and the noise inherent in normal signals.
The resolution enhancement feature uses a flat moving-average filter. This acts as alow-pass filter with good step response characteristics and a very slow roll-off fromthe pass-band to the stop-band.
Some side-effects will be observed when using resolution enhancement. These arenormal and can be counteracted by reducing the amount of enhancement used,increasing the number of samples captured or changing the timebase. Trial and erroris usually the best way to find the optimum resolution enhancement for yourapplication. The side-effects include:
Widened and flattened impulses (spikes)Vertical edges (such as those of square waves) turned into straight-line slopesInversion of the signal (sometimes making it look as if the trigger point is on thewrong edge)A flat line (when there are not enough samples in the waveform)
Procedure
Click the Channel Options button in the Channel Setup toolbar .Use the Resolution Enhancement control in the Advanced Options menu toselect the effective number of bits, which can be equal to or greater than the vertical resolution of your scope device.
106
107
173

OMEGASCOPE™ and oscilloscope primer20
M5064
Quantifying Resolution Enhancement
The table below shows the size of the moving-average filter for each resolutionenhancement setting. A bigger filter size requires a higher sampling rate to representa given signal without significant side-effects (as detailed above).
Resolutionenhancement
e (bits)
Number ofvalues
n
0.5 2
1.0 4
1.5 8
2.0 16
2.5 32
3.0 64
3.5 128
4.0 256
Example. Your scope device is an OMSP-2205 (resolution = 8 bits). You have selectedan effective resolution of 9.5 bits. The resolution enhancement is therefore:
e = 9.5 - 8.0 = 1.5 bits.
The table shows that this is achieved using a moving average of:
n = 8 samples.
This number gives a guide to what sort of filtering effect the resolution enhancementwill have on the signal. The best way of seeing the actual low-pass filter effect is toadd a spectrum view and look at the shape of the noise floor (try dragging the y-axisupwards to see the noise more clearly).
5.13 Pointer tool tipThe pointer tool tip is a box that displays the horizontal and vertical axis values atthe mouse pointer location. It appears temporarily when you click the background ofa view .
Pointer tool tipin a scope view
174

OMEGASCOPE™ User's Guide 21
M5064
5.14 Signal rulersThe signal rulers (sometimes called cursors) help you measure absolute and relativesignal levels on a scope , XY or spectrum view .
In the scope view above, the two colored squares to the left of the vertical axis arethe ruler drag-handles for channel A. Drag one of these downwards from its restingposition in the top left corner, and a signal ruler (a horizontal dashed line) willextend from it.
Whenever one or more signal rulers is in use, the ruler legend appears. This is atable showing all of the signal ruler values. If you close the ruler legend using the Close button, all the rulers are deleted.
Signal rulers also work in spectrum and XY views.
Ruler tool tip
If you move the mouse pointer over one of the rulers, OMEGASCOPE™ displays a tooltip with the ruler number and the signal level of the ruler. You can see an exampleof this in the picture above.
13 14 16
13
23
16 14
174

OMEGASCOPE™ and oscilloscope primer22
M5064
5.15 Time rulersThe time rulers (sometimes called cursors) measure time on a scope view orfrequency on a spectrum view .
In the scope view above, the two white squares on the time axis are the time rulerhandles. When you drag these to the right from the bottom left corner, verticaldashed lines called time rulers appear. The rulers work in the same way on aspectrum view , but the ruler legend shows their horizontal positions in units offrequency rather than time.
Ruler tool tip
If you hold the mouse pointer over one of the rulers, as we did in the example above,OMEGASCOPE™ displays a tool tip with the ruler number and the time value of theruler.
Ruler legend
The table at the top of the view is the ruler legend. In this example, the table showsthat time ruler 1 is at 148.0 microseconds, ruler 2 is at 349.0 microseconds and thedifference between them is 201.0 microseconds. Clicking the Close button on theruler legend also deletes all the rulers.
Frequency legend
The frequency legend in the bottom right-hand corner of a scope view shows 1/ ,where is the difference between the two time rulers. The accuracy of this calculationdepends on the accuracy with which you have positioned the rulers. For greateraccuracy with periodic signals, use the frequency measurement function built in toOMEGASCOPE™.
13
16
13
16
158

OMEGASCOPE™ User's Guide 23
M5064
5.16 Ruler legendThe ruler legend is a box that displays the positions of all the rulers you haveplaced on the view . It appears automatically whenever you position a ruler on theview:
Editing
You can adjust the position of a ruler by editing any value in the first two columns. To
insert a Greek µ (the micro symbol, meaning one millionth or x 10-6), type the letter'u'.
Tracking rulers
When two rulers have been positioned on one channel, the Lock button appearsnext to that ruler in the ruler legend. Clicking this button causes the two rulers totrack each other: dragging one causes the other one to follow it, maintaining a fixed
separation. The button changes to when the rulers are locked.
TIP: To set up a pair of tracking rulers with a known distance between them, firstclick the Lock button, then edit the two values in the ruler legend so that the rulersare the desired distance apart.
See also: frequency legend .
5.17 Frequency legend
The frequency legend appears when you have placed two time rulers on a scopeview . It shows 1/ in hertz (the SI unit of frequency, equal to cycles per second),where is the time difference between the two rulers. You can use this to estimatethe frequency of a periodic waveform, but you will get more accurate results bycreating a frequency measurement using the Add Measurements button on theMeasurements toolbar .
For frequencies up to 1.666 kHz, the frequency legend can also show the frequency inRPM (revolutions per minute). The RPM display can be enabled or disabled in the Preferences > Options dialog .
21
174
23
22
13
118
99

OMEGASCOPE™ and oscilloscope primer24
M5064
5.18 Properties sheetThe Properties sheet is a summary of the settings that OMEGASCOPE™ is using. It isenabled using the Views > View Properties menu command, and appears to theright of the waveforms in the OMEGASCOPE™ window.
Window. The window functionapplied to the data before computingthe spectrum. This is selected in the Spectrum options dialog .
Time gate. The number of samplesthat OMEGASCOPE™ uses to compute aspectrum is equal to twice the numberof bins. This number of samples isexpressed as a time interval called thetime gate. It is measured from thestart of the capture.
5.19 Custom probesA probe is any connector, transducer or measuring device that you connect to aninput channel of your scope device . OMEGASCOPE™ has a built-in library ofcommon probe types, such as the x1 and x10 voltage probes used with mostoscilloscopes, but if your probe is not included in this list you can use the CustomProbes dialog to define a new one. Custom probes can have any voltage rangewithin the capabilities of the oscilloscope, display in any units, and have either linearor nonlinear characteristics.
Custom probe definitions are particularly useful when you wish to display the probe'soutput in units other than volts, or to apply linear or nonlinear corrections to the data.
162
114
174
48

OMEGASCOPE™ User's Guide 25
M5064
5.20 Maths channelsA maths channel is a mathematical function of one or more input signals. Thefunction can be as simple as "Invert A", replacing the Invert button on a conventionaloscilloscope, or a complex function that you define. It can be displayed in a scope ,XY or spectrum view in the same way as an input signal, and like an input signalit has its own measurement axis, scaling and offset button and color .OMEGASCOPE™ has a set of built-in math channels for the most important functions,including "A+B" (the sum of channels A and B) and "A-B" (the difference betweenchannels A and B). You can also define your own functions using the equation editor
, or load predefined maths channels from files .
The picture below is a three-step guide to using maths channels:
1. Tools > Maths Channels command. Click this to open the Maths Channelsdialog , shown at top right in the picture above.
2. Maths Channels dialog . This lists all the available maths channels. In theexample above, only the built-in functions are listed.
3. Maths channel. Once enabled, a maths channel appears in the selected scopeor spectrum view. You can change its scale and offset as with any otherchannel. In the example above, the new maths channel (bottom) is defined as A-B,the difference between input channels A (top) and B (middle).
You may occasionally see a flashing warning symbol like this- - at the bottom ofthe maths channel axis. This means that the channel cannot be displayed becausean input source is missing. For example, this occurs if you enable the A+B functionwhile channel B is set to Off.
13
14 16
140 70
67 65
47
63
63
13
16 140

OMEGASCOPE™ and oscilloscope primer26
M5064
5.21 Reference waveformsA reference waveform is a stored copy of an input signal. You can create one byright-clicking on the view, selecting the Reference Waveforms command andselecting which channel to copy. It can be displayed in a scope or spectrum view inthe same way as an input signal, and like an input signal it has its own measurementaxis, scaling and offset button and color .
For more control over Reference Waveforms, use the Reference Waveforms dialogas shown below.
1. Reference Waveforms button. Click this to open the Reference Waveformsdialog , shown on the right in the picture above.
2. Reference Waveforms dialog . This lists all the available input channels andreference waveforms. In the example above, input channels A and B are switchedon, so they appear in the Available section. The Library section is empty to beginwith.
3. Duplicate button. When you select an input channel or reference waveform andclick this button, the selected item is copied to the Library section.
4. Library section. This shows all your reference waveforms. Each one has a checkbox that controls whether or not the waveform appears on the display.
5. Reference waveform. Once enabled, a reference waveform appears in theselected scope or spectrum view. You can change its scale and offset aswith any other channel. In the example above, the new reference waveform(bottom) is a copy of channel A.
6. Axis control button. Opens an axis scaling dialog allowing you to adjust scale,offset and delay for this waveform.
140 74
73
73
13 16 140
109

OMEGASCOPE™ User's Guide 27
M5064
5.22 Serial decodingYou can use OMEGASCOPE™ to decode data from a serial bus such as I2C or CAN Bus.Unlike a conventional bus analyzer, OMEGASCOPE™ lets you see the high-resolutionelectrical waveform at the same time as the data. The data is integrated into thescope view, so there's no need to learn a new screen layout.
How to use Serial Decoding
1. Select the Tools > Serial Decoding menu command.
2. Complete the Serial Decoding dialog .
3. Choose to display the data In View, In Window , or both.
4. You can decode multiple channels in different formats simultaneously. Use theDecoding tab below the "In Window" data table (shown in the picture above) toselect which channel of data to display in the table.
47
75
78

OMEGASCOPE™ and oscilloscope primer28
M5064
5.23 Mask limit testingMask limit testing is a feature that tells you when a waveform or spectrum goesoutside a specified area, called a mask, drawn on the scope view or spectrum view
. OMEGASCOPE™ can draw the mask automatically by tracing a capturedwaveform, or you can draw it manually. Mask limit testing is useful for spottingintermittent errors during debugging, and for finding faulty units during productiontesting.
To begin, go to the main OMEGASCOPE™ menu and select Tools > Masks >Add Masks. This opens the Mask Library dialog . When you have selected, loadedor created a mask, the scope view will appear as follows:
(A) Mask Shows the allowed area (in white) and the disallowedarea (in blue). Right-clicking the mask area andselecting the Edit Mask command takes you to theEdit Mask dialog . You can change the mask colorswith the Tools > Preferences > Colors dialog; add, remove and save masks using the Masksmenu ; and hide and display masks using the Views> Masks menu .
(B) Failed waveforms If the waveform enters the disallowed area, it iscounted as a failure. The part of the waveform thatcaused the failure is highlighted, and persists on thedisplay until the capture is restarted.
(C) Measurements table The number of failures since the start of the currentscope run is shown in the Measurements table .You can clear the failure count by stopping andrestarting the capture using the Start/Stop button .The measurements table can display othermeasurements at the same time as the mask failurecount.
13
16
47 85
85
86
47 89 97
85
40
18
126
157
OMEGASCOPE™ User's Guide 29
M5064
5.24 AlarmsAlarms are actions that OMEGASCOPE™ can be programmed to execute when certainevents occur. Use the Tools > Alarms command to open the Alarms dialog ,which configures this function.
The events that can trigger an alarm are:
Capture - when the oscilloscope has captured a complete waveform or block ofwaveforms.Buffers Full - when the waveform buffer becomes full.Mask(s) Fail - when a waveform fails a mask limit test .
The actions that OMEGASCOPE™ can execute are:
BeepPlay SoundStop CaptureRestart CaptureRun ExecutableSave Current BufferSave All Buffers
See Alarms dialog for more details.
83
10
105
28
83

OMEGASCOPE™ and oscilloscope primer30
M5064
5.25 Buffer NavigatorThe OMEGASCOPE™ waveform buffer can hold up to 10,000 waveforms, subject to theamount of available memory in the oscilloscope. The Buffer Navigator helps you toscroll through the buffer quickly to find the waveform you want.
To begin, click the Buffer Navigator button in the Buffer Navigation toolbar. This opens the Buffer Navigator window:
Click on any one of the visible waveforms to bring it to the front of the navigator forcloser inspection, or use the controls:
Buffers to show If any of the channels has a mask applied, then you canselect the channel from this list. The Buffer Navigator willthen show only the waveforms that failed the mask test on thatchannel.
Start: Scroll to waveform number 1.
Backward: Scroll to the next waveform on the left.
Zoom in:
Change the scale of the waveforms in the Buffer Navigatorview. There are three zoom levels: Large: default view. One waveform fills the height of thewindow.Medium: a medium-sized waveform above a row of smallwaveforms.Small: a grid of small waveforms. Click on the top or bottomrow of images to scroll the grid up or down.
Zoom out:
Forward: Scroll to the next waveform on the right.
End:
Scroll to the last waveform in the buffer. (The number ofwaveforms depends on the Tools > Preferences > General > Maximum Waveforms setting and on the type ofscope connected.)
Click anywhere on the main OMEGASCOPE™ window to close the Buffer Navigatorwindow.
105
28
47 89
90

OMEGASCOPE™ User's Guide 31
M5064
6 MenusMenus are the quickest way to get to OMEGASCOPE™'s main features. The Menu baris always present at the top of the OMEGASCOPE™ main window, just below thewindow's title bar. You can click any of the menu items, or press the Alt key and thennavigate to the menu using the arrow keys, or press the Alt key followed by theunderlined letter in one of the menu items.
The list of items in the menu bar may vary depending on the windows that you haveopen in OMEGASCOPE™.

Menus32
M5064
6.1 File menuLocation: Menu bar > File
Purpose: gives access to file input and output operations
Connect Device. This command appears only when there is no scope deviceconnected. It opens the Connect Device dialog , which allows you to selectthe scope device you wish to use.
Open. Allows you to select the file you want to open. OMEGASCOPE™ canopen .psdata and .psd files, which contain both waveform data and scope
device settings, and .pssettings and .pss files, which contain only scope
device settings. You can create your own files using the Save and SaveAs... commands, described below. If the file was saved using a differentscope device from the one that is presently connected, OMEGASCOPE™ mayneed to modify the saved settings to suit the present device.
Hint: Use the Page Up and Page Down keys to cycle through all thewaveform files in the same directory.
Save All Waveforms. Saves all waveforms using the filename shown in thetitle bar.
Save All Waveforms As. Opens the Save As dialog , which allows you tosave the settings, waveforms, custom probes and math channels for all views in various formats. Only the waveforms for the mode currently inuse (Scope Mode or Spectrum Mode ) will be saved.
Save Current Waveform As. Opens the Save As dialog , which allowsyou to save the settings, waveforms, custom probes and math channels forall views in various formats. Only the waveforms for the mode currently inuse (Scope Mode or Spectrum Mode ) will be saved.
In persistence mode , this command is called Save Persistence As andsaves only the data for this mode.
Startup Settings. Opens the Startup Settings menu.
Print Preview. Opens the Print Preview window, which allows you to seehow your workspace will be printed when you select the Print command.
31
101
33
12
112 112
33
112 112
17
38

OMEGASCOPE™ User's Guide 33
M5064
Print. Opens a standard Windows Print dialog, which allows you to choose aprinter, set printing options and then print the selected view.
Recent Files. A list of recently opened or saved files. This list is compiledautomatically, but you can clear it using the Files page of the Preferencesdialog.
Exit. Close OMEGASCOPE™ without saving any data.
6.1.1 Save As dialogLocation: Menu bar > File > Save All Waveforms As or Save Current
Waveform As
Purpose: allows you to save your waveforms and settings (including customprobes and active math channels) to a file in various formats
Type your chosen file name in the File name box, and then select a file format in theSave as type box. You can save data in the following formats:
Data files (.psdata) Stores waveforms and settings from thecurrent scope device. Can be opened on anycomputer running OMEGASCOPE™.
Settings files (.pssettings) Stores all settings (but not waveforms) fromthe current scope device. Can be opened onany computer running OMEGASCOPE™.
89
31 32
35

Menus34
M5064
CSV (Comma delimited) files (.csv) Stores waveforms as a text file with comma-separated values. This format is suitable forimporting into spreadsheets such as MicrosoftExcel. The first value on each line is the timestamp, and it is followed by one value foreach active channel, including currentlydisplayed math channels. (Details)
Text (Tab delimited) files (.txt) Stores waveforms as a text file with tab-separated values. The values are the same asthose in the CSV format. (Details)
Bitmap images (.bmp) Stores a picture of the waveforms, graticule and rulers in Windows BMP format. The
image is 800 pixels wide by 600 pixels high,in 16 million colors, and uncompressed. BMPfiles are suitable for importing into Windowsdesktop-publishing programs.
GIF images (.gif) Stores the waveforms, graticule and rulers in Compuserve GIF format. The image is
800 pixels wide by 600 pixels high, in 256colors, and compressed. GIF files are widelyused to illustrate web pages.
Animated GIF image (*.gif) Creates an animated GIF that displays all ofthe waveforms in the buffer in sequence.Each waveform is formatted as in the singleGIF format described above.
PNG images (.png) Stores the graticule , rulers andwaveforms in Portable Network Graphicsformat. The image is 800 pixels wide by 600pixels high, in 16 million colors, andcompressed.
Matlab 4 files (.mat) Stores the waveform data in Matlab 4 format.
35
35
173 174
173
174
173 174
36

OMEGASCOPE™ User's Guide 35
M5064
6.1.1.1 File formats for exported data
OMEGASCOPE™ can export raw data in either text or binary format: -
Text-based file formats
Easy to read without special toolsCan be imported into standard spreadsheet applicationsFiles are very large if there are many samples in the data (so files are limited toabout 1 million values per channel)
Text file format details
Binary file format
Files remain relatively small and can even be compressed in some situations (thismeans that the amount of saved data is unlimited)Either a special application is required to read the files or the user must write aprogram to read the data from the file
If you need to save more than 64 K values per channel, then you must use a binary
file format such as the Matlab® MAT-file format.
Binary file format details
Data types for storing OMEGASCOPE™ data
Regardless of whether the data types were loaded from a binary file or from a text-based file, we recommend the following data formats for storing the values loadedfrom a OMEGASCOPE™ data file: -
Sampled data (such as voltages) should use 32-bit single-precision floating-pointdata types.Times should use 64-bit double-precision floating-point data types.
6.1.1.1.1 Text formats
Text-format files exported by OMEGASCOPE™ are encoded in UTF-8 format bydefault. This is a popular format which is capable of representing a huge range ofcharacters, whilst still retaining some compatibility with the ASCII character set if onlystandard Western European characters and numbers are used in the file.
CSV (comma-separated values)
CSV files store data in the following format: -
Time, Channel A, Channel B(µs), (V), (V)-500.004, 5.511, 1.215-500.002, 4.724, 2.130-500, 5.552, 2.212…
There is a comma after each value on a line to represent a column of data and acarriage return at the end of the line to represent a new row of data. The 1 millionvalues per channel limit prevents excessively large files being created.
35
36
35

Menus36
M5064
Note. CSV files are not the best choice of format if you are working in a language thatuses the comma character as the decimal point. Instead, try using the tab-delimitedformat which works in almost the same way.
Tab-delimited
Tab-delimited files store data in the following format: -
Time(µs)
Channel A(V)
Channel B(V)
500.004 5.511 1.215-500.002 4.724 2.130-500 5.552 2.212…
The files have a tab character after each value on a line to represent a column of dataand a carriage return at the end of the line to represent a new row of data. These fileswork in any language and are a good choice for sharing data internationally. The 1million values per channel limit prevents excessively large files being created.
6.1.1.1.2 Binary formats
OMEGASCOPE™ can export data in version 4 of the .mat binary file format.This is an open format and the full specification is freely available from the www.mathworks.com website. OMEGASCOPE™ saves data into the MAT-File format ina specific way, which is detailed below.
Importing into Matlab
Load the file into your workspace using this syntax: -
load myfile
Each channel’s data is stored in an array variable named by the channel. So, thesampled data for channels A to D would be in four arrays named A, B, C and D.
There is only one set of time data for all channels and this is loaded in one of twopossible formats:
1. A start time, an interval and a length. The variables are named Tstart, Tintervaland Length.
2. An array of times (sometimes used for ETS data). The time array is named T.
If the times are loaded in as Tstart, Tinterval and Length then you can use thefollowing command to create the equivalent array of times: -
T = [Tstart : Tinterval : Tstart + (Length – 1) * Tinterval];
Exploring the file format
The full file specification, available from www.mathworks.com, is comprehensive sothis guide does not describe the entire format. Instead, this guide describes enough ofthe format to allow you to get data from the file and use it in your own program.
The variables described above (under Importing into Matlab ) are stored in a seriesof data blocks, each preceded by a header. Each variable has its own header and datablock and the corresponding variable names are stored with them (such as A, B,Tstart). The following sections describe how to read each variable from the file.
35
36

OMEGASCOPE™ User's Guide 37
M5064
The order of the data blocks is not specified, so programs should look at the variablenames to decide which variable is currently being loaded.
The headerThe file consists of a number of data blocks preceded by 20-byte headers. Each headercontains five 32-bit integers (as described in the table below).
Bytes Value
0 – 3 Data format (0, 10 or 20)
4 – 7 Number of values
8 – 11 1
12 – 15 0
16 – 19 Name length
Data formatThe ‘Data format’ in the first 4-bytes describes the type of numerical data in the array.
Value Description
0 Double (64-bit floating point)
10 Single (32-bit floating point)
20 Integer (32-bit)
Number of valuesThe ‘Number of values’ is a 32-bit integer describing the number of numerical valuesin the array. This value may be 1 for variables that only describe one value; but forarrays of samples or times, expect this to be a large number.
Name lengthThe ‘Name length’ is the length of the name of the variable as a null-terminated 1-byte per character ASCII string. The last null terminating character (‘\0’) is included inthe ‘Name length’ so if the variable name is “TStart” (same as ‘TStart\0’) then thename length will be 7.
The data blockThe data block begins with the name of the variable (such as A, Tinterval) and youshould read in the number of bytes described by the ‘Name length’ part of the header(not forgetting that the last byte in the string is ‘\0’ if your programming languageneeds to take account of this).
The remaining part of the data block is the actual data itself, so read in the number ofvalues described in the ‘Number of values’ part of the header. Remember to takeaccount of the size of each value as described in the ‘Data format’ part of the header.
Channel data such as voltages, in variables such as A and B, are stored as 32-bitsingle-precision floating-point data types. Times such as Tstart, Tinterval and T arestored as 64-bit double-precision floating-point data types. Length is stored as a 32-bit integer.

Menus38
M5064
6.1.2 Startup Settings menuLocation: Menu bar > File > Startup Settings
Purpose: allows you to load, save and restore the OMEGASCOPE™ startupsettings
Save Startup Settings. Saves your current settings ready for when younext select Load Startup Settings. These settings are remembered fromone session of OMEGASCOPE™ to the next.
Load Startup Settings. Returns to the settings you created with the SaveStartup Settings command.
Reset Startup Settings. Deletes the startup settings you created with theSave Startup Settings command, and restores the installation defaultsettings.
6.2 Edit menuLocation: Menu bar > Edit
Purpose: gives access to the clipboard-related and note editing functions
Copy as Image. Copies the active view to the clipboard as a bitmap. Youcan then paste the image into any application that accepts bitmap images.
Copy as Text. Copies the data in the active view to the clipboard as text.You can paste the data into a spreadsheet or other application. The textformat is the same as that used by the Save As dialog when you selectthe .txt format.
Copy Entire Window as Image. This copies a picture of theOMEGASCOPE™ window to the clipboard, and is equivalent to pressing Alt-PrtScn on a full-size keyboard. You can then paste the picture into anyapplication that can display pictures, such as a word processor or desktoppublishing program.
Notes. Opens a Notes area at the bottom of the OMEGASCOPE™ window.You can type or paste your own notes in this area.
31 32
31
33
39

OMEGASCOPE™ User's Guide 39
M5064
6.2.1 Notes areaLocation: Menu bar > Edit > Notes
Purpose: a text box for typing your own notes
A Notes area can be displayed at the bottom of the OMEGASCOPE™ window. You canenter any text you wish in this area. You can also copy text from another program andpaste it here.
31 38

Menus40
M5064
6.3 Views menuLocation: Menu bar > Views, or right-click
on a view
Purpose: controls the layout of the current view, which is a rectangular area of the
OMEGASCOPE™ window that displayscope, spectrum or other kinds of data
The contents of the Views menu may varydepending on where you click and how many viewsare open. If the current view contains a Measurements table , a combined Measurementsmenu and Views menu will appear.
Add View: Add a view of the selected type (scope , XY or spectrum). In automatic grid layout mode (the default),
OMEGASCOPE™ rearranges the grid to make room for thenew view, up to a limit of four views. Any further views willbe added as tabs in existing viewports . If you haveselected a fixed grid layout, OMEGASCOPE™ will not changeit.
Rename View: Change the standard 'Scope' or 'Spectrum' label to a title ofyour choice.
Close View: Remove a view from the OMEGASCOPE™ window. Inautomatic grid layout mode (the default), OMEGASCOPE™rearranges the grid to make the best use of the remainingspace. In fixed grid layout mode (if you have selected a gridfixed layout), OMEGASCOPE™ will not change the grid.
Channels: Select which channels are visible in the current view. Eachview, when created, shows all the input channels, but youcan switch them on and off using this command. Only theinput channels that are enabled (not set to "Off" in the Channel Setup Toolbar ) are available for viewing. TheChannels menu also list math channels . You can selectup to 8 channels in any view.
31
174
174
18
43
13 14
16
174
106
25

OMEGASCOPE™ User's Guide 41
M5064
X-Axis: Select any suitable channel to drive the X axis. By default,the X axis represents time. If you select an input channelinstead, the scope view will become an XY view that plotsone input against another. A quicker way to create an XYview is to use the Add View command (see above).
Grid Layout: The grid layout defaults to "Automatic" mode, in whichOMEGASCOPE™ automatically arranges views in a grid. Youcan also select one of the standard grid layouts or create acustom layout, which OMEGASCOPE™ will preserve as youadd or remove views.
Arrange Grid Layout: Adjust the grid layout to fit the number of views. Moves anytabbed views to empty viewports. Overrides any previouschoice of grid layout.
Reset View Sizes: If you have resized any of the views by dragging the verticalor horizontal separator bars between viewports, this optionresets all the viewports to their original sizes.
Move View To: Move a view to a specified viewport. You can achieve thesame effect by dragging the view by its name tab anddropping it in a new viewport. See How to move a view .
Auto-arrange Axes: Scale and offsets all traces to fill the view and avoidoverlaps.
Reset View Layout: Reset the scale factor and offset of the selected view to theirdefault values.
Arrange views: If multiple views are stacked in the same viewport, movethem into their own viewports.
View Properties: Show the Properties sheet , which lists scope settings thatare normally hidden.
Reference Waveforms:Create a new Reference Waveform by copying one of theavailable channels, and add it to the view. To edit or removea waveform, use the Tools > Reference Waveforms menucommand.
Masks: Select which masks (see Mask Limit Testing ) are visible.
14
139
24
26
73
28

Menus42
M5064
6.3.1 Custom grid layout dialogLocation: right-click on view > Views menu > Grid Layout > Custom
layout... Menu bar > View
Purpose: if the Grid Layout section of the Views menu does not contain thelayout you want, this dialog gives further options
You can lay out the view grid with any number of rows and columns up to 4 by 4.You can then drag the views to different locations in the grid.
40
31
40
174

OMEGASCOPE™ User's Guide 43
M5064
6.4 Measurements menuLocation: Menu bar > Measurements
Purpose: controls the Measurements table
Add measurement. Adds a row to the measurements table , andopens the Edit Measurement Dialog . You can also find this button onthe Measurements toolbar .
Edit measurement. This takes you to the Edit Measurement Dialog .You can find this button on the Measurements toolbar , or you can edita measurement by double-clicking on a row of the measurements Table
.
Delete measurement. Removes the selected row from themeasurements table . You can also find this button on theMeasurements toolbar .
Grid font size. Sets the font size for the entries in the measurementstable .
Column Auto-width. If this button is pressed, the columns of themeasurements table will continually adjust to fit the contentswhenever the table changes. Click again to release the button.
31
18
18
44
118
44
118
18
18
118
18
18

Menus44
M5064
6.4.1 Add / Edit Measurement dialogLocation: Measurements toolbar > Add Measurement or Edit
Measurement button
Views menu > Add Measurement or Edit MeasurementbuttonDouble-click a measurement in the measurements table
Purpose: allows you to add a measurement of a waveform to the selected view, or edit an existing measurement
OMEGASCOPE™ automatically refreshes the measurement every time it updates thewaveform. If this is the first measurement for the view, OMEGASCOPE™ will create anew measurements table to display the measurement; otherwise, it will add thenew measurement to the bottom of the existing table.
Channel Which of the scope device's channels to measure.
Type OMEGASCOPE™ can calculate a wide range of measurements forwaveforms. See Measurement Types for details.
Section Measure the whole trace, just the section between rulers , or,where appropriate, a single cycle marked by one of the rulers.
Advanced Gives access to advanced measurement settings .
118
40
18
174
18
174
157
174
45

OMEGASCOPE™ User's Guide 45
M5064
6.4.2 Advanced measurement settingsLocation: Add Measurement or Edit Measurement dialog > Advanced
Purpose: adjust parameters of certain measurements such as filtering and spectrum analysis
Threshold Some measurements, such as Rise Time and Fall Time, canbe made using different thresholds. Select the appropriateones here. When comparing rise and fall times withmanufacturers' specifications, it is important to use the samethresholds for all measurements.
Spectrum Span When measuring peak-related parameters such as 'Frequency at Peak' in a spectrum view ,OMEGASCOPE™ can search for a peak near to the specified ruler location. This option tells OMEGASCOPE™ how manyfrequency bins to search. The default is 5, which tellOMEGASCOPE™ to search from 2 bins below to 2 bins abovethe ruler frequency, giving a total range of 5 bins includingthe ruler frequency.
44
16
159 16
22

Menus46
M5064
Filter control OMEGASCOPE™ can low-pass filter the statistics to producemore stable and more accurate numbers. Filtering is notavailable on all measurement types.Enable Filter - check to enable low-pass filtering, ifavailable. An "F" will appear after the measurement name inthe measurements table .Automatic - check to set the low-pass filter characteristicsautomatically
Cutoff Frequency The filter cut-off frequency normalised to the measurementrate. Range: 0 to 0.5.
Filter Size The number of samples used to construct the filter
Harmonic Control These options apply to distortion measurements in spectrumviews . You can specify which harmonics OMEGASCOPE™uses for these measurements.
Highest Harmonic The highest harmonic to include when calculating distortionpower
Search Range The number of frequency bins to search, centred on theexpected frequency, when looking for a harmonic peak
Harmonic Noise Floor The level in dB above which signal peaks will be counted asharmonics
18
16

OMEGASCOPE™ User's Guide 47
M5064
6.5 Tools menuLocation: Menu bar > Tools
Purpose: gives access to assorted tools for signal analysis
Custom Probes : Define new probes and copy, delete, move and editexisting ones.
Maths Channels : Add or edit a channel that is a mathematical functionof one or more other channels.
Reference Waveforms : Create, load or save a channel as a copy of anexisting channel.
Serial Decoding : Decode and display the contents of serial data streamsuch as CAN bus.
Alarms : Specify actions to be taken on certain events.
Masks : Perform mask limit testing on a waveform. This detect whenthe waveform departs from a specified shape.
Macro Recorder : Save a frequently-used sequence of operations.
Preferences : Set various options that control OMEGASCOPE™'sbehaviour.
31
24
25
26
27
29
28 28
88
89

Menus48
M5064
6.5.1 Custom Probes dialogLocation: Tools > Custom Probes, or click the Channel Options button (
)
Purpose: allows you to select predefined probes and set up custom probes
The selection of probes shown may vary depending on the version of theOMEGASCOPE™ software that you are using.
Understanding the probe list
All the probes that OMEGASCOPE™ knows about are listed under three mainheadings: Built-in, Library and Loaded. The probe list is preserved betweensessions, so that OMEGASCOPE™ will never forget your custom probes unless youdelete them.
Built-in probes. The built-in probes are supplied by Omega Engineering, Inc. anddo not change unless you download an authorized update from us. As a safeguard,OMEGASCOPE™ does not allow you to edit or delete these probes. If you want tomodify one of them, you can copy it to your library by clicking Duplicate, and thenedit the copy in your library.Library probes. These are the probes that you have created using any of themethods described in this topic. You can edit, delete or duplicate any of theseprobes by clicking the appropriate button in this dialog.Loaded probes. Probes in OMEGASCOPE™ data files (.psdata) or settings files
(.pssettings) that you have opened appear here until you copy them to your
library. You cannot edit or delete these probes directly, but you can click Duplicateto copy them to your library where you can edit them.
47
24

OMEGASCOPE™ User's Guide 49
M5064
Adding a new probe to your library
There are three ways to create a new probe:
1. Use the Duplicate button as described above.
2. Click New Probe... to define a new probe.
3. Click Import to load a probe definition from a *.psprobe file and add it to your
library. These files are normally supplied, but you can also create your own bydefining a new probe and then clicking Export.
Methods 2 and 3 open the Custom Probe Wizard to guide you through the probedefinition process.
50

Menus50
M5064
6.5.1.1 Custom Probe wizard
Location: Custom Probes dialog > New Probe
Purpose: allows you to define custom probes and set up custom ranges
The first dialog in the series is either the Create a new Custom Probe dialog or theEdit an existing Custom Probe dialog .
6.5.1.1.1 Create New Custom Probe dialog
Location: Custom Probes dialog > New Probe
Purpose: introduces you to the process for creating a new custom probe
How to use the dialog
Click Next to continue to the Probe Output Units dialog .
48
24
50
51
48
52

OMEGASCOPE™ User's Guide 51
M5064
6.5.1.1.2 Edit Existing Custom Probe dialog
Location: Custom Probes dialog > Edit
Purpose: introduces you to the process for editing an existing custom probe
How to use the dialog
Click Next to continue to the Probe Output Units dialog , where you can edit thecustom probe.
Click Jump forward... if you have already set up the custom probe's basiccharacteristics and want to add or change a custom range manually.
48
24
52

Menus52
M5064
6.5.1.1.3 Probe Output Units dialog
Location: Create new Custom Probe dialog > Next
Purpose: allows you to choose the units that OMEGASCOPE™ will use to displaythe output of your custom probe
How to use the dialog
To choose a standard SI unit, click Use a standard unit from the list and selectone from the list.To enter a custom unit, click Use the custom unit defined below and type theunit name and symbol.
Click Next to continue to the Scaling Method dialog .Click Back to return to the Create New Custom Probe dialog if this is a newprobe, or the Edit Existing Custom Probe dialog if this is an existing probe.
50
24
53
50
51

OMEGASCOPE™ User's Guide 53
M5064
6.5.1.1.4 Scaling Method dialog
Location: Probe Output Units dialog > Next
Purpose: allows you to define the characteristic that OMEGASCOPE™ will use toconvert the custom probe 's voltage output to a measurement on thedisplay
How to use the dialog
If you do not require any scaling or offset, click the Don't apply any scalingbutton.
If the probe requires linear scaling, click the Use a linear equation button andenter the gradient (or scale factor) m and the offset c in the equation y = mx + c,where y is the displayed value and x is the probe's voltage output.
If you wish to apply a nonlinear function to the probe's output, choose Use a look-up table..., then click the Create a Lookup Table... button to create a newlookup table. This will take you to the Lookup-table Scaling dialog .
Click Next to continue to the Range Management dialog .Click Back to return to the Probe Output Units dialog .
52
24
54
55
52

Menus54
M5064
6.5.1.1.4.1 Lookup-table Scaling dialog
Location: Scaling Method dialog > Create a Look-up Table or Edit theLookup Table...
Purpose: creates a look-up table to calibrate a custom probe
Editing the Look-up Table
First, select suitable values in the Input units and Scaled units drop-down boxes.For example, if your probe is a current clamp that outputs one millivolt per ampereover the range -600 to +600 amperes, select Input units of millivolts and Outputunits of amperes.
Next, enter some data in the scaling table. Click the first empty cell at the top of thetable and type "-600", then hit the Tab key and type "-600". When you are ready toenter the next pair of values, press the Tab key again to start a new row. You can alsoright-click on the table to obtain a more detailed menu of options, as shown in thepicture. In the example above, we have entered a slightly nonlinear response; if theresponse had been linear then it would have been easier to use the linear option inthe Scaling Method Dialog .
Import/Export
Using the Import and Export buttons, you can fill the look-up table from data in acomma-separated or tab-delimited text file, and save the look-up table to new file.
Finishing
Clicking OK or Cancel will return you to the Scaling Method dialog .
53
24
53
53

OMEGASCOPE™ User's Guide 55
M5064
6.5.1.1.5 Range Management dialog
Location: Scaling Method dialog > Next
Purpose: allows you to override OMEGASCOPE™'s automatic range-creationfeature for custom probes. In most cases, the automatic procedure willbe sufficient.
How to use the dialog
If you select Let the software manage my ranges for me automatically, thenclicking Next will take you to the Custom Probe Identification dialog .OMEGASCOPE™'s automatic ranges should be ideal for most applications.
If you select I will manage the Custom Probe Ranges manually, clicking Nextwill take you to the Manual Ranges Setup dialog .
Click Back to return to the Scaling Method dialog .
What is Auto-ranging?
When the Auto-ranging function is selected, OMEGASCOPE™ continually monitorsthe input signal and adjusts the range when necessary to allow it to display the signalwith maximum resolution. This function is available on all standard ranges, and can beused with custom ranges only if you select Let the software manage my rangesfor me automatically in this dialog.
53
61
56
53

Menus56
M5064
6.5.1.1.6 Manual Ranges Setup dialog
Location: Range Management dialog > Advanced > Next
Purpose: creates ranges manually for your custom probe
How to use the dialog
If you wish, you can click Auto Generate Ranges and the program will create anumber of ranges for the selected device. This will create the same list of ranges thatyou would have obtained by selecting Let the software manage my ranges for meautomatically in the previous dialog. When you select a range, a diagram below thelist will show its relationship to the scope device's input range — this is explainedfurther under Edit range dialog . You can then edit the ranges by clicking Edit, oryou can also add a new range by clicking New Range. Both of these buttons take youto the Edit Range dialog .
Click Next to continue to the Filter Method dialog .
Click Back to return to the Range Management dialog .
How to use a new custom range
After you have createda custom range, it willappear in the drop-down list of ranges inthe channels toolbar,like this:
55
24
57
57
60
55
106

OMEGASCOPE™ User's Guide 57
M5064
6.5.1.1.6.1 Edit Range dialog
Location: Manual Ranges Setup dialog > Edit or New Range
Purpose: editing a manual range for a custom probe
Automatic mode
If you leave the "Automatic" radio button pressed, the program will automaticallydetermine the best hardware input range for the device as you change the Scaledrange limits. This is the best mode to use for almost all ranges. You should set theScaled range limits to the maximum and minimum values you wish to see on thevertical axis of the scope display.
Fixed range mode
If you press the "Hardware input range" radio button and select a hardware inputrange from the drop-down box, OMEGASCOPE™ will then use that hardware inputrange whatever scaled range limits you choose. Set the upper and lower scaled rangelimits to the limits you wish to appear at the top and bottom of the vertical axis inOMEGASCOPE™'s scope view.
What is an input range?
An input range is the signal range, usually in volts, on the input channel of the scopedevice . Your scaled range should match this as closely as possible to make themost of the scope's resolution.
What is a scaled range?
The scaled range is the range that will appear on the vertical axis of the scope displaywhen the probe is selected.
The scaling that you chose on the Scaling Method page defines the relationshipbetween the input range and the scaled range. This dialog enables you to set upranges to display the scaled data on the scope view.
56
24
13
174
53

Menus58
M5064
The range utilisation bar
This diagram at the bottom of the dialog shows how well the input range of the deviceis matched to the scaled range.
• Green - The section of the input range that is used by the scaled range. Thisshould be as large as possible, to maximise the use of the scope device'sresolution.
• Blue - Areas of the input range that are not being used. These indicate wastedresolution.
• Grey - Parts of the scaled range that are not covered by the input range. Thesewill result in wasted space on the graph. The range utilisation bar may notrepresent these areas accurately when non-linear scaling is being used, so youshould always test the scaled range limits on the scope view.
Advanced tab
FinishingClicking OK or Cancel will return you to the Manual Ranges Setup dialog .56

OMEGASCOPE™ User's Guide 59
M5064
6.5.1.1.6.2 Edit Range dialog (Advanced tab)
Location: Manual Ranges Setup dialog > Edit or New Range > Advancedtab
Purpose: configuring advanced options for custom probes
These options are for factory use and we recommend that you do not change them.
Finishing
Clicking OK or Cancel will return you to the Manual Ranges Setup dialog .
56
24
56

Menus60
M5064
6.5.1.1.7 Filter Method dialog
Location: Manual Ranges Setup dialog > Next
Purpose: sets up lowpass filtering for this custom probe
This dialog has the same effect as manually enabling the Lowpass Filtering optionin the Channel Options dialog . Filtering will only occur if the attached scope devicesupports filtering.
Back: Go to the Manual Range Setup dialog
Next: Go to the Custom Probe Identification dialog
56
110
107
56
61

OMEGASCOPE™ User's Guide 61
M5064
6.5.1.1.8 Custom Probe Identification dialog
Location: Range Management dialog > Next
Purpose: entering text to identify the custom probe
How to use the dialog
Click Back to return to the Filter Method dialog .
The probe name will appear in the probe list.The description is not used in the present version of the software.
Fill in the text fields and click Next to continue to the Custom Probe Finished dialog.
55
24
60
62

Menus62
M5064
6.5.1.1.9 Custom Probe Finished dialog
Location: Custom Probe Identification dialog > Next
Purpose: signals the end of the custom probe setup procedure
How to use the dialog
Click Back to return to the Custom Probe Identification dialog .
Click Finish to accept your custom probe settings and return to the Custom Probesdialog .
61
24
61
48

OMEGASCOPE™ User's Guide 63
M5064
6.5.2 Maths Channels dialogLocation: Menu bar > Tools > Maths Channels
Purpose: creating , editing and controlling maths channels , which arevirtual channels generated by mathematical functions of input channels
Maths Channel list The main area of the Maths Channels dialog is the MathsChannel list, which shows all the built-in, library and loadedmaths channels . To choose whether or not a channel appearsin the main OMEGASCOPE™ window , click the appropriatecheck box and then OK. You can have up to 8 channels in anyview, including input channels and maths channels. If you try toenable a 9th channel, OMEGASCOPE™ will open a new view.
Built In: these maths channels are defined by OMEGASCOPE™and cannot be changed
Library: these are the maths channels that you define usingthe Create or Duplicate button, Edit, or load with the Importbutton
Loaded: these are the maths channels present in anyOMEGASCOPE™ settings or data files that you have loaded
Create Opens the Maths Channel Wizard , which guides youthrough the process of creating or editing a maths channel. Thenew channel will appear under "Library" in the Maths Channellist.
31 47 25
65 65 25
25
12
65

Menus64
M5064
Edit Opens the Maths Channel Wizard to allow you to edit theselected maths channel. You must first select a channel in the Library section of the Maths Channel list. If the channel youwant to edit is in the Built In or Loaded section, first copy it tothe Library section by clicking Duplicate, then select it andclick Edit.
Delete Permanently deletes the selected maths channel. Only mathschannels in the Library section can be deleted.
Duplicate Creates a copy of the selected maths channel. The copy is placedin the Library section, from where you can edit it by clickingEdit.
Import Opens a .psmaths math channel file and places the maths
channels it contains in the Library section.
Export Saves all maths channels from the Library section to a new.psmaths file.
65

OMEGASCOPE™ User's Guide 65
M5064
6.5.2.1 Maths Channel Wizard
Location: Channel Setup toolbar > Maths Channels button
Purpose: creating, editing and controlling maths channels, which are virtualchannels generated by mathematical functions of input channels
1. Introduction
2. Equation
3. Channel name
4. Units and range
5. Finished
106
66
67
70
71
72

Menus66
M5064
6.5.2.1.1 Maths Channel Wizard Introduction dialog
Location: Maths Channels dialog > Create (if you have not ticked the "Don'tshow me this introduction page again" check box)
Purpose: introduces the Maths Channel Wizard
63
65

OMEGASCOPE™ User's Guide 67
M5064
6.5.2.1.2 Maths Channel Wizard Equation dialog
Location: Maths Channel Wizard
Purpose: allows you to enter or edit the equation for a maths channel . You cantype directly into the equation box, or click the calculator buttons and
let the program insert the symbols for you. A red error indicator willappear to the right of the equation box if the equation contains a syntaxerror.
Basic view
Maths Channel Wizard Equation dialog, basic view
Basic buttons
Button Equationtext
Description
CE Clear equation. Clears the entire contents of the equation box.C Clear. Clears the single character to the left of the cursor.+ + Addition- - Subtraction or negation* * Multiplication/ / DivisionA...D A...D Channel A, B, C or D. If your scope has fewer than 4 channels
then the available channels are named sequentially starting fromA.
v Reference channels. Shows a drop-down list of available referencechannels to insert into the equation.
T T Time, in seconds(...) (...) Parentheses. Expressions within parentheses will be evaluated
before the expressions to either side.
65
25

Menus68
M5064
Advanced view
Clicking the Advanced button reveals more function buttons, including trigonometricfunctions and logarithms.
Maths Channel Wizard Equation dialog, advanced view
Advanced buttons
Button Equationtext
Description
sqrt sqrt() Square rootx^y ^ Raise x to the power of yln ln() Natural logarithmabs abs() Absolute valuenorm norm() Normalised value. OMEGASCOPE™ calculates the maximum and
minimum values of the argument over the period of the timebase,and then scales and offsets the argument so that it exactly fits therange [0, +1] units.
e^x exp() Exponentiation. Raise e, the base of the natural logarithm, to thepower of x.
log log() Base-10 logarithmPi Pi , the ratio of a circle's circumference to its diameter
inv Inverse. Modifies the sin, cos and tan buttons to asin, acos andatan respectively.
sin sin() Sine of the argument in radianscos cos() Cosine of the argument in radianstan tan() Tangent of the argument in radians0...9 0..9 The decimal digits. . Decimal pointE E Exponential notation. The number preceding the E is multiplied by
10 raised to the power of the number following the E.

OMEGASCOPE™ User's Guide 69
M5064
Advanced equation features
There are a few equation features that can be accessed only by editing the equationusing the keyboard.
Hyperbolic functions. You can enter the sinh(), cosh() and tanh() operators toobtain hyperbolic functions.
Reference waveforms. You can use a reference waveform as an input to an equationby typing its name in curly braces. For example, A - {A (2)} subtracts the referencewaveform A (2) from channel A. The name of the reference waveform must be typedexactly as it appears in the Reference Waveforms dialog , including any spaces.
Signum function. The sign() operator returns the sign of its input. The result is +1when the input is positive, -1 when the input is negative, and 0 when the input is 0.
73

Menus70
M5064
6.5.2.1.3 Maths Channel Wizard Name dialog
Location: Maths Channel Wizard
Purpose: allows you to enter or edit the name and color of a maths channel
OMEGASCOPE™ initially sets the name to the text of the equation, but you can edit itto anything you like. The name will appear in the channel list in the Maths Channelsdialog . You can set the color of the trace to one of the standard colors in the drop-down-list, or click Custom to choose any possible color allowed by Windows.
65
25
63

OMEGASCOPE™ User's Guide 71
M5064
6.5.2.1.4 Maths Channel Wizard Units and Range dialog
Location: Maths Channel Wizard
Purpose: allows you to specify the measurement units and the range of values todisplay for a maths channel
Units, Long Name: This is for your reference only.
Units, Short Name: This will be displayed on the measurement axis in scope andspectrum views, in the ruler legend and in the measurements table .
Range: If you leave the check box empty, OMEGASCOPE™ will choose the mostappropriate range for the measurement axis. If you prefer to set your own values forthe minimum and maximum extremes of the measurement axis, tick the check boxand enter them in the Min and Max boxes.
65
25
13
16 23 18

Menus72
M5064
6.5.2.1.5 Maths Channel Wizard Finished dialog
Location: Maths Channel Wizard
Purpose: shows you the settings for the maths channel that you have justcreated or edited
Back. Click this button to return to previous dialogs in the Maths Channel Wizard if you wish to change any of the settings.
Finish. Click this button to accept the settings shown and return to the MathsChannels dialog . If you want the new or edited channel to appear on the scope orspectrum display, remember to tick the appropriate check box in the channel list. Youcan change them later by clicking the Maths Channels button in the Channel Setuptoolbar .
65
25
65
63
106

OMEGASCOPE™ User's Guide 73
M5064
6.5.3 Reference Waveforms dialogLocation: Tools > Reference Waveforms
Purpose: enables you to create, edit and control reference waveforms ,which are stored copies of input channels
ReferenceWaveforms list
The main area of the Reference Waveforms dialog is theReference Waveforms list, which shows all the available inputchannels and the library and loaded reference waveforms . Tochoose whether or not a waveform appears in the main OMEGASCOPE™ window , click the appropriate check box andthen OK. You can have up to 8 channels in any view, including inputchannels, math channels and reference waveforms. If you try toenable a 9th channel, OMEGASCOPE™ will open a new view.
Available: these input channels are suitable as sources for referencewaveforms
Library: these are the reference waveforms that you have definedusing the Duplicate button or loaded with the Import button
Loaded: these are the reference waveforms present in anyOMEGASCOPE™ settings or data files that you have loaded
Edit Opens the Edit Reference Waveform dialog to allow you to editthe selected reference waveform. You must first select a waveform inthe Library section of the Reference Waveforms list. If thewaveform you want to edit is in the Loaded section, first copy it tothe Library section by clicking Duplicate, then select it and clickEdit.
47 26
74 26
26
12
74

Menus74
M5064
Delete Permanently deletes the selected reference waveform. Only referencewaveforms in the Library section can be deleted.
Duplicate Creates a copy of the selected input channel or reference waveform.The copy is placed in the Library section, from where you can edit itby clicking Edit. A quicker way to do the same thing is to right-clickon the view, select Reference Waveforms and then click thechannel that you wish to copy.
Import Opens a .psreference reference waveform file and places the
waveforms it contains in the Library section.
Export Saves all reference waveforms from the Library section to a new.psreference or Matlab 4 .mat file.
6.5.3.1 Edit Reference Waveform dialog
Location: Reference Waveforms dialog > Edit
Purpose: allows you to edit the name and color of a reference waveform
Name. OMEGASCOPE™ initially names the waveform after the input channel usedas its source, but you can edit it to anything you like. Here we have namedit "sine". The name will appear in the waveform list in the ReferenceWaveforms dialog .
Color: You can set the color of the trace to one of the standard colors in the drop-down-list, or click Custom to choose any color allowed by Windows.
73
26
73
OMEGASCOPE™ User's Guide 75
M5064
6.5.4 Serial Decoding dialogLocation: Tools > Serial Decoding
Purpose: lets you choose which channels to use for serial decoding and setother options
The following formats are supported:
I2CCAN BusRS232 (UART)SPI
Protocols table
This is where you select which channels to decode, and what serial protocol to use foreach channel. All the available channels are listed in the Channels column.
If the channel you want to use is not listed, enable it first by using the Channelstoolbar . For each channel that you want to decode, click in the Protocols column. A drop-down list will appear, containing all the protocols that OMEGASCOPE™ understands.The list may vary depending on which version of OMEGASCOPE™ you are using. For
multi-channel protocols like I2C and SPI, select the data channel. Any otherchannels will be specified later.
47
27
168
166
169
170
106

Menus76
M5064
Select the protocol you wish to use. A Settings panel for the selected channel willthen appear below the table in the dialog.
Settings panel
The settings panel shows all the adjustable settings for the selected channel. Theoptions available depend on the protocol selected.
Information panel
You do not need to take action on the messages in this panel. If the number ofsamples is too small then OMEGASCOPE™ will automatically adjust the capturesettings to improve the signal quality. If the number of samples is larger thannecessary, this is harmless and no adjustment will be made.
Common settings
These apply to all serial data formats.
Refresh. When you have entered the necessary information, OMEGASCOPE™analyzes the incoming signal and chooses the best settings for serial decoding. IfOMEGASCOPE™ is unable to decode the data, try improving the signal quality andthen click the Refresh button to analyze the signal again. For best results, clickthe Auto Setup button in the Capture Setup toolbar in the mainOMEGASCOPE™ window before entering serial decoding mode. This will ensurethat the signal is captured with enough detail for accurate decoding.
Display. Choose where you want to display the data: In View, In Window , orboth.
In View shows the data in logic-analyzer style, on the same time axis as theanalog waveform.
Hover the mouse pointer over any decoded packet to display its contents.
Click-and-drag the decoded data up or down the scope view.
If the In Window display is visible, double-click on any packet tohighlight it in the table.
In Window displays the decoded data in a table in the serial data window ,with advanced search and filtering functions.
CAN Bus settings
OMEGASCOPE™ can decode either the CAN H or the CAN L signal. Select which oneyou are using in the Protocols table.
Threshold. A voltage halfway between the high and low logic levels. If you are notsure, set this to halfway between the maximum and minimum voltages that yousee on the waveform.
Baud Rate. The speed of data transmission in symbols per second. Set this tomatch the speed of the data bus.
I2C Settings
Clock Channel. Which channel is connected to the SCL signal.
112
12
78
78
78
166
168
OMEGASCOPE™ User's Guide 77
M5064
Clock Threshold. The threshold voltage to use for the SCL signal.
Data Threshold. The threshold voltage to use for the SDA signal.
Settings. Opens the I2C Settings dialog .
RS232/UART Settings
Threshold. A voltage halfway between the high and low logic levels. If you are notsure, set this to halfway between the maximum and minimum voltages that yousee on the waveform.
Baud Rate. The speed of data transmission in symbols per second. Set this tomatch the speed of the data bus.
Bit Definitions. Opens the Bit Definitions dialog for setting up RS232 formatparameters.
SPI Settings
Clock Channel. Which channel is connected to the clock signal (SCLK or CLK).
Clock Threshold. The threshold voltage to use for the clock signal.
Data Threshold. The threshold voltage to use for the data signal (SDI, DI, SI,SDO, DO or SO).
CS Channel. Which channel to use for the chip select (CS, SS or STE) signal, ifpresent.
CS Threshold. The threshold voltage to use for the chip select signal.
Settings. Opens the Settings dialog .
82
169
80
170
81

Menus78
M5064
6.5.4.1 Serial Data window
Location: Channels toolbar > Serial Decoding button > select In Windowin the Serial Decoding dialog
Purpose: shows decoded serial data in alphanumeric format and allowsadvanced filtering and searching
For more information on the format of the table for each serial protocol, see Serialprotocols .
If you also selected In View in the Serial Decoding dialog, the data will also appearin graphical form on the scope view. You can click on one of the data packets in thescope view to go to the corresponding row in the table, or you can double-click a rowin the table to zoom to the corresponding frame in the scope view.
Control bar
The controls in the control bar are as follows:
Export Save the decoded data to a Microsoft Excel spreadsheet.
Accumulate By default, OMEGASCOPE™ clears the table each time the scopecaptures a new buffer full of data. Click this button to enter Accumulate mode, which continues adding serial frames to the endof the table until you click the button again.
View Controls which details of the data appear in the table. The sub-menus are as follows:
View > Frames/Packets: which types of frames or packets aredisplayed
View > Fields: which columns appear in the data tableView > Display Format: hexadecimal, binary, ASCII or decimal
formatView > Font Size: the character size used in the table
106
75
27
165

OMEGASCOPE™ User's Guide 79
M5064
Link This drop-down list selects or opens aspreadsheet file that maps numbers tostrings. For example, if you wish to display aCAN packet of type 41 (hex) as "HeadlightsOn", then enter "41" in the first column ofthe file and "Headlights On" in the second.
This button creates a sample spreadsheet fileto which you can add your own list ofnumber-string pairs.
Start from... Use this button to enter a condition that OMEGASCOPE™ will wait forbefore collecting data. When OMEGASCOPE™ detects a packet thatmatches this condition, it will collect all subsequent data (subject tofiltering, if used - see above) and display it in the table.
Filter Click to show the filter bar, which allows you to enter arbitrary dataabove each column in the table. The table will display only thosepackets that match the data you have entered. For example,entering "6C7" in the filter box at the top of the ID column willcause only frames with an ID of 6C7 to be displayed.
Statistics Toggle the statistics columns that list measurements such as packetstart and end times, and signal voltages.
Search Search for any data value in a specified column of the table.
Refresh Instructs OMEGASCOPE™ to decode the raw data again. This isnecessary if you have changed the Start from... condition, forexample.
Clear Clear all data and settings in the table. New data will appear thenext time that the scope captures a waveform.

Menus80
M5064
6.5.4.2 Bit Definitions dialog
Location: Serial Decoding dialog > RS232/UART format > Bit Definitions
Purpose: sets up parameters of your RS232 data format so OMEGASCOPE™ candecode the data
Signal IdleState:
The state, low or high, of the signal when no data present.
Data bits: The number of bits in the word.
Parity: The type of error-correction bit, if any, added to each word.
Stop bits: The number of extra bits used to indicate the end of a word.
Bit Order: Whether the least-significant or the most-significant bit occurs first.
75

OMEGASCOPE™ User's Guide 81
M5064
6.5.4.3 Settings dialog
Location: Serial Decoding dialog > select SPI format > Settings
Purpose: sets up parameters of your SPI data format so OMEGASCOPE™ candecode the data
Sample Clock on: Which edge of the clock to use.
Chip Select State: The polarity of the chip select (CS) signal, if used.
Data bits: The number of bits in the word. Choose from the drop-downlist or type a number directly into the box.
Bit Order: Whether the least-significant or the most-significant bitoccurs first.
75

Menus82
M5064
6.5.4.4 I2C Settings dialog
Location: Serial Decoding dialog > select I2C format > Settings
Purpose: sets up parameters of your I2C data format so OMEGASCOPE™ candecode the data
Display Address as: 7 bit Slave Address: displays as an 8-bit number by addingleading zeroes to the 7-bit address.8 bit Read/Write Address: displays as an 8-bit numberconsidering the Read/Write~ bit.
75

OMEGASCOPE™ User's Guide 83
M5064
6.5.5 Alarms dialogLocation: Tools > Alarms
Purpose: gives access to the alarms feature, which specifies actions to be takenon various events
Event: Select the event that will trigger the alarm:
Capture: when a waveform is captured. If triggering isenabled, this option corresponds to a trigger event. You cantherefore use this function to save a file on each trigger event.
Buffers Full: when the number of waveforms in the waveformbuffer reaches the maximum waveform count .
Mask(s) Fail: when any channel fails a mask test .
(Actions list): Add an action to this list by clicking Add. Whenever the specifiedevent occurs, OMEGASCOPE™ will execute the all the actions inthe list from top to bottom.
NOTE: For an action to execute, its check box must beset.
Apply: Set up the scope according to the settings in this dialog.
Add: Add an event to the Actions list. Possible events are:
Beep: activate the computer's built-in sounder. 64-bit PCsredirect this sound to the headphone output.
Play Sound: specify the name of a .wav sound file to play.
47
127
105 90
28

Menus84
M5064
Stop Capture: equivalent to pressing the red Stop button.
Restart Capture: equivalent to pressing the green Start button.Use only if the Stop Capture action was used earlier in the list.
Run Executable: run the specified EXE, COM or BAT programfile. You can type the %file% variable after the program name to
pass the name of the last file saved as an argument to theprogram. OMEGASCOPE™ will stop capturing while the programruns, and resume after the program terminates.
Save Current Buffer: save the current waveform from thebuffer as a .psdata, .pssettings, .csv or .mat file. You can
use the %buffer% variable to insert the buffer index number into
the filename, or the %time% variable to insert the time of capture.
Save All Buffers: save the entire waveform buffer as a .psdata,
.pssettings, .csv or .mat file.

OMEGASCOPE™ User's Guide 85
M5064
6.5.6 Masks menuLocation: Tools > Masks
Purpose: gives control over Mask Limit Testing
Add Masks: Add a mask to the display using the Mask Library dialog .
Clear Mask: Remove the mask from the display.
Save Mask: Save the displayed mask to disk as a .mask file.
6.5.6.1 Mask Library dialog
Location: Menu bar > Tools > Masks
Purpose: allows you to create, export and import masks for Mask Limit Testing
Channel: Select the channel to which you want to apply the mask.
Availablemasks:
The Library section shows all the masks that you have saved in thepast and not deleted. The Loaded section shows all the maskscurrently in use.
Generate: Create a new mask based on the last waveform captured from theselected channel. Opens the Generate Mask dialog .
Import: Load a mask that has previously been saved as a .mask file.
Export: Save a mask as a .mask file for future import.
47
28
85
31 47
28
87

Menus86
M5064
Apply: Use the selected mask on the selected channel but remain in the MaskLibrary dialog.
OK: Use the selected mask on the selected channel and return to the scopeview .
6.5.6.2 Editing a mask
To edit a mask in Mask Limit Testing mode, first note that a mask is made up ofone or more shapes called polygons. Choose the polygon that you wish to edit, thenright-click on it and select Edit Mask:
OMEGASCOPE™ will then draw edit handles on the selected mask polygon and displaythe mask edit box. If you drag any of the handles to edit the polygon, the statisticalresults will be updated immediately.
The mask edit box looks like this:
Normal viewMinimized
view
If the edit box is not immediately visible, it may have been minimized; in which case,
click the restore button: . If you edit the coordinates of a vertex, the statisticalresults will be updated immediately. You can also export the mask to a .mask file with
the export button: . Use the + and - buttons to add or remove vertices. Theminimize button has its usual function. To leave mask editing mode, close the maskedit box with the close (X) button.
13
28

OMEGASCOPE™ User's Guide 87
M5064
To add or remove an entire polygon, right-click the mask and select either the AddMask Polygon or the Remove Mask Polygon command:
6.5.6.3 Generate Mask Dialog
Location: Mask Library dialog > Generate
Purpose: allows you to set parameters for the automatically generated mask.OMEGASCOPE™ will then create a new mask based on the last capturedwaveform
Name: OMEGASCOPE™ automatically chooses a name for the new mask, butyou can change it to anything you like here.
X Offset: The horizontal distance between the waveform and the mask.
Y Offset: The vertical distance between the waveform and the mask.
85

Menus88
M5064
6.5.7 Macro RecorderLocation: Tools > Macro Recorder
Purpose: records a sequence of commands to be replayed later
The Macro Recorder helps when you wish to execute a series of commandsrepeatedly. It saves all commands to a .psmacro file, which can be modified using anXML editor.
Execute in realtime:
Play back the macro at the same speed as when recorded. Withoutthis option, playback will be as fast as possible.
47

OMEGASCOPE™ User's Guide 89
M5064
6.5.8 Preferences dialogLocation: Menu bar > Tools > Preferences
Purpose: Allows you to set options for the OMEGASCOPE™ software. Click one ofthe tabs in the picture below to learn more.
31 47

Menus90
M5064
6.5.8.1 General page
Location: Preferences dialog
Purpose: contains general controls for OMEGASCOPE™
Reset 'Don't show this again' dialogsRestore any missing dialogs that you asked OMEGASCOPE™ not to show again.
Reset preferencesSet all preferences back to their default values.
Waveform BufferMaximum Waveforms: This is the maximum number of waveforms thatOMEGASCOPE™ will store in the waveform buffer . You can select a number from1 to the maximum allowed by the oscilloscope that is connected: see the scopespecifications for details). The actual number of waveforms stored depends on theavailable memory and the number of samples in each waveform.
Collection Time UnitsChange the mode of the Timebase control in the Capture Setup toolbar .
Times per division: the Timebase control displays time units per division - forexample, '5 ns /div'. Most laboratory oscilloscopes display timebase settings in thisway.
Total collection time: the Timebase control displays time units for the entirewidth of the scope view - for example, '50 ns'.
Measurement StatisticsCapture Size - the number of successive captures that OMEGASCOPE™ uses tocalculate the statistics in the Measurements Table . A larger number producesmore accurate statistics but causes them to be updated less frequently.
89
105
112
18

OMEGASCOPE™ User's Guide 91
M5064
6.5.8.2 Power management page
Location: Preferences dialog
Purpose: controls features of the oscilloscope that affect its power consumption
Capture Rate
This control limits the speed at which OMEGASCOPE™ captures data from the scopedevice. The other OMEGASCOPE™ settings, the type of scope device and the speedof the computer will all affect whether this limit can actually be reached.OMEGASCOPE™ automatically selects the appropriate limit according to whether yourcomputer is running on batteries or on mains (line) power.
The settings are in captures per second. By default, the capture rate is set to"Unlimited" when your computer is running on Mains (line) power, for maximumperformance. If other applications run too slowly on your PC while OMEGASCOPE™ iscapturing, then reduce the capture rate limit. When your computer is running on Battery power, OMEGASCOPE™ imposes a performance limit to save the battery. Youcan increase this limit manually, but this will cause the battery power to drain veryquickly.
89
174

Menus92
M5064
6.5.8.3 Sampling page
Location: Preferences dialog
Purpose: controls the sampling behaviour of the oscilloscope
Slow Sampling Transition
In normal (fast) sampling mode, OMEGASCOPE™ collects enough data to fill thescreen and then redraws the whole view at once. This method is suitable for fasttimebases, when the screen is redrawn many times each second, but with slowtimebases it can cause a unacceptable delay before the data appears on thescreen. To avoid this delay, OMEGASCOPE™ automatically switches to slowsampling mode, in which the scope trace advances gradually across the screen asthe scope captures data.
The Collection Time control lets you select the timebase at which OMEGASCOPE™switches to slow sampling mode.
Slow Sampling Display
When this box is checked, OMEGASCOPE™ displays the previous waveform in thebuffer while gradually redrawing the new waveform over the top of it. Thus, at anytime, the left-hand side of the view shows the beginning of the new waveform,while the right-hand side shows the end of the previous waveform. A vertical barseparates the two waveforms.
89

OMEGASCOPE™ User's Guide 93
M5064
Sin(x)/x Interpolation
When the number of pixels across the scope view is greater than the number ofsamples in the waveform buffer, OMEGASCOPE™ interpolates - that is, it fills thespace between the samples with estimated data. It can either draw straight linesbetween the samples (linear interpolation) or connect them with smooth curves(sin(x)/x interpolation). Linear interpolation makes it easier to see where thesamples are, which is useful for high-accuracy measurements, but results in ajagged waveform. Sin(x)/x interpolation gives a smoother waveform but disguisesthe true locations of the samples, so should be used with care when the number ofsamples on the screen is low.
You can adjust the number of samples below which sin(x)/x interpolation isswitched on. Sin(x)/x interpolation is used only on the scope's fastest timebase.

Menus94
M5064
6.5.8.4 Keyboard page
Location: part of the Preferences dialog
Purpose: displays, and allows you to edit, keyboard shortcuts
A keyboard shortcut is a combination of keys that can be pressed on the keyboard toactivate an OMEGASCOPE™ function.
Keyboard Shortcuts All available OMEGASCOPE™ operations and theirassociated keyboard shortcuts (if defined) are listed. Toedit or add a keyboard shortcut:
Scroll the list of OMEGASCOPE™ commands until therequired command is visible.Select the required command.Select the 'Press shortcut keys:' box.Press the required key combination on the keyboard.Click Assign.
89

OMEGASCOPE™ User's Guide 95
M5064
6.5.8.5 Regional & Language page
Location: part of the Preferences dialog
Purpose: lets you select the language and other location-dependent settings forOMEGASCOPE™'s user interface
Language Select, from the drop-down box, the language you wish touse for the OMEGASCOPE™ user interface.OMEGASCOPE™ will ask you to restart the program beforeswitching to the new language.
Measurement System Select metric or U.S. units.
89

Menus96
M5064
6.5.8.6 Printing page
Location: part of the Preferences dialog
Purpose: lets you enter the details that will appear at the bottom of printedoutput
Default PrintSettings
When you print a view from the File menu , these details will beadded to the bottom of the page.
89
32

OMEGASCOPE™ User's Guide 97
M5064
6.5.8.7 Colors page
Location: part of the Preferences dialog
Purpose: lets you set the colors for various parts of the user interface
Custom Colors
These controls let you specify the colors for various parts of the OMEGASCOPE™screen:
Channels the trace color for each scope channel
Masks the mask areas in Mask Limit Testing
Misc miscellaneous items:
Grid lines the horizontal and vertical lines on the graticule
Background the area behind the waveforms and graticule. (In persistencemode this setting can be overridden by the PersistenceOptions dialog .)
Live trigger the trigger marker for the current trigger position
Trigger secondary trigger marker (appears when the live trigger hasmoved since the last waveform capture)
Horizontal axis the numbers across the bottom of each view , which usuallyindicate time measurements
Rulers the horizontal and vertical rulers that you can drag intoposition to help measure features on the waveform
Persistence the three colors to use for each channel in digital color persistence mode . The top color is used for the mostfrequently hit pixels, the middle and bottom colors for the lessand least frequently hit pixels.
89
13
28
173
17
116
15
13
174
17

Menus98
M5064
Line Thickness
These controls let you specify the thickness of the lines drawn on the scope andspectrum views:
Channel the waveforms and spectrum traces for all scope channelsGrid Lines the horizontal and vertical lines on the graticuleMarkers the horizontal and vertical rulers that you can drag into
position to help measure features on the waveform
Reset Colors to Default
Resets all of the color and line thickness settings to their default values.
13
16
173
174

OMEGASCOPE™ User's Guide 99
M5064
6.5.8.8 Options page
Location: part of the Preferences dialog
Purpose: lets you set various options that control the way that OMEGASCOPE™works
Device Startup Settings
Remember Last Device. This option is used when OMEGASCOPE™ finds more thanone scope device connected to the computer. If the check box is ticked,OMEGASCOPE™ will attempt to use the same device that was used last time.Otherwise it will use the first device available.
Advanced Features
The advanced capture modes are enabled by default. You can enable or disablethese features using the following options:
Spectrum Spectrum view and spectrum analyser featuresPersistence Digital Color, Analog Intensity and custom persistence display
modesZoom Overview A window that appears when you zoom in , to help to move
around large waveforms with the minimum of mouse clicksRPM Revolutions per minute, displayed alongside hertz in the
frequency legendTrigger Delay The time-delay control in the Triggering toolbar .Rapid Trigger The 'Rapid' entry in the Trigger mode control in the Triggering
toolbar .
Recent Files
The maximum number of files listed in the File > Recent Files menu. Click thebutton to clear the list.
89
10
16 16
17
134
23
127
127
32

Menus100
M5064
6.6 Help menuLocation: Menu bar > Help
Purpose: gives access to the OMEGASCOPE™ User's Guide and relatedinformation
User's Guide This is the main help manual, containing complete information onthe program. Contents, Index and Search are shortcuts tovarious functions of the help viewer.
Check forUpdates
Connect to the Omega Engineering, Inc. website and look for anewer version of the OMEGASCOPE™ software. Requires an internetconnection.
AboutOMEGASCOPE™
Show version numbers of the OMEGASCOPE™ software and anyoscilloscope that is connected.
31

OMEGASCOPE™ User's Guide 101
M5064
6.7 Connect Device dialogLocation: Menu bar > File > Connect Device
or plug in a new device
Purpose: when OMEGASCOPE™ finds more than one available scope device ,this dialog allows you to select which one to use
See "How to change to a different device " if you wish to switch to a different scopedevice later.
Procedure
To restrict the selection to a particular series of devices, click on the device drop-down box and select a device series; otherwise, click the Find All button.Wait for a list of devices to appear in the grid.Select one device and click the OK button.OMEGASCOPE™ will open a scope view for the selected scope device.Use the toolbars to set up the device and the scope view to display yoursignals.
Demonstration mode
If you start OMEGASCOPE™ with no device connected, or with more than one deviceconnected, the Connect Device dialog automatically appears with a list of'DEMO' (demonstration) devices for you to choose from. These are virtual devicesthat you can use to experiment with the features of OMEGASCOPE™. Once you haveselected a demonstration device and clicked OK, OMEGASCOPE™ adds a Demo SignalGenerator button to the toolbar. Use this button to set up the test signals fromyour demonstration device.
31 32
174
136
13
104 13
125

Menus102
M5064
6.8 Converting files in Windows ExplorerYou can convert OMEGASCOPE™ data files to other formats for use in otherapplications, or to different forms of data for use with OMEGASCOPE™.
The easiest way to do this conversion is through the context menu in WindowsExplorer. The context menu is the menu that pops up when you right-click it with themouse or activate it with the "menu" button on a Windows keyboard. When you installOMEGASCOPE™, a "Convert" entry is added to the context menu to enable you toconvert OMEGASCOPE™ data files.
The OMEGASCOPE™ context menu in Windows Explorer
Converting to OMEGASCOPE™ 6.2.4 format
The example above shows four pre-existing OMEGASCOPE™ data files represented bystandard OMEGASCOPE™ icons. OMEGASCOPE™ 6.2.4 introduced a new feature thatallows OMEGASCOPE™ data files to appear as waveforms instead of icons. To enablethis feature for old data files, you need to convert them to the new format using thecontext menu of Windows Explorer.
If OMEGASCOPE™ is running, close it.In Windows Explorer, right-click a OMEGASCOPE™ data file.
Select Convert > All waveforms > .psdata. A OMEGASCOPE™ icon willappear in the Windows notification area while the conversion is in progress.OMEGASCOPE™ will ask you to confirm that you wish to overwrite the .psdata filewith a new version. Click Yes.Wait for Windows Explorer to update the display.Repeat for all .psdata files.

OMEGASCOPE™ User's Guide 103
M5064
The .psdata files should now appear as in this picture:
Converting to other formats
For all of these conversions, you can choose either "All waveforms" or "Currentwaveform". A .psdata file can contain either a single waveform or the entire contentsof the waveform buffer, which can hold a number of waveforms from successivetrigger events. If the .psdata file contains more than one waveform, then you canchoose to convert all of them or just the one that was last viewed in OMEGASCOPE™.
Right-click an OMEGASCOPE™ data file.To convert all waveforms in the file, select Convert > All waveforms or Convert> Current waveform and then the file format that you require. An
OMEGASCOPE™ icon will appear in the Windows notification area while theconversion is in progress.
Complex operations
For more complex operations, such as converting all files in a directory, you can runOMEGASCOPE™ in a command window (see Command-line syntax ).171

Toolbars and buttons104
M5064
7 Toolbars and buttonsA toolbar is a collection of buttons and controls with related functions.OMEGASCOPE™ contains the following toolbars:
Buffer Navigation toolbarChannel Setup toolbarMeasurements toolbarCapture Setup toolbarStart / Stop toolbarTriggering ToolbarZooming and Scrolling toolbarSignal Generator button
105
106
118
112
126
127
133
119

OMEGASCOPE™ User's Guide 105
M5064
7.1 Buffer Navigation toolbarThe Buffer Navigation toolbar allows you to select a waveform from the waveformbuffer.
What is the waveform buffer?
Depending on the settings you have chosen, OMEGASCOPE™ may store more thanone waveform in its waveform buffer. When you click the Start button or change acapture setting , OMEGASCOPE™ clears the buffer and then adds a new waveformto it each time the scope device captures data. This continues until the buffer is full oryou click the Stop button. You can limit the number of waveforms in the buffer to anumber between 1 and 10,000 using the General preferences page.
You can review the waveforms stored in the buffer using these buttons:
First waveform button. Display waveform 1.
Previous waveform button. Display the previous waveform in thebuffer.
Waveform number indicator. Show which waveform is currentlydisplayed, and how many waveforms the buffer holds. You can edit thenumber in the box and press Enter, and OMEGASCOPE™ will jump to thespecified waveform.
Next waveform button. Display the next waveform in the buffer.
Last waveform button. Display the last waveform in the buffer.
Buffer Navigator button. Open the Buffer Navigator window forquick selection of buffer waveforms.
126
112
126
90
30

Toolbars and buttons106
M5064
7.2 Channel Setup toolbarThe Channel Setup toolbar controls the settings for each vertical input channel .The screen shot below shows the toolbar for a two-channel scope device , butdifferent scope devices may have different numbers of channels.
Each channel has its own set of buttons:
Channel Options button. Opens the Channel Options menuwith options for probes, resolution enhancement , scalingand filtering.
Range control. Sets up the scope device to capture signals overthe specified range of values. The list of options depends on the
selected scope device and probe . A red warning symbol - - appears if the input signal exceeds the selected range. If youselect Auto, OMEGASCOPE™ will continually adjust the verticalscale so that the height of the waveform fills as much of the viewas possible.
Coupling Control. Sets up the input circuitry.AC coupling : rejects frequencies below about 1 Hz. DC coupling : accepts all frequencies from DC to the scope'smaximum bandwidth.Frequency: enable the built-in frequency counter if available.Only one channel at a time can be operated in this mode.Supported devices include the OMSP-4000 Series 12-bit scopes.
173
174
107
174 19 109
174 174
173
173

OMEGASCOPE™ User's Guide 107
M5064
7.2.1 Channel Options menuThe Channel Options menu appears when you click the Channel Options button
(for example: ) on the Channel Setup toolbar .
Probe list. Indicates the probe currently in use andallows you to select a different one. Use it to tellOMEGASCOPE™ what type of probe is connected toa channel. By default, the probe is assumed to bex1, which means that a one-volt signal at the inputto the probe will appear as one volt on the display.
Expand probe list. Click this to select from a listof probes.
Open Custom Probes dialog. The Custom Probesdialog allows you to edit your library of customprobes.
Resolution enhance. Allows you to increase theeffective resolution of your scope device using Resolution enhancement . The number in thisbox is a target value that the software will attemptto use whenever possible.
Axis Scaling. These are the axis scaling controls that allow you to set the scale and offset for
each vertical axis individually.
106
48
19
109

Toolbars and buttons108
M5064
Analog Options. Options that can be applied tothe oscilloscope input hardware, if the oscilloscopehardware supports them.
Offset: an offset voltage added to the analog inputbefore digitization. OMSP-3000 Series only.
Lowpass Filtering. An independent digital lowpassfilter for each input channel, with programmablecut-off frequency. This can be useful for removingnoise from your signal to make more accuratemeasurements. Not all scopes support this feature.
110

OMEGASCOPE™ User's Guide 109
M5064
7.2.1.1 Axis scaling controls
The axis scaling controls are control boxes that let you change the scale and offsetof each vertical axis individually. If the axis belongs to a reference waveform thenyou can also adjust its delay relative to the live waveforms.
Controls for a livewaveform
Controls for a referencewaveform
There are two ways to open the axis scaling control: -
For any channel displayed in a view : click the coloured scaling button ( ) atthe bottom of the vertical axisFor any input channel: Click the Channel Options button in the ChannelSetup toolbar
Scale control. Increase to magnify the waveform, decrease to reduceit. The vertical axis rescales accordingly so that you can always read the
correct voltage from the axis. Click the reset button ( ) to return to ascale of 1.0. The scaling button always shows the selected scale.
Offset control. Increase to move the waveform up the display,decrease to move it down. The vertical axis shifts accordingly so thatyou can always read the correct voltage from the axis. Adjusting thiscontrol is equivalent to clicking and dragging the vertical axis. Click the
reset button ( ) to return to an offset of 0.00%.
Delay control (for reference waveforms only). Increase to movethe waveform to the left relative to the timing reference point, decrease
to move it to the right. Click the reset button ( ) to return to a delayof 0 s.
The location of the timing reference point depends on which triggermode OMEGASCOPE™ is in. If the trigger mode is None then thedelay is measured relative to the left-hand edge of the display. In allother trigger modes, the delay is measured relative to the triggermarker.
26
174
107
106
127
15

Toolbars and buttons110
M5064
7.2.1.2 Lowpass filtering
The lowpass filtering feature can reject high frequencies from any selected inputchannel. The filtering control is found in the Advanced Channel Options dialog ,
which is opened by clicking the Channel Options button ( ) for the relevantchannel on the Channel Setup toolbar . The control determines the cut-off frequencyof the filter, which must be below half the sampling rate shown in the Properties sheet
.
The following devices support lowpass filtering:
OMSP-3000 SeriesOMSP-4000 Series
Lowpass filtering is useful for rejecting noise. The split screenshot below shows theeffect of applying a 1 kHz lowpass filter on a noisy signal. The underlying shape of thesignal is preserved but the high-frequency noise is eliminated:
Left: before lowpass filtering. Right: after 1 kHz lowpass filtering.
107
106
24

OMEGASCOPE™ User's Guide 111
M5064
Filter details
The lowpass filtering algorithm is chosen according to the relationship between theselected cut-off frequency (fC) and the sampling rate (fS), as follows:
fC / fS Filter type Description
0.0 to 0.1 Moving average A moving average filter is used for low cut-offfrequencies. The length of the filter is adjusted toachieve the selected cut-off frequency, which is isdefined as the first minimum in the frequencyresponse. There is significant signal leakage abovethe cut-off frequency. This filter changes a verticaledge into a linear slope.
0.1 to < 0.5 FIR A finite impulse response filter is used for mediumto high cut-off frequencies. This has a monotonicroll-off above the cut-off frequency and thereforesuffers from less leakage than the moving averagefilter.
You can force OMEGASCOPE™ to use one or other of the filter types by adjusting the Samples control in the Capture Setup toolbar to make the ratio fC/fS fall into one
of the two ranges shown in the table. As the table shows, the cut-off frequency mustbe below half the sampling frequency.
112

Toolbars and buttons112
M5064
7.3 Capture Setup toolbarThe Capture Setup toolbar controls the time-related or frequency-related settings ofyour oscilloscope.
Scope Mode
In scope mode, the toolbar looks like this:
(See below for different versions of the toolbar in spectrum mode and persistencemode .)
Scope Mode. Sets up OMEGASCOPE™ to operate as an oscilloscope. Use the Auto Setup button to optimise the settings. If you
wish, you can add a secondary spectrum view from the contextmenu (by right-clicking on the scope view).
Persistence Mode. Toggles persistence mode , which allows oldtraces to remain on the screen in faded colors while new traces aredrawn on top in brighter colors. The use of colors is controlled bythe Persistence Options dialog. OMEGASCOPE™ will rememberany views that were open, so that you can return to them by clickingthe Persistence Mode button again.
Spectrum Mode. Sets up OMEGASCOPE™ to operate as a spectrumanalyser . Use the Auto Setup button to optimise the settings. Ifyou wish, you can add a secondary scope view from the contextmenu (by right-clicking on the scope view).
Auto Setup. Searches for a signal on one of the enabled inputchannels, then sets up the timebase and signal range to display thesignal correctly.
Home. Restores OMEGASCOPE™ to its default settings. Equivalentto the File > Startup Settings > Load Startup Settingscommand.
Timebase control. Sets the time represented by a single division ofthe horizontal axis when the horizontal zoom control is set to x1.The timebases available depend on the type of scope device youare using.
Choosing a timebase of 200 ms/div or slower causesOMEGASCOPE™ to switch to a different mode of data transfer. Theinternal details of this are taken care of by OMEGASCOPE™, but theslow mode limits the sampling rate to a maximum of 1 millionsamples per second.
You can change this control to display the total time across thescope view, rather than the time per division, using the CollectionTime Units control in the General page of the Preferences dialog
.
10
113
17
10
16
17
10
13
32
174
90
89

OMEGASCOPE™ User's Guide 113
M5064
Horizontal zoom control. Zooms the view, in the horizontal
direction only, by the specified amount. Click the and buttons
to adjust the zoom factor, or the button to reset.
Samples control. Sets the maximum number of samples that willbe captured for each channel. If this is larger than the number ofpixels across the scope view then you can zoom in to see moredetail. The actual number of samples captured is displayed on the Properties sheet, and may be different from the numberrequested here, depending on which timebase is selected and whichscope device is in use.
Spectrum Mode
In spectrum mode, the Capture Setup toolbar looks like this:
Frequency range control. Sets the frequency range across thehorizontal axis of the spectrum analyser when the horizontal zoomcontrol is set to x1.
Spectrum Options. Appears if a spectrum view is open,regardless of whether scope mode or spectrum mode isselected. It opens the Spectrum Options dialog .
Persistence Mode
In persistence mode, the Capture Setup toolbar looks like this:
Persistence Options. Opens the Persistence Options dialog ,which controls several parameters affecting the way thatOMEGASCOPE™ represents old and new data in persistence mode.
24
10
16
10 10
114
17
116

Toolbars and buttons114
M5064
7.3.1 Spectrum Options dialogThis dialog appears when you click the Spectrum Options button in the CaptureSetup toolbar . It is available only when a spectrum view is open. It containscontrols that determine how OMEGASCOPE™ converts the source waveform in thecurrent scope view to a spectrum view.
Spectrum Bins
The number of frequency bins into which the spectrum isdivided. This control sets the maximum number of frequencybins, which the software may or may not be able to providedepending on other settings. The main constraint is that thenumber of bins cannot greatly exceed half the number ofsamples in the source waveform.
If the source waveform contains fewer samples than required(that is, fewer than twice the number of frequency bins), thenOMEGASCOPE™ zero-pads the waveform up to the next power oftwo. For example, if the scope view contains 10,000 samples,and you set Spectrum Bins to 16384, then OMEGASCOPE™ zero-pads the waveform to 16,384 samples, which is the nearestpower of two above 10,000. It then uses these 16,384 samplesto provide 8,192 frequency bins, not the 16,384 requested.
If the source waveform contains more samples than required,then OMEGASCOPE™ uses as many samples as necessary,starting from the beginning of the waveform buffer. Forexample, if the source waveform contains 100,000 samples andyou request 16,384 frequency bins, OMEGASCOPE™ needs only2 x 16,384 = 32,768 samples, so it uses the first 32,768samples from the waveform buffer and ignores the rest. Theamount of data actually used is displayed as the Time Gatesetting in the Properties sheet.
Window Function
Allows you to choose one of the standard window functions toreduce the effect of operating on a time-limited waveform. See Window functions.
Display Mode
You can choose Magnitude, Average or Peak Hold.
Magnitude: the spectrum view shows the frequency spectrumof the last waveform captured, whether live or stored in the waveform buffer.
112 16
24
162
105

OMEGASCOPE™ User's Guide 115
M5064
Average: the spectrum view shows an rolling average of spectracalculated from all the waveforms in the waveform buffer .This has the effect of reducing the noise visible in the spectrumview. To clear the averaged data, click Stop and then Start,
or change from Average mode to Magnitude mode.
Peak Hold: the spectrum view shows a rolling maximum of thespectra calculated from all the waveforms in the buffer. In thismode, the amplitude of any frequency band in the spectrumview will either stay the same or increase, but never decrease,over time. To clear the peak hold data, click Stop and thenStart, or change from Peak Hold mode to Magnitude mode.
Note: when you switch to Average or Peak Hold mode, theremay be a noticeable delay while OMEGASCOPE™ processes theentire contents of the waveform buffer, which may contain manywaveforms, to build up the initial display. If this occurs, aprogress bar appears at the bottom of the window to show thatOMEGASCOPE™ is busy:
Scale Specifies the labelling and scaling of the vertical (signal) axis.This can be one of the following:
Linear: The vertical axis is scaled in volts.
Logarithmic: The vertical axis is scaled in decibels,referred to the level selected below in the Logarithmic unit control.
dBV: Reference level is 1 volt.
dBu: Reference level is 1 milliwatt with aload resistance of 600 ohms. Thiscorresponds to a voltage of about 775 mV.
dBm: Reference level is one milliwatt intothe specified load impedance. You canenter the load impedance in the box belowthe Logarithmic unit control.
Arbitrary dB: Reference level is anarbitrary voltage, which you can specify inthe box below the Logarithmic unitcontrol.
105
126
126
126
126

Toolbars and buttons116
M5064
7.3.2 Persistence Options dialog
This dialog appears when you click the Persistence Options button in theCapture Setup toolbar . It is available only when persistence mode is selected.It controls the colors and fading algorithm used to distinguish new or frequent datafrom old or intermittent data in the persistence view.
Mode Digital Color. This mode uses a range of colors to indicate thefrequency of waveform data. Red is used for the most frequent data,and less frequent data is represented successively by yellow and blue.
Analog Intensity. This mode uses color intensity to indicate the age ofwaveform data. The latest data is drawn at full intensity in the selectedcolor for that channel, with older data being represented by palershades of the same color.
Advanced. This mode opens up a Custom Options section at thebottom of the dialog that let you customise the persistence modedisplay.
Decay Time The time, in milliseconds, taken for waveform data to fade frommaximum intensity to minimum intensity or from red to blue. Thelonger the decay time, the longer the older waveforms will remain onthe screen.
Saturation The intensity or color with which new waveforms are drawn.
DecayedIntensity
The intensity or color to which the oldest waveforms decay when thedecay time expires. If the decayed intensity is zero, then olderwaveforms will be completely erased from the display after the decaytime. For non-zero values of decayed intensity, old waveforms willremain indefinitely on the screen at that intensity unless overwritten bynew ones.
112 17

OMEGASCOPE™ User's Guide 117
M5064
Custom Options
Line DrawingThe type of line drawn between samples that are adjacent in time.Phosphor Emulation. Joins each pair of sample points with a linewhose intensity varies inversely with the slew rate.Constant Density. Joins each pair of sample points with a line ofuniform color.Scatter. Draws sample points as unconnected dots.
ColorScheme
Phosphor. Uses a single hue for each channel, with varying intensity.Color. Uses a color from red to blue to represent the age of eachwaveform.
Background Black. Overrides the Color Preferences dialog . This is the default.White. Overrides the Color Preferences dialog .User Preference. Sets the background color to the preference set inthe Colors page of the Preferences dialog .
Data Hold This option is enabled only when Persistence Mode (see below) is setto Time Delay.
Decay Timeout. Old waveforms fade until they reach DecayedIntensity and then disappear.Infinite. Old waveforms fade until they reach Decayed Intensity andthen remain indefinitely unless overwritten by new waveforms.
PersistenceMode
Frequency. Points on the display are drawn with a color or intensitythat depends on the frequency with which they are hit by waveforms.Time Delay. Points on the display are drawn at full intensity when hitby a waveform, and are then allowed to decay to Decayed Intensity.The behaviour after this depends on the Data Hold setting (see above).
97
97
97 89
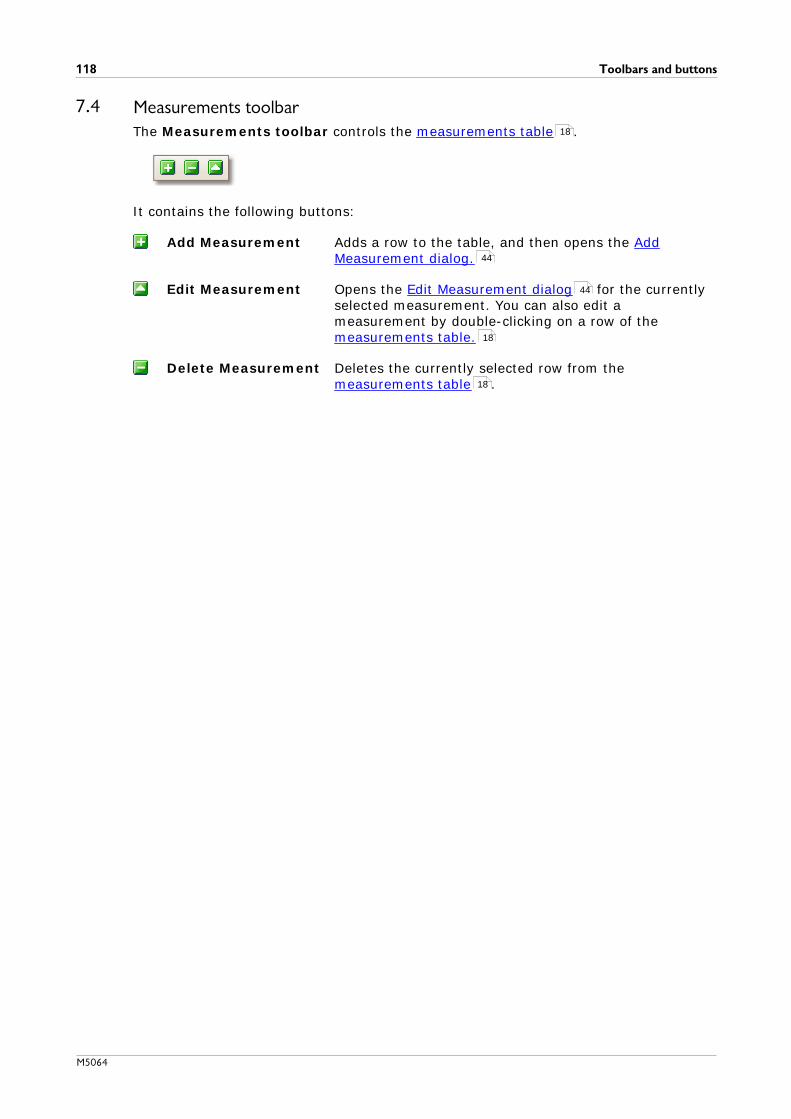
Toolbars and buttons118
M5064
7.4 Measurements toolbarThe Measurements toolbar controls the measurements table .
It contains the following buttons:
Add Measurement Adds a row to the table, and then opens the AddMeasurement dialog.
Edit Measurement Opens the Edit Measurement dialog for the currentlyselected measurement. You can also edit ameasurement by double-clicking on a row of the measurements table.
Delete Measurement Deletes the currently selected row from the measurements table .
18
44
44
18
18

OMEGASCOPE™ User's Guide 119
M5064
7.5 Signal Generator buttonThe Signal Generator button allows you to set up your scope device's test signalgenerator, if it has one, or the demo signal settings if OMEGASCOPE™ is in demomode .
If your scope has a built-in signal generator then clicking the Signal Generatorbutton opens the Signal Generator dialog .
If OMEGASCOPE™ is in demo mode then clicking the Signal Generator buttonopens the Demo Signals menu .
7.5.1 Signal Generator dialogLocation:
click the Signal Generator button on the toolbar
Purpose: controls the scope device's built-in signal generator
Signal generator dialog for theOMEGASCOPE™ 3206
Not all scope devices have a signal generator, and those that do have a varying rangeof controls in the signal generator dialog.
Basic controls
Signal On. Tick this box to enable the signal generator.
Signal Type. Select the type of signal to be generated. The listof signal types depends on the capabilities of the scopedevice.
174
173
119
173
125
119
174
161

Toolbars and buttons120
M5064
Import. Opens a file selection dialog that allows you to importan arbitrary waveform file . The file will be loaded into thearbitrary waveform generator and the generator switched on.This button is available only if your scope has an arbitrarywaveform generator .
Arbitrary. Opens the Arbitrary Waveform window . Thisbutton is available only if your scope has an arbitrary waveformgenerator .
Start Frequency. Type in this box or use the spin buttons toselect the frequency. If the scope device has a frequency sweepgenerator, then this box sets the start frequency of the sweep.
Amplitude. The amplitude of the waveform measured frompeak to peak. For example, if Amplitude is 1 V and Offset is 0V, the output will have a negative peak of -0.5 V and a positivepeak of +0.5 V.
Offset. The mean value of the signal. For example, when Offsetis 0 V, a sine or square wave will have equal positive andnegative peak voltages.
Sweep mode controls
Active. Tick this box to enable sweep mode. If the box is notticked, the generator will operate at a fixed frequency set bythe Start Frequency control.
Sweep Type. Specifies the direction in which the frequency isswept.
Stop Frequency. In sweep mode, the generator stopsincreasing the frequency when it reaches the Stop Frequency.
Frequency Increment. In sweep mode, the generatorincreases or decreases the frequency by this amount every Increment Time Interval.
Increment Time Interval. In sweep mode, the generatorincreases or decreases the frequency by Frequency Incrementeach time this interval ends.
121
173
173
122
173

OMEGASCOPE™ User's Guide 121
M5064
7.5.2 Arbitrary waveform filesSome OMEGASCOPE™ PC Oscilloscopes have an arbitrary waveform generator(AWG), which is enabled using the Signal Generator dialog . OMEGASCOPE™ canprogram the AWG with a standard waveform, such as a sine or square wave, or anarbitrary waveform that you create or import from a text file.
A text file for OMEGASCOPE™ is a list of decimal floating-point values, as in thisexample:
0.00.30.90.60.60.0-0.30.00.00.0
The file may have between 10 and 8,192 values, as many it needs to define thewaveform. Each line may have more than one value, in which case the values must beseparated by tabs or commas.
The values are samples between -1.0 and +1.0 and must be equally spaced in time.The output is scaled to the amplitude selected in the Signal Generator dialog. andthe selected offset is added if necessary. For example, if the signal generatoramplitude is set to "1 V" and the offset to "0 V", then a sample value of -1.0corresponds to an output of -1.0 V and a sample of +1.0 corresponds to an outputof +1.0 V.
The file should contain exactly one cycle of the waveform, which will then be playedback at the speed specified in the Signal Generator dialog . In the example above,the signal generator was set to 1 kHz, so one cycle of the waveform lasts for 1 ms.There are 10 samples in the waveform, so each sample lasts for 0.1 ms.
Using files saved from OMEGASCOPE™
As OMEGASCOPE™ can export CSV and TXT files , you can capture a waveform andthen play it back using the arbitrary waveform generator. You must first modify thefile by removing the header rows and time values so that its format matches theexample above.
173
119
119
119
35

Toolbars and buttons122
M5064
7.5.3 Arbitrary Waveform Generator windowLocation: Signal Generator dialog > Arbitrary
Purpose: allows you to import, edit, draw and export arbitrary waveforms to loadinto your scope's arbitrary waveform generator . You can also importand export the data in CSV format for use in other applications.
Once the desired waveform appears in the window, click OK or Apply to start using it.
Toolbar buttons
Import from channel. Opens the Import from Channeldialog , which lets you copy a waveform from the scopeinto the arbitrary waveform window.
Import. Displays an Open dialog to allow you to import anarbitrary waveform from a text file .
Export. Displays a Save As dialog to allow you to save thearbitrary waveform as a text file .
Freehand drawing. Enters freehand drawing mode. inwhich you can draw any waveform shape using the mouse.
Straight-line drawing. Enters straight line mode, in whichyou can click on the waveform to draw a straight line fromthe previous point. To start a new series of lines, click thebutton again.
Samples. The number of samples in the arbitrarywaveform. Each sample represents the signal value at agiven instant in time, and the samples are equally spaced intime. For example, if there are 1024 samples and the arbitrary waveform generator is set to play back at 1kHz, then each sample represents (1/1 kHz ÷ 1024) orabout 0.98 microseconds.
119
173
173
124
121
121
119

OMEGASCOPE™ User's Guide 123
M5064
Bit stream. Draws a sequence of bits according to binary orhex data that you specify. The logic high and low levels areadjustable.
Clear. Deletes the arbitrary waveform.
Normalize. Adjusts the waveform vertically so that itoccupies the full [-1,+1] range.
Undo and Redo. The Undo button reverses the lastchange made to the arbitrary waveform. The Redo buttonreverses the last action of the Undo button.
Zoom tools. To zoom the time axis in or out, click the "+"or "-" zoom button and then click on the waveform area.Click the "100%" button to restore the time axis to itsoriginal scale.
Waveform settings
Standard waveform shapes. Draw a standard waveformwith the settings specified in the numerical controls belowthe toolbar. The current waveform will be erased.
Cycles. The number of cycles to draw. This control is usedin conjunction with the Standard waveform shapesbuttons. Select one of the standard waveform shapes andthen enter the number of cycles, and OMEGASCOPE™ willdraw the requested number of cycles of the waveform.
Minimum. When one of the Standard waveform shapesbuttons is pressed, this control sets the minimum signallevel.
Maximum. When one of the Standard waveform shapesbuttons is pressed, this control sets the maximum signallevel.
Duty cycle. When a square, triangular or ramp waveform isselected using one of the Standard waveform shapesbuttons, this control sets the duty cycle of the signal. Dutycycle is defined as the time that the signal spends abovezero volts divided by the total cycle time. Thus, asymmetrical square or triangular wave has a duty cycle of50%. Reducing the duty cycle shortens the positive part ofthe cycle and lengthens the negative part, and increasingthe duty cycle does the opposite.
Other buttons
OK Copies the waveform from the graphical editor into thearbitrary waveform generator and returns to the main OMEGASCOPE™ window.
Apply Copies the waveform from the graphical editor into thearbitrary waveform generator and remains in the ArbitraryWaveform Generator window.
12

Toolbars and buttons124
M5064
7.5.3.1 Import from a Channel dialog
Location: Arbitrary Waveform window > Import from a Channel button (
)
Purpose: allows you to copy captured data from a scope channel to the ArbitraryWaveform window
Select Channel: You can import the latest waveform from any available channel.
Select Samples: By default, the entire capture is imported. This control allows youto specify a subset of the capture, either between specifiedsample numbers or between rulers. The subset will be scaled tofit the number of samples specified in the Samples control inthe Arbitrary Waveform window .
122
122
122

OMEGASCOPE™ User's Guide 125
M5064
7.5.4 Demo Signals dialogLocation: start OMEGASCOPE™ with no scope device plugged in > Connect
Device dialog > select "DEMO" device > Signal Generator button
( ) > select channel
Purpose: controls one channel of the "demo" signal source, a feature ofOMEGASCOPE™ that creates a variety of test signals to simulate ascope device
Signal On: Tick this box to enable the demo signal source.
Frequency: Type your desired frequency in hertz, or use the spinbuttons.
Amplitude: Type your desired amplitude in volts, or use the spinbuttons.
Offset: Enter a number to add a d.c. offset to the demo signal. Bydefault, the demo signals have a mean value of zero volts.
7.5.5 Demo Signals menuLocation: start OMEGASCOPE™ with no scope connected > Connect Device
dialog > select "demo device" > Signal Generator button (
)
Purpose: allows you to set up test signals so that you can experiment withOMEGASCOPE™ when no scope device is connected
When you click the Signal Generator button , a drop-down list of all theavailable channels in your demo device appears, like this:
Click one of the channels to open the Demo Signals dialog , which will allow youto set up a signal from that channel.
101
125
101 173 119
119
125

Toolbars and buttons126
M5064
7.6 Start / Stop toolbarThe Start / Stop toolbar allows you to start and stop the scope device . Clickanywhere on the toolbar, or press the space bar, to start or stop sampling.
Start icon. Highlighted if the oscilloscope is sampling.
Stop icon. Highlighted if the oscilloscope is stopped.
174

OMEGASCOPE™ User's Guide 127
M5064
7.7 Triggering toolbarThe Triggering toolbar tells the scope device when to start capturing data. Seealso: Trigger.
Trigger Mode. The list of available modes varies depending on thetype of scope device in use.
None: OMEGASCOPE™ acquires waveforms repeatedly withoutwaiting for a signal to trigger on.
Auto: OMEGASCOPE™ waits for a trigger event before capturingdata. If there is no trigger event within a reasonable time, itcaptures data anyway. It repeats this process until you click the Stop button . "Auto" mode does not set the trigger levelautomatically.
Repeat: OMEGASCOPE™ waits indefinitely for a trigger eventbefore displaying data. It repeats this process until you click the Stop button . If there is no trigger event, OMEGASCOPE™displays nothing.
Single: OMEGASCOPE™ waits once for a trigger event, then stopssampling. To make OMEGASCOPE™ repeat this process, click the Start button.
Rapid: OMEGASCOPE™ instructs the scope device to acquire asequence of waveforms with the minimum possible delay betweenthem. The display is not updated until the last waveform in thesequence has been captured. When the operation is finished, youcan step through the waveforms using the Buffer Navigationtoolbar .
ETS: Equivalent Time Sampling. OMEGASCOPE™ captures manycycles of a repetitive signal, then combines the results to produce asingle waveform with higher time-resolution than is possible with asingle capture. For accurate results, the signal must be perfectlyrepetitive and the trigger must be stable.
If you select ETS when an Advanced Trigger type is enabled, thetrigger type will revert to Simple Edge and the AdvancedTriggering button will be disabled.
Advanced Triggering. Click to open the Advanced Triggeringdialog, which gives you extra trigger types beyond the simpleedge trigger. If this button is disabled, it is because either None orETS is selected in the trigger mode control, or your scope devicedoes not support this mode. To enable the Advanced Triggeringbutton, set the control to another trigger mode, such as Auto,Repeat or Single.
Trigger Source. This is the channel that OMEGASCOPE™ monitorsfor the trigger condition.
Rising Edge. Click to trigger on the rising edge of the waveform.
174
174
126
126
126
174
105
173
129
129
174

Toolbars and buttons128
M5064
Falling Edge. Click to trigger on the falling edge of the waveform.
Trigger Level. Sets the trigger level. You can also set thetrigger level by dragging the trigger marker up or down on thescreen.
Pre-trigger Time (0% to 100%). This parameter controls howmuch of the waveform appears before the trigger point. It defaultsto 50%, which puts the trigger marker in the middle of thescreen. You can also control this parameter by dragging the triggermarker to the left or right.
Post-trigger Delay Enable. Click this button to toggle the Post-trigger Delay control (see next item).
Post-trigger Delay. The post-trigger delay is the time thatOMEGASCOPE™ waits after the trigger point before sampling. Youcan also modify this parameter by dragging the trigger markerwhile the Post-trigger Delay button is enabled. As you drag themarker, you will see the post-trigger arrow displayed briefly. Forthis control to have an effect, you must first make sure that the Post-trigger Delay button is enabled.
See the reference topic "Trigger Timing " for information on howthe Pre-trigger Time and Post-trigger Delay controls interact.
Rapid Captures. In Rapid trigger mode, this is the number ofwaveforms to capture in a sequence. They will be captured with theminimum possible dead time between them.
174
15
15
15
15
15
163
173

OMEGASCOPE™ User's Guide 129
M5064
7.7.1 Advanced Triggering dialogLocation:
Triggering toolbar > Advanced Triggering button ( )
Purpose: allows you to set up more complex trigger types than simple edge-triggering
Advanced trigger types list. This controllists all the available advanced trigger types. Click on the condition you require, and adiagram and description will appear on theright of the dialog.
If ETS triggering is enabled in the triggeringtoolbar , then selecting any trigger typeexcept Simple Edge switches off ETS mode.
Advanced triggering options. The optionsavailable depend on the trigger type selected.See Advanced trigger types . Instructionsand diagrams also appear in the dialog.
127
130
173
127
130

Toolbars and buttons130
M5064
7.7.2 Advanced trigger typesThe advanced trigger types can be switched on in the Advanced Triggeringdialog.
For all trigger types, the first step is to select which signal the scope should use as thetrigger; so set Source to either A, B, Ext or AuxIO. These names correspond to theBNC input connectors on the scope device. Then choose one of the trigger typesbelow.
Simple Edge. This type provides the same Rising and Falling edge triggersthat are available from the Triggering toolbar . It is included in this dialog asan alternative method of setting up the Simple Edge trigger.
You can set the trigger Threshold while in the advanced triggering dialog,or alternatively you can drag the Trigger marker on the scope view.
This is the only trigger type that is compatible with ETS mode.
Advanced Edge. This trigger type adds an extra Rising or Falling edgetrigger, and Hysteresis, to the Simple Edge trigger. The Rising or Fallingoption triggers on both edges of a waveform, and is useful for monitoringpulses of both polarities at once. Hysteresis is described in a separatetopic.
Window. This trigger type detects when the signal enters or leaves a specifiedvoltage window. The Direction control specifies whether the trigger shoulddetect the signal entering the window, leaving it, or both. Threshold 1 andThreshold 2 are the upper and lower voltage limits of the window. The order inwhich you specify the two voltages does not matter. Hysteresis can be setto reduce the number of false triggers on a noisy signal, and is described in aseparate topic.
Pulse Width. This trigger type detects pulses of a specified width.
First set the Pulse Direction to either Positive or Negative according to thepolarity of the pulse you are interested in.
Next, set one of the four Condition options:
Greater than triggers on pulses wider than the specified time.
Less than triggers on pulses that are narrower (useful for findingglitches).
Inside time range triggers on pulses that are wider than Time 1 butno wider than Time 2 (useful for finding pulses that meet aspecification).
Outside time range does the opposite: it triggers on pulses that areeither narrower than Time 1 or wider than Time 2 (useful for findingpulses that violate a specification).
Next, set the trigger Threshold in volts or other units, or drag the Triggermarker on the scope view.
Finally, set up Time 1 (and Time 2 if present) to define the pulse width.
129
127
15
173
132
132
15

OMEGASCOPE™ User's Guide 131
M5064
Interval. This type lets you search for two successive edges of the samepolarity that are separated by a specified interval of time.
First, set the Starting edge to either Rising or Falling according to thepolarity of the edges you are interested in.
Next, select one of the four Condition options:
Greater than triggers when the second edge occurs later than Time 1after the first edge (useful for detecting missing events).
Less than triggers when the second edge occurs earlier than Time 1after the first edge (useful for detecting timing violations and spuriousedges).
Inside time range triggers when the second edge is later than Time 1after the first edge and earlier than Time 2 (useful for finding validedges).
Outside time range triggers when the second edge is earlier thanTime 1 after the first edge or later than Time 2 (useful for findingspurious edges).
Finally, set up Time 1 (and Time 2 if present) to define the time interval.
Window pulse width. This is a combination of the window trigger and thepulse width trigger. It detects when the signal enters or leaves a voltage rangefor a specified period of time.
Level dropout. This detects an edge followed by a specified time with noedges. It is useful for triggering on the end of a pulse train.
Window dropout. This is a combination of the window trigger and the dropouttrigger. It detects when the signal enters a specified voltage range and staysthere for a specified time. This is useful for detecting when a signal gets stuckat a particular voltage.
Runt. Detects a pulse that crosses one threshold and then falls below the samethreshold, without crossing the second threshold. This is typically used forfinding pulses that fail to reach a valid logic level.
Logic. This can detect a number of logical combinations of the scope’s fourinputs: A, B, Ext and AUXIO. The conditions that can be applied to each inputvary: A and B can be edge-, level- or window-qualified; Ext is level-qualifiedwith a variable threshold; and AUXIO is level-qualified with a fixed TTLthreshold.
You can choose to combine the channels with an AND, NAND, OR, NOR, XOR orXNOR function.

Toolbars and buttons132
M5064
7.7.2.1 Hysteresis
Hysteresis is a feature of the advanced trigger types in OMEGASCOPE™ thatreduces false triggering on noisy signals. When hysteresis is enabled, a second triggerthreshold voltage is used in addition to the main trigger threshold. The trigger firesonly when the signal crosses the two thresholds in the correct order. The firstthreshold arms the trigger, and the second causes it to fire. An example will help toillustrate how this works.
Noisy signal with a single threshold
Consider the very noisy signal above. It is difficult to trigger reliably on this signalwith a normal rising edge trigger because it crosses the trigger threshold, the red linein this picture, several times in one cycle. If we zoom in on the highlighted parts ofthe signal, we will see how hysteresis can help.
Noisy signal with hysteresis threshold
In these zoomed-in views, the original threshold is the lower red line. The upper redline is the second threshold used by the hysteresis trigger.
The signal rises across the lower threshold at (1) and (2), arming the trigger but notfiring it. At (3) the signal finally crosses the upper threshold, firing the trigger. On thefalling edge of the signal, at (4) and (5), rising edges of noise pulses cause the signalto cross the upper and lower thresholds, but in the wrong order, so the trigger is notarmed and does not fire. Thus the trigger occurs at only one well-defined point in thecycle (3), despite the noise on the signal.
Hysteresis is enabled by default for all the advanced trigger types. The Hysteresiscontrols in the Advanced triggering dialog let you change the hysteresis voltage as
a percentage of full scale. The trigger marker shows the size of the hysteresiswindow.
130
129

OMEGASCOPE™ User's Guide 133
M5064
7.8 Zooming and Scrolling toolbarThe Zooming and Scrolling toolbar allows you to move around a scope view orspectrum view . Each button has a keyboard shortcut, as listed below.
Ctrl+SorEsc
Normal Selection tool. Restores the pointer to its normalappearance. You can use this pointer to click buttons, drag rulersand operate any other controls in the OMEGASCOPE™ window.
Ctrl+D Hand tool. Turns the pointer into a hand ( ) that you can use toclick and drag the view to pan it vertically and horizontally when youare zoomed in. You can also pan using the scroll bars. Press the Esckey to return to the Normal Selection tool.
Ctrl+M Marquee Zoom tool. This button turns the pointer into a marquee
zoom tool: . Use it to draw a box (called a marquee) on the viewand OMEGASCOPE™ will magnify that box to fill the view. Scroll barswill appear, which you can drag to pan around in the view, or youcan pan by using the Hand tool (see above). Zooming in also opensthe Zoom Overview window. Press the Esc key to return to theNormal Selection tool.
If you point to the time axis, the pointer changes into the horizontal
marquee zoom tool ( ), which restricts zooming to the horizontalaxis. This lets you zoom in by an arbitrary amount without disturbingthe vertical zoom factor.
Ctrl+I Zoom-in tool. Turns the pointer into a zoom-in tool: . Click onthe view with this tool to zoom in to the specified location. Zoomingin also opens the Zoom Overview window.
If you point to the time axis, the pointer changes into the horizontal
zoom-in tool ( ), which restricts zooming to the horizontal axis.This lets you zoom in without disturbing the vertical zoom factor.
Ctrl+O Zoom-out tool. Turns the pointer into a zoom-out tool: . Click onthe view with this tool to zoom out around the specified location.
If you point to the time axis, the pointer changes into the horizontal
zoom-out tool ( ), which restricts zooming to the horizontal axis.This lets you zoom out without disturbing the vertical zoom factor.
Undo zoom. Returns the view to the previous zoom and pansettings.
Ctrl+U Zoom to full view. Resets the view to normal size. The view will nolonger have scroll bars, and panning will no longer be possible.
13
16
174
134
134

Toolbars and buttons134
M5064
7.8.1 Zoom OverviewWhenever you zoom in using the Zooming and Scrolling toolbar , the ZoomOverview window should appear*:
The Zoom Overview shows the full waveformson all enabled channels. The rectangle indicatesthe area that is visible in the current view.
You can move around the waveform by draggingthe rectangle.
You can also adjust the zoom factor by draggingthe edges of the rectangle to resize it.
Minimize button: reduce the Zoom Overviewwindow in size without affecting the zoomsettings.
Close button: close the Zoom Overview windowand return the zoom factor to 100%.
*Note: if the Zoom Overview does not appear, the feature may have been switchedoff. Check the Zoom Overview option in Tools > Preferences > Options .
133
47 89 99

OMEGASCOPE™ User's Guide 135
M5064
8 How to...This chapter explains how to perform some common tasks.
Change to a different scope deviceUse rulers to measure a signalMeasure a time differenceMove a viewHow to scale and offset a signalHow to set up the spectrum viewFind a glitch using persistence modeSet up a Mask Limit TestSave on trigger
136
137
138
139
140
145
146
150
153

How to...136
M5064
8.1 How to change to a different deviceUnplug the old devicePlug in the new device
OMEGASCOPE™ detects that the device has changed and immediately starts using thenew one.
If more than one device is connected then you will see the Connect Device dialog, which allows you to select a device to use.
174
101

OMEGASCOPE™ User's Guide 137
M5064
8.2 How to use rulers to measure a signalUsing a single ruler for signal-to-ground measurements
Look at the Channels toolbar to find the color code for the channel you wishto measure:
Find the ruler handle (the small colored square in the top-left or top-right corner ofthe scope view or spectrum view ) of this color:
Drag the ruler handle downwards. A signal ruler (horizontal broken line) willappear across the view. Release the ruler handle when the ruler is where you wantit.
Look at the ruler legend (the small table that appears on the view). It shouldhave a row marked by a small colored square matching the color of your rulerhandle. The first column shows the signal level of the ruler.
Using two rulers for differential measurements
Follow the steps above for "using a single ruler".Drag the second ruler handle of the same color downwards until its ruler is at thesignal level to be measured.Look at the ruler legend again. The second column now shows the signal level ofthe second ruler, and the third column shows the difference between the two rulers.
106 173
13 16
21
23
23

How to...138
M5064
8.3 How to measure a time differenceFind the time ruler handle (the small white square in the bottom left corner of thescope view ).
Drag the ruler handle to the right. A time ruler (vertical broken line) will appearon the scope view. Release the ruler handle when the ruler is at the time you wishto use as the reference.
Drag the second white ruler handle to the right until its ruler is at the time to bemeasured.Look at the ruler legend (the small table that appears on the scope view). Itshould have a row marked by a small white square. The first two columns show thetimes of the two rulers, and the third column shows the time difference.
The frequency legend shows 1/ , where is the time difference.
You can use a similar method to measure a frequency difference on a spectrum view.
13
22
23
23
16

OMEGASCOPE™ User's Guide 139
M5064
8.4 How to move a viewYou can easily drag a view from one viewport to another. This example showsfour viewports, which contain scope views called "Scope 1" to "Scope 4". Supposethat you wish to move the "Scope 4" view to the top left viewport.
1. Click on the name tab of the "Scope 4" viewand hold the mouse button down.
2. Drag the mouse pointer to the new locationnext to the name tab of the "Scope 1" view.
3. Release the mouse button, and the view willmove to the new location.
12 174
13

How to...140
M5064
8.5 How to scale and offset a signalOMEGASCOPE™ offers two ways to change the size and position of a signal during orafter capture. These methods apply equally to scope views and spectrum views .They do not change the stored data, only the way in which it is displayed. Theseoptions are provided in addition to the analog offset capability of the OMSP-3000Series scopes.
Global zooming and scrolling
This is usually the quickest way to get a closer look at the fine detail on your signals.The global zooming and scrolling tools move all the signals at once and are found onthe zooming and scrolling toolbar.
When a view is zoomed in, it has vertical and horizontal scroll bars that let you movethe signals around as a group. You can also use the hand tool to scroll around thegraph.
Axis scaling and offset
Use these tools to position individual signals on the graph (unlike the global zoomingand scrolling tools, which are applied to all of the signals at the same time). Axisscaling and offset tools are ideal when a signal on one channel is smaller than onanother or when you just want to make the best use of available screen space.Common uses are: -
Aligning signals that have different amplitudes or offsets, for an overlaycomparison:
13 16
108
133

OMEGASCOPE™ User's Guide 141
M5064
Arranging the signals in their own rows for side-by-side comparison:
Click the scaling button at the bottom of the axis you wish to modify, and theaxis scaling controls will appear. To adjust the offset without using the axis scalingcontrols, click on the vertical axis and drag it up or down.
How to use these tools together
These global and axis-specific tools work smoothly together and make it easy to movearound your data once you know how. We will take a look at a common example ofusage to explain how the tools can be used together.
Consider this common setup where all 4 channels are being displayed on thecentreline of the graph.
109
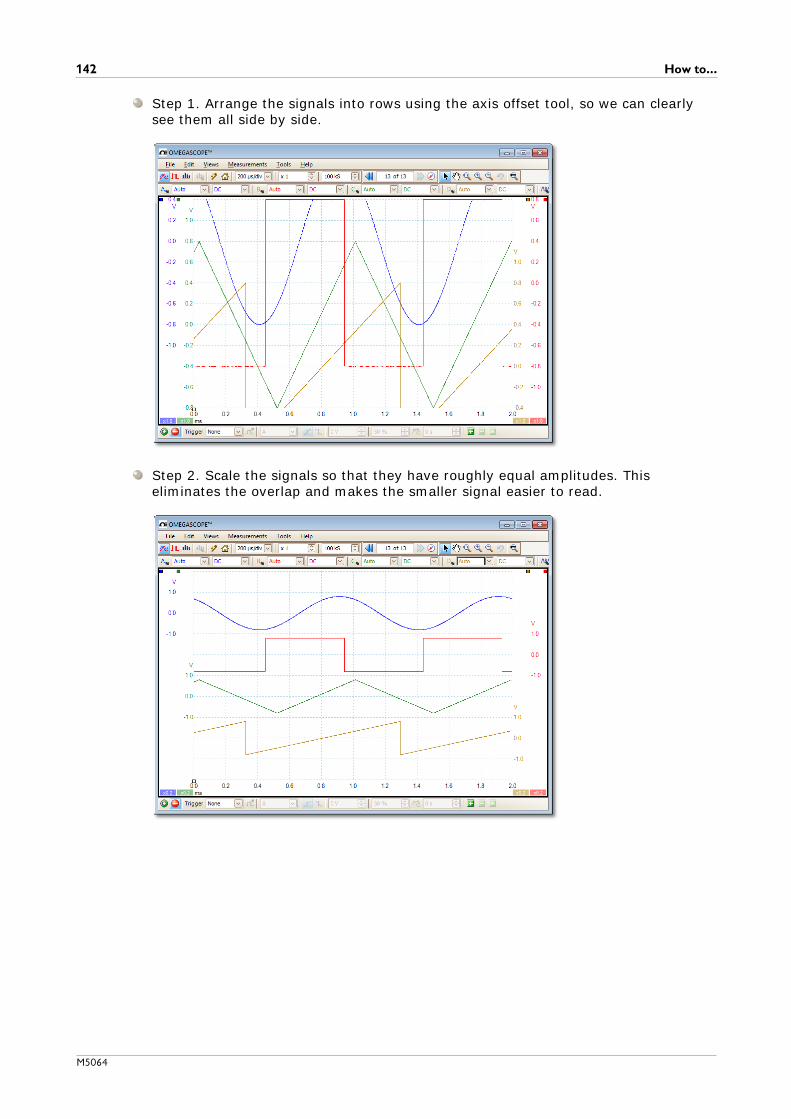
How to...142
M5064
Step 1. Arrange the signals into rows using the axis offset tool, so we can clearlysee them all side by side.
Step 2. Scale the signals so that they have roughly equal amplitudes. Thiseliminates the overlap and makes the smaller signal easier to read.

OMEGASCOPE™ User's Guide 143
M5064
Step 3. Now we want to take a closer look at a specific time range of the signal ingreater detail. We don’t want to mess around with the neat axis scaling and offsetthat we have spent time creating, so instead we use the global windowed-zoomtool to select a specific section of the entire graph to zoom.
We can of course use the scrollbars or the hand tool to navigate around this zoomedview without ever changing our carefully arranged signals. Clicking the Zoom 100%button will take us back to the full view of our data; and again, this happens withoutaffecting our axis scaling and offset set-up.

How to...144
M5064
How is this different from scaling my data with a Custom Probe?
You can create a Custom Probe to apply scaling to the raw data. A Custom Probemay change the scale and position of data on the graph but it has a few importantdifferences from the other scaling methods.
Custom Probe scaling is a permanent transformation. The scaling is applied whenthe data is captured and cannot be changed afterwards.The actual data values themselves are changed so the graph axes may no longerdisplay the voltage range of the device.Custom Probe scaling can be nonlinear and so may alter the shape of the signal.
Custom Probes are useful when you want to represent the characteristics of a physicalprobe or transducer that you plug into your scope device. All of the zooming, scrolling,scaling and offset tools still apply to data that has been scaled with a Custom Probe inexactly the same way that they would apply to the raw data.
24

OMEGASCOPE™ User's Guide 145
M5064
8.6 How to set up the spectrum viewCreating a spectrum view
First, ensure that the trigger mode is not set to ETS , as it is not possible to opena spectrum view in ETS trigger mode.
There are three ways to open a spectrum view :
Click the Spectrum Mode button in the Capture Setup toolbar . We recommendusing this method to get the best spectrum analysis performance from your scope.Once in Spectrum Mode, you can still open a scope view to see your data in thetime domain, but OMEGASCOPE™ optimizes the settings for the spectrum view.
Go to the Views menu select Add view, then select Spectrum.
This method opens a spectrum view in the currently selected mode, whether this isScope Mode or Spectrum Mode. For best results, we recommend that you switch toSpectrum Mode, as described in the method immediately above.
Right-click on any view , select Add view, then select Spectrum. The menu issimilar to the Views menu shown above.
Configuring the spectrum view
See Spectrum Settings dialog .
Selecting the source data
OMEGASCOPE™ can produce a spectrum view based on either live or stored data. IfOMEGASCOPE™ is running (the Start button is pressed in), the spectrum viewrepresents live data. Otherwise, with OMEGASCOPE™ stopped (the Stop buttonpressed in), the view represents data stored in the currently selected page of thewaveform buffer. When OMEGASCOPE™ is stopped, you can use the buffer controlsto scroll through the buffer and the spectrum view will be recalculated from thewaveform currently selected.
127 173
16
112
40
13
40
114
16
126
126
105

How to...146
M5064
8.7 How to find a glitch using persistence modePersistence mode helps you find rare events hidden in otherwise repetitivewaveforms. In normal scope mode, such an event may appear on the display for afraction of a second, too quickly for you to press the space bar to freeze it on thescreen. Persistence mode keeps the event on the display for a predetermined time,allowing you to set up the trigger options to capture it more reliably.
Step-by-step guide
Set up the scope to trigger on a repetitive waveform like the one below. We suspectthat there are occasional glitches but we can see nothing wrong yet, so we shalluse persistence mode to investigate.Click the Persistence Mode button to continue.
17
10

OMEGASCOPE™ User's Guide 147
M5064
Our original scope view is replaced by a persistence view, as shown below.Immediately, we can see three pulses with different shapes. At this point we havethe Saturation control in Persistence Options turned up to maximum to helpus spot the various waveforms easily.
116

How to...148
M5064
Now that we have found some glitches, we will turn the Saturation control downto minimum. Click the Persistence options button to open the PersistenceOptions dialog , and then use the slider to adjust the saturation. The displaythen appears as below.
The waveforms are now darker but have a wider range of colors and shades. Themost frequently occurring waveform is shown in red, and is the normal shape of thepulse. A second waveform is drawn in light blue to shows that it occurs lessfrequently, and it shows us that there is an occasional jitter of about 10 ns in thepulse width. The third waveform is drawn in dark blue because it occurs lessfrequently than the other two, and indicates that there is an occasional runt pulseabout 300 mV lower in amplitude than normal.
116

OMEGASCOPE™ User's Guide 149
M5064
Persistence mode has done its job. We have found our glitches, and now we wantto examine them in more detail. The best way to do this is to switch back tonormal scope mode , so that we can use the advanced triggering andautomatic measurement functions built in to OMEGASCOPE™.
Click the Scope Mode button. Set up an advanced pulse-width trigger to look fora pulse wider than 60 ns. OMEGASCOPE™ then finds the runt pulse straight away.
We can now add automatic measurements or drag the rulers into place to analyse therunt pulse in detail.
10 130
18
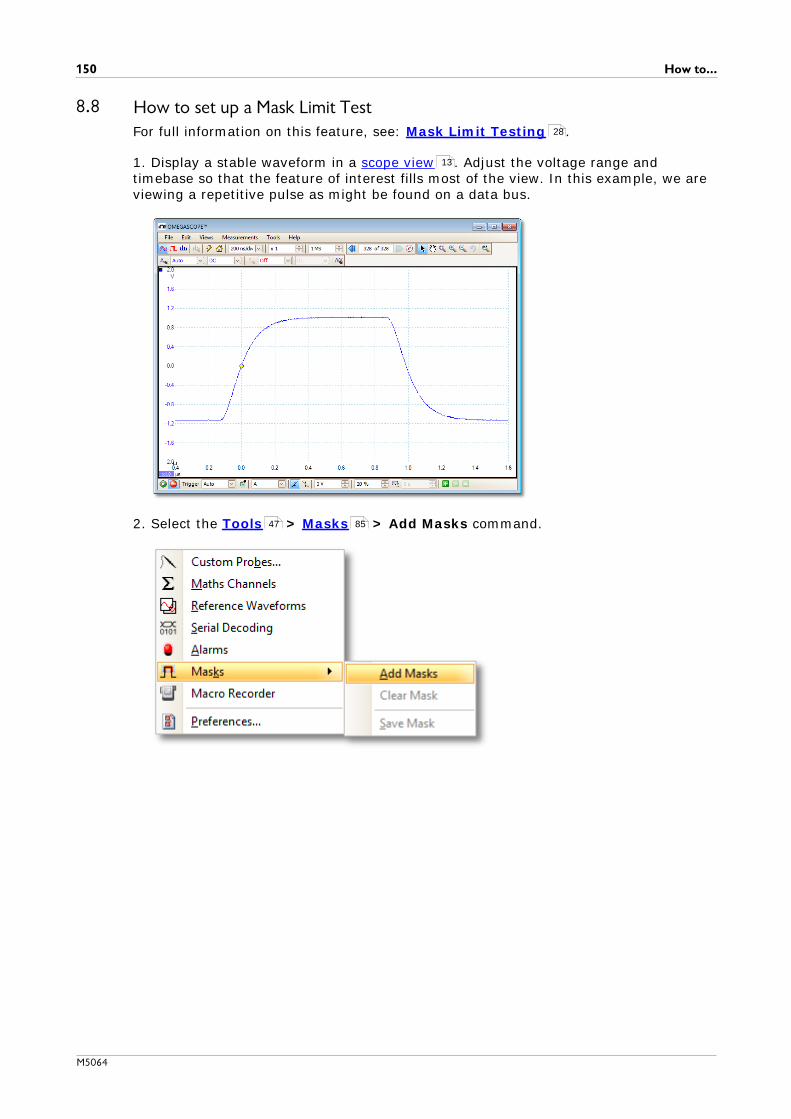
How to...150
M5064
8.8 How to set up a Mask Limit TestFor full information on this feature, see: Mask Limit Testing .
1. Display a stable waveform in a scope view . Adjust the voltage range andtimebase so that the feature of interest fills most of the view. In this example, we areviewing a repetitive pulse as might be found on a data bus.
2. Select the Tools > Masks > Add Masks command.
28
13
47 85

OMEGASCOPE™ User's Guide 151
M5064
3. You should now be in the Mask Library dialog :
Channel A is selected by default. You can change this if you want to apply the maskto a different channel.
4. Click the Generate button to open the Generate Mask dialog :
85
90

How to...152
M5064
5. For now, accept the default settings and click Generate. Then click OK in the MaskLibrary dialog to return to the scope view:
You now have a mask drawn around the original waveform.
6. OMEGASCOPE™ stops capturing when you enter the Mask Library dialog , sopress the space bar to restart. If any captured waveform fails to fit inside the mask,the offending parts are drawn in a contrasting color. The Measurements tableshows the number of failures:
7. You now have a functioning mask limit test. Please read the Mask Limit Testtopic for information on editing, importing and exporting masks. It is also possible toset up a Mask Limit Test on a spectrum or XY view.
85
85
18
28
16 14

OMEGASCOPE™ User's Guide 153
M5064
8.9 How to save on triggerSave-on-trigger is just one of a number of functions that are possible with theAlarms feature.
1. Set up OMEGASCOPE™ to display your waveform, and enable triggering:
2. Select the Tools > Alarms command:
83
47 83

How to...154
M5064
3. You should now be in the Alarms dialog :
4. Set Event to Capture:
83

OMEGASCOPE™ User's Guide 155
M5064
5. Select the first item in the Actions list, click Edit, and change Action to SaveCurrent Buffer:
6. Click the button to the right of the File box and enter the name and location ofthe file to save:

How to...156
M5064
7. Ensure that both the Save Current Buffer check box and the Enable Alarm checkbox are set:
8. Click OK. OMEGASCOPE™ will now save a file on every trigger event.
9. Switch off the alarm when you have finished using it, to avoid creating unwantedfiles.

OMEGASCOPE™ User's Guide 157
M5064
9 ReferenceThis is where you can find detailed information on the operation of OMEGASCOPE™.
Measurement typesSpectrum window functionsSerial protocolsTrigger timingCommand-line syntaxGlossary
9.1 Measurement typesThe Edit Measurement dialog allows you to select one of a range of measurementsthat OMEGASCOPE™ can calculate for the selected view. The list of measurementsavailable depends on whether the view is a scope view (see scope measurements
) or a spectrum view (see spectrum measurements ).
157
162
165
163
171
173
44
13
158 16 159

Reference158
M5064
9.1.1 Scope measurementsAC RMS. The root mean square (RMS) value of the waveform minus the DC Average.It is equivalent to a ripple measurement.
Cycle Time. OMEGASCOPE™ will attempt to find a repeated pattern in the waveformand measure the duration of one cycle.
DC Average. The mean value of the waveform.
Duty Cycle. The amount of time that a signal spends above its mean value,expressed as a percentage of the signal period. A duty cycle of 50% means that thehigh time is equal to the low time.
Falling Rate. The rate at which the signal level falls, in signal units per second. Clickthe Advanced button in the Add Measurement or Edit Measurement dialog tospecify the signal level thresholds for the measurement.
Frequency. The number of cycles of the waveform per second.
Fall Time. The time the signal takes to fall from the upper threshold to the lowerthreshold. Click the Advanced button in the Add Measurement or EditMeasurement dialog to specify the signal level thresholds for the measurement.
High Pulse Width. The amount of time that the signal spends above its mean value.
Low Pulse Width. The amount of time that the signal spends below its mean value.
Maximum. The highest level reached by the signal.
Minimum. The lowest level reached by the signal.
Peak To Peak. The difference between maximum and minimum.
Rise Time. The time the signal takes to rise from the lower threshold to the upperthreshold. Click the Advanced button in the Add Measurement or EditMeasurement dialog to specify the signal level thresholds for the measurement.
Rising Rate. The rate at which the signal level rises, in signal units per second. Clickthe Advanced button in the Add Measurement or Edit Measurement dialog tospecify the signal level thresholds for the measurement.
True RMS. The root mean square (RMS) value of the waveform, including the DCcomponent.
Mask Failures. A special measurement that counts the number of failed waveformsin Mask Limit Testing mode. This measurement is added to the table automaticallywhen you use Mask Limit Testing, so there is usually no need to select it manually.
28

OMEGASCOPE™ User's Guide 159
M5064
9.1.2 Spectrum measurementsTo add a spectrum measurement, open a spectrum view and then click the AddMeasurement button. You can use these measurements in either scope mode orspectrum mode .
Frequency at peak. The frequency at which the peak signal value appears.
Amplitude at peak. The amplitude of the peak signal value.
Average amplitude at peak. The amplitude of the peak signal value averaged over anumber of captures.
Total power. The power of the whole signal captured in the spectrum view,calculated by adding the powers in all of the spectrum bins.
Total Harmonic Distortion (THD). The ratio of the sum of harmonic powers to thepower at the fundamental frequency.
Total Harmonic Distortion plus Noise (THD+N). The ratio of the harmonic powerplus noise to the fundamental power. THD+N values are always greater than the THDvalues for the same signal.
Spurious-free Dynamic Range (SFDR). This is the ratio of the amplitude of thespecified point (normally the peak frequency component) and the frequencycomponent with the second largest amplitude (call it "SFDR frequency"). Thecomponent at the "SFDR frequency" is not necessarily a harmonic of the fundamentalfrequency component. For example, it might be a strong, independent noise signal.
Signal+Noise+Distortion to Signal+Noise Ratio (SINAD). The ratio, in decibels,of the signal-plus-noise-plus-distortion to noise-plus-distortion.
Signal to Noise Ratio (SNR). The ratio, in decibels, of the mean signal power to themean noise power. Hanning or Blackman windows are recommended because of theirlow noise.
16
118 10
10

Reference160
M5064
Intermodulation Distortion (IMD). A measure of the distortion caused by thenonlinear mixing of two tones. When multiple signals are injected into a device,modulation or nonlinear mixing of these two signals can occur. For input signals atfrequencies f1 and f2, the two second-order distortion signals will be found atfrequencies: f3 = (f1 + f2) and f4 = (f1 - f2).
IMD is expressed as the dB ratio of the RMS sum of the distortion terms to the RMSsum of the two input tones. IMD can be measured for distortion terms of any order,but the second-order terms are most commonly used. In the second-order case, theintermodulation distortion is given by:
where
F3 and F4 are the amplitudes of the two second-order distortion terms (atfrequencies f3 and f4 defined above)
and
F1 and F2 are the amplitudes of the input tones (at frequencies f1 and f2, asmarked by the frequency rulers in the spectrum window).
For reference, the third-order terms are at frequencies (2F1 + F2), (2F1 - F2), (F1 +2F2) and (F1 - 2F2).
Note: Hanning or Blackman windows are recommended because of their low noise. AnFFT size of 4096 or greater is recommended in order to provide adequate spectralresolution for the IMD measurements.
Mask Failures. See Mask Limit Testing .28

OMEGASCOPE™ User's Guide 161
M5064
9.2 Signal generator waveform typesThe list of waveform types available in the Signal Generator dialog variesaccording to the type of oscilloscope connected. The full list is as follows:
Sine Sinusoid
Square Square wave
Triangle Symmetrical triangle wave
RampUp Rising sawtooth
RampDown Falling sawtooth
Sinc sin(x)/x, truncated on the x axis
Gaussian The 'bell curve' of the normal distribution,truncated on the x axis
HalfSine The positive half of a sinusoid
WhiteNoise Random samples with the maximum possiblebandwidth
PRBS Pseudo-random binary sequence. A randomsequence of bits.
DCVoltage Constant voltage, adjustable using the Offsetcontrol.
Arbitrary As defined by the arbitrary waveform editor.
119

Reference162
M5064
9.3 Spectrum window functionsTo create a spectrum view , OMEGASCOPE™ captures a block of sampled data overa finite time interval and then uses a Fast Fourier Transform to compute its spectrum.The algorithm assumes a signal level of zero at all times outside the captured timeinterval. Typically, this assumption causes sharp transitions to zero at either end ofthe data, and these transitions have an effect on the computed spectrum, creatingunwanted artefacts such as ripple and gain errors. To reduce these artefacts, thesignal can be faded in and out at the start and end of the block. There are severalcommonly used "window functions" that can be convolved with the data to effect thisfading, and which are chosen according to the type of signal and the purpose of themeasurement.
The Window Functions control in the Spectrum Options dialog lets you selectone of the standard window functions for spectrum analysis. The following table showssome of the figures of merit used to compare the functions.
Window Main peakwidth (bins@ -3 dB)
Highest side lobe(dB)
Side lobe roll-off(dB/octave)
Notes
Blackman 1.68 -58 18 often used for audio work
Gaussian 1.33 to 1.79 -42 to -69 6 gives minimal time andfrequency errors
Triangular 1.28 -27 12 also called Bartlett window
Hamming 1.30 -41.9 6 also called raised sine-squared;used in speech analysis
Hann 1.20 to 1.86 -23 to -47 12 to 30 also called sine-squared; usedfor audio & vibration
Blackman-Harris 1.90 -92 6 general-purpose
Flat-top 2.94 -44 6 negligible pass-band ripple;used mainly for calibration
Rectangular 0.89 -13.2 6 no fading; maximal sharpness;used for short transients
16
114

OMEGASCOPE™ User's Guide 163
M5064
9.4 Trigger timing (part 1)The pre-trigger time control and post-trigger delay control functions aredescribed individually under "Triggering toolbar" , but the interaction between thetwo controls is also important to understand. Here is a screen shot of a scope viewwith post-trigger delay enabled:
Note 1. The trigger reference point ( ) does not lie on the waveform. This is becausethe post-trigger delay is set to 200 µs, which means that the trigger occurred200 µs before the reference point, somewhere off the left-hand edge of thescope view. The time axis is aligned so that the trigger reference point isat 200 µs.
Note 2. The pre-trigger delay is set to 25%, which makes the trigger reference pointappear 25% of the way across the scope view from the left-hand edge.
Note 3. OMEGASCOPE™ limits the trigger-to-reference-point delay to a multiple of thetotal capture time. Once you have reached this limit, the program will not letyou increase the pre-trigger delay, and if you increase the post-trigger delay,OMEGASCOPE™ will reduce the pre-trigger delay to stop the total exceedingthe limit. The multiple is typically 100 in most trigger modes, and 1 in ETSmode.
127
13
13
173

Reference164
M5064
9.5 Trigger timing (part 2)"Trigger timing (part 1) " introduced the concepts of pre-trigger delay and thepost-trigger delay . This diagram below shows how they are related.
The pre-trigger delay positions the scope view in relation to the trigger referencepoint so that you can choose how much of the waveform should be before thereference point, and how much after it.
The post-trigger delay is like the delayed trigger of a conventional oscilloscope.OMEGASCOPE™ waits for this time after the trigger event before drawing the triggerreference point. Scope devices have a limit to the number of sampling intervals thatcan elapse between the trigger event and the end of the capture, so the software mayadjust the pre-trigger delay to keep within this limit.
Tip: If you have set up a post-trigger delay, you can click the post-trigger delaybutton while the scope is running whenever you want to switch between viewing thetrigger event and the trigger reference point.
163 127
127
13

OMEGASCOPE™ User's Guide 165
M5064
9.6 Serial protocolsThe serial decoding function can decode the following serial protocols:
CAN BusI2C BusRS-232 (UART)SPI Bus
27
166
168
169
170

Reference166
M5064
9.6.1 CAN Bus protocolYou can decode CAN Bus data using the serial decoding feature built intoOMEGASCOPE™.
About CAN Bus
CAN (Controller Area Network) Bus is a serial protocol used in automotive andindustrial machinery to allow microcontrollers to communicate with each other. Thestandard was originally developed in 1983 by Robert Bosch GmbH. It typically usesdifferential signalling (with signals named CAN H and CAN L) to increase noiseimmunity. OMEGASCOPE™ supports CAN Bus bit rates from 10 kbit/s to 1 Mbit/s.
The in-window view of the data looks like this:
The columns in the data table are as follows:
Column DescriptionNo. Serial number of the frame (decimal). If Accumulate mode is off,
this counts from the start of the selected waveform. If Accumulatemode is on, this counts from the start of the first waveform in thewaveform buffer.
ID Identifier (hexadecimal). Should be unique for a specified datatype. Base frames have an 11-bit identifier, and extended frameshave a 29-bit identifier.
Frame CAN Bus data is divided into frames, each consisting of a numberof bits. A frame can be any of the following types:
Data: contains data destined for a nodeRemote: a request for the transmission of a specific identifierError: transmitted by a node that detects an errorOverload: inserted to add a delay between framesInterframe: time interval preceding data frames and remoteframes
Any frame can also be a base frame or an extended frame.
RTR Remote transmission request
SRR Used only in extended frames
IDE Identifier extension bit
R0 Reserved bit
27

OMEGASCOPE™ User's Guide 167
M5064
R1 Reserved bit, extended frames only
DLC Data length code. Indicates the number of bytes of data.
Data bytes The data content of the message, DLC bytes long (hexadecimal)
CRC Sequence A cyclic redundancy check of the data (hexadecimal)
CRC Delimiter A fixed bit following the CRC Sequence field
Ack Slot Node asserts this bit to acknowledge receipt
Ack Delimiter A fixed bit following the Ack Slot field
Error Set if OMEGASCOPE™ detects an error
Start Time Value of OMEGASCOPE™ timebase at start of frame
End Time Value of OMEGASCOPE™ timebase at end of frame

Reference168
M5064
9.6.2 I²C Bus protocolYou can decode I2C Bus data using the serial decoding feature built intoOMEGASCOPE™.
About I2C Bus
I2C (Inter-Integrated Circuit) Bus is a serial protocol used mainly in consumerelectronics for communications between devices on the same circuit board, andbetween computers and displays. The standard was originally developed in the 1980sby Philips. It uses two signals: clock (SCL) and data (SDA). Speeds up to 3.4 Mbit/sare possible.
The in-window view of the data looks like this:
The columns in the data table are as follows:
Column DescriptionNo. Serial number of the packet (decimal). If Accumulate mode is
off, this counts from the start of the selected waveform. If Accumulate mode is on, this counts from the start of the firstwaveform in the waveform buffer.
Packet Packet type: Start, Stop, Address, Data or Unknown.
Address Shown for address packets.
Read/Write Polarity of the Read/Write flag.
Data bytes Contents of data packets.
Acknowledge Whether the destination acknowledged the packet.
Baud Rate The signalling rate detected for this packet.
Start Time Time according to OMEGASCOPE™ timebase at start of frame.
End Time Time according to OMEGASCOPE™ timebase at end of frame.
27

OMEGASCOPE™ User's Guide 169
M5064
9.6.3 RS232/UART protocolYou can decode RS232 (UART) data using the serial decoding feature built intoOMEGASCOPE™.
About RS232
RS232 is the serial data standard used by UARTs (Universal Asynchronous Receiver/Transmitters) in the "serial" or "COM" ports once commonly found on computers. Itwas developed in the 1960s for connecting modems to terminals. The full standarduses a voltage swing of ±12 V, larger than most other standards. Data rates of 115kbit/s are possible. The simplest RS232 connection consists of two signals: Rx(receive) and Tx (transmit).
The in-window view of the data looks like this:
The columns in the data table are as follows:
Column DescriptionNo. Serial number of the packet (decimal). If Accumulate mode is
off, this counts from the start of the selected waveform. If Accumulate mode is on, this counts from the start of the firstwaveform in the waveform buffer.
Packet Packet type: all packets in this format are classified as Data.
Start Bit If present, this is the fixed "1" bit at the start of the word.
Data bytes Contents of data packets.
Parity Bit The error-correction bit, if present, at the end of the word.
Stop Bit If present, this is the fixed "1" bit at the end of the word.
Error Indicates whether there was a data error.
Start Time Time according to OMEGASCOPE™ timebase at start of frame.
End Time Time according to OMEGASCOPE™ timebase at end of frame.
27

Reference170
M5064
9.6.4 SPI Bus protocolYou can decode SPI Bus data using the serial decoding feature built intoOMEGASCOPE™.
About SPI Bus
SPI (Serial Peripheral Interface) Bus is a serial data standard used for communicationbetween microprocessors and peripheral devices. It was developed by Motorola. Theoriginal standard uses a 4-wire link, although 3-wire and 2-wire versions are alsoused.
The in-window view of the data looks like this:
The columns in the data table are as follows:
Column DescriptionNo. Serial number of the packet (decimal). If Accumulate mode is
off, this counts from the start of the selected waveform. If Accumulate mode is on, this counts from the start of the firstwaveform in the waveform buffer.
Packet Packet type: Start, Stop, Address, Data or Unknown.
Data bytes Contents of data packets.
Start Time Time according to OMEGASCOPE™ timebase at start of frame.
End Time Time according to OMEGASCOPE™ timebase at end of frame.
27

OMEGASCOPE™ User's Guide 171
M5064
9.7 Command-line syntaxTo display the GUI
OMEGASCOPE <filename>
<filename> Specifies a single .psdata or .pssettings file.
Example: OMEGASCOPE C:\Temp\source.psdata
To display help
OMEGASCOPE /?
Shows help on all command line options.
To convert psdata files
OMEGASCOPE /C,/c
Converts a psdata file from one format to another. Cannot be used with /p[rint].
Syntax:
OMEGASCOPE /c[onvert] <names> [/d <names>] /f <format> [/q] [/b [<n>[:<m>]] | [all]] [/v <viewportname>]
<names> Specifies a list of one or more directories or psdata files.Wildcards may be used to specify multiple files. If adirectory is specified, all psdata files within thatdirectory will be specified. This is a mandatoryargument.
/d <names> Destination. Default is input filename with newextension.
/f <format> Destination format: csv, txt, png, bmp, gif, a[nimated]gif, psdata, pssettings, matlab. This is a mandatoryargument.
/q Quiet mode. Do not ask before overwriting files. Thedefault is to prompt.
/b [<n>[:<m>]]|all Waveform number n, waveform range n to m or allwaveforms. The default is the current waveform.
/v <viewportname> View to convert. Default is current view.
Example:
OMEGASCOPE /c C:\Temp\source.psdata /f png /b 5:9 /v Scope2

Reference172
M5064
To print a view
OMEGASCOPE /P,/p
Prints a view in the psdata file. Cannot be used with /c[onvert].
Syntax:
OMEGASCOPE /p[rint] <names> [/b [<n>[:<m>]] | all] [/v <viewportname>]
<names> Specifies a list of one or more directories or .psdata files. Wildcardsmay be used to specify multiple files. If a directory is specified, all.psdata files within that directory will be specified. This is amandatory argument.
/b [<n>[:
<m>]]|all Waveform number n, waveform range n to m or all buffers. Defaultis current waveform.
/v<viewportname
>
View to convert. Default is current view.
Example:
OMEGASCOPE /p C:\Temp\source.psdata /b 5:9 /v Scope2

OMEGASCOPE™ User's Guide 173
M5064
9.8 GlossaryAC coupling. In this mode, the scope device rejects very low signal frequencies belowabout 1 hertz. This allows you to use the full resolution of the scope to measure a.c.signals accurately, ignoring any d.c. offset. You cannot measure the signal level withrespect to ground in this mode.
AWG. An arbitrary waveform generator (AWG) is a circuit that can generate awaveform of almost any shape. It is programmed with a data file, supplied by theuser, which defines the output voltage at a number of equally spaced points in time.The circuit uses this data to reconstruct the waveform with a specified amplitude andfrequency.
Axis. A line marked with measurements. OMEGASCOPE™ shows one vertical axis foreach channel that is enabled in a view, giving measurements in volts or other units.Each view also has a single horizontal axis, which is marked in units of time for ascope view, or units of frequency for a spectrum view.
Channel. A scope device has one or more channels, each of which can sample onesignal. High-speed scope devices typically have one BNC connector per channel.
CSV. Comma-separated values. A form of text file containing a list of values separatedby commas and line-breaks. CSV format is used for importing and exportingOMEGASCOPE™ arbitrary waveform files . You can also export OMEGASCOPE™waveforms in CSV format. CSV files can be imported into spreadsheets and otherprograms.
DC coupling. In this mode, the scope device measures the signal level relative tosignal ground. This shows both d.c. and a.c. components.
Dead time. The time between the end of one capture and the start of the next. Toobtain the minimum possible dead time, use Rapid trigger mode.
Demo mode. If OMEGASCOPE™ is started when no scope device is plugged in, itallows you to select a "demo device", a virtual scope unit that you can use to test thesoftware. The program is then in "demo" (short for "demonstration") mode. This modeprovides a simulated, configurable signal source for each input channel of the demodevice.
ETS. Equivalent Time Sampling. A method of increasing the effective sampling rate ofthe scope. In a scope view, the program captures several cycles of a repetitive signal,then combines the results to produce a single waveform with higher time-resolutionthan a single capture. For accurate results, the signal must be perfectly repetitive andthe trigger must be stable.
Graticule. The horizontal and vertical dashed lines in every view. These help youestimate the amplitude and time or frequency of features on the waveform.
Grid. The arrangement of viewports. The number of grid rows and the number of gridcolumns can each be either 1, 2, 3 or 4.
In focus. OMEGASCOPE™ can display several views, but only one view is in focus atany time. When you click a toolbar button, it will usually affect only the view that is infocus. To bring a view into focus, click on it.
121

Reference174
M5064
PC Oscilloscope. A measuring instrument consisting of a scope device and theOMEGASCOPE™ software running on a PC. A PC Oscilloscope has the same functionsas a traditional bench-top oscilloscope but is more flexible and cost-effective. You canimprove its performance by upgrading the PC using standard parts from any computershop, or by purchasing a new scope device, and you can upgrade the software bydownloading an update from Omega Engineering, Inc.
Probe. An accessory that attaches to your oscilloscope and picks up a signal to bemeasured. Probes are available to pick up any form of signal, but they always delivera voltage signal to the oscilloscope. OMEGASCOPE™ has built-in definitions ofstandard probes, but also allows you to define custom probes.
Progressive mode. Normally, OMEGASCOPE™ redraws the waveform in a scope viewmany times every second. At timebases slower than 200 ms/div, however, it switchesto progressive mode. In this mode, OMEGASCOPE™ updates the scope viewcontinuously as each capture progresses, rather than waiting for a complete capturebefore updating the view.
Resolution enhancement. Collecting samples at a faster rate than requested, thencombining the excess samples by averaging. This technique can increase the effectiveresolution of a scope device when there is a small amount of noise on the signal. (More details.)
Ruler. A vertical or horizontal dashed line that can be dragged into place on awaveform in a view. OMEGASCOPE™ displays the signal level, time value or frequencyvalue of all rulers in the Ruler Legend box.
Scope device. The oscilloscope that you plug into the USB or parallel port of yourcomputer. With the help of the OMEGASCOPE™ software, the scope device turns yourcomputer into a PC Oscilloscope.
Standard deviation. A statistical measure of the spread of a set of samples. Thestandard deviation of the set is defined as:
,
where is the arithmetic mean of all the samples. The units of the standarddeviation value are the same as those of the original samples.
Tool tip. A label that appears when you move the mouse pointer over some parts ofthe OMEGASCOPE™ screen, such as buttons, controls and rulers.
Trigger. The part of an oscilloscope that monitors an incoming signal and decideswhen to begin a capture. Depending on the trigger condition that you set, the scopemay trigger when the signal crosses a threshold, or may wait until a more complexcondition is satisfied.
Vertical resolution. The number of bits that the scope device uses to represent thesignal level. This number is fixed by the design of the device, but a greater effectivenumber can be obtained in some cases by using resolution enhancement .
View. A presentation of data from a scope device. A view may be a scope view ,an XY view or a spectrum view .
Viewport. The views in the OMEGASCOPE™ window are arranged in a grid, andeach rectangular area in the grid is called a viewport.
174
19
19
13
14 16
12 173

OMEGASCOPE™ User's Guide 175
M5064
10 Application Error dialogIf there is a problem with OMEGASCOPE™ and the program needs to close, the Application Error dialog appears:
It would be very helpful to us if you could send us a report of the problem. All youneed to do is click the Send Report button, then save the .zip file in a place where
you can easily find it again, such as on your desktop. Then, email the ..zip file to us
at [email protected], and we will do the rest. Don't worry if you can't think of acomment to enter in the text box: just leave it empty and send the report to usanyway.

Index176
M5064
Index
%%buffer% variable 83
%file% variable 83
%time% variable 83
..bmp files, saving 33
.csv files, saving 33
.gif files, saving 33
.mask files 85
.png files, saving 33
.psdata files
converting 102, 171
saving 33
.psmaths files 63, 67, 70
.psreference files 73
.pssettings files, saving 33
.txt files, saving 33
AAC coupling 173
AC power 91
Accelerometer inputs 106
Add Measurement dialog 44
Adding a measurement 44
Address of company 3
Advanced measurement settings 45
Advanced triggering 127, 129
types 130
Alarms 29, 83
Save on trigger 153
Analog intensity 116
Analog offset 107
Animated GIF 33
Arbitrary waveform generator 119
editing window 122
files 121
importing from channel 124
Average (statistics) 18
AWG 173
Axis 13, 14, 16, 173
auto-arrange 40
horizontal 13, 14, 16
offset 140
scaling 140
scaling controls 109
vertical 13, 14, 16
BBandwidth limiter 107
Battery power 91
Beep 83
Binary files, exporting 36
Bit Definitions dialog 80
Bit stream 122
Buffer Navigation toolbar 105
Buffer Navigator 30
CCAN Bus protocol 166
Capture count 18
Capture modes 10, 11
Capture rate preference 91
Capture Setup toolbar 112
Capture size preference 90
Channel 173
selecting in a view 40
Channel Options
button 106
menu 107
Channel settings
in Properties sheet 24
Channel Setup toolbar
standard 106
Channel warning symbol 25
Clipboard 38
Close file 32
Collection time units 90
Color preferences 97
Column auto-width 43
Command line syntax 171
Connect Device dialog 32, 101
Contact information 3
Converter, how to change 136
Converting data files 102, 171
Copy
as image 38
as text 38
Coupling control 106
Create New Custom Probe dialog 50
CSV files, exporting 35
Cursors (see Rulers) 21, 22, 23
Custom grid layout dialog 42
Custom Probe Manager 47
Custom Probe wizard 50
Create New Custom Probe dialog 50

OMEGASCOPE™ User's Guide 177
M5064
Custom Probe wizard 50
Edit Existing Custom Probe dialog 51
Edit Range dialog 57
Edit Range dialog (Advanced tab) 59
Finished dialog 62
Lookup-table Scaling dialog 54
Manual Ranges Setup dialog 56
Probe ID dialog 61
Probe Output Units dialog 52
Range Management dialog 55
Scaling Method dialog 53
Custom probes 24
dialog 48
saving 32
DData files
converting 102
DC coupling 173
Dead time 173
Decoding tab 27
Default Print Settings 96
Demo device 125
Demo mode 125, 173
Demo Signals
dialog 125
toolbar 125
Digital color 116
Dropout trigger 130
EEdge trigger 130
Edit Existing Custom Probe dialog 51
Edit menu 38
Edit Range dialog 57
Edit Range dialog (Advanced tab) 59
Edit Reference Waveform dialog 74
Effective resolution 19
Email addresses 3
Equation dialog 67
Equivalent-time sampling 127
ETS 127, 173
and Advanced Triggering 129
Exit 32
Exporting data 35
binary format 36
text format 35
FFall time
threshold 45
Falling edge button 127
Fax number 3
File conversion 102
File menu 32
Filter Method dialog 60
Filtering 107
channels 110
measurements 18
statistics 45
Focus 173
Frequency counter 106
Frequency difference, measuring 138
Frequency legend 22, 23
Frequency rulers 22
Functions, mathematical 67
GGeneral preferences 90
Generate mask 85
Generate Mask dialog 87
Glitches, finding 130
Glossary 173
Graticule 13, 14, 16, 173
Grid 173
layout 40, 42
HHand tool 133
Harmonic control for measurements 45
Help menu 100
Horizontal axis 13, 14, 16
House current 91
Hysteresis 132
II²C Bus protocol 168
I2C settings 82
I2C Settings dialog 82
Image, saving as 33
Import from a Channel dialog 124
Input impedance 106
Interpolation
linear 92
sin(x)/x 92
Interval trigger 129, 130
Introduction 3
Invert button 25

Index178
M5064
KKeyboard shortcuts 94, 133
LLanguage preferences 95
Line thicknesses 97
Lissajous figures 14
Logic trigger 130
Lookup-Table Scaling dialog 54
Lowpass filtering 60, 107, 110
MMacro Recorder 88
Mains power 91
Manual Ranges Setup dialog 56
Marquee Zoom tool 133
Mask Limit Testing 28, 47
How To 150
Masks
colors 28, 97
displaying 40
editing 86
export 85
generate 85
import 85
in Buffer Navigator 30
library dialog 85
menu 85
polygons 86
selection dialog 28
Math channels 47
button 106
saving 32
Maths Channel Wizard
Equation dialog 67
Finished dialog 72
Introduction dialog 66
Name and Color dialog 70
overview 65
Units and Range dialog 71
Maths channels 63
Built In 63
dialog 63
Library 63
Loaded 63
overview 25
Matlab 4 files
exporting 36, 73
Max (statistics) 18
Maximum Waveforms preference 90
Measurement statistics
capture size 90
Measurement system
selecting 95
Measurements
adding 18, 43, 44
advanced settings 45
deleting 18, 43
editing 18, 43
filtering 18
font size 43
list of types 157
menu 43
scope 158
spectrum 159
statistics 18
table 18
toolbar 118
Menus 31
Metric measurements 95
Min (statistics) 18
Missing events, finding 130
NNormal Selection tool 133
Notes area 38, 39
OOffset 140
analog 107
OMEGASCOPE™ 1, 2, 9
how to use 3, 6, 7
main window 12
Open file 32
Oscilloscope 7
Overrange indicator 13, 106
PPage Down key 32
Page Up key 32
Panning 134
PC Oscilloscope 8
Persistence mode 17
button 112
enabling and disabling 99
options 116
Pointer tool tip 20
Polygon 86
Post-trigger delay 163
OMEGASCOPE™ User's Guide 179
M5064
Post-trigger delay 163
arrow 15
control 127, 163
Power Management preferences 91
Preferences 47
capture rate 91
colours 97
Default Print Settings 96
device selection 99
dialog 89
general 90
keyboard 94
language 95
persistence modes 99
power management 91
sampling 92
spectrum modes 99
Pre-trigger delay 163
control 127, 163
Printing 32
from command line 171
from menu 32
preferences 96
preview 32
Probe 173
custom 24
Probe ID dialog 61
Probe Output Units dialog 52
Progress bar 114
Progressive mode 173
Properties sheet 24
displaying 40
Pulse width trigger 129, 130
RRange control 106
Range Management dialog 55
Rapid trigger mode 127
Reference manual 100
Reference waveforms 47
adding 40
delay 109
dialog 73
Library 73
Loaded 73
overview 26
using in equations 67
Reset 'Don't show this again' dialogs 90
Resolution enhancement 19, 107, 173
Revolutions per minute 23
Rise time
threshold 45
Rising edge button 127
RPM 23, 99
RS232
protocol 169
settings 80
Rulers 13, 14, 16
definition 173
deleting 21, 22
handles 13, 14, 16
legend 23
lock button 23
time 13, 16
voltage 13, 14, 16
Runt pulse trigger 130
SSampling preferences 92
Sampling rate 112
Save As 32
dialog 33
Save file 32
Save on trigger 83, 153
Scaling 9, 140
button 109
Scaling Method dialog 53
Scope device 173
Scope measurements
AC volts 158
Cycle time 158
DC volts 158
Duty cycle 158
Fall time 158
Falling rate 158
Frequency 158
High pulse width 158
Low pulse width 158
Maximum 158
Minimum 158
Peak to peak 158
Rise time 158
Rising rate 158
Scope mode 10
button 112
Scope view 11, 13
Scrolling 140
Selection tool, normal 133
Serial decoding 27, 47
data window 78
dialog 75
protocols 165

Index180
M5064
Serial number
of oscilloscope 100
Settings
saving 32
Settings dialog 81
Signal difference, how to measure 137
Signal generator
button 119
dialog 119
Waveform types 161
Signal rulers 13, 14, 16, 21
Sinx(x)/x preferences 92
Slow sampling transition 92
Smoothing 92
Software version 1
Sound file 83
Space bar 126
Spectrum measurements
Amplitude at peak 159
Frequency at peak 159
Intermodulation Distortion (IMD) 159
Signal to Noise Ratio (SNR) 159
Spurious-free Dynamic Range (SFDR) 159
Total Harmonic Distortion (THD) 159
Total Harmonic Distortion plus Noise (THD+N) 159
Total power 159
Spectrum mode 10
button 112
enabling and disabling 99
Spectrum options
bins 114
dialog 114
display mode 114
scale 114
Spectrum view 11, 16
how to set up 145
SPI Bus protocol 170
SPI settings 81
Spreadsheet, exporting to 33
Spurious edges, finding 130
Standard deviation 18, 173
Start/Stop toolbar 126
Startup Settings menu 38
Statistics 18
filtering 45
Symbols
red warning 13
yellow warning 25
System requirements 5
TTelephone number 3
Text files, exporting 33, 35
Threshold for measurements 45
Time difference, how to measure 138
Time gate 24
Time rulers 13, 16, 22
Timebase controls 112
Tool tip 173
Toolbars 104
Tools menu 47
Trace 7
Tracking rulers 23
Trademarks 3
Trigger 127, 163, 173
advanced 127, 129
dropout 130
dual-edge 129
edge 130
glitches 130
interval 129, 130
logic 130
marker 15
missing events 130
mode control 127
pulse width 129, 130
reference point 163
runt pulse 130
timing 163
toolbar 127
window 130
UU.S. measurements 95
UART
protocol 169
settings 80
Undo zoom 133
VValid edges, finding 130
Version 1
Version number
hardware 100
software 100
Vertical axis 13, 14, 16
Vertical resolution 173
View 173
how to move 139

OMEGASCOPE™ User's Guide 181
M5064
View 173
menu 40
scope 13
selecting channels 40
spectrum 16
XY 14
Viewport 173
WWarning symbol 106
red 13
yellow 25
Waveform 7, 13
saving 32
Waveform buffers
number of 90
Window functions 114, 162
Window trigger 130
XX axis, configuring 40
X-Axis command 14
XY view 14
ZZooming 140
undo 133
Zoom overview 134
Zooming and Scrolling toolbar 133

182
M5064

WARRANTY/DISCLAIMEROMEGA ENGINEERING, INC. warrants this unit to be free of defects in materials and workmanship for aperiod of 13 months from date of purchase. OMEGA’s WARRANTY adds an additional one (1) monthgrace period to the normal one (1) year product warranty to cover handling and shipping time. Thisensures that OMEGA’s customers receive maximum coverage on each product. If the unit malfunctions, it must be returned to the factory for evaluation. OMEGA’s Customer ServiceDepartment will issue an Authorized Return (AR) number immediately upon phone or written request.Upon examination by OMEGA, if the unit is found to be defective, it will be repaired or replaced at nocharge. OMEGA’s WARRANTY does not apply to defects resulting from any action of the purchaser,including but not limited to mishandling, improper interfacing, operation outside of design limits, improper repair, or unauthorized modification. This WARRANTY is VOID if the unit shows evidence of having been tampered with or shows evidence of having been damaged as a result of excessive corrosion;or current, heat, moisture or vibration; improper specification; misapplication; misuse or other operatingconditions outside of OMEGA’s control. Components in which wear is not warranted, include but are not limited to contact points, fuses, and triacs.OMEGA is pleased to offer suggestions on the use of its various products. However, OMEGA neither assumes responsibility for any omissions or errors nor assumes liability for anydamages that result from the use of its products in accordance with information provided byOMEGA, either verbal or written. OMEGA warrants only that the parts manufactured by it will beas specified and free of defects. OMEGA MAKES NO OTHER WARRANTIES OR REPRESENTATIONS OF ANY KIND WHATSOEVER, EXPRESS OR IMPLIED, EXCEPT THAT OF TITLE,AND ALL IMPLIED WARRANTIES INCLUDING ANY WARRANTY OF MERCHANTABILITY AND FITNESS FOR A PARTICULAR PURPOSE ARE HEREBY DISCLAIMED. LIMITATION OF LIABILITY: The remedies of purchaser set forth herein are exclusive, and the total liability of OMEGA with respect to this order, whether based on contract, warranty, negligence, indemnification, strict liability or otherwise, shall not exceed the purchase price of the component upon which liability is based. In no event shall OMEGA be liable for consequential, incidental or special damages.CONDITIONS: Equipment sold by OMEGA is not intended to be used, nor shall it be used: (1) as a “BasicComponent” under 10 CFR 21 (NRC), used in or with any nuclear installation or activity; or (2) in medicalapplications or used on humans. Should any Product(s) be used in or with any nuclear installation oractivity, medical application, used on humans, or misused in any way, OMEGA assumes no responsibilityas set forth in our basic WARRANTY/ DISCLAIMER language, and, additionally, purchaser will indemnifyOMEGA and hold OMEGA harmless from any liability or damage whatsoever arising out of the use of theProduct(s) in such a manner.
RETURN REQUESTS/INQUIRIESDirect all warranty and repair requests/inquiries to the OMEGA Customer Service Department. BEFORERETURNING ANY PRODUCT(S) TO OMEGA, PURCHASER MUST OBTAIN AN AUTHORIZED RETURN(AR) NUMBER FROM OMEGA’S CUSTOMER SERVICE DEPARTMENT (IN ORDER TO AVOIDPROCESSING DELAYS). The assigned AR number should then be marked on the outside of the returnpackage and on any correspondence.The purchaser is responsible for shipping charges, freight, insurance and proper packaging to preventbreakage in transit.
FOR WARRANTY RETURNS, please have the following information available BEFORE contacting OMEGA:1. Purchase Order number under which the product
was PURCHASED,2. Model and serial number of the product under
warranty, and3. Repair instructions and/or specific problems
relative to the product.
FOR NON-WARRANTY REPAIRS, consult OMEGAfor current repair charges. Have the followinginformation available BEFORE contacting OMEGA:1. Purchase Order number to cover the COST
of the repair,2. Model and serial number of the product, and3. Repair instructions and/or specific problems
relative to the product.
OMEGA’s policy is to make running changes, not model changes, whenever an improvement is possible. This affordsour customers the latest in technology and engineering.OMEGA is a registered trademark of OMEGA ENGINEERING, INC.© Copyright 2011 OMEGA ENGINEERING, INC. All rights reserved. This document may not be copied, photocopied,reproduced, translated, or reduced to any electronic medium or machine-readable form, in whole or in part, without theprior written consent of OMEGA ENGINEERING, INC.

M5064/1111
Where Do I Find Everything I Need for Process Measurement and Control?
OMEGA…Of Course!Shop online at omega.com sm
TEMPERATURE�� Thermocouple, RTD & Thermistor Probes, Connectors, Panels & Assemblies�� Wire: Thermocouple, RTD & Thermistor�� Calibrators & Ice Point References�� Recorders, Controllers & Process Monitors�� Infrared Pyrometers
PRESSURE, STRAIN AND FORCE�� Transducers & Strain Gages�� Load Cells & Pressure Gages�� Displacement Transducers�� Instrumentation & Accessories
FLOW/LEVEL�� Rotameters, Gas Mass Flowmeters & Flow Computers�� Air Velocity Indicators�� Turbine/Paddlewheel Systems�� Totalizers & Batch Controllers
pH/CONDUCTIVITY�� pH Electrodes, Testers & Accessories�� Benchtop/Laboratory Meters�� Controllers, Calibrators, Simulators & Pumps�� Industrial pH & Conductivity Equipment
DATA ACQUISITION�� Data Acquisition & Engineering Software�� Communications-Based Acquisition Systems�� Plug-in Cards for Apple, IBM & Compatibles�� Data Logging Systems�� Recorders, Printers & Plotters
HEATERS�� Heating Cable�� Cartridge & Strip Heaters�� Immersion & Band Heaters�� Flexible Heaters�� Laboratory Heaters
ENVIRONMENTALMONITORING AND CONTROL�� Metering & Control Instrumentation�� Refractometers�� Pumps & Tubing�� Air, Soil & Water Monitors�� Industrial Water & Wastewater Treatment�� pH, Conductivity & Dissolved Oxygen Instruments