
OMCL Network of the Council of Europe QUALITY ASSURANCE ... · OMCL Network of the Council of...
17
1/17 OMCL Network of the Council of Europe QUALITY ASSURANCE DOCUMENT PA/PH/OMCL (14) 89 R Evaluation and Reporting of Results Annex 2A Full document title and reference Evaluation and Reporting of Results – Annex 2A Examples of Re-test Programmes for Quantitative Tests PA/PH/OMCL (14) 89 R Document type Guideline Legislative basis / Date of first adoption August 2014 Date of original entry into force October 2014 Date of entry into force of revised document April 2015 Previous titles / other references / last valid version Last adopted version : PA/PH/OMCL (14) 89 Custodian Organisation The present document was elaborated by the OMCL Network / EDQM of the Council of Europe Concerned Network GEON
Transcript of OMCL Network of the Council of Europe QUALITY ASSURANCE ... · OMCL Network of the Council of...
1/17
OMCL Network of the Council of Europe
QUALITY ASSURANCE DOCUMENT
PA/PH/OMCL (14) 89 R
Evaluation and Reporting of Results Annex 2A
Full document title and reference
Evaluation and Reporting of Results – Annex 2A Examples of Re-test Programmes for Quantitative Tests PA/PH/OMCL (14) 89 R
Document type
Guideline
Legislative basis
/
Date of first adoption
August 2014
Date of original entry into force
October 2014
Date of entry into force of revised document
April 2015
Previous titles / other references / last valid version
Last adopted version : PA/PH/OMCL (14) 89
Custodian Organisation
The present document was elaborated by the OMCL Network / EDQM of the Council of Europe
Concerned Network GEON

PA/PH/OMCL (14) 89 R
2/17
ANNEX II A OF THE OMCL NETWORK GUIDELINE
“EVALUATION AND REPORTING OF RESULTS”
EXAMPLES OF RE-TEST PROGRAMMES FOR QUANTITATIVE TESTS
TABLE OF CONTENT INTRODUCTION .................................................................................................................. 2
Approach 1: Assay of active pharmaceutical ingredient, 2 initial determinations ................. 4
Approach 2: Assay of active pharmaceutical ingredient, 3 initial determinations ................. 6
Approach 3: Impurity tests (e.g. Related substances by HPLC) ............................................ 7
Approach 4: Finished products .............................................................................................. 8
Approach 5: Products with insufficient validation data ....................................................... 11
Approach 6: Re-test programme based on statistical assay layouts (Ph. Eur. 5.3) .............. 12
Approach 7: Re-test programme based on known intermediate precision ........................... 14
Approach 8: Approach for cases of unexplained lack of repeatability ................................ 16
INTRODUCTION
This document is an Annex to the core document “Evaluation and reporting of results”,
PA/PH/OMCL (13) 113 (in its current version), and it should be used in combination with it
when planning, performing and documenting the evaluation process and reporting of results
of quantitative tests with the expected Gaussian distribution.
The core document contains the Introduction, Scope and General requirements for the
evaluation of results (in routine cases or otherwise) and the reporting of results.
The proposed approaches are only relevant if the decision is based on observed repeatability1.
In all cases, the laboratory should make a decision based on documented and sound scientific
judgement. This Annex should not be taken as a list of compulsory requirements. It is left to
the professional judgement and background experience of each OMCL to decide on the most
relevant procedures to be undertaken in order to give evidence that the evaluation and
reporting of results is well managed. Although two or three initial determinations are
described in most examples of this Annex, each OMCL is responsible for deciding what is the
minimum number of replicates that should be taken into account for a certain test.
This Annex presents several examples of the evaluation of results for quantitative testing of
medicinal products, which could be set up in combination with the general requirements given
1 Observed repeatability should be interpreted as repeatability between independent sample determinations, either with regards to standard deviation (sd) or relative standard deviation (RSD).

PA/PH/OMCL (14) 89 R
3/17
in the core document. The examples are not intended to be all-inclusive, and other valid
approaches may be adopted for evaluation of the acceptability of test results.
This document is based on publications in Pharmeuropa Vol. 9, No. 1, 148-156 (1997) and
Pharmeuropa Vol. 11, No. 4, 571-577 (1999). The proposals for approach 1, 2 and 4 were
tested against datasets obtained from proficiency tests and have been shown to be satisfactory
for making a decision.
The following table gives an overview about the described possible approaches and the
situations where they may be applied, see below:
Approach Title Situation
1 Assay of active pharmaceutical
ingredient, 2 initial determinations
This approach is applicable for chemical
APIs only
2 Assay of active pharmaceutical
ingredient, 3 initial determinations
This approach is applicable for chemical
APIs only
3 Impurity tests (e.g.: Related
substances by HPLC)
This approach is intended for trace level
tests and may be used for quantitative
impurity tests, where an
analytical/instrumental response is
obtained (peak area, for example)
4 Finished products This approach is intended for finished
products with fully validated methods
regarding repeatability and intermediate
precision described in the MA file. It is not
intended for analyte concentrations at trace
level.
5 Products with insufficient validation
data
This approach is to be regarded as a tool to establish an acceptance criterion for precision of the replicates of a certain test, when the laboratory has no other mean to evaluate the dispersion of the results, as the available validation data are scarce or there are no validation data at all. It is not intended for analyte concentrations at trace level.
6 Retest programme based on statistical
assay layouts (Ph. Eur. 5.3)
Results from bioassays in statistical layout according to Ph. Eur. 5.3. For combination of assays it is desirable that the individual results are obtained in identical or similar assay layouts.
7 Retest programme based on known
intermediate precision
This approach is intended for assays with
well-known in-house intermediate
precision, e.g. in OCABR routine analysis
8 Approach for cases of unexplained
lack of repeatability
For products where sample recovery
problems are encountered or there is no
plausible reason for lack of precision
PA/PH/OMCL (14) 89 R
4/17
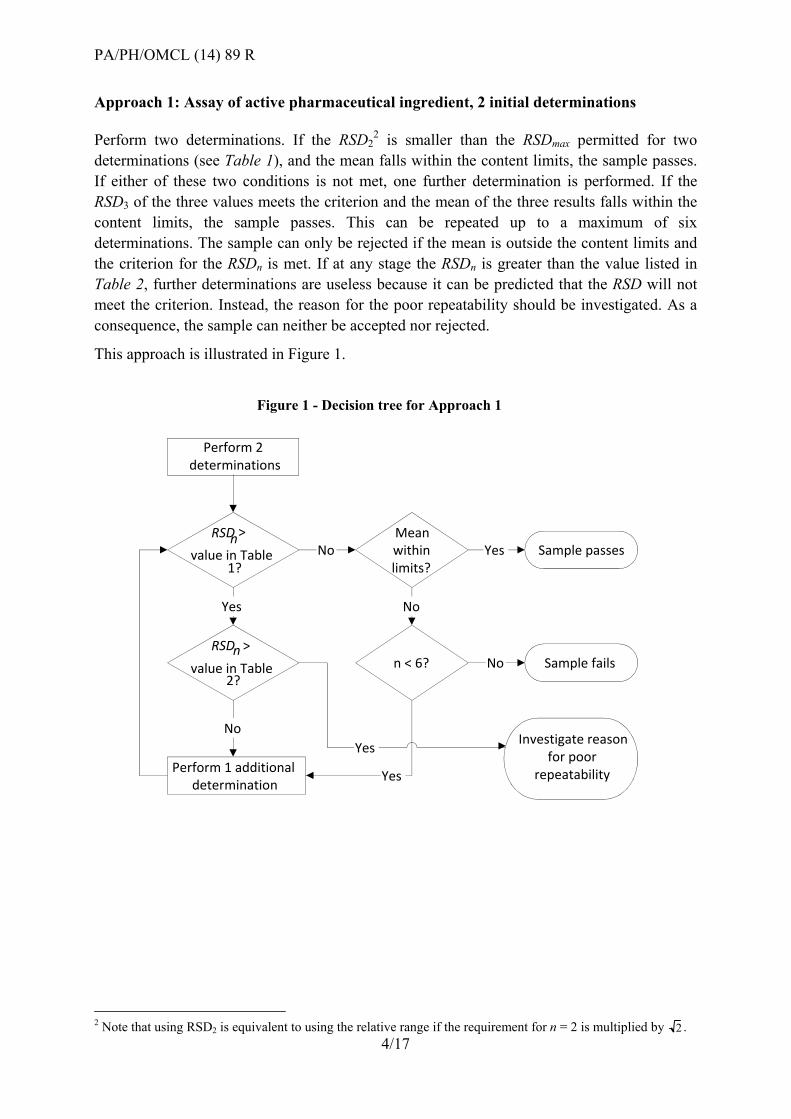
Approach 1: Assay of active pharmaceutical ingredient, 2 initial determinations
Perform two determinations. If the RSD22 is smaller than the RSDmax permitted for two
determinations (see Table 1), and the mean falls within the content limits, the sample passes.
If either of these two conditions is not met, one further determination is performed. If the
RSD3 of the three values meets the criterion and the mean of the three results falls within the
content limits, the sample passes. This can be repeated up to a maximum of six
determinations. The sample can only be rejected if the mean is outside the content limits and
the criterion for the RSDn is met. If at any stage the RSDn is greater than the value listed in
Table 2, further determinations are useless because it can be predicted that the RSD will not
meet the criterion. Instead, the reason for the poor repeatability should be investigated. As a
consequence, the sample can neither be accepted nor rejected.
This approach is illustrated in Figure 1.
2 Note that using RSD2 is equivalent to using the relative range if the requirement for n = 2 is multiplied by 2 .
Perform 2 determinations
RSDn>value in Table
1?
Meanwithinlimits?
RSDn > value in Table
2?n < 6?
Perform 1 additional determination
Yes
No
No
Yes
No
Yes
Sample passes
Sample fails
Investigate reasonfor poor
repeatability
Yes
No
Figure 1 - Decision tree for Approach 1
PA/PH/OMCL (14) 89 R
5/17
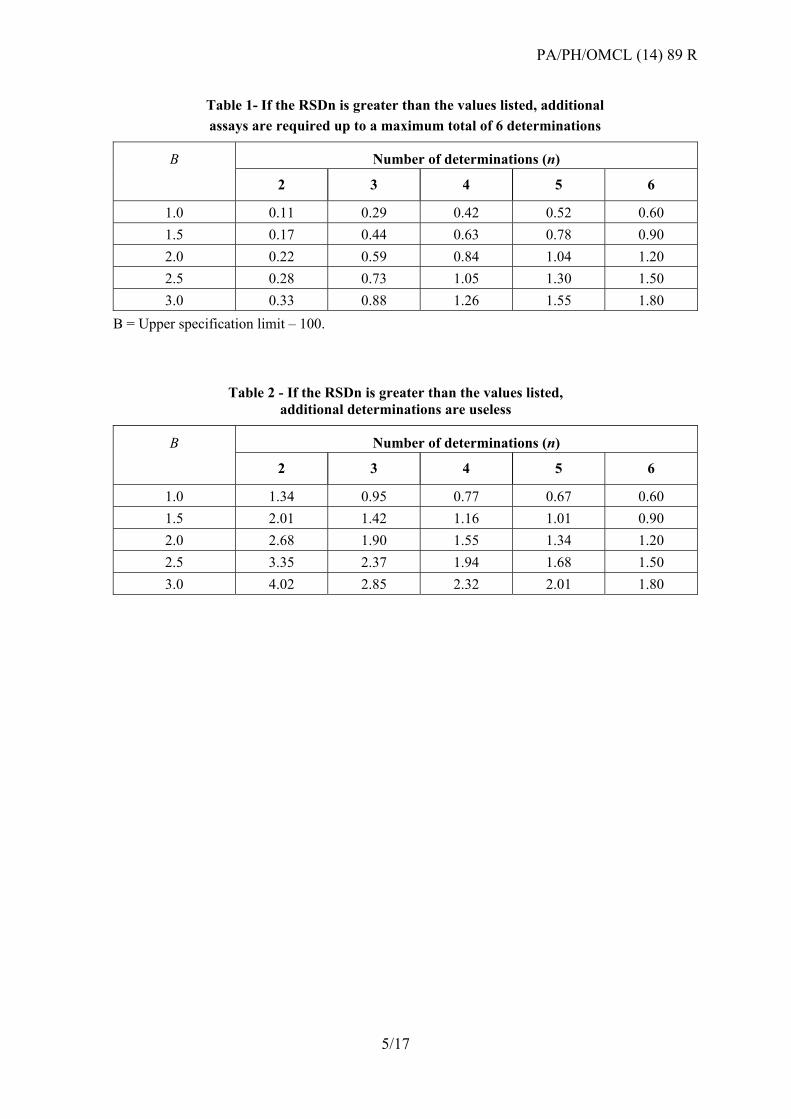
Table 1- If the RSDn is greater than the values listed, additional
assays are required up to a maximum total of 6 determinations
B Number of determinations (n)
2 3 4 5 6
1.0 0.11 0.29 0.42 0.52 0.60
1.5 0.17 0.44 0.63 0.78 0.90
2.0 0.22 0.59 0.84 1.04 1.20
2.5 0.28 0.73 1.05 1.30 1.50
3.0 0.33 0.88 1.26 1.55 1.80
B = Upper specification limit – 100.
Table 2 - If the RSDn is greater than the values listed, additional determinations are useless
B Number of determinations (n)
2 3 4 5 6
1.0 1.34 0.95 0.77 0.67 0.60
1.5 2.01 1.42 1.16 1.01 0.90
2.0 2.68 1.90 1.55 1.34 1.20
2.5 3.35 2.37 1.94 1.68 1.50
3.0 4.02 2.85 2.32 2.01 1.80
PA/PH/OMCL (14) 89 R
6/17
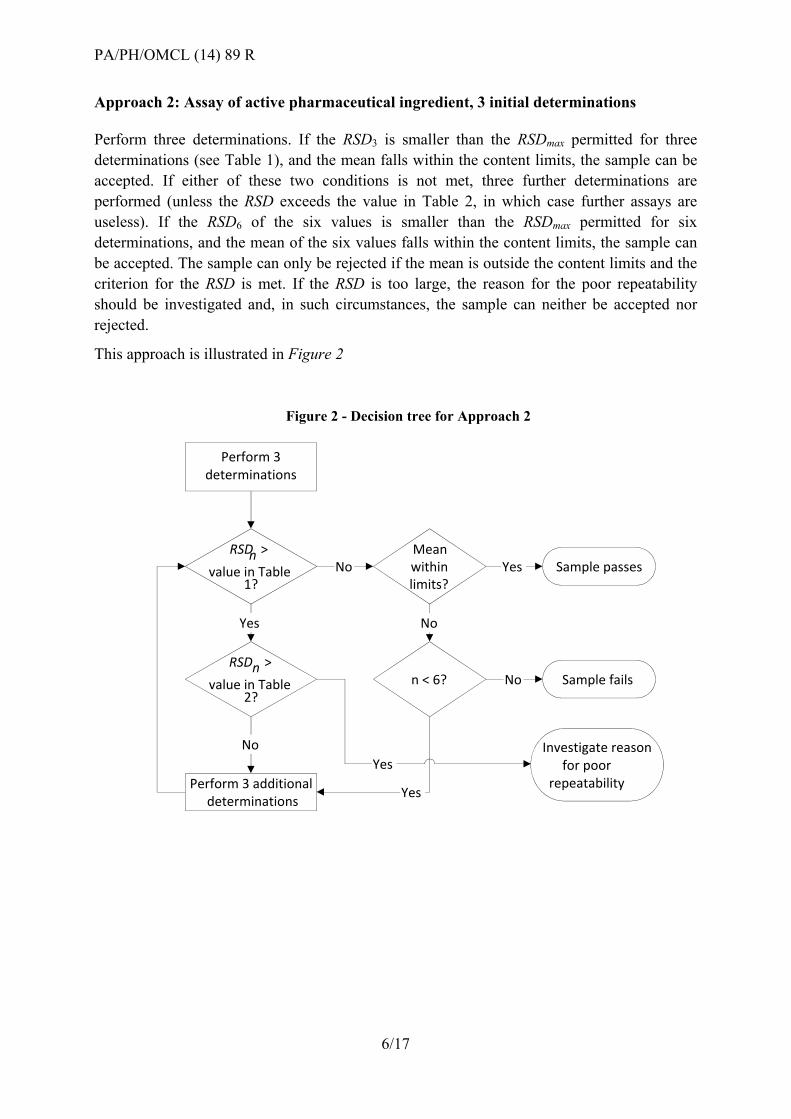
Approach 2: Assay of active pharmaceutical ingredient, 3 initial determinations
Perform three determinations. If the RSD3 is smaller than the RSDmax permitted for three
determinations (see Table 1), and the mean falls within the content limits, the sample can be
accepted. If either of these two conditions is not met, three further determinations are
performed (unless the RSD exceeds the value in Table 2, in which case further assays are
useless). If the RSD6 of the six values is smaller than the RSDmax permitted for six
determinations, and the mean of the six values falls within the content limits, the sample can
be accepted. The sample can only be rejected if the mean is outside the content limits and the
criterion for the RSD is met. If the RSD is too large, the reason for the poor repeatability
should be investigated and, in such circumstances, the sample can neither be accepted nor
rejected.
This approach is illustrated in Figure 2
Perform 3 determinations
RSD n > value in Table
1?
Meanwithinlimits?
RSD n > value in Table
2? n < 6?
Perform 3 additional determinations
Yes
No
No
Yes
No
Yes
Sample passes
Sample fails
Investigate reasonfor poor
repeatability
Yes
No
Figure 2 - Decision tree for Approach 2
PA/PH/OMCL (14) 89 R
7/17
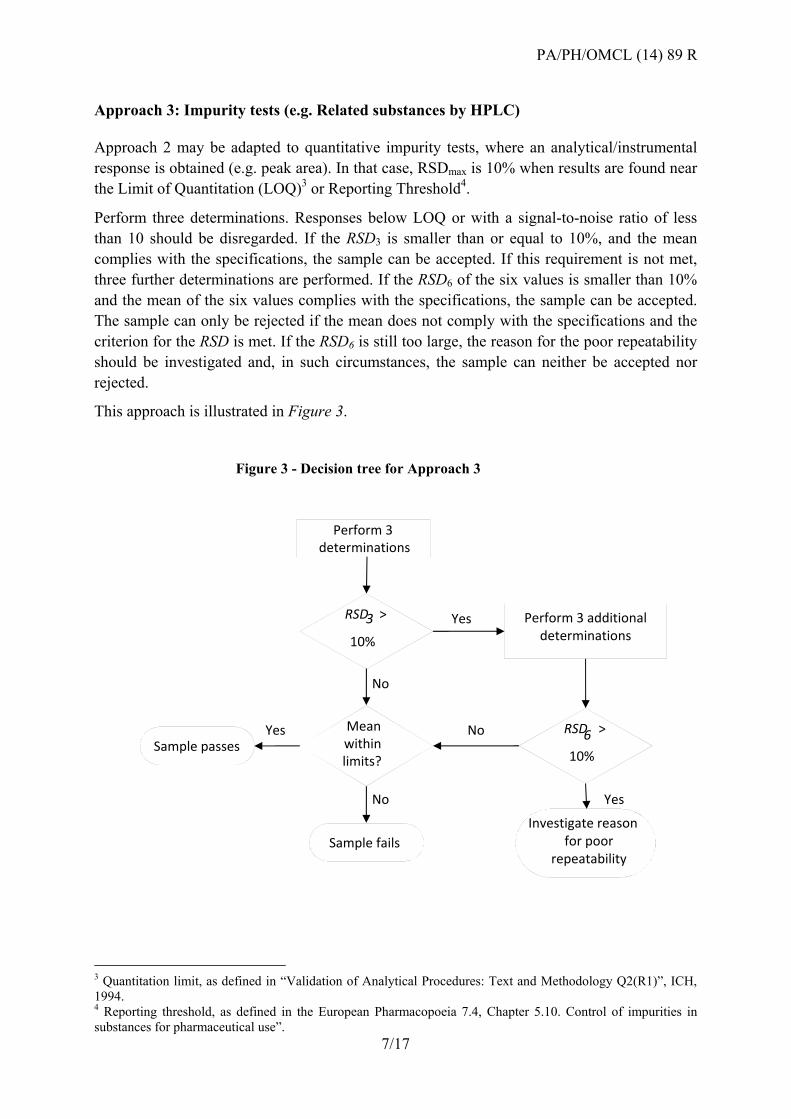
Approach 3: Impurity tests (e.g. Related substances by HPLC)
Approach 2 may be adapted to quantitative impurity tests, where an analytical/instrumental
response is obtained (e.g. peak area). In that case, RSDmax is 10% when results are found near
the Limit of Quantitation (LOQ)3 or Reporting Threshold4.
Perform three determinations. Responses below LOQ or with a signal-to-noise ratio of less
than 10 should be disregarded. If the RSD3 is smaller than or equal to 10%, and the mean
complies with the specifications, the sample can be accepted. If this requirement is not met,
three further determinations are performed. If the RSD6 of the six values is smaller than 10%
and the mean of the six values complies with the specifications, the sample can be accepted.
The sample can only be rejected if the mean does not comply with the specifications and the
criterion for the RSD is met. If the RSD6 is still too large, the reason for the poor repeatability
should be investigated and, in such circumstances, the sample can neither be accepted nor
rejected.
This approach is illustrated in Figure 3.
3 Quantitation limit, as defined in “Validation of Analytical Procedures: Text and Methodology Q2(R1)”, ICH, 1994. 4 Reporting threshold, as defined in the European Pharmacopoeia 7.4, Chapter 5.10. Control of impurities in substances for pharmaceutical use”.
Yes
Figure 3 - Decision tree for Approach 3
Perform 3determinations
RSD3 >
10%
Perform 3 additional determinations
Meanwithinlimits?
Sample passes
Sample failsInvestigate reason
for poor repeatability
RSD 6 >
10%
Yes
Yes
Yes
No
No
No

PA/PH/OMCL (14) 89 R
8/17
Approach 4: Finished products
For recently-registered products with fully validated analytical methods, information
regarding repeatability and/or intermediate precision of the test method is supplied in the
application file. The repeatability might be reported with different degrees of freedom
depending on the experimental design. The minimum degrees of freedom is 5, as given in the
ICH guideline.
During the assessment process, the performance characteristics of the quality control
procedures are evaluated against the specification limits proposed by the manufacturer. When
approved, the results of the tests performed must fall within the specification limits.
When a product is to be tested at an OMCL, the MAH file is consulted in order to find
suitable conditions for the test method and also to get information on its performance
characteristics. The repeatability of the results obtained during testing can therefore be used as
a quality indicator and can be checked against the values given in the dossier. Nevertheless,
the OMCL might find that internal quality control criteria for evaluating the repeatability of
the results of the test are suitable for the intended purpose.
The observed standard deviation varies between testing events, following a skewed
distribution. To test whether standard deviations (or, rather, variances) are not significantly
different, the quotient of two variances is calculated and compared to the critical F-value at a
specified probability for the relevant degrees of freedom. In Tables 3 and 4, the critical F-
values at the 5% level have been used to calculate the maximum allowable standard
deviations under the assumption that the observed repeatability is not significantly worse than
that reported in the dossier. If the OMCL chooses to use its own in-house repeatability
criteria, the use of the data described in Tables 3 and 4 is not applicable and the comparison
should be done with the predefined RSD criteria. This should be taken into account in points
3, 4, 5 and 6 below.
1. Find the RSD and the degrees of freedom for the repeatability in the dossier.
2. Perform three determinations and obtain the results in % of the label claim. Calculate
the mean and the relative standard deviation.
3. Check in the relevant Table 3 or Table 4 if the RSD obtained for the repeatability is
larger than the critical value given in the table corresponding to the reported value in
the dossier.
4 If the RSD is not larger than the value in the table and the mean is within the
acceptance range, the sample passes.
5 If the RSD is not larger than the value in the table, but the mean is outside the
acceptance range, perform three more determinations and calculate the mean and the
standard deviation of the six determinations.
6 If the RSD is still not larger than the value in the table and the new mean is within the
acceptance range, the sample passes.
7 If the RSD is not larger than the value in the table, but the mean is outside the
acceptance range, calculate the confidence interval using the standard deviation from
PA/PH/OMCL (14) 89 R
9/17
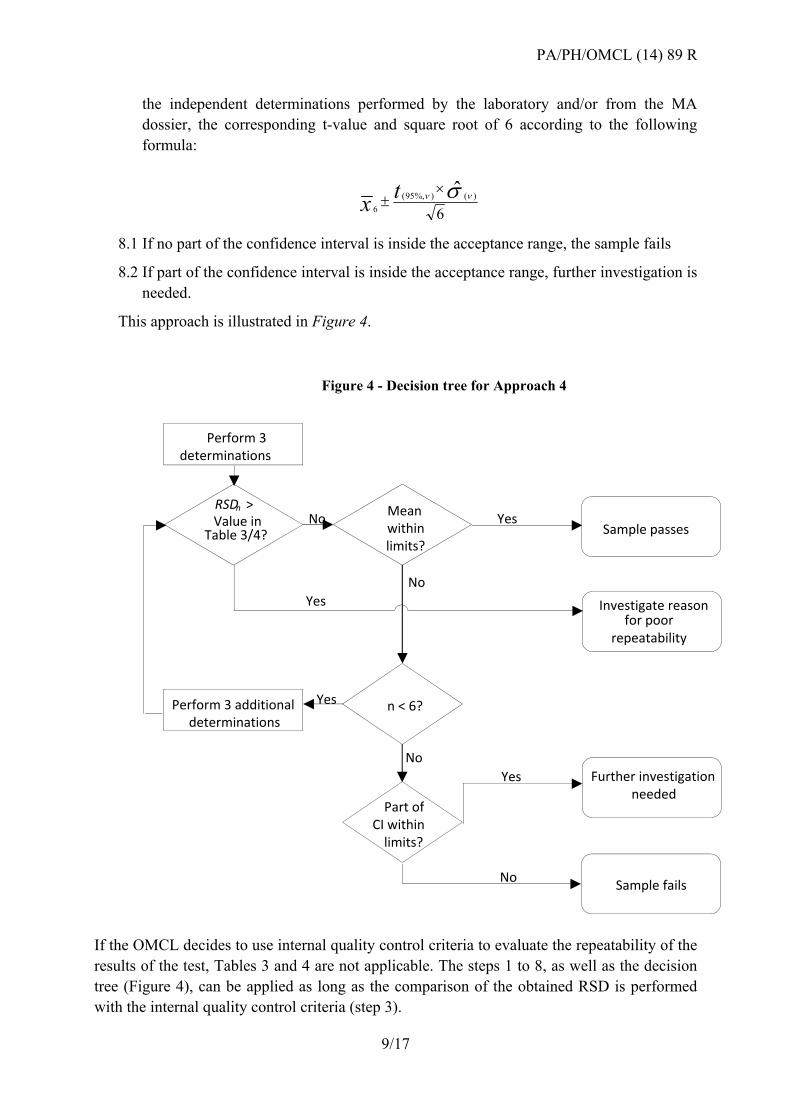
the independent determinations performed by the laboratory and/or from the MA
dossier, the corresponding t-value and square root of 6 according to the following
formula:
6
ˆ )()%,95(
6
tx
8.1 If no part of the confidence interval is inside the acceptance range, the sample fails
8.2 If part of the confidence interval is inside the acceptance range, further investigation is
needed.
This approach is illustrated in Figure 4.
If the OMCL decides to use internal quality control criteria to evaluate the repeatability of the
results of the test, Tables 3 and 4 are not applicable. The steps 1 to 8, as well as the decision
tree (Figure 4), can be applied as long as the comparison of the obtained RSD is performed
with the internal quality control criteria (step 3).
Perform 3determinations
RSDn > Value in
Table 3/4?
Perform 3 additional determinations
Mean withinlimits?
n < 6?
Part ofCI within
limits?
Sample passes
Sample fails
Further investigationneeded
Investigate reasonfor poor
repeatability
Yes
No Yes
No
Yes
NoYes
No
Figure 4 - Decision tree for Approach 4
PA/PH/OMCL (14) 89 R
10/17
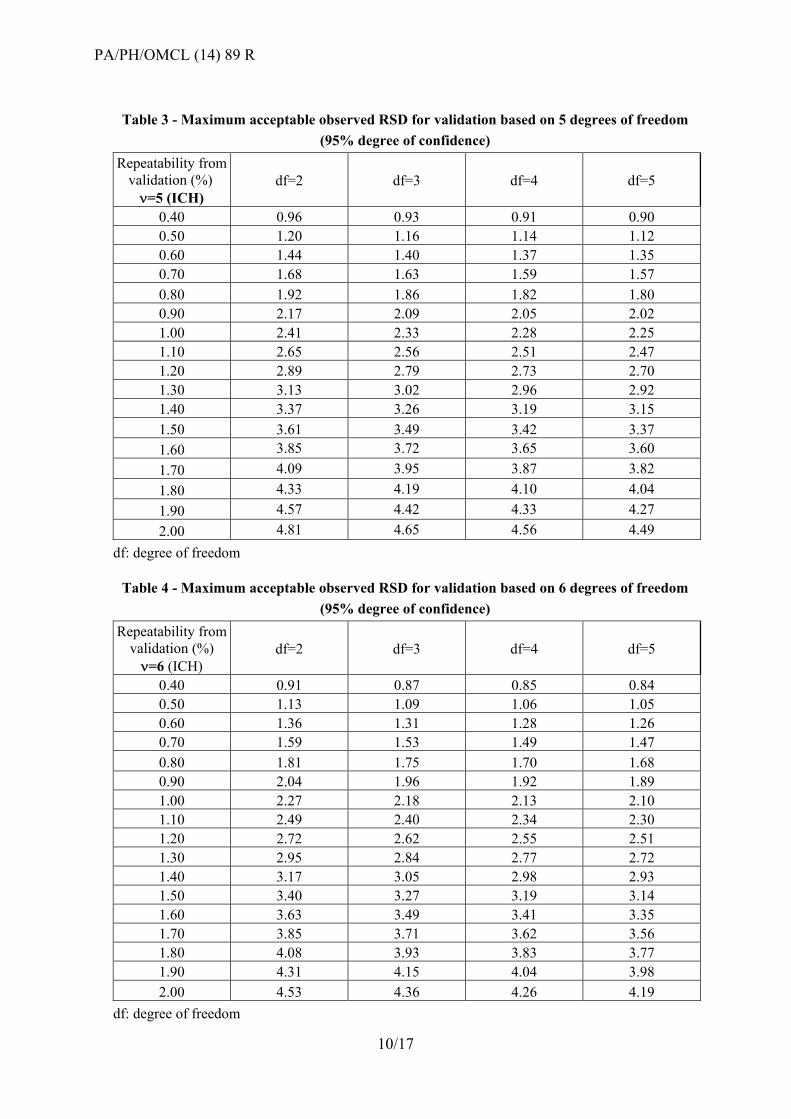
Table 3 - Maximum acceptable observed RSD for validation based on 5 degrees of freedom
(95% degree of confidence)
Repeatability from validation (%) =5 (ICH)
df=2 df=3 df=4 df=5
0.40 0.96 0.93 0.91 0.90
0.50 1.20 1.16 1.14 1.12
0.60 1.44 1.40 1.37 1.35
0.70 1.68 1.63 1.59 1.57
0.80 1.92 1.86 1.82 1.80
0.90 2.17 2.09 2.05 2.02
1.00 2.41 2.33 2.28 2.25
1.10 2.65 2.56 2.51 2.47
1.20 2.89 2.79 2.73 2.70
1.30 3.13 3.02 2.96 2.92
1.40 3.37 3.26 3.19 3.15
1.50 3.61 3.49 3.42 3.37
1.60 3.85 3.72 3.65 3.60
1.70 4.09 3.95 3.87 3.82
1.80 4.33 4.19 4.10 4.04
1.90 4.57 4.42 4.33 4.27
2.00 4.81 4.65 4.56 4.49
df: degree of freedom
Table 4 - Maximum acceptable observed RSD for validation based on 6 degrees of freedom
(95% degree of confidence)
Repeatability from validation (%) =6 (ICH)
df=2 df=3 df=4 df=5
0.40 0.91 0.87 0.85 0.84
0.50 1.13 1.09 1.06 1.05
0.60 1.36 1.31 1.28 1.26
0.70 1.59 1.53 1.49 1.47
0.80 1.81 1.75 1.70 1.68
0.90 2.04 1.96 1.92 1.89
1.00 2.27 2.18 2.13 2.10
1.10 2.49 2.40 2.34 2.30
1.20 2.72 2.62 2.55 2.51
1.30 2.95 2.84 2.77 2.72
1.40 3.17 3.05 2.98 2.93
1.50 3.40 3.27 3.19 3.14
1.60 3.63 3.49 3.41 3.35
1.70 3.85 3.71 3.62 3.56
1.80 4.08 3.93 3.83 3.77
1.90 4.31 4.15 4.04 3.98
2.00 4.53 4.36 4.26 4.19
df: degree of freedom

PA/PH/OMCL (14) 89 R
11/17
Approach 5: Products with insufficient validation data
For products where the validation data is limited or there is no validation data at all, the
criteria for precision should be determined in order to decide upon the acceptance of a result.
This approach is to be regarded as a tool to establish an acceptance criterion for precision of
the replicates of a given test, when the laboratory has no other means to evaluate the
distribution of the results.
The specification for a given test can be regarded as an interval, where:
- the lower limit is [Central value - Maximum Error],
- the upper limit is [Central value + Maximum Error],
with no further tolerances to be applied.
If the maximum error is considered as expanded uncertainty (U), the interval for the
specification can be regarded as [Central value +/- U], or [Central value +/- 2*RSD]5, taking
into account that the main component of the global uncertainty of a test is most frequently its
precision.
As an example, for the specification of an assay test of [95.0 – 105.0%]:
- the central value is 100.0%
- the maximum error is 5.0%
- the lower limit is 95.0% (= 100.0-5.0%)
- the upper limit is 105.0% (= 100.0+5.0%)
- the expanded uncertainty U (= 2*μ) is 5.0%
- the relative uncertainty μ is the maximum RSD (μ ≈ RSD), taking into account that the
main uncertainty component is precision
- the maximum expected RSD for the test can be assumed to be 2.5%.
The criteria for precision that could be applied to these cases are described in Table 5.
Table 5 - Approach 5: Criteria for precision
Sample Specification
(Assay) Maximum error
Global Estimated
Precision (RSD)
API 99.0 – 101.0 % 1 % 0.5 %
Finished Product 95.0 – 105.0 % 5 % 2.5 %
General approach (100-x) – (100+x)% x % x/2 %
Steps 2 to 8 of Approach 4 can be applied directly.
5This proposal for precision criteria should be regarded as an approach to solving the problem of a lack of precision criteria for a given test. It should not be confused with the concept of specifications established for European Pharmacopoeia monographs.
PA/PH/OMCL (14) 89 R
12/17
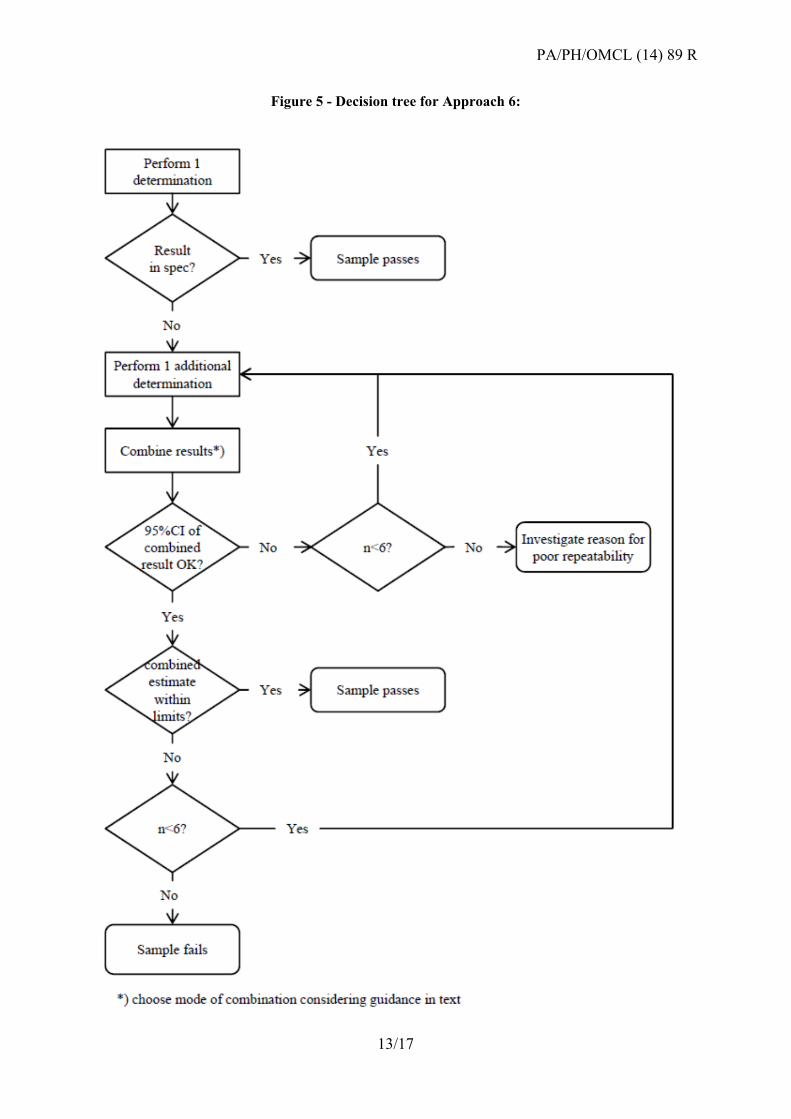
Approach 6: Re-test programme based on statistical assay layouts (Ph. Eur. 5.3)
Results from bioassays in a statistical layout according to Ph. Eur. 5.3 (e.g. parallel lines,
slope ratio, probit) may be combined according to Ph. Eur. 5.3 (6) or the relevant CombiStats
functions. To combine assays, it is desirable that the individual results are obtained according
to identical or similar assay layouts.
Assay combination may also be applied to individual assays for which the 95% CI exceeds
the validity criteria (e.g. 95-105% - Note: this is an exception to all other approaches, which
only consider valid test results). In all cases, the 95% CI of the combined result should meet
the validity criteria defined by the method.
CombiStats calculates three types of combinations. Which combination you should use
depends on whether the intervals are homogeneous. There are no strict rules as to which of
the three should be used, but the following ‘rule of thumb’ can be of use:
If the p-value for homogeneity is more than 0.100, the confidence intervals are
sufficiently homogeneous to use the weighted combination.
If the p-value is less than 0.100, the confidence intervals tend to be heterogeneous and
it would be better to use the semi-weighted combination.
The unweighted combination should only be used if there are enough assays, e.g. at
least six.
PA/PH/OMCL (14) 89 R
13/17
Figure 5 - Decision tree for Approach 6:
PA/PH/OMCL (14) 89 R
14/17
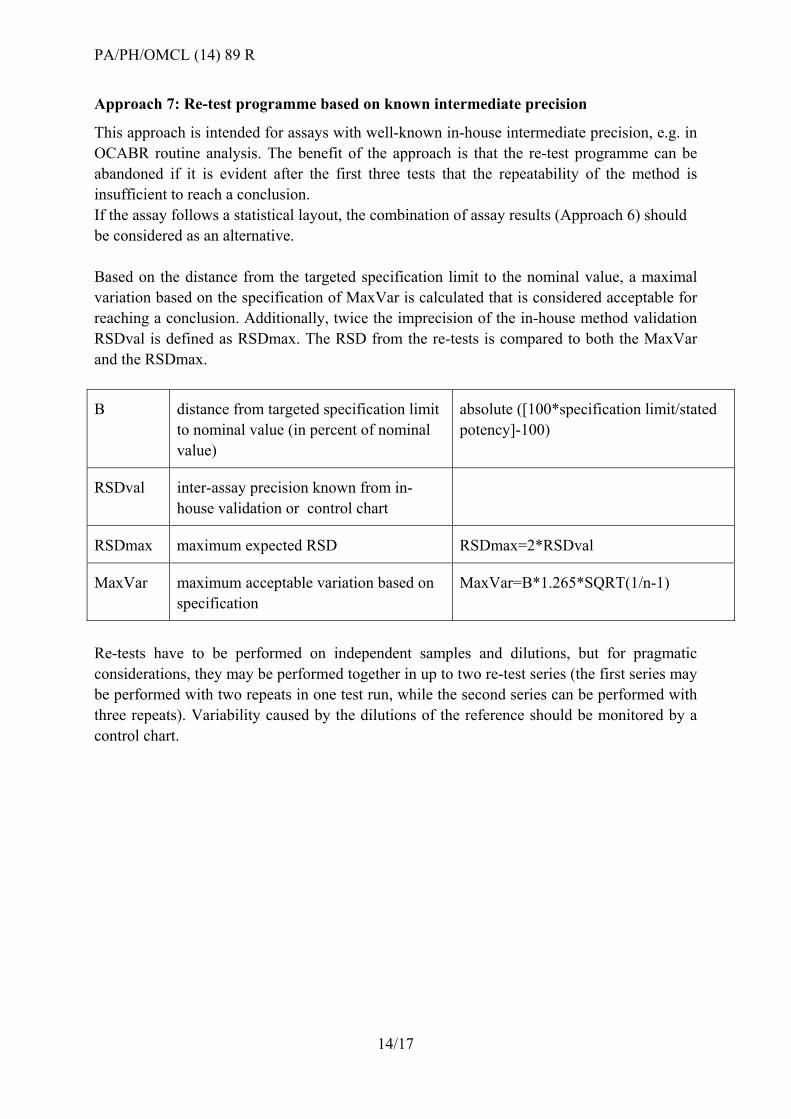
Approach 7: Re-test programme based on known intermediate precision
This approach is intended for assays with well-known in-house intermediate precision, e.g. in
OCABR routine analysis. The benefit of the approach is that the re-test programme can be
abandoned if it is evident after the first three tests that the repeatability of the method is
insufficient to reach a conclusion.
If the assay follows a statistical layout, the combination of assay results (Approach 6) should
be considered as an alternative.
Based on the distance from the targeted specification limit to the nominal value, a maximal
variation based on the specification of MaxVar is calculated that is considered acceptable for
reaching a conclusion. Additionally, twice the imprecision of the in-house method validation
RSDval is defined as RSDmax. The RSD from the re-tests is compared to both the MaxVar
and the RSDmax.
B distance from targeted specification limit
to nominal value (in percent of nominal
value)
absolute ([100*specification limit/stated
potency]-100)
RSDval inter-assay precision known from in-
house validation or control chart
RSDmax maximum expected RSD RSDmax=2*RSDval
MaxVar maximum acceptable variation based on
specification
MaxVar=B*1.265*SQRT(1/n-1)
Re-tests have to be performed on independent samples and dilutions, but for pragmatic
considerations, they may be performed together in up to two re-test series (the first series may
be performed with two repeats in one test run, while the second series can be performed with
three repeats). Variability caused by the dilutions of the reference should be monitored by a
control chart.
PA/PH/OMCL (14) 89 R
15/17
Figure 6 - Decision tree for Approach 7:
PA/PH/OMCL (14) 89 R
16/17
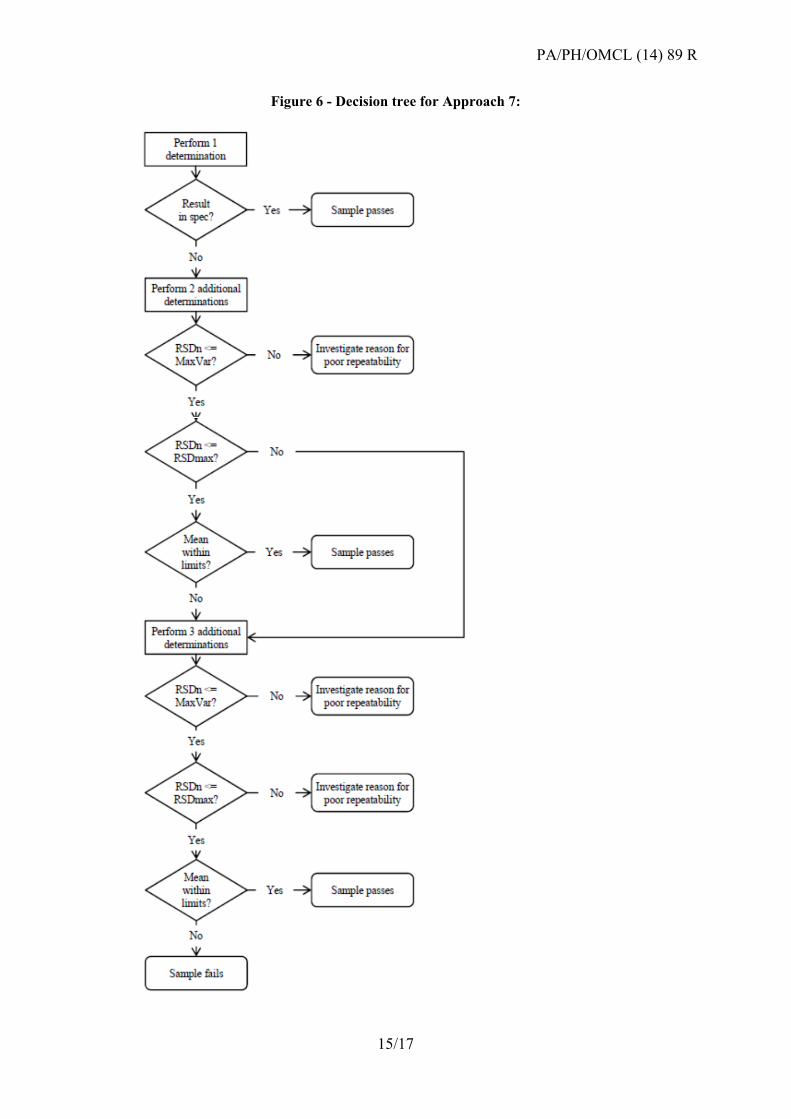
Approach 8: Approach for cases of unexplained lack of repeatability
For products where sample recovery problems are encountered or there is no plausible reason
for lack of precision, ISO standard 5725-6:1994 “Accuracy (trueness and precision) of
measurement methods and results -- Part 6: Use in practice of accuracy values” can be
applied.
This ISO standard assumes that all replicates are generated under repeatability conditions,
regardless of the test being performed on the sample in duplicate or in triplicate. It enables the
use of all the determinations performed, based on the statistical difference between the lower
and the highest value, without having to exclude results which, apparently, are outliers.
The decision for acceptance of replicates of a sample, regardless of the number, depends on the difference between the maximum value and the minimum value obtained, defining an
amplitude. This value is compared with
100
RSDTC
. T is the average of all the sample results. C is a constant that depends on the number of replicates analysed, and is described in ISO 5725-6:1994 (Cn=2 = 2.8; Cn=3 = 3.3; Cn=4 = 3.6; Cn=6 = 4.0).
Figure 7 - Decision tree for Approach 8, for triplicates.
PA/PH/OMCL (14) 89 R
17/17
As an outcome, several scenarios can be predicted:
- The first set of replicates is accepted: the final result is their arithmetic mean;
- The first set of replicates is not accepted: the test must be repeated;
- After repeating the analysis, the two sets of replicates are accepted: the final result is
their arithmetic mean;
- After repeating the analysis, the two sets of replicates do not pass the acceptance
criteria: the final result is the median.
This approach is an alternative to the cases where the precision criteria for six replicates are
not met and there is no apparent explanation for the observed lack of repeatability.
Although OMCLs can apply this approach, it is strongly recommended that the individual
results are critically analysed. The OMCL must decide the most adequate way to report when
a final result is the median.
If applicable, this approach may be used when the investigation of the reasons for poor
repeatability of a test, performed using approaches 1, 2, 3 or 4, indicates that there is no
plausible reason for the lack of precision.


![Fundamentals of a European Common Quality Assurance Framework (CQAF) for VET in Europe[1]](https://static.fdocuments.us/doc/165x107/577cdab61a28ab9e78a6580f/fundamentals-of-a-european-common-quality-assurance-framework-cqaf-for-vet.jpg)

![life assurance - Red Sands Insurance Grouplife]2014.pdf · The principal activity of Red Sands Life Assurance Company (Europe) Limited ... success in 2015. ... A Valy E O’Regan](https://static.fdocuments.us/doc/165x107/5ac440717f8b9a12608ce0da/life-assurance-red-sands-insurance-life2014pdfthe-principal-activity-of-red.jpg)