OMAC Thesis 2014.pdf - Texas A&M University
169
QUANTITATIVE MICROBIAL RISK ASSESSMENT FOR LISTERIA MONOCYTOGENES ON FRESH BABY SPINACH LEAVES A Thesis by BASRI OMAC Submitted to the Office of Graduate and Professional Studies of Texas A&M University in partial fulfillment of the requirements for the degree of MASTER OF SCIENCE Chair of Committee, Elena Castell-Perez Committee Members, Rosana G. Moreira Alejandro Castillo Head of Department, Stephen W. Searcy May 2014 Major Subject: Biological and Agricultural Engineering Copyright 2014 Basri Omac
Transcript of OMAC Thesis 2014.pdf - Texas A&M University

QUANTITATIVE MICROBIAL RISK ASSESSMENT FOR LISTERIA
MONOCYTOGENES ON FRESH BABY SPINACH LEAVES
A Thesis
by
BASRI OMAC
Submitted to the Office of Graduate and Professional Studies of Texas A&M University
in partial fulfillment of the requirements for the degree of
MASTER OF SCIENCE
Chair of Committee, Elena Castell-Perez
Committee Members, Rosana G. Moreira Alejandro Castillo Head of Department, Stephen W. Searcy
May 2014
Major Subject: Biological and Agricultural Engineering
Copyright 2014 Basri Omac

ii
ABSTRACT
The increase in foodborne illness outbreaks associated with leafy green
vegetables can be attributed to the minimal processing required of this group of fresh
produce. Neglecting effective microbial elimination steps result in leafy green vegetables
that naturally contain microorganisms such as pathogens microorganisms. This
quantitative microbial risk assessment describe the change of L. monocytogenes
concentration in fresh baby spinach from farm to table. This model also consists of
several scenarios to evaluate decontamination treatments, cross-contamination, and
temperature abuse.
Cross-contamination was the biggest issue when ensuring safety of leafy green
vegetables. Temperature abuse also increased the risk of listeriosis. On the other hand,
irradiation treatment with Modified Atmosphere Packaging reduced the number of
annual cases of listeriosis by 99.99%.
In addition, the validation of L. innocua used as a surrogate for L. monocytogenes
in fresh baby spinach was evaluated based on reductions by washing (water and
chlorine) treatments and growth at temperatures between 5 and 36oC. According to the
results of the washing treatments, the concentration of L. innocua was reduced by almost
0.5 log CFU/g. This is more than that of L. monocytogenes.
Furthermore, the effect of natural background microflora on the growth of L.
monocytogenes and L. innocua in fresh baby spinach was determined. The results
showed that the growth of L. innocua was affected more than that of L. monocytogenes

iii
at temperatures 10> T >30oC. Although L. innocua and L. monoctogenes are genetically
similar, their behavior changes under stress conditions.
Ultimately, the dynamic growth models for L. monocytogenes in fresh baby
spinach was presented. These models can be used to estimate the growth of L.
monocytogenes in fresh baby spinach during distribution, storage or market, and
potential growth at a consumer level.

iv
DEDICATION
To my parents, Mehmet and Medine Omac
To my siblings, Zeki, Hayriye, Ramazan, Fatma, Emine, and Yasin Omac
For their unconditional love. Thank you.

v
ACKNOWLEDGEMENTS
I would like to express sincere appreciation to my advisor and committee chair
Dr. Elena Castell-Perez for recommending this research topic and for her guidance,
knowledge, patience, and support throughout the study. I also thank my committee
members, Dr. Rosana G. Moreira and Dr. Alejandro Castillo for their guidance, support,
and help.
Profound thanks to Alex Puerto-Gomez for sacrificing his time and kindly
providing help vital to completion of this study. I want to thank also all my friends in the
Food Engineering Lab for their support and help in numerous ways.
Finally, thanks to my parents for their encouragement.

vi
TABLE OF CONTENTS
Page
ABSTRACT .......................................................................................................................ii
DEDICATION .................................................................................................................. iv
ACKNOWLEDGEMENTS ............................................................................................... v
TABLE OF CONTENTS .................................................................................................. vi
LIST OF FIGURES ........................................................................................................... ix
LIST OF TABLES ...........................................................................................................xii
CHAPTER I INTRODUCTION ....................................................................................... 1
CHAPTER II LITERATURE REVIEW ............................................................................ 8
2.1 Consumption of Spinach in the U.S. ........................................................................ 8 2.2 Foodborne Disease Outbreaks Associated with Fresh Produce and Leafy Green Vegetables ...................................................................................................................... 9 2.3 Contamination of Leafy Greens ............................................................................. 14
2.3.1 Preharvest Contamination ............................................................................... 14 2.3.2 Postharvest Contamination .............................................................................. 14
2.4 Listeria monocytogenes .......................................................................................... 16 2.5 Survival and Growth of Listeria monocytogenes on Leafy Green Vegetables ...... 18 2.6 Decontamination Methods for Fresh Produce ........................................................ 21
2.6.1 Chlorine ........................................................................................................... 21 2.6.2 Irradiation ........................................................................................................ 22
2.7 Predictive Microbiology ......................................................................................... 23 2.7.1 Primary Model ................................................................................................. 25
2.7.1.1 The Logistic Model .................................................................................. 26
2.7.1.3 Gompertz Model ...................................................................................... 26 2.7.1.2 Baranyi Model .......................................................................................... 27
2.7.2 Secondary Models for the Maximum Growth Rate ........................................ 28 2.7.2.1 Square-Root Models ................................................................................. 29
2.7.2.2 Gamma Concept ....................................................................................... 29 2.7.2.3 Cardinal Parameters Models (CPMS) ...................................................... 30
2.7.3 Secondary Models for Lag Time ..................................................................... 30 2.8 Quantitative Microbial Risk Assessment (QMRA) ............................................... 32

vii
CHAPTER III MODELING GROWTH OF LISTERIA MONOCYTOGENES AND LISTERIA INNOCUA ON FRESH BABY SPINACH LEAVES ..................... 35
3.1 Overview ................................................................................................................ 35 3.2 Introduction ............................................................................................................ 37 3.3 Materials and Methods ........................................................................................... 39
3.3.1 Food Material .................................................................................................. 39 3.3.2 Initial Natural Microbiota Enumeration .......................................................... 40 3.3.3 Inoculation and Preparation of Spinach Samples ............................................ 40 3.3.4 Bacterial Cultures ............................................................................................ 41 3.3.5 Inoculum Preparation ...................................................................................... 41 3.3.6 Washing and Sanitation (Chlorine) Treatments .............................................. 42
3.3.7 Microbial Enumeration .................................................................................... 42 3.3.8 Isothermal Growth Data .................................................................................. 43 3.3.9 Growth Models ................................................................................................ 43
3.3.9.1 Primary Model .......................................................................................... 43 3.3.9.2 Secondary (Dynamic) Models .................................................................. 44 3.3.9.3 Validation of Dynamic Models ................................................................ 45
3.3.10 Statistical Analysis ........................................................................................ 46 3.4 Results and Discussion ........................................................................................... 47
3.4.1 Water and Chlorine Washing .......................................................................... 47 3.4.2 The Effect of the Presence of Background Microbiota on the Growth of Listeria monocytogenes and Listeria innocua .......................................................... 50 3.4.3 Growth Models of L. monocytogenes and L. innocua in Fresh Baby Spinach 55
3.4.4 Secondary (Dynamic) Growth Models Listeria monocytogenes and Listeria
innocua ..................................................................................................................... 60 3.4.4.1 Model Validation ...................................................................................... 64
3.5 Conclusions ........................................................................................................ 68 CHAPTER IV QUANTITATIVE MICROBIAL RISK ASSESSMENT FOR
LISTERIA MONOCYTOGENES ON FRESH BABY SPINACH LEAVES .... 70
4.1 Overview ................................................................................................................ 70 4.2 Introduction ............................................................................................................ 71 4.3 Risk Assessment Methodology and Data Sources ................................................. 74
4.3.1 Hazard Identification ....................................................................................... 74
4.3.2 Hazard Characterization .................................................................................. 75
4.3.3 Exposure Assessment ...................................................................................... 77 4.3.3.1 Description of the Supply Chain of Fresh Baby Spinach ......................... 79 4.3.3.2 Prevalence and Initial Level of Listeria monocytogenes.......................... 80 4.3.3.3 Washing and Sanitizing (Chlorine) .......................................................... 81 4.3.3.4 Packaging ................................................................................................. 85
4.3.3.5 Cross-contamination ................................................................................. 86 4.3.3.6 Irradiation ................................................................................................. 86
viii
4.3.3.7 Radiosensitization Strategies .................................................................... 87 4.3.3.8 Transport .................................................................................................. 88 4.3.3.9 Growth of Listeria monocytogenes .......................................................... 88
4.4 Scenario Analysis ................................................................................................... 89 4.5 Risk Characterization ............................................................................................. 90 4.6 Monte Carlo Simulation ......................................................................................... 92 4.7 Results and Discussion ........................................................................................... 92 4.8 Conclusion ............................................................................................................ 102
CHAPTER V CONCLUSION ....................................................................................... 104
CHAPTER VI RECOMMENDATIONS FOR FURTHER STUDY ............................ 106
REFERENCES ............................................................................................................... 107
APPENDIX .................................................................................................................... 125

ix
LIST OF FIGURES
Page
Figure 4.1 Flow chart of fresh baby spinach process and distribution. ............................ 78
Figure 4.2 Probability of illness occurrence for Scenarios #1- #8. .................................. 97
Figure 4.3 Probability of illness occurrence in fresh baby spinach leaves base on scenarios of temperature abuse. ........................................................................ 98
Figure 4.4 Probability of infection occurrence in fresh baby spinach leaves irradiated at 1 kGy under different atmospheres at 21oC..................................................99
Figure 4.5 Comparison of risk between high and low no. of servings. .......................... 101
Figure A.1. The observed growth of Listeria monocytogenes depend on the initial concentration of total mesophilic bacteria on fresh baby spinach leaves at 5oC by fitting Baranyi model (Eq. 2.4)....………………......................................125
Figure A.2. The observed growth of Listeria innocua depend on the initial concentration of total mesophilic bacteria on fresh baby spinach leaves at 5oC by fitting Baranyi model (Eq. 2.4). .......................................................... 126
Figure A.3. The observed growth of Listeria monocytogenes depend on the initial concentration of total mesophilic bacteria on fresh baby spinach leaves at 10oC by fitting Baranyi model (Eq. 2.4). ........................................................ 127
Figure A.4. The observed growth of Listeria innocua depend on the initial concentration of total mesophilic bacteria on fresh baby spinach leaves at 10oC by fitting Baranyi model (Eq. 2.4). ........................................................ 128
Figure A.5. The observed growth of Listeria monocytogenes depend on the initial concentration of total mesophilic bacteria on fresh baby spinach leaves at 20oC by fitting Baranyi model (Eq. 2.4). ........................................................ 129
Figure A.6. The observed growth of Listeria innocua depend on the initial concentration of total mesophilic bacteria on fresh baby spinach leaves at 20oC by fitting Baranyi model (Eq. 2.4). ........................................................ 130
Figure A.7. The observed growth of Listeria monocytogenes depend on the initial concentration of total mesophilic bacteria on fresh baby spinach leaves at 30oC by fitting Baranyi model (Eq. 2.4). ........................................................ 131

x
Figure A.8. The observed growth of Listeria innocua depend on the initial concentration of total mesophilic bacteria on fresh baby spinach leaves at 30oC by fitting Baranyi model (Eq. 2.4). ........................................................ 132
Figure A.9. The observed growth of Listeria monocytogenes depend on the initial concentration of total mesophilic bacteria on fresh baby spinach leaves at 36oC by fitting Baranyi model (Eq. 2.4). ........................................................ 133
Figure A.10. The observed growth of Listeria innocua depend on the initial concentration of total mesophilic bacteria on fresh baby spinach leaves at 36oC by fitting Baranyi model (Eq. 2.4). ........................................................ 134
Figure A.11. The observed growth of Listeria monocytogenes and Listeria innocua on fresh baby spinach leaves at 5oC by fitting Baranyi model (Eq. 2.4). ............ 135
Figure A.12. The observed growth of Listeria monocytogenes and Listeria innocua on fresh baby spinach leaves at 10oC by fitting Baranyi model (Eq. 2.4). .......... 136
Figure A.13. The observed growth of Listeria monocytogenes and Listeria innocua on fresh baby spinach leaves at 20oC by fitting Baranyi model (Eq. 2.4). .......... 137
Figure A.14. The observed growth of Listeria monocytogenes and Listeria innocua on fresh baby spinach leaves at 30oC by fitting Baranyi model (Eq. 2.4). .......... 138
Figure A.15. The observed growth of Listeria monocytogenes and Listeria innocua on fresh baby spinach leaves at 36oC by fitting Baranyi model (Eq. 2.4). .......... 139
Figure A.16. Maximum growth rate for Listeria monocytogenes on fresh baby spinach leaves as a function of temperature. .................................................. 140
Figure A.17. Maximum growth rate for Listeria innocua on fresh baby spinach leaves as a function of temperature. .......................................................................... 141
Figure A.18. Lag time for Listeria monocytogenes on fresh baby spinach leaves as a function of temperature. .................................................................................. 142
Figure A.19. Lag time for Listeria innocua on fresh baby spinach leaves as a function of temperature. ................................................................................................ 143
Figure A.20. Maximum population density for Listeria monocytogenes on fresh baby spinach leaves as a function of temperature. .................................................. 144
Figure A.21. Maximum population density for Listeria innocua on fresh baby spinach leaves as a function of temperature. ............................................................... 145

xi
Figure A.22. The change of concentration of Listeria monocytogenes from farm to table (low initial concentration). ..................................................................... 146
Figure A.23. The change of concentration of Listeria monocytogenes from farm to table (high initial concentration). .................................................................... 147
Figure A.24. Probability distribution of the prevalence of Listeria monocytogenes on fresh baby spinach leaves. .............................................................................. 148
Figure A.25. Probability distribution of the initial concentration of Listeria
monocytogenes on fresh baby spinach leaves. ................................................ 149
Figure A.26. Probability distribution of the serving size of fresh baby spinach consumed per individual person. .................................................................... 150
Figure A.27. Probability of infection vs. ingested dose of Listeria monocytogenes on fresh baby spinach leaves. .............................................................................. 151
xii
LIST OF TABLES
Page Table 2.1. Outbreaks of listeriosis associated with produce (Adapted from Hoelzer et
al., 2012b). ........................................................................................................ 12
Table 2.2. U.S. recall cases associated with produce in 2012 and 2013 (between January and September) due to the presence of Listeria monocytogenes (Adapted from FDA, 2013). ............................................................................. 13
Table 2.3. Secondary lag time models (Adapted from Monsalve, 2008). ........................ 31
Table 3.1. Effect of washing treatment and initial population loads on the log-reductions of Listeria monocytogenes and Listeria innocua inoculated in fresh baby spinach leaves. ................................................................................ 48
Table 3.2. Effect of natural microflora on estimated maximum population density, maximum growth rate, and lag time, of Listeria monocytogenes inoculated in fresh baby spinach leaves determined using Baranyi model (Eq. 2.4). ........ 51
Table 3.3. Effect natural microflora on estimated maximum population density, maximum growth rate, and lag time of Listeria innocua inoculated in fresh baby spinach leaves determined using Baranyi model (Eq. 2.4). ..................... 52
Table 3.4. Estimated maximum population density, maximum growth rate, and lag time of Listeria monocytogenes inoculated in fresh baby spinach leaves by using Baranyi model (Eq. 2.4). ......................................................................... 57
Table 3.5. Estimated maximum population density, maximum growth rate, and lag time of Listeria innocua inoculated in fresh baby spinach leaves by using Baranyi model (Eq. 2.4). ................................................................................... 58
Table 3.6. The coefficient of aEq. (3.3) used to predict the values of maximum growth rate as a function of temperature for each microorganisms inoculated in fresh baby spinach leaves. ................................................................................ 61
Table 3.7. Coefficients of aEq. (3.4) used to predict the values of lag time as a function of temperature for each microorganisms inoculated in fresh baby spinach. ............................................................................................................. 62
Table 3.8. Coefficients of aEq. (3.5) used to predict the values of maximum population density as a function of temperature for each microorganism inoculated in fresh baby spinach leaves. ........................................................... 63

xiii
Table 3.9. Validation indices of developed models for maximum population density, maximum growth rate, and lag time of Listeria monocytogenes in fresh baby spinach leaves. ......................................................................................... 66
Table 3.10. Validation indices of developed models for maximum population density, maximum growth rate, and lag time of Listeria innocua in fresh baby spinach leaves. .................................................................................................. 67
Table 4.1. Prevalence of Listeria monocytogenes in vegetables. ..................................... 82
Table 4.1. Prevalence of Listeria monocytogenes in vegetables (continued). ................. 83
Table 4.2. Concentration assumed for Listeria monocytogenes in vegetables (Adapted from Carrasco et al., 2010). .............................................................................. 84
Table 4.3 Scenarios used in the present study. ................................................................. 91
Table 4.4 Calculated prevalence, initial and final population of Listeria
monocytogenes on fresh baby spinach leaves at time of consumption and relative growth. ................................................................................................. 94
Table 4.5. Model parameters and calculated values for eight scenarios of the probability of infective dose of Listeria monocytogenes in fresh baby spinach leaves. .................................................................................................. 96
Table A.1 Overview of simulation variables and parameters. ....................................... 152
Table A.1 Overview of simulation variables and parameters (continued) (This part was modified from Danyluk and Schaffner (2010)) ....................................... 153
Table A.1 Overview of simulation variables and parameters (continued) ..................... 154
Table A.1 Overview of simulation variables and parameters (continued). .................... 155
Table A.2. Estimated number cases of listeriosis based on high and low number of annual servings ............................................................................................... 156

1
CHAPTER I
INTRODUCTION
The number of foodborne diseases linked to consumption of fresh produce in the
United States has risen during the last twenty years. According to the Food and Drug
Administration (FDA), there have been 72 foodborne illness outbreaks linked to fresh
produce from 1996 to 2006 with a quarter of those outbreaks linked to fresh-cut produce
(Adavi, 2011).
Surveillance of vegetables and outbreaks associated with green leafy vegetables
has demonstrated that these foods can be contaminated with miscellaneous bacterial
pathogens, including Escherichia coli O157:H7, Salmonella, and Listeria
monocytogenes (Warriner et al., 2009; Franz et al., 2010). Green leafy vegetables, such
as spinach and lettuce, are the commodity group of most concern regarding
microbiological hazards of fresh produce because they have been connected to multiple
outbreaks of foodborne disease (FAO/WHO, 2008). For instance, 502 foodborne
outbreaks caused by various pathogens linked to leafy greens were reported in the U.S.
from 1973 to 2006, of which 18,242 cases were foodborne illness and 15 cases resulted
in death (FAO/WHO, 2008).
Listeria monocytogenes is a pathogen of concern because it causes approximately
1591 cases of foodborne illness annually. Of these cases, there are 1455 hospitalizations
and 255 deaths in the United States (Scallan et al., 2011). Furthermore, studies on the
presence of L. monocytogenes in vegetables have shown that it should be a concern

2
because although L. monocytogenes is rare in fresh produce, the lethality ratio of this
pathogen is higher than the other food borne pathogens (Lianou and Sofos, 2007; Koseki
et al., 2011; Sant`Ana et al., 2012a). In addition, lower doses of L. monocytogenes can
still cause infection in immunocompromised populations (Lianou et al., 2007) and grow
under refrigeration temperatures. For instance, after shredded romaine lettuce was stored
at 5oC for 10 days, the populations of E. coli O157:H7 and Salmonella were reduced by
1 log10 CFU/g whereas L. monocytogenes populations approximately grew 1 log10
CFU/g (Tian et al., 2012). Depending on commodities, the temperature for storing fresh
and fresh-cut vegetables should be controlled for the safety of consumer. As a result, all
of this information shows that quantitative assessment for potential contamination of L.
monocytogenes in fresh baby spinach or other green leafy vegetables is crucial to predict
outcomes before the actual implementation of prevention or decontamination steps.
Listeria innocua strains (M1, DSM 20649, LM 105 (ATCC 33090), Seeliger
1983 strain CIP 80.12) have been used as a surrogate for L. monocytogenes in food
systems to evaluate the effect of thermal processing (Murphy, 2000), sanitizer
effectiveness (Omary et al., 1993; Houtsma et al., 1994), and super-atmospheric oxygen
and carbon dioxide (Geysen et al., 2005), on the growth of L. monocytogenes,
respectively. However, Duh and Schaffner (1993) determined that the growth of L.
innocua PFEI and L. monocytogenes Scott A PFEI in brain heart infusion changed
differently depending on the temperature. O`Bryan et al. (2006) determined that L.
innocua M1 cannot be an appropriate surrogate to show the heat-resistance of L.
monocytogenes in meat because many factors such as the age of the culture, growth

3
conditions, and the stress response of both microorganisms may not be same. More
recently, Friedly et al. (2008) showed that the thermal survivability characteristics of L.
innocua M1 are not similar to those of L. monocytogenes in hamburger patties. These
results indicate that the validation of L. innocua for use as a surrogate for studies on
green leafy vegetables should be demonstrated because the stress response of L. innocua
and L. monocytogenes may not be similar when the products are treated with water and
chlorine. In addition, the growth of these two microorganisms in green leafy vegetables
may not be similar under different temperatures.
There are several reasons for survival and growth of L. monocytogenes and other
pathogens in spinach and other green leafy vegetables. First, biofilms on fresh produce
develop as groups of bacterial cells combine in exopolysaccharide materials. These
materials serve to prevent harm coming from environmental stressors as well as
containing desiccation and bactericidal agents (Morris and Monier, 2003). Second, the
phyllosphere parts of the plant protect the pathogen against washing or surface
sanitization methods such as water washing and chlorine (Whipps et al., 2008). The
internalization of pathogens into the plant vascular system is also an important concern
because decontaminants such as chlorine are commonly inadequate in eliminating
pathogens during washing procedures (Hora et al., 2005; Gomes et al., 2009).
Conventional decontamination techniques used in the produce industry such as
washing with chlorine, chlorine dioxide, use of organic acids, and ozone do not
eliminate pathogens in fresh and fresh-cut produces; they just reduce microbial
4
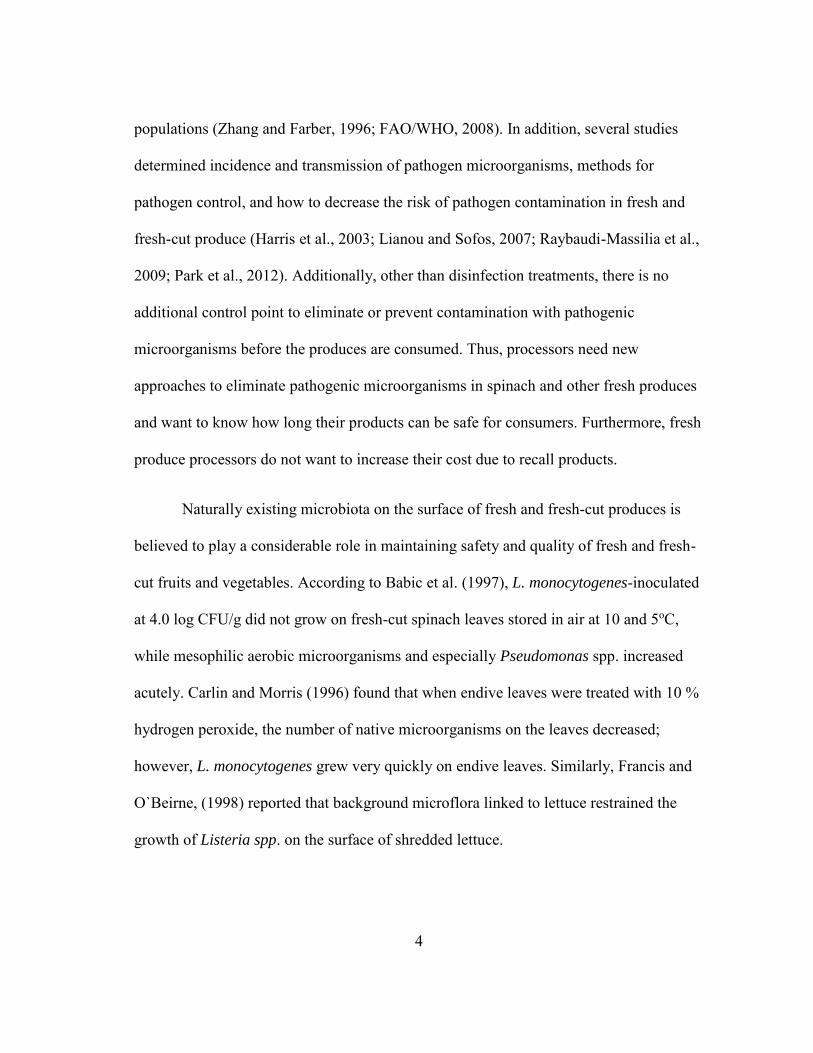
populations (Zhang and Farber, 1996; FAO/WHO, 2008). In addition, several studies
determined incidence and transmission of pathogen microorganisms, methods for
pathogen control, and how to decrease the risk of pathogen contamination in fresh and
fresh-cut produce (Harris et al., 2003; Lianou and Sofos, 2007; Raybaudi-Massilia et al.,
2009; Park et al., 2012). Additionally, other than disinfection treatments, there is no
additional control point to eliminate or prevent contamination with pathogenic
microorganisms before the produces are consumed. Thus, processors need new
approaches to eliminate pathogenic microorganisms in spinach and other fresh produces
and want to know how long their products can be safe for consumers. Furthermore, fresh
produce processors do not want to increase their cost due to recall products.
Naturally existing microbiota on the surface of fresh and fresh-cut produces is
believed to play a considerable role in maintaining safety and quality of fresh and fresh-
cut fruits and vegetables. According to Babic et al. (1997), L. monocytogenes-inoculated
at 4.0 log CFU/g did not grow on fresh-cut spinach leaves stored in air at 10 and 5oC,
while mesophilic aerobic microorganisms and especially Pseudomonas spp. increased
acutely. Carlin and Morris (1996) found that when endive leaves were treated with 10 %
hydrogen peroxide, the number of native microorganisms on the leaves decreased;
however, L. monocytogenes grew very quickly on endive leaves. Similarly, Francis and
O`Beirne, (1998) reported that background microflora linked to lettuce restrained the
growth of Listeria spp. on the surface of shredded lettuce.

5
Risk assessment tools and predictive microbiology concepts are crucial to
estimate growth of pathogens in fresh baby spinach and other fresh and fresh-cut
produce, because they can present insight to evaluate the safety of features of the
production process and allow the manufacturer to estimate results before actual
implementation (Puerta-Gomez et al., 2013b). Furthermore, quantitative risk assessment
methods can be helpful to inform policy decisions, which depend on the problem, the
time frame, and the specific risk management questions to be addressed. These models
also provide information to predict the microbiological shelf-life of products.
Quantitative microbiological risk assessment (QMRA) and predictive modeling
have become popular in the food microbiology and food safety engineering fields in the
last two decades (Mafart, 2005; Marks, 2008; Vercammen et al., 2013). These
quantitative tools enhance food safety by evaluating the effects of intervention measures
in food production processes. QMRA can be an important tool to figure out the impact
of different alleviation strategies (washing, chlorination, and cross contamination) on the
number of pathogens present in fresh baby spinach and other leafy vegetables. Because
the estimation of microbial risk naturally consists of variability and uncertainty,
simulation methods such as Monte Carlo are generally used in QMRA (Danyluk and
Schaffner, 2011).
Predictive modeling is necessary to estimate growth of pathogens in QMRA
because it provides information on the growth of pathogens in foods during processing
and storage (Perez-Rodriguez and Valero, 2013). Likewise, a dynamic model can be

6
used to estimate the population dynamics of pathogens in food systems at time-varying
temperature profiles (non-isothermal conditions) (Puerta-Gomez et al., 2013a).
The main goal of this study was to conduct a quantitative risk assessment
analysis for human health risk involving Listeria monocytogenes and fresh baby spinach
leaves. The main goal was achieved by carrying out these specific objectives:
(1) Validation of the feasibility of using L. innocua as a surrogate of L.
monocytogenes to predict growth of the pathogen on fresh baby spinach leaves under
storage (at constant temperature) and establish means to reduce microbial counts on the
produce during washing (water and chlorine) treatments.
(2) Evaluating of the effect of the initial level of L. innocua, L. monocytogenes,
and natural microbiota load on the surface of baby spinach leaves, and their interaction,
on the growth curves of L. innocua and L. monocytogenes at different storage
temperatures (5, 10, 20, 30, and 36oC).
(3) Prediction of the growth patterns of L. innocua and L. monocytogenes on
fresh baby spinach containing different natural microbiota levels stored at different
temperatures (5, 10, 20, 30, and 36oC).
(4) Development of predictive growth equations to estimate the growth of L.
innocua and L. monocytogenes in fresh baby spinach leaves.
(5) Development of a quantitative risk assessment model to determine
prevalence, concentration, and cross contamination of L. monocytogenes in fresh baby

7
spinach leaves by determining dose-response assessment based on the quantity of L.
monocytogenes consumed and magnitude and frequency of adverse health.

8
CHAPTER II
LITERATURE REVIEW
2.1 Consumption of Spinach in the U.S.
Spinach (Spinacia oleracea) is a functional food valued for its antioxidants, and
anti-cancer constituents and because it is also a good source of nutrients including high
levels of vitamin C, lutein, iron, folic acid, and magnesium (Neal, 2009). The U.S.
Department of Agriculture (USDA), the Centers for Disease Control and Prevention
(CDC), the National Cancer Institute (NCI) as well as the healthcare community and
numerous other organizations recommend consumption of spinach (Neal, 2009).
Spinach was consumed by 5.51% of the U.S. population who consumed 40% of spinach
in fresh as fresh baby spinach at restaurants and at home (Hoelzer et al., 2012a). Based
on Hoelzer et al. (2012a), the odds of consuming fresh leafy greens were significantly
lower for men than women, whereas adults (15 to 49 years of age) were significantly
more likely to consume leafy greens than older and elderly adults (i.e., adults older than
49 years old).
Although the harvesting area and the production capacity of spinach decreased
between 2010 and 2012, the production of spinach in 2012 was still over 240,000 ton
and occurred mainly in California (60%), Arizona (25%), New Jersey (5%), and Texas
(3.1%) (USDA/NASS, 2013). The average spinach consumption per person in the U.S.
was reported 1.9 pounds (0.86 kg) and this amount decreased 32% between 2007and
2009 (Lucier and Glaser, 2010). Fahs et al. (2009) reported that this reduction in
consumption of spinach could be related to the E. coli 0157:H7 outbreak associated with
9
contaminated baby spinach in 2006. Therefore, the fresh produce industry has had to
address this issue while increasing the shelf life of the leafy green.
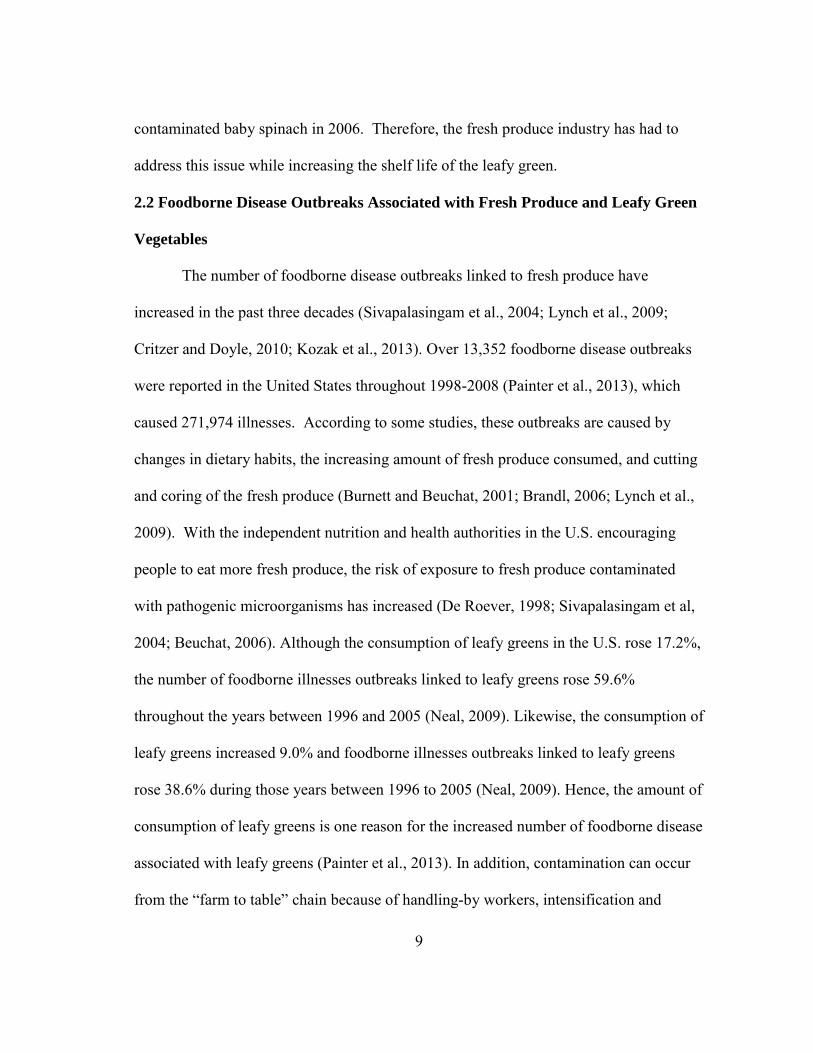
2.2 Foodborne Disease Outbreaks Associated with Fresh Produce and Leafy Green
Vegetables
The number of foodborne disease outbreaks linked to fresh produce have
increased in the past three decades (Sivapalasingam et al., 2004; Lynch et al., 2009;
Critzer and Doyle, 2010; Kozak et al., 2013). Over 13,352 foodborne disease outbreaks
were reported in the United States throughout 1998-2008 (Painter et al., 2013), which
caused 271,974 illnesses. According to some studies, these outbreaks are caused by
changes in dietary habits, the increasing amount of fresh produce consumed, and cutting
and coring of the fresh produce (Burnett and Beuchat, 2001; Brandl, 2006; Lynch et al.,
2009). With the independent nutrition and health authorities in the U.S. encouraging
people to eat more fresh produce, the risk of exposure to fresh produce contaminated
with pathogenic microorganisms has increased (De Roever, 1998; Sivapalasingam et al,
2004; Beuchat, 2006). Although the consumption of leafy greens in the U.S. rose 17.2%,
the number of foodborne illnesses outbreaks linked to leafy greens rose 59.6%
throughout the years between 1996 and 2005 (Neal, 2009). Likewise, the consumption of
leafy greens increased 9.0% and foodborne illnesses outbreaks linked to leafy greens
rose 38.6% during those years between 1996 to 2005 (Neal, 2009). Hence, the amount of
consumption of leafy greens is one reason for the increased number of foodborne disease
associated with leafy greens (Painter et al., 2013). In addition, contamination can occur
from the “farm to table” chain because of handling-by workers, intensification and
10
centralization of production and more sources of produce (De Roever, 1998; Burnett and
Beuchat, 2001; Olaimat and Holley, 2012).
Tauxe et al. (1997) reported that rises in the size of at risk population, increased
epidemiological surveillance, and improved methods of identifying and tracking
pathogens have added to the increase in fresh produce associated outbreaks. Centralized
processing from multiple farms also create a longer food chain, which increases the
growth of pathogens and their distribution may put more people at risk of foodborne
disease (De Roever, 1998; Painter et al., 2013). Furthermore, improvements in
healthcare have added to a raising proportion of elderly as well as immunocompromised
people (Carrasco et al., 2010). Burnett and Beuchat (2001) reported that several fresh
produce, including raspberries, basil, lettuce, alfalfa sprouts, radish sprouts, carrots,
salad vegetables, cabbage, tomatoes, watermelon, cantaloupe, green onions, parsley, and
spinach, have been recently linked to foodborne illnesses.
During 1998-2008, 22 % of all foodborne illnesses in the United States were
attributed to leafy green vegetables. In addition, illnesses linked to leafy green
vegetables were the second most frequent cause of hospitalization and the fifth most
frequent cause of death (Painter et al., 2013).
Preharvest and postharvest processing steps of leafy green vegetables contribute
to the increased incidence of foodborne illness outbreaks associated with leafy greens
(Prazak et al., 2002; Lianou and Sofos, 2007; Olaimat and Holley, 2012).
Bacteria, viruses, and protozoan cause foodborne disease outbreaks in fresh
produce epidemiologically; however, bacterial origin foodborne disease outbreaks linked

11
to leafy green vegetables were commonly reported (Olaimat and Holley, 2012).
Listeriosis outbreaks associated with leafy green vegetables are very important because
L. monocytogenes causing listeriosis can survive and grow at low temperature and has a
high mortality rate (Lianou and Sofos, 2007). L. monocytogenes is a big concern for
processors of leafy green vegetables such as spinach as well as ready-to-eat foods, meat
products, and dairy products (Francis et al., 1999; Szabo et al., 2000; Harris et al., 2003;
WHO&FAO, 2008). The first listeriosis outbreak was determined in 1981 when the
consumption of coleslaw contaminated by L. monocytogenes caused at least 41 cases of
illness and 18 deaths (Hoelzer et al., 2012b). Likewise, cantaloupes grown in Colorado
were involved in a multistate outbreak that sickened 139 people and caused 29 deaths in
2011 (CDC, 2012). Moreover, celery contaminated by L. monocytogenes from Sangar
Fresh Cut Produce in Texas included 10 cases of illness and 5 deaths in 2010 (FDA,
2010). Some other listeriosis outbreaks are presented in Table 2.1 (Hoelzer et al., 2012).
Recalls of produce due to contamination by L. monocytogenes are another issue because
they result in increased cost of products. Several recalls of various fresh produce
between 2012 and 2013 are shown in Table 2.2. These two tables clearly illustrate that
most outbreaks have been linked to fresh and fresh-cut products. Therefore, new
strategies must be developed to ensure their safety and avoid the potential of future
outbreaks due to consumption of fresh and fresh-cut produce.

12
Table 2.1. Outbreaks of listeriosis associated with produce (Adapted from Hoelzer et al., 2012b).
Year Source No. of
cases
No. of
hospitalizations
No. of
fatalities Location
1979
Tuna fish and chicken salads with celery, lettuce, and tomatoes, cheese
20 20 5 U.S.
1981 Coleslaw 41 40 18 Canada
1986 Vegetables or unpasteurized milk 28 28 5 Australia
1988 Vegetable rennet 1 Mother-child
pair (miscarriage)
United Kingdom
1989 Salad containing
lettuce (hypothesized)
1 United Kingdom
1989 Salted mushrooms 1 Finland
Frozen broccoli, cauliflower 7 U.S.
1993
Rice salad (cheese, pickled vegetables, frozen vegetables, hard-boiled eggs)
18 4 0 Italy
1997 Corn and tuna salad 1566 292 0 Italy 1998-1999 Fruit salad 6 6 5 Australia
Melon and watermelon
Case-control of Sporadic
cases
U.S.
2001 Potato salad 56 1 0 U.S. 2006 Taco/nacho salad 2 0 0 U.S. 2010 Alfalfa sprouts 20 16 0 U.S. 2010 Celery 10 10 5 U.S. 2011 Cantaloupe melon 146 142 30 U.S.

13
Table 2.2. U.S. recall cases associated with produce in 2012 and 2013 (between January and September) due to the presence of Listeria monocytogenes (Adapted from FDA, 2013).
Year Source
2013 Kale
2013 Salads
2013 Fresh potato salad
2013 Cantaloupes
2013 Cantaloupes
2013 Thai peppers
2013 Fruit and grain salad
2013 Sprouted seeds
2012 Romaine lettuce
2012 Apple slices
2012 Bagged salad
2012 Romaine hearts
2012 Romaine hearts
2012 Spinach
2012 Spouts
2012 Bagged salad
2012 Fruits, vegetables
2012 Cantaloupes
2012 Onions
2012 Bagged salad
2012 Bagged salad
2012 Alfalfa Sprouts
2012 Bagged salad
2012 Soybean sprouts

14
2.3 Contamination of Leafy Greens
2.3.1 Preharvest Contamination
During preharvest processing, spinach can be contaminated with pathogens at
any point. Potential risky preharvest points can be irrigation water, water used to apply
insecticides and fungicides, manure, feces, soil, wild, and domestic animals such as
birds, reptiles, and insects (Beuchat, 1996a; De Roever, 1998; Burnett and Beuchat,
2001; Park et al., 2012). Water quality is crucial during irrigation because the large
amount of surface area of leafy green vegetables such as spinach commonly obtains the
greatest amount of contamination (WHO/FAO, 2008). The methods of irrigation can
also cause contamination with pathogens such as L. monocytogenes (Park et al., 2012).
For example, drip and flood irrigation is better than spraying irrigation (De Roever,
1998). In addition, fields can be contaminated by feces either from the use of improperly
composted manure or from free roaming wild or domestic animals (Park et al., 2012).
Furthermore, leafy green vegetables such as spinach grow close to the soil making them
vulnerable to contamination (WHO/FAO, 2008). Lastly, poor workers hygiene and the
lack of proper sanitary facilities in the field can be a source of pathogenic
microorganisms (De Roever, 1998; Park et al., 2012).
2.3.2 Postharvest Contamination
During postharvest processing, leafy green vegetables such as spinach can be
contaminated by using water or ice, handling by workers, and equipment and
transporting vehicles (Prazak et al., 2002; FAO&WHO, 2008). In addition to
postharvest processing, these leafy green vegetables may be vulnerable to cross-
15
contamination during distribution in retail stores, food service facilities and at home
when temperature abuse throughout storage, packaging, and displaying can occur
(Prazak et al., 2002; Lianou and Sofos, 2007).
During processing of spinach or other leafy green vegetables, there are several
critical issues: (1) the process can cause damage such as cuts or bruises to the leafy
green, increasing the availability of nutrients for microorganisms to grow; (2) the lack of
a lethality step minimizing microbial growth; and (3) these products may be transported
to multiple locations which raises the risk for contamination (Prazak et al., 2002).
Fresh produce can be contaminated during the farm to table process in spite of using
proper hygiene, Good Agricultural Practices (GAPs) and Good Manufacturing Practices
(GMPs) (Anciso and Gregory, 2010). U.S. Food and Drug Administration (FDA) and
the Center for Food Safety and Applied Nutrition (CFSAN) published some guidelines
to improve safety of fresh fruits and vegetables (FDA, 2009). The last version of
guidance published in 2009, covering leafy greens, highlights the importance of
employing prevention of microbiological hazards instead of elimination strategies of
them because once pathogens contamination has occurred at fresh produce, removing or
killing the microbial pathogens is very difficult despite maintaining the fresh attribute of
the produce (FDA, 2009).
Several studies have helped to define critical points in preharvest conditions as
well as post harvesting and production (Beuchat, 1996a; Prazak et al., 2002; Gagliardi et
al., 2003; Anciso and Gregory, 2010; Gomez-Lopez et al., 2013). GAPs contain water,
worker health and hygiene, sanitary facilities, the use of municipal bio-solids and

16
manure, field sanitation, and transportation. Critical points linked to GMPs include the
level of interest of the personal working at a facility, the building facilities, equipment,
production, process controls, and policies and procedures. It has been that L.
monocytogenes, E.coli 0157:H7 and Salmonella can be found on fresh produce from the
field through the packing process (Johnston et al., 2005a).
2.4 Listeria monocytogenes
Although L. monocytogenes was discovered in 1924 by E.G.D. Murray and
others (Friedly, 2007), it did not get attention from the food industry until thirty years
ago when it was connected in a series of foodborne diseases in the U.S. (Carpentier and
Cerf, 2011). L. monocytogenes is a Gram-positive, small, rod-shaped bacterium,
facultative anaerobic, non-sporulate, and oxidase negative, catalase positive (Farber and
Peterkin, 1991). The genus of Listeria includes seven species, Listeria monocytogenes,
Listeria innocua, Listeria ivanonovii, Listeria welshimeri, Listeria grayi, Listeria
murrayi, and Listeria seeligeri) and the pathogenic genus of Listeria for human is only
L. monocytogenes (Monsalve, 2008).
Listeria innocua has been used as a surrogate organism to design and develop an
understanding of the behavior of L. monocytogenes in foods and food processing
environments because of similarities between them (Rodriguez et al., 2006; Milillo et al.,
2012). L. innocua has been also recommended as an indicator of the presence of L.
monocytogenes (Milillo et al., 2012). This microorganisms has very close genetic
relationship with L. monocytogenes (Glaser et al., 2001). Therefore, it may be a suitable
option as a surrogate for L. monocytogenes.

17
Several studies on thermal processing, use of aerosol, gaseous, ozone,
antimicrobial organic acids, and other food additives, used L. innocua as a surrogate for
L. monocytogenes, to design ways to control the growth, eliminate the presence, or
decrease the transmission of this pathogen in foods and a variety of systems (Fan et al.,
2007; Milly et al., 2008; Millillo et al, 2012). Kamat and Nair (1996) used L. innocua
F5646 and F5643 strains to analyze the response of four L. monocytogenes strains under
gamma radiation, heat, lactic acid, and sodium nitrite treatments. According to this
study, the survival of all six strains was similar under all treatments. Similarly, several
studies for the dairy industry showed that L. innocua can be used as a suitable biological
indicator for the evaluation of pasteurization process lethality (Foegeding and Stanley
1990; Fairchild and Foegeding, 1993).
However, O`Bryan et al. (2006) determined that L. innocua surrogate strains
cannot precisely mirror the behavior of L. monocytogenes in all test conditions or foods,
containing thermal and other stresses. Friedly et al. (2008) also found that the survival
abilities of L. innocua and L. monocytogenes are different during thermal treatments. In
addition, Tompkin (2002) stated that L innocua is not a good indicator for the presence
of L. monocytogenes because that can lead to unnecessary cleaning and sanitizing
procedures and increase using resources and taking valuable time from production. All
these results highlight that although L. innocua and L. monocytogenes are very similar
genetically, they can behave differently under the same conditions.

18
2.5 Survival and Growth of Listeria monocytogenes on Leafy Green Vegetables
L. monocytogenes is a psychrotrophic bacteria and can grow under low
temperatures (Warriner and Namvar, 2009). Koseki and Isobe (2005) determined the
minimum growth temperature of L. monocytogenes on lettuce is -4.26oC. Several
studies determined that L. monocytogenes found on and internalized in fresh and fresh-
cut vegetables may survive during long periods of time and it may even grow under
appropriate conditions (WHO&FAO, 2008; Hoelzer et al., 2012b). A study on different
leafy greens stored at 4oC for 9 days showed that L. monocytogenes concentration
remained constant (Farber et al., 1998). Similarly, L. monocytogenes on lettuce stored at
5oC and 10oC grew after 14 days of storage at both temperatures (Beuchat, 1996b).
L. monocytogenes attaches to fresh and fresh-cut produce which provides some
degree of protection to the pathogen. Factors such as cell`s surface charge, hydrophobic
effects, bacterial structures, excreted extracellular polysaccharides, and the type of
commodity affect the attachment of bacteria such that they survive and grow on leafy
green vegetables such as spinach (Neal, 2009). Babic et al. (1996) determined that
spinach leaves were colonized mainly in areas where the waxy cuticle was broken during
storage conditions. Besides, hydrophobic pockets and folds in the leaf`s surface provides
the protection for microorganisms such as L. monocytogenes during disinfection
treatments (Zhang and Farber, 1996).
Another means of protection for microorganisms on fresh produce is the
formation of a biofilm an extracellular polysaccharide matrix which ties multiple cells
together and attaches them to the surface of the plant (Sapers, 2001). Basically, biofilms

19
create physical and chemical barriers for microorganisms because there are composed of
multiple layers of microbial cells (Morris et al., 1997). Biofilms are formed by
pathogenic microorganisms such as L. monocytogenes, Salmonella, and E. coli 0157:H7
(Sapers, 2001). Ronner and Wong (1993) demonstrated that L. monocytogenes biofilm
cells and extracellular matrices would remain on sanitized surfaces. Morris et al. (1997)
showed biofilms formation inherently happening on the surface of spinach, lettuce, and
parsley.
Furthermore, pathogenic microorganisms penetrate the interior of cut leaf edges
or become internalized within leafy green vegetables` tissue (Takeuchi et al., 2000). In
addition, negative temperature differences in fresh produce through immersion can cause
internalization of E. coli 0157:H7 and Salmonella (Zhuang et al., 1995; Buchanan et al.,
1999). Thus, during the disinfection treatment, produce should be placed in water which
is colder than produce.
As a means to minimize the growth of L. monocytogenes on leafy greens, several
factors must be considered such as temperature, water activity, pH, and microbial
competition. L. monocytogenes can be survive at freezing temperatures (-6oC) (Hitchins
et al., 2001). Therefore, this pathogen can grow under the refrigerator temperatures
(usually from 0 to 8oC) (Pouillot et al., 2010). In addition. L. monocytogenes can grow
between pH 4.1 to 9.6, with an optimum range of 6.0-8.0 (Monsalve, 2008). Various
factors such as incubation temperature, available nutrients, moisture content, and product
composition affected this pH range for L. monocytogenes growth. Furthermore, water
activity affects the growth of this pathogens as well as temperature and pH. Petran and

20
Zottola (1989) determined the growth of L.monocytogenes in a 39.4% sucrose solution
with water activity of 0.92. Thus, the combination of low aw with low temperature and
pH can be considered to reduce this food safety hazard.
Natural microflora of food products can impact the growth of L. monocytogenes
because of microbial competition (Francis and O`Beirne, 1998; Amezquite and
Brashears, 2002; Cornu et al., 2011; Al-Zeyara et al., 2011).The natural microflora of
spinach between, 104-107 CFU/g, includes mesophilic aerobic bacteria, psychrotrophic
bacteria, Pseudomonadeceae, Enterobacteriaceae, Micrococcaceae, Lactic acid
bacteria, and yeast (Babic et al., 1996). Babic et al. (1997) showed that the growth of L.
monocytogenes in tryptic soy broth (TSA) could be reduced by native mesophilic
aerobic microorganisms on fresh-cut spinach at 30 and 10oC. Enterobacter spp. and
Lactic acid bacteria also reduced the growth of Listeria innocua on minimally processed
lettuce (Francis and O`Beirne, 1998). Bennik et al. (1998) reported that
bacteriocinogenic strains of Pediococcus and Enterococcus could be used to control the
growth of L. monocytogenes on mung-bean sprouts. Johnston et al. (2009) determined
antagonistic activity against E. coli 0157:H7 due to production of antimicrobial peptides
and acid by native microflora on fresh-cut lettuce and spinach. Hwang et al. (2011)
stated that the native microflora in cooked ham at 4-8oC affected the growth
characteristics of L. monocytogenes and reduced the maximum population density
(MPD) of L. monocytogenes in cooked ham. Besides, lactic acid flora in pork products
reduced L. monocytogenes concentration at 8oC (Cornu et al., 2011).

21
2.6 Decontamination Methods for Fresh Produce
Decontamination treatment steps are crucial in processing of fresh and fresh-cut
products because during this step, pathogenic microorganisms can be removed or
reduced (Olaimat and Holley, 2012). Since pathogens cannot be completely eliminated
because of the issue of attachment, the effectiveness of decontamination treatments must
be verified (Brackett, 1999) and new intervention strategies such as irradiation are worth
their evaluation (Gomes et al., 2011). Decontamination methods currently being used
can reduce 1-2 log units of microbial population on produce (WHO&FAO, 2008). There
are many sanitizing agents such as chlorine, chlorine dioxide, organic acids, ozone, and
peracetic acid to eliminate pathogens such as L. monocytogenes; however, the
effectiveness of these agents depend on many factors such as the temperature of water,
pH, water hardness, contact time, and presence of organic matter (Olaimat and Holley,
2012).
2.6.1 Chlorine
Chlorine is commonly used as a chemical disinfectant in the fruits and vegetables
industry (Beuchat, 1996a; Zhang and Farber, 1996; Keskinen et al., 2009). Generally,
50-200ppm of chlorine solutions is usually used in wash, spray, and flume waters in
fruits and vegetables industry (WHO, 2008). The efficiency of chlorine for reducing
microbial populations in fresh fruits and vegetables depends on the amount of free
available chlorine in water because chlorine reacts with organic matter (Zhang and
Farber, 1996). Furthermore, a result of the reaction between chlorine and organic matter
has been related to the production of carcinogenic compounds (Olmez and Kretzschmar,

22
2009). Zhang and Farber (1996) determined that the population of L. monocytogenes
artificially inoculated onto shredded lettuce and cabbage was reduced by 1.7 and 1.2 log
CFU/g respectively when treated with 200mg/L of chlorine solution for 10 minutes.
Francis and O`Beirne (2002) reported that L. innocua concentration on shredded lettuce
was reduced 1-1.5 log when agitated in a water-chlorine solution (10 ppm) for 10
minutes Burnett et al. (2004) reported that L. monocytogenes inoculated iceberg lettuce
treated with water or with 200mg/L chlorine had reductions in population of 0.60 and
1.76 log CFU per lettuce piece, respectively.
2.6.2 Irradiation
Irradiation exposes the food to a suitable level of ionizing radiation in the form of
electron beams, gamma rays or X-rays to control or eliminate bacteria, viruses or insects
that might be present. In the U.S., irradiation has been legalized for poultry, spice, dry
ingredients in August, 2008, the U.S. FDA approved the irradiation of spinach and
iceberg lettuce at a maximum absorbed dose of 4.0 kGy for microbial inactivation (US
FDA, 2008).
Most surface decontamination methods fail to assure produce safety whereas
application of irradiation has been reported as very effective (Niemira, 2007; Gomes et
al, 2008). Neal (2009) reported that low dose e-beam irradiation may be a feasible tool
for decreasing microbial populations or removing E. coli 0157:H7 and Salmonella from
spinach with minimal product damage. Similarly, Gomes et al. (2011) pointed out that a
treatment by e-beam irradiation of 0.7 kGy on baby spinach leaves under 100% oxygen
at room temperature would assure a 5-log reduction of either Salmonella spp. and

23
Listeria spp. without detrimental effects on product quality. Furthermore, compared to
other decontamination methods, irradiation is a promising decontamination method for
leafy greens for other reasons besides its high efficacy. First, irradiated spinach is free of
chemical residues. Second, irradiation treatment may be conducted either before or after
packaging. Lastly, irradiation only causes minimal environmental pollution. In addition,
it has been determined that irradiation treatment with a dose up to 1 kGy will maintain
the overall quality of spinach (Gomes et al., 2008). Nevertheless, market acceptance of
the application of irradiation technology on spinach is still debatable and the high cost of
irradiation-associated facilities and equipment make it unaffordable to small
manufacturers (Wu, 2010).
2.7 Predictive Microbiology
The main concern of the food industry is protecting food products from microbial
contamination. Microbial growth and survival in foods are affected by several conditions
such as temperature, pH, water activity, antimicrobials, sodium nitrite, and sodium
chloride (McKellar, 1997; Juneja, 2003; Moller et al., 2013).
Predictive microbiology in foods is a wide broad scientific field containing
insight for evaluating the effects of processing operations on microbial growth, and the
resulting shelf life and safety of food products. It brings together mathematical,
statistical, and microbiological principles to predict quantitatively the behavior of
microbial populations in foods. Predictive models are useful tools, capable of studying
the effects of various variables on growth and reduction of pathogens in foods
(McMeekin et al., 2013; Perez-Rodriguez and Valero, 2013).
24
Predictive models provide a description of a real system by using mathematical
equations. They could be very useful tools to support decision making such as
justification for determining critical limits in HACCP plans. These models can also be
very helpful to processors of as meat and poultry, milk, and fruit and vegetables and
regulatory agencies to minimize the risk of L. monocytogenes in the food products
(McMeekin et al., 1993; McKellar, 1997; Coroller et al., 2006).
Several growth model software programs are available for the food industry right
now (Perez-Rodriguez and Valero, 2013). The Pathogen Modelling Program (PMP), a
predictive software program, developed by the USDA Agriculture Research Service
(USDA, 2013) provides growth models for L. monocytogenes, Escherichia coli
0157:H7, Bacillus cereus, Staphlylococcus aureus, Clostridium perfringens, Salmonella
spp, and Shigella flexneria under various environmental conditions. Another software
program to model bacterial growth is DMFit (IFR, 2013) an excel add-in program,
developed based on the work of Baranyi and Roberts (1994).
The development of a predictive model (also called the primary model) starts by
establishing microbial growth or death under constant conditions of temperature, pH,
and/or water content. Then, it determine the effect of the environmental variables on the
parameters of the primary model (this is called a secondary model). Afterward, primary
and secondary models are integrated to develop a dynamic model for predicting the
growth of bacteria under different environmental conditions (Perez-Rodriguez and
Valero, 2013).

25
2.7.1 Primary Model
The purpose of the primary model is to define the kinetics parameters of a
process such as maximum growth rate, lag phase, and inactivation rate as a function of
treatment time. An appropriate primary model should explain the kinetics of microbial
growth with the fewest of variables. Growth curves are used to explain observation in
processing operations, and help in assessing methods for enhancing the overall process
effectiveness and risk assessment (Marks, 2008).
Bacterial growth curves are identified with the change in the number of
microorganisms with time as affected by a number of intrinsic and extrinsic factors
which are used for predicting growth, survival, and control of desirable and undesirable
microorganisms in food systems. Monsalve (2008) characterized microbial growth curve
by four main phases as follows: (1) the lag phase or the adaptation period described as
an adjustment period throughout which bacterial cells adapt themselves to get advantage
of the new environment and initiate exponential growth; (2) the exponential or
logarithmic phase defined as the grow of microorganisms in their environment until they
reach a maximum population level; (3) the stationary phase defined as the time when the
growth rate of microorganisms equals the death rate of microorganisms; (4) the death
phase stated as the period when the microbial population starts to decrease because of
reduced concentration of nutrients or physiological sate of cells.
Some examples of primary growth models (Monsalve, 2008; Perez-Rodriguez
and Valero, 2013) are:

26
2.7.1.1 The Logistic Model
Fujikawa et al. (2004) reported that although bacterial growth curves are
generally sigmoid on a semi-logarithmic plot, the logistic model generates a convex
curve consisting of a monotonously increasing portion and stabilizing one, without a lag
phase at the initial period. Therefore, for fitting the bacterial growth data, the equation of
logistic model was modified as follows (Chowdhury et al., 2007):
𝑦(𝑡) = 𝐶 + (𝐴/(1 + exp(−𝐵(𝑡 − 𝑀)))) (2.1)
herein, C is the initial level of inoculation (log CFU/g); A represents the difference
between the maximum and minimum growth values (log CFU/g); M is the time (hours)
at which the slope of the sigmoidal growth reaches a maximum value; and B represents
the maximum growth rate relative to the amount of growth at time M.
2.7.1.3 Gompertz Model
The Gompertz growth model is given as follows (Gibson et al., 1988):
𝑁(𝑡) = 𝐶 + 𝐴 ∗ exp(− exp(−𝐵(𝑡 − 𝑀))) (2.2)
herein, C is the value of the lower asymptote (log CFU/g); A is the asymptotic term
(log10), M is the time at which the slope of the sigmoidal growth reaches a maximum
value and the B is the maximum growth rate relative to the amount of growth at time.
The Gompertz model was used in several studies (Juneja et al., 2009;
Kreyenschmidt et al., 2009; Slongo et al., 2009; Huang, 2011; Zimmermann et al., 2011;
Li et al., 2013). The most of them mentioned that the growth rate and lag time estimated
from the Gompertz model were a little higher than other models.
27
2.7.1.2 Baranyi Model
Baranyi proposed the following differential equation (Baranyi and Roberts,
1994):
𝑑𝑥
𝑑𝑡= 𝛼(𝑡) ∗ µ𝑚𝑎𝑥 ∗ 𝑢(𝑥) ∗ 𝑥 (0≤ t < ∞; 0 < x) (2.3)
herein, α(t) is a process of adjustment function (CFU/g); u(x) indicates the inhibition
function because it explains the transition of the growth curve to the stationary phase
(CFU/g); µmax represents the maximum growth rate (h-1).
The logarithm of the solution of Eq. (2.3), y(t)=ln(x(t), can be expressed as:
𝑦(𝑡) = 𝑦𝑜 + µ𝑚𝑎𝑥 ∗ 𝐹(𝑡) − ln(1 +𝑒µ𝑚𝑎𝑥𝐹(𝑡)−1
𝑒(𝑦𝑚𝑎𝑥−𝑦𝑜)
) (2.4)
𝐹(𝑡) = 𝑡 +1
𝑣𝑙𝑛(𝑒−𝑣𝑡 + 𝑒−ℎ𝑜 − 𝑒(−𝑣𝑡−ℎ𝑜)) (2.5)
herein, y(t) is the natural logarithm of the population at time t (ln CFU/g); yo represents
the initial population number (ln CFU/g); ymax represents the maximum population (ln
CFU/g); ho represents µmax*tlag, where tlag is the lag time (hours); µmax represents the
maximum specific growth rate (1/hours); v is the rate of increase of the critical substrate.
Assuming that after the inoculation, the critical substrate grows at the same specific rate
as the cells in the exponential phase, v= µmax.
Based on the physiological state of the cell, the model of Baranyi and Roberts
(1994) predicts microbial growth very well. In several studies, this dynamic model was
successfully implemented for a variety of growth conditions such as temperature, pH,
and water activity (Koseki and Isobe, 2005a; Ding et al., 2012; Puerta-Gomez et al.,
2013a). Koseki and Isobe (2005b) used the Baranyi model to predict the growth of E.
28
coli 0157:H7, Salmonella, and L. monocytogenes on lettuce at fluctuating temperatures
from the farm to retail market. In that study, the growth kinetic parameters were
presented at isothermal temperatures (5, 10, 15, 20, and 25oC). Then, these model
parameters were used to anticipate pathogen growth under fluctuating temperatures in
the Baranyi primary model together with the secondary model of Ratkowsky (Koseki
and Isobe, 2005b). According to this study, the Baranyi model can be used to accurately
predict the growth of pathogens under fluctuating temperatures in fresh produce after
harvest. Ding et al. (2012) verified that the performance of these predictive models is
good for the growth of E. coli 0157:H7 on cabbage. In addition, Puerta-Gomez et al.
(2013a) reported that the Baranyi model is adequate to determine the growth of E. coli
spp. and Salmonella Typhimurium LT2 in baby spinach leaves under slow cooling. In
comparison to the Baranyi model, Pathogen modeling program (PMP) model and the
modified Gompertz model overestimated the growth rate of pathogens in produce
because PMP-derived media, so microorganisms are not exposed to factors such as the
structure of foods and the presence of background of microflora among other issues and
the modified Gompertz model has a different structure (Koseki and Isobe, 2005b;
Huang, 2011; Sant`Ana et al., 2012b).
2.7.2 Secondary Models for the Maximum Growth Rate
Secondary models define the effects of environmental conditions such as
temperature, pH, water activity, oxygen availability, added preservatives and modified
atmospheres on the values of the parameters of a primary model (Monsalve, 2008).
29
These models predict the changes in the parameters of primary models such as the
maximum specific growth rate and lag time.
Most commonly used secondary models (Monsalve, 2008) are:
2.7.2.1 Square-Root Models
At the beginning, these secondary models were suggested by Ratkowsky et al.
(1982), who determined a linear relationship between the square root of the maximum
growth rate and temperature.
√µ𝑚𝑎𝑥 = 𝑏 ∗ (𝑇 − 𝑇𝑚𝑖𝑛) (2.13)
herein, b represents a regression coefficient (oC-1*h-1/2); T represents the intercept of the
predicted function and the temperature axis (oC); Tmin represent the notional minimum
temperature below which maximum growth rate is equal to 0 (oC).
Then, this model was developed to cover the whole temperature growth range
(Perez-Rodriguez and Valero, 2013):
√µ𝑚𝑎𝑥 = 𝑏 ∗ (𝑇 − 𝑇𝑚𝑖𝑛)(1 − 𝑒𝑐(𝑇−𝑇max)) (2.14)
herein, c is a parameter (oC); Tmax is the theoretical maximum temperature at which
growth can be observed (oC).
2.7.2.2 Gamma Concept
The gamma-concept-based model was used to determine the µmax of an
experiment, containing growth and/or recovery, can be stated as a function of an
environmental factor, if all other environmental factors are kept constant as (Giffel and
Zwietering, 1999; Leroy and Vuyst, 2005):
ɣ =µ𝑚𝑎𝑥
(µ𝑚𝑎𝑥)𝑜𝑝𝑡= ɣ(𝑇) ∗ ɣ(𝑝𝐻) ∗ ɣ(𝑎𝑤) (2.15)
30
herein, ɣ is a self-inhibition factor; µmax is the growth rate at actual environmental
conditions (h-1); (µmax)opt is the growth rate at optimal environmental conditions and the
absence of inhibitory substances (h-1). The inhibition function ɣ determines the initial
inhibition because of sub optimal temperature (ɣ(T)), water activity (ɣ(aw)), and (ɣ(pH))
conditions. Furthermore, inhibition because of the initial presence of inhibitory
compounds, such as lactic acid (ɣLa), sodium chloride (ɣNaCl), and sodium nitrite (ɣNaNO2)
has be taken into account.
2.7.2.3 Cardinal Parameters Models (CPMS)
Cardinal parameters models are used to determine the effect of temperature on
microbiological growth rates. In CPMs, explicit models parameters Tmin and Tmax (oC)
are contained (Rosso et al., 1995):
µ𝑚𝑎𝑥 = µ𝑜𝑝𝑡 ((𝑇−𝑇𝑚𝑎𝑥)(𝑇−𝑇𝑚𝑖𝑛)
2
(𝑇𝑜𝑝𝑡−𝑇𝑚𝑖𝑛)((𝑇𝑜𝑝𝑡−𝑇𝑚𝑖𝑛)−(𝑇𝑜𝑝𝑡−𝑇𝑚𝑎𝑥)(𝑇𝑜𝑝𝑡+𝑇𝑚𝑖𝑛−2𝑇))) (2.16)
µmax = 0, for Tmin<T<Tmax
for T≤Tmin
for T≥Tmax
herein, Tmax is the maximum temperature at which no growth occurs (oC); Tmin is the
minimum temperature at which no growth occurs (oC); Topt is the temperature at which
µmax is equal to its optimal value (oC); µmax is the specific growth rate (h-1) ; and µopt is
the optimum specific growth rate (h-1).
2.7.3 Secondary Models for Lag Time
Lag times are affected by various environmental factors. For instance when the
media is changed the growth rate will be influenced resulting in changes in the lag time.
31
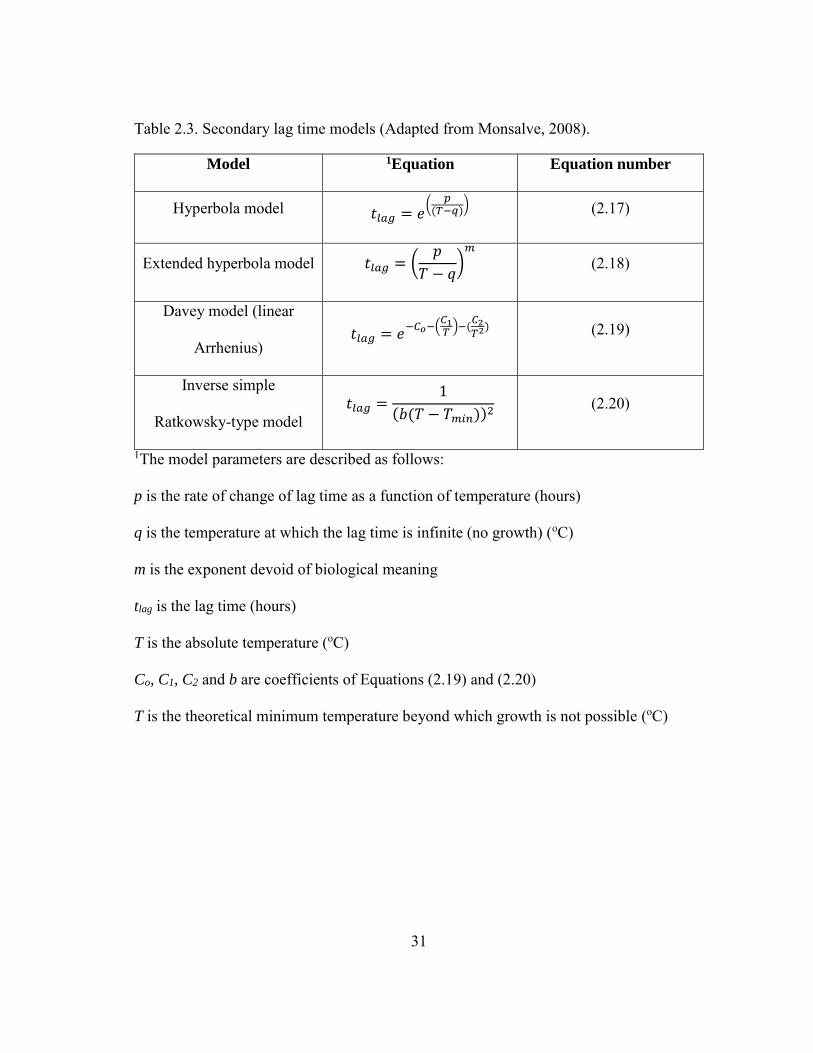
Table 2.3. Secondary lag time models (Adapted from Monsalve, 2008).
Model 1Equation Equation number
Hyperbola model 𝑡𝑙𝑎𝑔 = 𝑒(
𝑝(𝑇−𝑞)
) (2.17)
Extended hyperbola model 𝑡𝑙𝑎𝑔 = (𝑝
𝑇 − 𝑞)𝑚
(2.18)
Davey model (linear
Arrhenius) 𝑡𝑙𝑎𝑔 = 𝑒
−𝐶𝑜−(𝐶1𝑇)−(
𝐶2𝑇2
) (2.19)
Inverse simple
Ratkowsky-type model 𝑡𝑙𝑎𝑔 =
1
(𝑏(𝑇 − 𝑇𝑚𝑖𝑛))2 (2.20)
1The model parameters are described as follows:
p is the rate of change of lag time as a function of temperature (hours)
q is the temperature at which the lag time is infinite (no growth) (oC)
m is the exponent devoid of biological meaning
tlag is the lag time (hours)
T is the absolute temperature (oC)
Co, C1, C2 and b are coefficients of Equations (2.19) and (2.20)
T is the theoretical minimum temperature beyond which growth is not possible (oC)
32
Some secondary models that are used to predict the effect of temperature on the lag time
of microorganisms are presented in Table 2.3 (Monsalve, 2008).
2.8 Quantitative Microbial Risk Assessment (QMRA)
Quantitative microbial risk assessment (QMRA) has been developed at the
national and international levels as a systematic and objective approach for appraising
information identified with microbial hazards in foods and linked risks, pointing out both
likelihood and impact of disease (Lammerding and Paoli, 1997; Romero-Barrios et al.,
2013). QMRA is as a predictive and decision-making tool and aims to determine the data
gaps in the database and requirement of additional information (Montville and
Schaffner, 2005). The U.S. Department of Agriculture (USDA) and Environmental
Protection Agency (EPA) published a microbial risk assessment guideline for microbial
contamination of food and water (USDA/EPA, 2012). The QMRA approach includes
four components: (1) hazard identification, (2) exposure assessment, (3) hazard
characterization (Dose-response assessment), and (4) risk characterization (Cassin et al.,
1998). These four components are described in detail in Chapter IV.
QMRA generally includes different mathematical models describing the growth
and survival of bacteria, consumption of the bacteria in food, and subsequent illness,
with probability distributions and Monte Carlo simulation. A probability distribution is a
mathematical representation of the relative possibility of a spontaneous parameters
which choosing on a specific value. Uncertainty linked to the model and the level of the
human illness are estimated by using Monte Carlo simulation. Disinfection and

33
decontamination strategies may be computed in the same way and cost/benefit may be
managed for prevention of illness.
So far, available QMRA models for the risks linked to leafy greens vegetables
throughout the supply chain are very limited. In the U.S., the preliminary QMRA
framework for risk linked to leafy greens from farm to consumption contributed with
initial risk estimates for E. coli 0157:H7 in leafy greens (Danyluk and Schaffner, 2011).
Carrasco et al. (2010) determined the risk of L. monocytogenes in ready-to-eat lettuce
salads from farm to table in Spain. In this study, the estimated number of listeriosis cases
was 102 and 105 for low and high risk subpopulations respectively. Besides, according to
this study, MAP was a very effective method to decrease the number of cases.
Tromp et al. (2010) assessed the risk of E. coli 0157:H7, Salmonella, and L.
monocytogenes in leafy green vegetables consumed at salad bars, based on modeling
supply chain logistics in the Netherlands. This study showed that the risk of listeriosis-
induced fetal mortality in the perinatal population raised from 1.24*10-4 (fixed storage
time) to 1.66*10-4 (supply chain logistic). Franz et al. (2010) also assessed the risk of E.
coli 0157, Salmonella, and L. monocytogenes in leafy green vegetables consumed at
salad bars in Netherlands. They estimated the average number of cases per year linked to
the consumption of leafy greens at salad bars were 166, 187, and 0.3 for E.coli 0157:H7,
Salmonella, and L. monocytogenes respectively. Ding et al. (2013) determined risk of L.
monocytogenes on lettuce from farm to table in Korea. This study found that the final
contamination levels of L. monocytogenes at restaurant and home were -1.50 log CFU/g
and -0.146 log CFU/g respectively. They also estimated the average number of annual
34
listeriosis cases varied from 559 to 817, depend on the different r-values employed in the
exponential dose-response model (this is explained in Chapter IV), which means the
incidence of listeriosis ranged from 11.9 to 17.4 cases per million person. Puerta-Gomez
et al. (2013b) assessed the risk of contamination of ready-to-eat spinach with Salmonella
in the U.S. they and found that irradiation was the most effective means to reduce the
number of tainted samples from 84% to 0.1% for highly cross-contaminated lots (3 log
CFU/g).

35
CHAPTER III
MODELING GROWTH OF LISTERIA MONOCYTOGENES AND LISTERIA
INNOCUA ON FRESH BABY SPINACH LEAVES
3.1 Overview
Predictive models are valuable tools for manufacturers to develop process
controls to reduce the risk of pathogen contamination in fresh and fresh-cut produce.
These predictive models can also provide an estimate of the produce shelf life based on
“microbial safety”.
The objectives of this study were to: (1) validate the use of L. innocua as a
surrogate for L. monocytogenes to simulate the growth of the pathogenic strain on fresh
baby spinach leaves and, reduction of bacterial counts on the produce during washing;
(2) develop and validate a dynamic model for prediction of growth of L. monocytogenes
and L. innocua under different storage temperature; and (3) evaluate the effect of
temperature and natural microflora on the growth of both microorganisms on fresh baby
spinach leaves.
Results showed that the total reduction of L. monocytogenes and L. innocua
inoculated in fresh baby spinach leaves after washing was significantly different
(P<0.05) for both microorganisms. For water and chlorine washing, the observed
average log10 reduction of L. monocytogenes and L innocua was 0.96 and 1.60 at room
temperature (~22oC), respectively.

36
Growth data for L. monocytogenes and L. innocua on fresh baby spinach leaves
were collected at 5, 10, 20, 30, and 36oC. Three replications were performed for each
temperature. Growth curves were fitted to the primary model (Baranyi) to estimate the
initial cell concentration, (yo), lag time, (tlag), maximum population density, (ymax), and
maximum growth rate, (µmax). With the exception of R2=65 for L. innocua (the initial
concentration of total mesophilic bacteria was 5.51 log CFU/g at 10oC), the model
showed a good correlation coefficient at all temperatures and concentration of natural
microflora (R2>0.70) for both microorganisms. Root mean squared error (RMSE)
ranging from 0.09 to 0.47 log CFU/g for L. monocytogenes and from 0.08 to 0.42 log
CFU/g for L. innocua was also used to evaluate the model`s performance. In addition,
the natural background microflora affected the growth of L. innocua more than L.
monocytogenes on fresh baby spinach leaves especially at temperatures 10>T>30.
For each microorganism, a dynamic model was developed and validated for ymax,
tlag, and µmax. The accuracy factor, (Af), bias factor, (Bf), and the standard error of
prediction, (%SEP), were also calculated and evaluated between observed data and
predicted values. The results pointed out that the developed secondary models displayed
a good agreement between the observed and predicted values, with the exception for the
lag time of L. innocua.
These results suggest that, before L. innocua is used as a surrogate for Listeria
monocytogenes, it should be tested for each particular produce. These models for L.
monocytogenes can be suitable to estimate and control the growth of L.monocytogenes
growth on fresh baby spinach.

37
3.2 Introduction
The consumption of fresh and fresh-cut vegetables has increased in recent years
worldwide (Maatta et al., 2013). Codex Alimentarius Commission (CAC) wanted that
the Food and Agriculture Organization (FAO) and the World Health Organization
(WHO) to contribute scientific advice to develop commodity-specific annexes for the
Codex Alimentarius “Codex of Hygienic Practice for Fresh Fruits and Vegetables”. The
reason behind this request was that the committee emphasized the need to determine
connections with the control of specific hazards of concern, especially fresh fruit and
vegetable products, and support terms of reference as guidance to the type of scientific
advice needed (CAC, 2003).
In the United States, there are nearly 2500 cases of listeriosis annually and these
cases result in about 500 deaths (Morrissey et al., 2010). Due to these high infection
rates and especially high number of fatalities, approximately 20-30% of all foodborne
fatalities, listeriosis is an important concern (Milillo et al., 2012). L. monocytogenes is a
common pathogenic microorganism in nature and has been found on numerous
domesticated animals (Park et al., 2012). L. monocytogenes and L. innocua are the two
most widespread Listeria spp. isolated in human feces, sewage, and soil (Beuchat,
1996b). Therefore, food products can be contaminated with L. monocytogenes during the
pre-harvesting process. L. monocytogenes can grow in a wide pH range (from 4.1 to 9.6)
and at refrigerator temperature and it has high resistance against high levels of salt (up to
10%) (Cole et al., 1990). Furthermore, Kalmokoff et al. (2001) showed that L.
monocytogenes has displayed the ability to form biofilms adhering to food products.

38
Biofilm formation allows necessary chemical transfer processes to happen between cells
and the external environment whereas protecting bacteria against potentially harmful
environment al conditions such as disinfectants (Nilsson et al., 2011).
L. monocytogenes is feasible for laboratory experiments, but because of the risk
of exposing vulnerable individuals it cannot be safely studied in such environments if
they are not Biosafety level 2 labs. Therefore, the use of a surrogate organism is crucial
to understand the behavior of L. monocytogenes in foods and food processing
environments. Listeria innocua is usually used as a surrogate for L. monocytogenes due
to their close genetic relationship (Guo et al., 2013). However, O`Bryan et al. (2006)
determined that L. innocua surrogate strains cannot exactly mirror the behavior of L.
monocytogenes in all test conditions/foods, containing thermal and other stresses.
Friedly et al. (2008) also demonstrated that the survival ability of L. innocua strains in
thermal treatments is different from L. monocytogenes. Therefore, the validation of L.
innocua as a surrogate for L. monocytogenes should be proved for each food matrix and
decontamination treatments such as water and chlorine washing, especially in the case of
leafy greens.
Several bacterial growth models have been developed. Although most predictive
models have been constructed in an artificial nutrient broth environment, many of them
have been developed in real foods (Farber et al., 1995; Murphy et al., 1996; Koseki and
Isobe, 2005a). Several bacterial growth models have been built in for fresh produce
(Rodriguez et al., 2000; Koseki and Isobe, 2005b; Puerta-Gomez et al., 2013a).
Nevertheless, factors such as temperature, the food product, and the indigenous

39
microflora of fresh produces significantly influence the growth and death of pathogenic
microorganisms. Duh and Schaffner (1993) determined that L. innocua grows faster than
L. monocytogenes at temperatures below 42oC. This study also showed that the lag time
of L. monocytogenes is longer than that of L. innocua at temperatures below 8oC. Thus,
if L. innocua is used as a surrogate for L. monocytogenes at these conditions
(8≥T≤42oC), the result collected will include errors. Therefore, the validation of L.
innocua as a surrogate for L. monocytogenes under the same conditions should be tested.
The objectives of this study were to (1) validate the feasibility of using L.
innocua as a surrogate of L. monocytogenes to predict growth of L. monocytogenes on
fresh baby spinach leaves under storage (constant temperature) and reduction of the
pathogen on the produce during washing (water and chlorine) treatments; (2) determine
the effect of initial level of L. innocua and L. monocytogenes, and natural microbiota
load on the surface of baby spinach leaves, and their interaction on the growth curves of
L. innocua and L. monocytogenes at different storage temperatures (5, 10, 20, 30, and
36oC); (3) predict the growth patterns of L. innocua and L. monocytogenes when fresh
baby spinach contains different natural microbiota levels at different storage
temperatures (5, 10, 20, 30, and 36oC); and (4) develop predictive growth equations to
estimate the growth of L. innocua and L. monocytogenes on fresh baby spinach leaves.
3.3 Materials and Methods
3.3.1 Food Material
Bags of fresh baby spinach leaves (Spinacea oleracea) were obtained from a
local grocery store. All bags with same expiration date were selected to ensure

40
uniformity of the produce. The product in package was stored at 5°C for no more than 24
hours prior to the experiments. All leaves showing signs of wilt and decay were
discarded and then 5-g was weighted and dispensed into a sterile stomacher bags (18 oz
Whirl Pak® bag) before inoculation.
3.3.2 Initial Natural Microbiota Enumeration
Fresh baby spinach leaves were analyzed at the beginning of every experiment
following a plate count enumeration technique. Aerobic mesophilic bacteria were
enumerated by spread plating on Tryptic Soy Agar (TSA) incubated at 36°C for no more
than 48 hours. Yeasts and molds were quantified by spread plating on Sabouraud
Dextrose Agar (pH 5.6, adjusted with 0.1% citric acid) after 5 days of incubation at
20°C.
3.3.3 Inoculation and Preparation of Spinach Samples
Five-gram portions of spinach leaves were dispensed into sterile stomacher bags
(18 oz Whirl Pak® bag) and inoculated with 0.5 ml of the 102 CFU/ml (L. innocua and
L. monocytogenes spp.) inoculum. The bags were gently shaken for 30 times to evenly
spread the inoculum over the sample. Four bags were prepared for each sampling time
and the experiment was performed in triplicate. The inoculated samples were then placed
in an incubator (VWR International, Model 1510E, IL, USA) maintained at constant
temperature (5, 10, 20, 30, and 36oC).

41
3.3.4 Bacterial Cultures
L. monocytogenes (ATCC 15313, ATCC 33090, Scott A, Strain A) and rifampicin-
resistant (80 µg/ml) culture of Listeria innocua (NRCC B33076) were acquired from Dr.
Carmen Gomes’ stock laboratory (Department of Biological and Agricultural
Engineering, Texas A&M University) stored at -80°C. Before being used, an inoculum
was removed from the frozen culture with a loop, streaked onto Tryptose Phosphate
Broth (TPB; Difco, Detroit, MI), and incubated for 24 hours at 36°C. Next, single colony
isolates were obtained by streaking on Oxford Listeria-selective agar supplemented with
80 µg/ml of rifampicin (OLR) and incubated at 36 °C for 24 h through two successive
transfers on Oxford Listeria plus rifampicin (OLR). Colonies were stored on TSA slant
at 5°C as working cultures and used within 90 days.
3.3.5 Inoculum Preparation
A loop inoculum was transferred from the working culture at 5°C to TPB test
tubes and incubated at 36°C for 18 hours. After incubation, each test tube was
centrifuged and washed for three consecutive times (3000 X g for 15 min) with Difco
buffered peptone water. Subsequently, each pellet was resuspended in 0.1% peptone
water (PW). The Optical density at 600nm (OD600) of the cell suspensions was adjusted
to 0.5 of absorbance for bacterial preparation. An approximate initial concentration of
107 CFU/ml was confirmed by making serial dilutions of the inoculum suspension in 9-
ml test tubes of PW. The suspension was plated on OLR and incubated at 36°C until
visible black colonies could be counted. To prepare the inoculum, serial dilutions of

42
initial population in PW were carried out to reach a target level of 102 CFU/ml of
Listeria innocua and L. monocytogenes strains.
3.3.6 Washing and Sanitation (Chlorine) Treatments
Four bags of fresh baby spinach samples (5-g per sample in 18 oz Whirl Pak®
bag ) for each bacteria with different initial inoculum loads (103, 104, and 105 CFU/ml)
of L. innocua and L. monocytogenes were washed with tap water for 10-minutes at room
temperature. During the treatment, the washing solution was occasionally stirred. Next,
four different bags of produce samples (5-g per sample in18 oz Whirl Pak® bag) with
same initial loads as for the water washing treatment were treated with 200 ppm of
chlorinated water at pH 7.0 (reduced with 0.1 N of HCI) for 10-minutes at room
temperature. The solution was occasionally stirred during the treatment. After the
treatment, each sample (5-g) was placed in an 18-oz. stomacher bag and kept at 5oC for
2 hours. Then, the number of microorganisms remaining on the surface of the fresh
baby spinach was determined by using microbial enumeration methods.
3.3.7 Microbial Enumeration
Each 5-g sample of fresh baby spinach inoculated with L. monocytogenes and L.
innocua were hand pummeled with 45 ml of Difco buffered peptone water (BPW; Difco,
Detroit, MI) in an 18 oz Whirl Pak® bag until samples were reduced to small pieces,
allowing the internal leaf structure to be exposed. Samples of 1 ml from original Whirl
Pak® bag and 0.1 ml from serial dilution in 0.1 % of PW were plated in duplicate
(0.1ml) on Oxford Listeria-selective agar supplemented with Oxford Listeria-selective
43
supplement, which was incubated 24 h at 37oC for Listeria monocytogenes enumeration.
For Listeria innocua enumeration, the dilutions were plated on Oxford Listeria-selective
agar with 80 µg/ml of rifampicin, which was incubated 24 h at 37oC. After incubation,
visible colonies were enumerated with the use of a magnifier counter (detection limit
was 10 CFU/g of sample).
3.3.8 Isothermal Growth Data
Growth data of Listeria monocytogenes and Listeria innocua at 5, 10, 20, 30 and
36 C were collected to obtain the bio-kinetic growth temperatures at different levels of
initial inoculums and natural microbiota for both microorganisms. The inoculated
samples (stomacher bags) were placed in an incubator (VWR International, Model
1510E, IL, USA) maintained at constant temperature. Three independent replications for
each temperature were performed. Four samples (18 oz stomacher bags) were prepared
for each sampling time. About 10 min were allowed for temperature stabilization, and 4
samples were removed to estimate initial inoculum using microbial enumeration
methods.
3.3.9 Growth Models
3.3.9.1 Primary Model
Growth curves were fitted using the DMFit Excel Add-In software (kindly
provided by J. Baranyi, Institute of Food Research, Norwich, UK) to fit the Baranyi and
Roberts (1994) model in order to estimate the main growth parameters, i.e. specific

44
growth rate and lag time. The four- parameter Baranyi functions are described in
Chapter II (Equations 2.4 and 2.5).
The ability of the primary model to predict the growth pattern of L. innocua and
Listeria monocytogenes in fresh baby spinach leaves was evaluated by the root mean
square error (RMSE) and coefficient of determination (R2). Both RMSE and R2 were
calculated as follows;
𝑅2 = 1 − (𝑆𝑆𝑅/𝑆𝑆𝑇) (3.1)
where, SSR is the sum of squares of residuals and SST is the total sum of squares. The
root mean squared error (RMSE) was also used to evaluate the model’s performance:
𝑅𝑀𝑆𝐸 = √𝑆𝑆𝐸
𝑁−𝑝 (3.2)
where, N is the number of observations, and p is the number of model parameters. The
above two statistical quantities were calculated for each temperature after fitting the
growth data into Eq. (2.4, Chapter II).
3.3.9.2 Secondary (Dynamic) Models
The modified Ratkowsky equation was used to describe the effect of
temperature on growth rate (from Eq. 2.13, Chapter II):
𝜇𝑚𝑎𝑥 = (𝑏 ∗ (𝑇 − 𝑇𝑚𝑖𝑛))2 (3.3)
where, the parameter Tmin represents the theoretical minimum temperature beyond which
growth of the organism is impossible. The parameter b is a regression coefficient.

45
Equation (3.3) represents the growth rate up to the optimum growth temperature for any
temperature change (dynamic model).
An inverse simple Ratkowsky-type model was also used to predict lag time,
(tlag), (from Eq. 2.20, Chapter II):
𝑡𝑙𝑎𝑔 = (𝑐 ∗ (𝑇 − 𝑇min))−2 (3.4)
where c is a regression coefficients.
In addition, a second-order polynomial was used to estimate the values of ymax as
a function of temperature (Puerta-Gomez et al., 2013a):
𝑦𝑚𝑎𝑥 = 𝐴1 ∗ 𝑇2 + 𝐴2 ∗ 𝑇 + 𝐴3 (3.5)
where, ymax refers to maximum cell concentration (log CFU/g), and A1, A2, and A3 are
regression coefficients.
3.3.9.3 Validation of Dynamic Models
Before using the dynamic models for quantitative microbial risk assessment
(QMRA), the efficiency of the dynamic models should be validated (Ding et al., 2012).
Therefore, the performance of the dynamic model for each microorganism was evaluated
using three performance indices: Bias Factor (Bf), Accuracy Factor (Af), and the
standard error of prediction expressed as a percentage (%SEP).
The bias factor is used to measure the model prediction bias that computes the
mean difference between the actual and predicted values (Ding et al., 2012),
46
𝐵𝑓 = 10(∑ log(
𝑂
𝑃)/𝑛)𝑛
𝑖=1 (3.6)
The accuracy factor is a measurement of accuracy calculating the proximity of
predicted values to the actual values (Ding et al., 2012),
𝐴𝑓 = 10(∑ |log(
𝑃
𝑂)|/𝑛)𝑛
𝑖=1 (3.7)
The Standard Error of prediction is a relatively typical deviation of the mean
prediction values. Hervas et al. (2001) reported that %SEP is more accurate to evaluate
the fitting and prediction accuracy of the models because it is a dimensionless criterion,
%𝑆𝐸𝑃 =100
𝐴𝑣𝑒𝑟𝑎𝑔𝑒(𝑂)√∑(𝑂−𝑃)2
𝑛 (3.8)
where, O is the observed value; P is the predicted value; and n is the number of
observations and predictions.
3.3.10 Statistical Analysis
Data analysis for washing treatments was performed using SPSS software
(version 20.0 for Windows, 2011). Statistical differences between variables were
analyzed for significance by one-way ANOVA using Tukey`s multiple range tests.
Statistical significance were determined at the P<0.05 levels.

47
3.4 Results and Discussion
3.4.1 Water and Chlorine Washing
The effect of water and chlorine washing treatments on the reduction of L.
monocytogenes and L. innocua inoculated on fresh baby spinach leaves is presented in
Table 3.1. As expected, a particular level of initial population load and washing with
chlorine was more effective (P<0.05) than water washing for both microorganisms.
Furthermore, treatment of fresh baby spinach inoculated with different initial population
load of L. monocytogenes and L. innocua using water and chlorine water had no
significant (P>0.05) effect in reducing bacterial numbers. However, when the initial
population load was decreased to 103 CFU/g for L. innocua, a significantly (P<0.05)
higher log reduction of bacterial population was observed for chlorine washing (Table
3.1). This result suggests that washing fresh baby spinach leaves inoculated with low
levels of L. innocua with water-chlorine was significantly more effective (P<0.05) in
removing L. innocua. This may be due to the fact that low microbial population are not
able to attach as well as higher microbial population. Singh et al. (2002) found that when
the initial population load of E.coli 0157:H7 on lettuce was further reduced, a
significantly (P<0.05) higher log reduction of bacterial population was observed as
compared to bacterial log reduction from higher initial populations.
The levels of reduction of microbial populations due to water washing were
significantly different (P<0.05) for L. monocytogenes and L. innocua (Table 3.1).
Therefore, the total reduction of both microorganisms was significantly different

48
Table 3.1. Effect of washing treatment and initial population loads on the log-reductions of Listeria monocytogenes and Listeria innocua inoculated in fresh baby spinach leaves.
Reductions (log CFU/g)
Microorganism Initial population load
(CFU/g) Water washing
Chlorine
washing
Listeria
monocytogenes
103 0.58a 1(0.17)
0.97a (0.34)
104 0.59a (0.16)
1.05a,c (0.31)
105 0.46a (0.05)
0.87a (0.22)
Listeria innocua
103 1.11b (0.26)
1.92b (0.34)
104 1.10b (0.14)
1.48c (0.30)
105 1.01b (0.22)
1.41c (0.19)
1: Standard Deviation a,b,c : Means within a column, which are not followed by a common superscript letter are significantly different (P<0.05).

49
(P<0.05) with L. monocytogenes being more difficult to remove from the leafy green.
Ijabadeniyi et al. (2011) found similar results for total (water and chlorine) reductions of
L. monocytogenes on spinach. These authors reported that L. monocytogenes was able to
attach to the surface of spinach rapidly. In a previous study, Ells and Hansen (2006) also
determined that L. monocytogenes could attach to whole and cut cabbage within 5
minutes of exposure. Furthermore, several studies found the same time range of
attachment of L. monocytogenes to lettuce, cantaloupe, and Arabidopsis thuliana (Li et
al., 2002; Ukuku and Fett, 2002; Milillo et al., 2008). Besides, Warning and Datta (2013)
reported that each type of microorganisms has its own method of attachment and can
vary even within different strains of the same bacteria. Milillo et al. (2012) reported that
L. monocytogenes EGD-e has 19 genes which is not found in L. innocua that putatively
encode proteins containing leucine-rich repeats (LRR), implicated in L. monocytogenes
attachment to and invasion of host cells, and Leu-Pro-X-Thr-Gly (LPXTG) motifs. These
authors also determined that the motility of L. monocytogenes is different from that of L.
innocua.
Van Houdt and Michiels (2010) determined that the major bacterial factors
affecting attachment and strength of attachment are the bacterial growth conditions,
hydrophobicity, surface charge, attachment surface, and surface appendages. These
authors also reported that L. monocytogenes biofilms were more resistant to cleaning
agents and disinfectants such as trisodium phosphate, chlorine, ozone, hydrogen
peroxide, peracetic acid (PAA), and quaternary ammonium compounds. According to
Szomolay et al. (2005), biofilm resistance to cleaning agents is because of biocide into
50
the biofilm. They determined the mechanism of biocide resistance is based on that some
of the biofilm cells are able to sense the biocide challenge and actively respond to it by
deploying protective stress responses more effectively than planktonic cells. As a result,
the different levels of microbial reductions of water-chlorine washing for L.
monocytogenes and L. innocua can be explained by the fact that L. innocua does not
attach as well as L. monocytogenes to the surface of fresh baby spinach leaves.
3.4.2 The Effect of the Presence of Background Microbiota on the Growth of
Listeria monocytogenes and Listeria innocua
Both L. monocytogenes and L. innocua grew in fresh baby spinach very well at
the different temperatures tested in this study. Growth data for each bacteria and
temperature were fitted into the Baranyi model (Eq.2.4) and the fitted curves produced
are presented in Figures A.1 to A.10 (Appendix). Next, the obtained growth parameters
(yo, ymax, tlag, and µmax) for each temperature and the initial concentration of total
mesophilic bacteria, (Mo), for L. monocytogenes and L. innocua were determined
(Tables 3.2 and 3.3, respectively). The RMSE values varied from 0.10 to 0.47 log CFU/g
and from 0.08 to 0.42 log CFU/g for L. monocytogenes and L. innocua, respectively.
At 5oC, when the initial concentration of total mesophilic bacteria, (Mo),
increased by 27.86% and 17.87%, tlag of L. monocytogenes decreased by 32.45% (Table
3.2) and that of L. innocua increased 244.22% (Table 3.3), respectively. In addition,
although, µmax of L. monocytogenes on fresh baby spinach leaves decreased by 28.50%
and 20.41 % when the Mo on fresh baby spinach leaves increased by 27.86% and

51
Table 3.2. Effect of natural microflora on estimated maximum population density, maximum growth rate, and lag time, of Listeria monocytogenes inoculated in fresh baby spinach leaves determined using Baranyi model (Eq. 2.4).
Temperature
(oC)
aMo
(log
CFU/)
byo
(log
CFU/)
cymax
(log
CFU/)
dµmax
(log
CFU/g/hour)
etlag
(Hours) R2
fRMSE
(log
CFU/g)
5 4.94 2.26 3.97 0.0421 158.45 0.91 0.10
5 5.53 1.92 4.30 0.0350 109.91 0.95 0.12
5 6.31 2.07 4.14 0.0301 107.03 0.96 0.26
10 4.94 2.58 5.41 0.0500 45.60 0.93 0.39
10 5.53 2.42 5.66 0.0490 39.98 0.95 0.47
10 6.31 2.64 5.76 0.0499 43.06 0.95 0.37
20 5.43 2.44 5.88 0.2128 6.03 0.97 0.39
20 5.98 2.30 5.73 0.2747 3.07 0.90 0.11
20 6.31 1.92 5.55 0.5894 4.12 0.76 0.32
30 5.22 2.38 7.42 0.7411 3.47 0.94 0.29
30 5.78 1.92 7.67 0.8507 1.29 0.90 0.12
30 6.52 2.11 5.60 0.7539 0.29 0.78 0.19
36 4.94 2.26 7.43 1.2503 2.403 0.87 0.23
36 5.53 1.90 7.73 1.1100 0.808 0.87 0.20
36 6.31 1.99 7.43 0.995 0.995 0.89 0.16 a (Mo) :Initial concentration of total mesophilic bacteria (log CFU/g); byo: Initial population density (Eq. 2.3) (log CFU/g); cymax: Maximum population density (Eq. 2.3) (log CFU/g); dµmax: Maximum growth rate (Eq. 2.3) (log CFU/g/h); etlag: Lag time (Eq. 2.3) (hours); fRMSE: Root mean square root (Eq. 3.2) (log CFU/g)

52
Table 3.3. Effect natural microflora on estimated maximum population density, maximum growth rate, and lag time of Listeria innocua inoculated in fresh baby spinach leaves determined using Baranyi model (Eq. 2.4).
Temperature
(oC)
aMo
(log
CFU/g)
byo
(log
CFU/g)
cymax
(log
CFU/g)
dµmax
(log
CFU/g/
hours)
etlag
(Hour) R2
fRMSE
(log
CFU/g)
5 5.51 2.52 4.93 0.0280 70.36 0.96 0.24
5 5.46 1.57 3.88 0.0515 169.76 0.89 0.08
5 6.50 1.75 3.25 0.0331 242.19 0.79 0.29
10 5.51 2.49 6.15 0.0976 17.32 0.65 0.36
10 5.29 2.19 5.71 0.0751 48.09 0.91 0.29
10 6.50 1.86 5.04 0.0595 30.34 0.84 0.42
20 5.51 2.52 6.84 0.4586 2.32 0.75 0.24
20 5.30 2.41 7.09 0.3554 3.89 0.91 0.37
20 7.08 2.43 4.24 0.2962 4.16 0.72 0.27
30 5.81 2.70 7.60 0.8114 0.13 0.82 0.23
30 5.12 1.97 6.26 0.9141 0.26 0.73 0.31
30 6.03 1.93 7.17 0.9561 0.69 0.80 0.33
36 7.02 3.36 7.59 0.9898 2.10 0.87 0.16
36 7.19 2.14 7.05 1.1881 2.05 0.86 0.23
36 7.15 1.45 5.73 1.8580 2.89 0.76 0.26 a Mo: Initial concentration of total mesophilic bacteria (log CFU/g); byo: Initial population density (Eq. 2.3) (log CFU/g); cymax: Maximum population density (Eq. 2.3) (log CFU/g); dµmax: Maximum growth rate (Eq. 2.3) (log CFU/g); etlag: Lag time (Eq. 2.3) (hours); fRMSE: Root mean square root (Eq. 3.2) (log CFU/g)
53
27.83% at 5 and 36oC (Table 3.2), respectively. Furthermore, when the Mo increased by
17.87%, 28.52%, 3.90% and 1.70%, µmax of L. innocua decreased by 39.02% and
35.41% at 10 and 20oC while those values increased by17.84% and 87.71% at 30 and
36oC (Table 3.3), respectively.
In addition, these differences on behavior caused by total mesophilic bacteria
affected the maximum population density, ymax, of both microorganisms. At 5oC, when
the initial concentration of total mesophilic bacteria, Mo, increased, although the ymax of
L. monocytogenes increased by 4.49%, that of L.innocua decreased by 34.09%.
Furthermore, when the Mo increased by 27.83% and 1.70%, the ymax of L. innocua
decreased by 24.46% (Table 3.3) whereas that of L. monocytogenes did not change at
36oC, respectively. These results show the total mesophilic bacteria at 5oC and 36oC
affected the growth of L. innocua more than L. monocytogenes. Francis and O`Beirne
(1998) reported similar results for the effects of the indigenous microflora of minimally
processed lettuce on the survival and growth of L. innocua. Likewise, several studies
reported similar results verifying that the initial background bacteria did not affect the
growth of L. monocytogenes (Beuchat and Brackett, 1990; Gleeson, 2005; Carrasco et
al., 2008). However, Koseki and Isobe (2005a) determined that the background flora of
iceberg lettuce significantly decreased the ymax of L. monocytogenes on iceberg lettuce
when temperatures were below 25oC. This result may be due to fact that competitive
subpopulations of the microflora such as lactic acid bacteria (LAB) and Enterobacter
spp. in food matrices is different or reductions of these competive subpopulations in
54
commodities is different after disinfection treatments (Johnston et al., 2005b; Carrasco et
al., 2008).
The different growth behaviors of these two microorganisms under the presence
of natural microbiota may be due to different mechanisms responsible for bacterial
inhibition by biocontrol agents, containing production of inhibitory compounds,
competition for nutrients, space or even colonization sites on produce affected each
microorganism differently (Olaimat and Holley, 2012). Several microorganisms
including lactic acid bacteria (LAB) on fresh baby spinach produce bacteriocins, cationic
antimicrobial peptides (Trias et al., 2010). Alegra et al. (2013) reported that
Pseudomonas spp. showed antagonistic capacity to inhibit the growth of E. coli
0157:H7, Salmonella, and L. innocua on fresh-cut apple and peach. In another study,
Alegra et al. (2010) determined that Enterobacteriaceae spp. effectively inhibited the
growth of, or reduced, in some cases to below the limit of detection, E. coli 0157:H7,
Salmonella and L. innocua on fresh-cut apples and peaches.
In addition to these mechanisms, the different growth behaviors of these two
microorganisms may be due to the different stress responses of L. innocua and L.
monocytogenes. Stress response is crucial for microorganisms because their habitats are
subjected to continual changes in temperature, osmotic pressure, toxic compounds, and
nutrients availability (Capozzi et al., 2009). Nufer et al, (2007) determined that some L.
monocytogenes strains possessed better cold tolerance than other Listeria spp.,
containing L. innocua in the brain heart infusion broth at4 oC. Milillo et al. (2012)
reported that the heat resistance of L. innocua M1 is higher than that of L.
55
monocytogenes. However, Patil et al. (2010) reported that heat resistance of L.
monocytogenes was dependent on the type of strain. For example, Cava-Roda et al.
(2012) reported that a sub-population of strain Scott A, containing a mutation in ctsR
(class III heat-shock regulator), was more thermo-resistant than the wild type strain. In
addition, L. monocytogenes can be more resistant against acid than L .innocua because
Lactic acid bacteria (LAB) on fresh baby spinach can produce acid. Skandamis et al.
(2008) showed that acid resistance of L. monocytogenes are also strain dependant as heat
resistance. For instance, Milillo et al. (2012) reported that the protein products of gad
genes contribute to the acid resistance of L. monocytogenes and the gadD1/T1 homolog
is not found in L. innocua CLIP11262.
In conclusion, the combined treatments (temperature and the native bacterial
flora of fresh baby spinach leaves) had a different effect on the growth inhibition of L.
innocua and L. monocytogenes due to genomic difference and bacterial stress response.
Thus, L. monocytogenes and L. innocua respond differently under the presence of natural
background microflora on fresh baby spinach.
3.4.3 Growth Models of L. monocytogenes and L. innocua in Fresh Baby Spinach
In general, the maximum growth rate of the L. monocytogenes was between
0.0023 and 0.2264 log CFU/g/h less than that of L. innocua when temperatures changed
between 5 and 36oC (Tables 3.4 and 3.5). The RMSE values varied from 0.09 to 0.41 log
CFU/g and from 0.20 to 0.31 for L. monocytogenes and L. innocua, respectively (Tables
3.4 and 3.5). The lower RMSE values indicate a better fit of the model. The R2 values
varied from 0.85 to0.94 and from 0.79 to 0.92 for L. monocytogenes strains and L.

56
innocua, respectively. Overall, the Baranyi model provided a good fit to the data from all
temperatures at which growth was observed (Figures A.11 to A.15, Appendix).
Table 3.4 shows the maximum population density (ymax) of L. monocytogenes
growth on fresh baby spinach leaves varied from 4.15 to 7.53 log CFU/g and when
temperature raised from 5 to 36oC, respectively. These values for L. innocua ranged
from 4.02 to 7.01 log CFU/g (Table 3.5). The difference in results between the two
microorganisms may be because of the different effect of the background microflora on
the growth of L. monocytogenes and L. innocua. Koseki and Isobe (2005a) and Carrasco
et al (2008) determined similar ymax values for L. monocytogenes on iceberg lettuce for
temperatures between 5 and 25oC. However, Fang et al. (2013) reported ymax for L.
monocytogenes in fresh-cantaloupe of 8.0 log CFU/g, with a standard deviation of 0.5
log CFU/g, at temperatures between 10 and 40oC. The discrepancy with our results may
be because of the different type of produce which has different pH (5.5-6.3) (Babic and
Watada, 1996), free water activity (92.1%) (Bhattacharjee et al., 1999), and composition
concentration of background microflora (Babic et al., 1996). Hoelzer et al. (2012b)
reported that food chemistry affected by produce variety, growing season, storage
conditions, and processing and actual values may differ considerably from the proxies,
so that may also cause the different results .
The maximum growth rate (µmax) for L. monocytogenes and L. innocua on fresh
baby spinach leaves increased when temperature increased. It varied from 0.036 to 1.119

57
Table 3.4. Estimated maximum population density, maximum growth rate, and lag time of Listeria monocytogenes inoculated in fresh baby spinach leaves by using Baranyi model (Eq. 2.4).
Temperature
(oC)
byo
(log
CFU/g)
cymax
(log
CFU/g)
dµmax
(log
CFU/g/hr)
etlag
(Hours) R2
fRMSE
(log
CFU/g)
5 2.08 ±0.17
4.15 ±0.17
0.0357 ±0.01
125.13 ±28.89 0.94 0.09
10 2.55 ±0.12
5.61 ±0.18
0.0496 ±0.00
42.88 ±2.81 0.94 0.41
20 2.22 ±0.27
5.72 ±0.16
0.3590 ±0.20
4.41 ±1.50 0.85 0.33
30 2.14 ±0.23
6.90 ±1.13
0.7819 ±0.06
1.68 ±1.62 0.89 0.19
36 2.05 ±0.18
7.53 ±0.17
1.1186 ±0.13
1.40 ±0.87 0.88 0.2
byo: Initial population density (Eq. 2.3) (log CFU/g) cymax: Maximum population density (Eq. 2.3) (log CFU/g) dµmax: Maximum growth rate (Eq. 2.3) (log CFU/g/h) etlag: Lag time (Eq. 2.3) (hours) fRMSE: Root mean square root (Eq. 3.2) (log CFU/g)

58
Table 3.5. Estimated maximum population density, maximum growth rate, and lag time of Listeria innocua inoculated in fresh baby spinach leaves by using Baranyi model (Eq. 2.4).
Temperature
(oC)
byo
(log
CFU/g)
cymax
(log
CFU/g)
dµmax
(log
CFU/g
/hr)
etlag
(Hours) R2
fRMSE
(log
CFU
/g)
5 1.95 ±0.51
4.02 ±0.85
0.038 ±0.01
160.77 ±86.27 0.92 0.2
10 2.18 ±0.31
5.63 ±0.56
0.077 ±0.02
31.92 ±15.45 0.85 0.31
20 2.45 ±0.06
6.06 ±1.58
0.370 ±0.08
3.46 ±0.99 0.79 0.26
30 2.20 ±0.43
7.01 ±0.69
0.894 ±0.07
0.36 ±0.29 0.79 0.24
36 2.32 ±0.97
6.79 ±0.96
1.345 ±0.45
2.35 ±0.47 0.81 0.2
byo: Initial population density (Eq. 2.3) (log CFU/g) cymax: Maximum population density (Eq. 2.3) (log CFU/g) dµmax: Maximum growth rate (Eq. 2.3) (log CFU/g/h) etlag: Lag time (Eq. 2.3) (hours) fRMSE: Root mean square root (Eq. 3.2) (log CFU/g)

59
log CFU/g/h for L. monocytogenes and from 0.038 to 1.345 log CFU/g/h for L. innocua
at 5-36 oC (Tables 3.4 and 3.5, respectively). Similarly, Duh and Schaffner (1993)
reported that µmax of L. innocua was higher than L. monocytgenes in brain heart infusion
broth when temperature was below 42oC. In addition, Hoelzer et al. (2012b) reported
that several studies had similar results for L. monocytogenes on produce at 10oC. On the
other hand, Wang et al., (2013) stated that µmax values for L. monocytogenes growth on
cabbage were between 0.008 and 0.320 log CFU/g/h at 4-30 oC. Other studies reported
that µmax is changed by changing commodity, processing form, atmosphere composition
and storage conditions (Beuchat and Brackett, 1990; Gonzalez-Fandos et al., 2001;
Corbo et al., 2005; Hoelzer et al., 2012b).
As shown in Tables 3.4 and 3.5, the estimated lag time (tlag) for both L.
monocytogenes and L. innocua on fresh baby spinach leaves decreased when
temperature increased, with the exception for L. innocua at 36oC. For L. monocytogenes,
tlag ranged from 125.13 to 1.40 hours as temperature varied from 5 to 36oC, respectively.
For L. innocua, those values ranged from 160.77 to 0.36 hours (at 30oC), 2.34 hours (at
36oC) as temperatures varied from 5 to 36oC. However, Duh and Schaffner (1993)
determined that at temperatures below 8oC, tlag of L. monocytogenes was longer than that
of L. innocua and when temperatures were greater than 8oC, tlag of L. monocytogenes
was slightly shorter than that of L. innocua in brain heart infusion broth. The
discrepancy with our results may be explained by the fact that although, under stress
conditions such as low and high temperature, L. innocua has better tolerance than L.
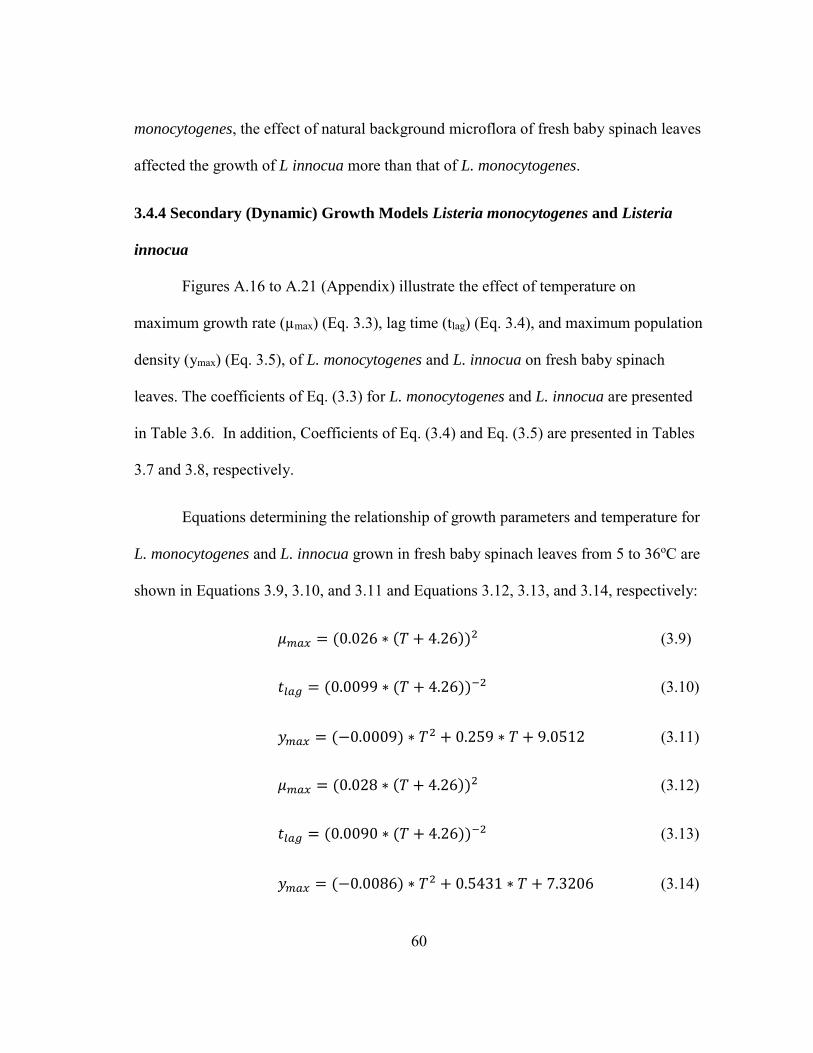
60
monocytogenes, the effect of natural background microflora of fresh baby spinach leaves
affected the growth of L innocua more than that of L. monocytogenes.
3.4.4 Secondary (Dynamic) Growth Models Listeria monocytogenes and Listeria
innocua
Figures A.16 to A.21 (Appendix) illustrate the effect of temperature on
maximum growth rate (µmax) (Eq. 3.3), lag time (tlag) (Eq. 3.4), and maximum population
density (ymax) (Eq. 3.5), of L. monocytogenes and L. innocua on fresh baby spinach
leaves. The coefficients of Eq. (3.3) for L. monocytogenes and L. innocua are presented
in Table 3.6. In addition, Coefficients of Eq. (3.4) and Eq. (3.5) are presented in Tables
3.7 and 3.8, respectively.
Equations determining the relationship of growth parameters and temperature for
L. monocytogenes and L. innocua grown in fresh baby spinach leaves from 5 to 36oC are
shown in Equations 3.9, 3.10, and 3.11 and Equations 3.12, 3.13, and 3.14, respectively:
𝜇𝑚𝑎𝑥 = (0.026 ∗ (𝑇 + 4.26))2 (3.9)
𝑡𝑙𝑎𝑔 = (0.0099 ∗ (𝑇 + 4.26))−2 (3.10)
𝑦𝑚𝑎𝑥 = (−0.0009) ∗ 𝑇2 + 0.259 ∗ 𝑇 + 9.0512 (3.11)
𝜇𝑚𝑎𝑥 = (0.028 ∗ (𝑇 + 4.26))2 (3.12)
𝑡𝑙𝑎𝑔 = (0.0090 ∗ (𝑇 + 4.26))−2 (3.13)
𝑦𝑚𝑎𝑥 = (−0.0086) ∗ 𝑇2 + 0.5431 ∗ 𝑇 + 7.3206 (3.14)
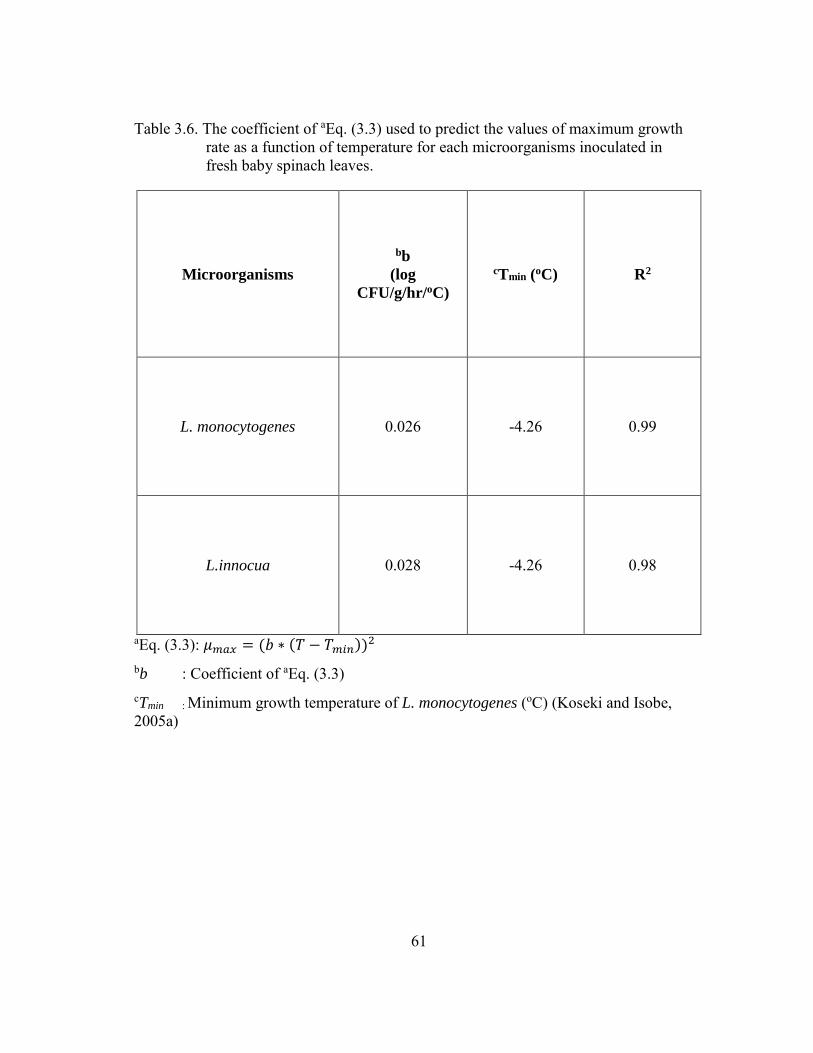
61
Table 3.6. The coefficient of aEq. (3.3) used to predict the values of maximum growth rate as a function of temperature for each microorganisms inoculated in fresh baby spinach leaves.
Microorganisms
bb
(log
CFU/g/hr/oC)
cTmin (oC) R2
L. monocytogenes 0.026 -4.26 0.99
L.innocua 0.028 -4.26 0.98
aEq. (3.3): 𝜇𝑚𝑎𝑥 = (𝑏 ∗ (𝑇 − 𝑇𝑚𝑖𝑛))2
bb : Coefficient of aEq. (3.3) cTmin : Minimum growth temperature of L. monocytogenes (oC) (Koseki and Isobe, 2005a)

62
Table 3.7. Coefficients of aEq. (3.4) used to predict the values of lag time as a function of temperature for each microorganisms inoculated in fresh baby spinach.
Microorganisms bc
(1/hours*oC) cTmin (oC) R2
L. monocytogenes 0.0099 -4.26 0.97
L.innocua 0.0090 -4.26 0.92
aEq. (3.4): 𝑡𝑙𝑎𝑔 = (𝑐 ∗ (𝑇 − 𝑇min))−2
bc : Coefficients of aEq. (3.4) cTmin : Minimum growth temperature of L. monocytogenes (oC) (Koseki and Isobe,
2005a)

63
Table 3.8. Coefficients of aEq. (3.5) used to predict the values of maximum population density as a function of temperature for each microorganism inoculated in fresh baby spinach leaves.
Microorganisms
bA1
(log
CFU/g/oC2)
cA2
(log
CFU/g/oC)
dA3
(log CFU/g) R2
L. monocytogenes -0.0009 0.2592 9.0512 0.92
L.innocua -0.009 0.54 7.32 0.93
aEq. (3.5): 𝑦𝑚𝑎𝑥 = 𝐴1 ∗ 𝑇2 + 𝐴2 ∗ 𝑇 + 𝐴3
bA1, cA2, dA3: Coefficients of aEq. (3.5)
64
The overall performance of the obtained secondary models was estimated with
R2 values. For L. monocytogenes, R2 values of the predictive secondary model for µmax,
tlag, and ymax were 0.99, 0.97, and 0.92, respectively. For L. innocua, R2 values of
predictive secondary model for µmax, tlag, and ymax were 0.98, 0.92, and 0.93,
respectively. These results indicate that the secondary models provided good estimates
of the growth parameters for both microorganisms.
3.4.4.1 Model Validation
The maximum growth rate, lag time, and maximum population density values of
L. monocytogenes and L. innocua in fresh baby spinach leaves calculated from observed
data were compared to predictions from the dynamic model to figure out performance
indices of the model.
The Bias factor (Bf ) values of the predictive models for µmax, tlag, and ymax were
0.70, 0.40, and 1.00 for L. monocytogenes and 0.72, 0.25, and 1.01 for L. innocua,
respectively (Tables 3.9 and 3.10). Valero et al. (2007) and Ross et al. (1996) reported
that the Bf value is a suitable measure for performance of predictive models and
observed that Bf values ranging from 0.9 to 1.15 proved the model was good for
determining the growth parameters. Ding et al. (2012) determined that the Bf values in
range of 0.7 to 1.15 were considered as acceptable. The obtained Bf values of the present
study were in the acceptable range for both microorganisms and proved that the
developed dynamic models for µmax and ymax showed a good agreement between the
observed and predicted values for both microorganisms. However, Bf values of the lag

65
time for both microorganisms were not in the acceptable range because the inverse
simple Ratkowsky –type model (Eq. 3.4) did not fit the data very well.
As shown in Tables 3.9 and 3.10, the Af values of the predictive models for µmax,
tlag, and ymax were 1.43, 2.53, and 1.00 for L. monocytogenes and 1.37, 3.99, and 1.00 for
L. innocua, respectively. Af values should be close to 1.00 to provide acceptable
descriptions of the data. However, the acceptable range of Af value depends on the
number of variables in the predictive model (Ding et al., 2012). Hence, the produced Af
values were all within acceptable range, with the exception for the lag time of both
microorganisms. The Af value is a measurement of preciseness to determine how close
the estimated values are to the real values. For L. monocytogenes and L. innocua, the
results indicate that on average, about 43% and 37% of the estimated values were
different from the observed µmax values, while 113% and 299% for tlag and 0% for ymax,
respectively. Thus, the predictive model was more precise for µmax and ymax than for tlag.
This is because the inverse simple Ratkowsky –type model (Eq. 3.4) did not fit the data
very well. Duh and Schaffner (1993) found similar results when using this model on L.
monocytogenes and L. innocua in brain heart infusion broth.
As shown in Tables 3.9 and 3.10, the standard error of prediction expressed in
percentage, %SEP values of the secondary models for µmax, tlag, and ymax were 11.22%,
23.18%, and 5.61% for L. monocytogenes and 12.39%, 44.24%, and 4.87% for L.
innocua, respectively. This showed that the newly developed models could be
considered to provide a good fit between the experimental and predicted data.

66
Table 3.9. Validation indices of developed models for maximum population density, maximum growth rate, and lag time of Listeria monocytogenes in fresh baby spinach leaves.
cymax
(log CFU/g) dµmax
(log CFU/g/h) etlag
(hours)
Bf (Eq. 3.6) 1.00 0.70 0.40
Af (Eq. 3.7) 1.00 1.43 2.53
%SEP (Eq. 3.8) 5.61 11.22 23.18
cymax: Maximum population density (log CFU/g) dµmax: Maximum growth rate (log CFU/g/h) etlag: Lag time (hours)

67
Table 3.10. Validation indices of developed models for maximum population density, maximum growth rate, and lag time of Listeria innocua in fresh baby spinach leaves.
cymax
(log CFU/g) dµmax
(log CFU/g/h) etlag
(hours)
Bf (Eq. 3.6) 1.00 0.72 0.25
Af (Eq. 3.7) 1.00 1.37 3.99
%SEP (Eq. 3.8) 4.87 12.39 44.24
cymax: Maximum population density (log CFU/g) dµmax: Maximum growth rate (log CFU/g/h) etlag: Lag time (hours)

68
3.5 Conclusions
1. Experiments with water and chlorine (200 ppm) washing treatments on the total
reduction of populations of L. monocytogenes and L. innocua (a surrogate)
inoculated in fresh baby spinach leaves demonstrated that both microorganisms had
different responses to the type of washing treatment.
2. The levels of microbial population reduction due to water washing were significantly
different (P<0.05) for L. monocytogenes and L. innocua and the pathogen was more
difficult to remove than the surrogate.
3. Natural microflora of fresh baby spinach leaves affects the growth behavior of L.
innocua more significantly than the growth of L. monocytogenes.
4. L. monocytogenes grows faster than L. innocua on fresh baby spinach leaves at
temperatures 10>T>30oC. These results support the recommendation that multiple
commodities should be tested for the validation of the L. innocua for use as a
surrogate for L. monocytogenes.
5. Predictive models were developed to investigate the effect of simulated storage
temperature on the growth patterns of L. monocytogenes and L. innocua. The
validation results show that these models could provide reliable estimates for growth
of L. monocytogenes and L. innocua as a function of temperature.
6. The dynamic models can be used by manufacturers to estimate the growth of L.
monocytogenes in fresh baby spinach during distribution, storage, or retail, and
potential growth at consumer levels.

69
7. These models can also estimate potential growth of L. monocytogenes in fresh baby
spinach under constantly varying (dynamic) condition. This is crucial because
temperature can drastically vary from ‘farm to table’.

70
CHAPTER IV
QUANTITATIVE MICROBIAL RISK ASSESSMENT FOR LISTERIA
MONOCYTOGENES ON FRESH BABY SPINACH LEAVES
4.1 Overview
The risk of listeriosis because of the consumption of fresh baby spinach
contaminated by Listeria monocytogenes, a foodborne pathogen with high fatality rate,
has become a concern with serious public health and economic consequences. The
purpose of this study was to conduct a quantitative microbial risk assessment (QMRA)
for L. monocytogenes infection from consumption of fresh baby spinach leaves and
provide some recommendations regarding the effectiveness of intervention strategies
such as washing, chlorine, and irradiation.
The whole food chain of fresh baby spinach from farm to table containing the
following information initial contamination at the farm, growth, and cross-contamination
throughout transportation, storage conditions at retail and at home, was simulated
employing @Risk software. Model output showed mean final contamination levels of -
3.277 log CFU/g and 3.9035 log CFU/g based on different scenarios. The quantitative
risk assessment model estimated an average number of annual listeriosis cases in the
U.S. that ranged between 1.3*10-3 and 2.0*105 for high number of servings and between
1.9*10-6 and 280 for low number of servings.
Based on the different scenarios evaluated in this study, cross-contamination
seems the most probable scenario for prevalence of contamination a whole lot of daily
production. In addition, when temperature abuse was occurred after the pathogens
71
concentration increased, the number of annual cases of listeriosis increased by 200%.
However, when the irradiation treatment was used, the average number of annual
listeriosis cases in the U.S. could be reduced by 99%. Furthermore, the practice of using
Modified Atmosphere Packaging (MAP) with irradiation reduced the number of annual
cases of listeriosis by 99.99%.
This study determined that fresh baby spinach processors could ensure a highly
safe product-in a scenario where cross-contamination is possible-if the product is
exposed to irradiation treatment with a dose of 1 kGy and kept under the cold chain.
4.2 Introduction
Food safety is a crucial issue for consumers, authorities, and producers. Food
producers are primarily concerned with ensuring food safety and minimizing any risk
linked to consumption of a given food item. This is done by using a systematic approach
to determine hazards linked to a given product and process, by implement suitable
control measures, and by applying general Good Manufacturing Practices (GMP). Risk
assessment, or the determination of quantitative or qualitative value of risk related to a
concrete situation and transparent manner, is the scientific basis for risk management
and safety criteria for foods. The objective of risk assessment is to determine the
characteristics of the nature and graduation of the risk to human health linked to hazards,
and to make clear the degree of scientific certainty of the assumptions used to develop
the estimates (Mufty, 2012).

72
The purpose of a microbiological risk assessment for a specific pathogen or
group of pathogens is to predict the level of disease that can be anticipated in a target
population from product or group of products. The risk assessment process covers the
description of a food production system and the identification of possible points of
failure that could raise the risk for a specific hazard. A microbiological risk assessment
provides information that will assist the producers to figure out whether a pathogen is, or
could be, significant hazard in their production system and how best to prevent the
hazard being accomplished.
In recent years, L. monocytogenes has been of great interest to researchers
because of the increased susceptibility to contamination by this pathogen (RTE products)
(Garrido et al., 2010). This microorganism has been isolated from a wide range of raw
and RTE (ready-to-eat) meats, poultry, dairy products, and vegetables as well as various
food processing environments (Harris et al., 2003; Sant`Ana et al., 2012a; Pradhan et al.,
2010; Gombas et al., 2003;Prazak et al., 2002; Lianou and Sofos, 2007; Park et al.,
2012). L. monocytogenes has a great resistance in different environments. Thus, its
eradication is very difficult. Despite the zero tolerance policy in the U.S., the assessment
of the risk posed by the pathogen is of high relevance due to the high mortality rate of
the illness (20 to 40%) and how wide spread the pathogen is in foods and the
environment (Carrasco et al., 2010).
In 2003, quantitative microbial risk assessment (QMRA) of listeriosis for 23
categories of RTE products containing vegetables had been carried out by Food and
Drug Administration (FDA) and Center for Food Safety and Applied Nutrition

73
(CFSAN). In this study, vegetables were categorized as relatively low risk groups (<1
case/year). However, these authors suggested that additional investigations for the
subdivision of the vegetables category into several different groups are needed because
of high uncertainty caused by the diversity of the products. Therefore, several studies
have been recently published QMRA for E. coli 0157:H7, Salmonella and L.
monocytogenes in leafy green vegetables (Franz et al., 2010; Tromp et al., 2010;
Carrasco et al., 2010; Danyluk and Schaffner, 2011; Ding et al., 2013; Puerta-Gomez et
al., 2013b).
Microbial risk assessment with scenario analysis can be considered a powerful
tool to evaluate the safety features of the production process and allow the producers to
predict consequences before actual implementation. In the present study, the unit
operations of whole farm to table pathway and related pathogen events containing initial
contamination on the farm, growth, and cross-contamination before packaging were
considered and described. The contamination levels of L. monocytogenes on fresh baby
spinach at time of consumption were used to predict the likelihood of infection resulting
from a single exposure.
The objective of this study was to develop a quantitative risk assessment model
to determine prevalence, concentration, and cross-contamination of L. monocytogenes in
fresh baby spinach leaves by determining dose-response assessment based on the
quantity of L. monocytogenes consumed and magnitude and frequency of adverse health
effects.

74
4.3 Risk Assessment Methodology and Data Sources
4.3.1 Hazard Identification
Hazard identification is defined by Codex Alimentarius (1999) as “the
identification and biological, chemical, and physical agents capable of causing adverse
health effects and which may be present in a particular food or group of foods.”
L. monocytogenes, causing listeriosis in humans with diverse symptoms
including mild diarrhea, meningitis, and septicemia, is a widely seen foodborne
pathogen in several foods, such as milk, vegetables, and meat (Painter et al., 2013).
Foodborne illness caused by L. monocytoogenes has become relevant nationally since
2000 (CDC, 2013). This pathogen can grow up to notable number at refrigeration
temperature with adequate time. Although the occurrence of listeriosis is less than other
pathogens such as E. coli O157:H7, it is also considered as an important illness because
of its high fatality rate, particularly in immunocompromised individuals (Carrasco et al.,
2010; Ding et al., 2013). According to records, the occurrence of listeriosis in the United
States was 2.9 cases per million populations throughout 2008 (CDC, 2010). In 2011, L.
monocytogenes also contaminated cantaloupes which caused 28 deaths and 133 total
confirmed cases (Ding et al., 2013). Beside this, the consumption of RTE vegetables has
caused several listeriosis outbreaks worldwide (Table 2.1, Chapter II). This fact indicates
that L. monocytogenes cannot be completely eliminated by commercial decontamination
methods used by producers if it is present in raw vegetables. Therefore, it is crucial to
control the methods at all stages in the food chain to prevent or reduce contamination in
foods with L. monocytogenes to avoid series foodborne illnesses.

75
4.3.2 Hazard Characterization
Hazard characterization is defined by Codex Alimentarius (1999) as “the
qualitative and/or quantitative evaluation of the nature of the adverse health effects
associated with the hazard. For the purpose of microbiological risk assessment, the
concerns relate to microorganisms and/or their toxins.”
Hazard characterization is also described as the evaluation of adverse health
effects connected to L. monocytogenes and it was estimated as the likelihood that a
single cell of L. monocytogenes would cause a disease (Ding et al., 2013). In this study,
an exponential dose –response non-threshold model was used to estimate the risk of
listeriosis linked to fresh baby spinach consumption. Dose-response relationships have
not been determined for humans yet. A main assumption in dose-response modeling for
microbial risk assessment is that a single cell has a finite probability of causing illness
(Tromp et al., 2010), which is described by the following equation:
𝑃(𝐷) = 1 − 𝑒−𝑟∗𝐷 (4.1)
where, P (D) is the probability of illness for individual exposed to a certain dose (D
cells); D is the number of L. monocytogenes consumed (CFU/serving) and r refers to the
probability that a single cell will cause invasive listeriosis. The r-values used for
evaluating risks of consumed number of L. monocytogenes were reported by Franz et al.
(2010) and Tromp et al. (2010) (r = 1.91*10-10). Because of “zero tolerance” in the
U.S., 10-5 of the probability illness was used as tolerance level in this study. Besides,

76
different subpopulations with different levels of vulnerability to illness following
exposure was not considered in the present study.
In the present study, serving size of fresh baby spinach data was based on
collected from the study published by Hoelzer et al. (2012a). Serving size was defined
by cumulative probability distributions. Thus, the final output of the exposure model will
be determined as the probability distribution of the ingested dose in colony-forming
units (CFU) in serving size of fresh baby spinach, with which the risk of infection was
predicted by the dose-response model.
Two total numbers of annual servings of fresh baby spinach were used to
estimate cases of listeriosis in the U.S. annually. First, the total number of annual
servings (high number of servings) of fresh baby spinach was assumed equal to 8.5*1010
(FDA/CFSAN, 2003). Second, Hoelzer et al. (2012a) reported that 40% of fresh baby
spinach consumed by 3.17% of the U.S. population is consumed as fresh, annually. In
addition, per capita consumption of spinach is reported as 870.9 g by Lucier and Glaser
(2010) and the population of the U.S. was reported 308,745,538 in 2010 by Howden and
Meyer (2011). The total number of annual servings (low number of servings) of fresh
baby spinach was then calculated as:
𝐶 = 𝑃 ∗ 0.0317 ∗ 0.40 ∗ 870.9 (4.2)
𝑆𝑁 =𝐶
𝑆𝑆 (4.3)

77
Herein, P is the population of the U.S.; SN is the number of servings annually; C is the
amount of fresh baby spinach consumed in the U.S.; and SS is serving size (g).
Next, the estimated cases of listeriosis for population caused by fresh baby
spinach consumption per year were calculated as (Danyluk and Schaffner, 2011):
𝐸𝐶𝐿 = 𝑃(𝐷) ∗ 𝑆𝑁 (4.4)
herein, ECL is the estimated number of cases of listeriosis.
4.3.3 Exposure Assessment
Codex Alimentarius (1999) determines exposure assessment as “the qualitative
and/or quantitative evaluation of the likely intake of biological, chemical, and physical
agents via food, as well as exposures from other sources if relevant.”
The scope of the exposure assessment for L. monocytogenes on fresh baby spinach
leaves within the food chain is shown in Figure 4.1. Fresh baby spinach leaves were
assumed to be contaminated with L. monocytogenes during harvest by an unknown
source. The process and packing line has several unit operations consisting of
harvesting, washing treatments (water and water- chlorine), packaging, irradiation,
storage, and transportation, and display for sale at markets before consumption at home.
The model inputs in terms of initial contamination level after harvest, transportation, and
cross contamination levels were based on available literature data. Otherwise, the growth
of L. monocytogenes was determined by laboratory experiments and growth models
developed for this microorganism in Chapter III.

78
Figure 4.1 Flow chart of fresh baby spinach process and distribution.
FARM
WASHING AND CHLORINE
•Cross-contamination
PACKAGING
•MAP (100% O2)
•MAP (N2O2 (1:1))
IRRADIATION
•1 kGy
TRANSPORTATION
•Temperature abuse (25oC, 4 hr)
MARKET
TABLE
•Temperature abuse (21oC, 2 hr)
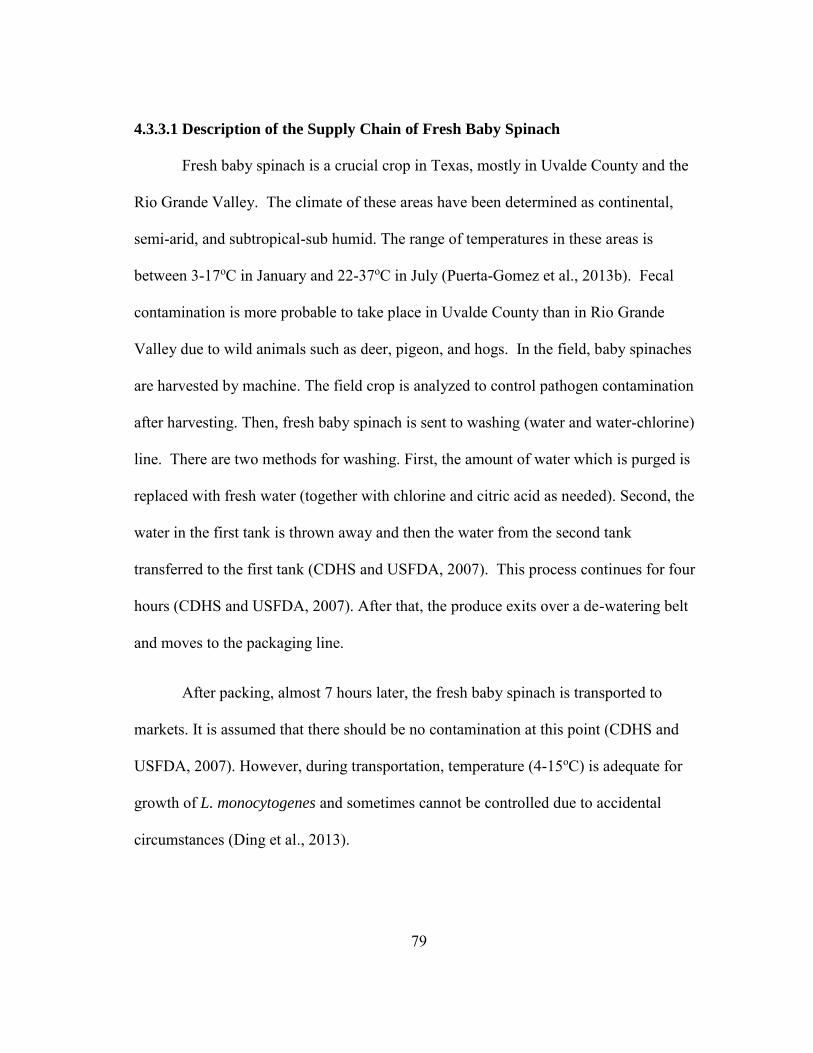
79
4.3.3.1 Description of the Supply Chain of Fresh Baby Spinach
Fresh baby spinach is a crucial crop in Texas, mostly in Uvalde County and the
Rio Grande Valley. The climate of these areas have been determined as continental,
semi-arid, and subtropical-sub humid. The range of temperatures in these areas is
between 3-17oC in January and 22-37oC in July (Puerta-Gomez et al., 2013b). Fecal
contamination is more probable to take place in Uvalde County than in Rio Grande
Valley due to wild animals such as deer, pigeon, and hogs. In the field, baby spinaches
are harvested by machine. The field crop is analyzed to control pathogen contamination
after harvesting. Then, fresh baby spinach is sent to washing (water and water-chlorine)
line. There are two methods for washing. First, the amount of water which is purged is
replaced with fresh water (together with chlorine and citric acid as needed). Second, the
water in the first tank is thrown away and then the water from the second tank
transferred to the first tank (CDHS and USFDA, 2007). This process continues for four
hours (CDHS and USFDA, 2007). After that, the produce exits over a de-watering belt
and moves to the packaging line.
After packing, almost 7 hours later, the fresh baby spinach is transported to
markets. It is assumed that there should be no contamination at this point (CDHS and
USFDA, 2007). However, during transportation, temperature (4-15oC) is adequate for
growth of L. monocytogenes and sometimes cannot be controlled due to accidental
circumstances (Ding et al., 2013).

80
4.3.3.2 Prevalence and Initial Level of Listeria monocytogenes
The status of L. monocytogenes in fresh baby spinach is defined by the
prevalence and concentration of the pathogen in the fresh baby spinach at the time of
consumption. There are no microbial surveys regarding prevalence of L. monocytogenes
in fresh baby spinach. However, Beuchat, (1996) stated that vegetables are likely
contaminated with L.monocytogenes because this pathogen can survive in decaying
vegetation, animal faces, soil, surface, river, and canal waters or sewage treatment
operations. Prazak (2002) detected L. monocytogenes in samples acquired from cabbage
farms in Texas, so fresh baby spinach can be contaminated with L. monocytogenes
during harvesting. According to this study, two positive samples of L. monocytogenes
were identified within 130 samples. Gombas et al. (2003) also collected 2,966 bagged
salad samples and L. monocytogenes was detected in 22 of them. Prevalence and initial
contamination level of L. monocytogenes on fresh baby spinach are the initial inputs of
the quantitative microbial risk assessment (QMRA) model developed in this study.
Therefore, the distribution for L. monocytogenes on fresh baby spinach was estimated
based on the combined data derived from literature (Table 4.1) in order to make the
QMRA more reliable and rational. The different initial population of the pathogen was
not used in the present study because it is well known that increasing the initial
population of the pathogen increases the risk of listeriosis.
The initial contamination level refers to the concentration of L. monocytogenes in
the fresh baby spinach leaves after harvest. There is no survey regarding concentration
of the pathogen in fresh baby spinach. Therefore, concentration of the pathogen was

81
assumed equal to the concentration found by Carrasco et al. (2010) for bagged salads
(Table 4.2). In the present study, both prevalence and concentration of L. monocytogenes
in fresh baby spinach were described separately by the cumulative probability
distribution. In addititon, the relative growth was calculated as:
𝑅𝐺 = ((𝑦0 − 𝑦𝑡) ∗ 100)/𝑦0 (4.5)
Herein, RG is the relative growth (%); yo is initial concentration density (log CFU/g); yt
is concentration of the pathogens at time t (log CFU/g).
4.3.3.3 Washing and Sanitizing (Chlorine)
Fresh and fresh –cut products are not exposed to any thermal treatments to
decrease microbial load. Therefore, cleaning washing and sanitizing are important steps
in the processing of these products. Microorganisms on fresh and fresh-cut products are
little affected from washing by tap water. Garg et al. (1990) determined that total counts
and Enterobacteriaceae on spinach leaves only decreased between 0.2 to 0.5 log cycles
by washing by tap water. Use of a sanitizer such as chlorine is the logical next step
because chlorine (200-ppm, 10 min) reduced population of L. monocytogenes on
shredded lettuce and cabbage by 1.7 and 1.2 log CFU/g, respectively (Zhang and Farber,
1996). In addition, it is recommended that the temperature of the processing water
should be kept up at least 10oC above than that of the produce to decrease the probability
of microbial infiltration caused by a temperature-generated pressure differential (Gil and
Selma, 2009). Nevertheless, during the washing step, pathogen microorganisms such as
L. monocytogenes can likely occur due to reuse of washing water and washing tanks.
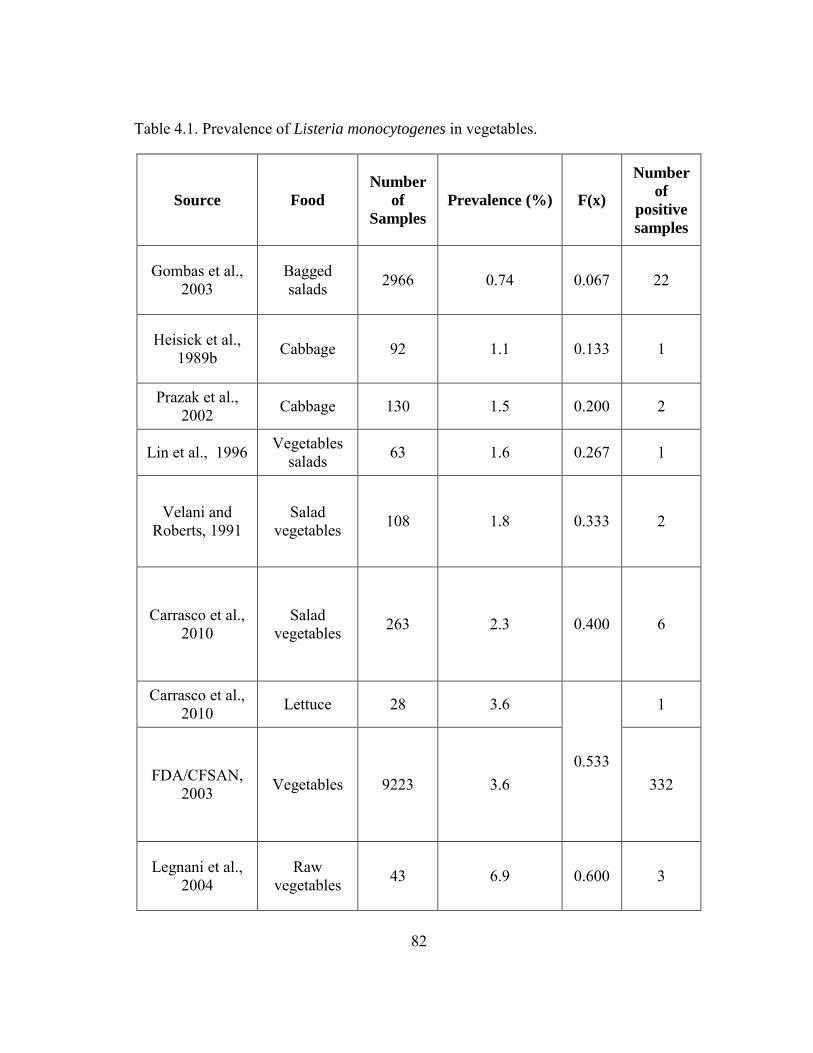
82
Table 4.1. Prevalence of Listeria monocytogenes in vegetables.
Source Food
Number
of
Samples
Prevalence (%) F(x)
Number
of
positive
samples
Gombas et al., 2003
Bagged salads 2966 0.74 0.067 22
Heisick et al., 1989b Cabbage 92 1.1 0.133 1
Prazak et al., 2002 Cabbage 130 1.5 0.200 2
Lin et al., 1996 Vegetables salads 63 1.6 0.267 1
Velani and Roberts, 1991
Salad vegetables 108 1.8 0.333 2
Carrasco et al., 2010
Salad vegetables 263 2.3 0.400 6
Carrasco et al., 2010 Lettuce 28 3.6
0.533
1
FDA/CFSAN, 2003 Vegetables 9223 3.6 332
Legnani et al., 2004
Raw vegetables 43 6.9 0.600 3

83
Table 4.1. Prevalence of Listeria monocytogenes in vegetables (continued).
Source Food
Number
of
Samples
Prevalence (%) F(x)
Number
of
positive
samples
De Simon et al., 1992
Vegetables salads 103 7.8 0.667 8
Harvey and Gilmour, 1993
Raw vegetables 66 10.6 0.733 7
Olaimat and Holley, 2012 Radish 132 14.4 0.800 19
Arumugaswamy et al., 1994
Leafy vegetables 22 22.7 0.867 5
Heisick et al., 1989b Radish 68 36.8 0.933 25

84
Table 4.2. Concentration assumed for Listeria monocytogenes in vegetables (Adapted from Carrasco et al., 2010).
Concentration (Log
CFU/25 g
Number of
positive Samples f(x) F(x)
0-0.4 17 0.77 0.77
0.4-1.4 1 0.04 0.82
1.4-2.4 1 0.04 0.86
2.4-3.4 2 0.09 0.95
3.4-4.4 1 0.04 1

85
As a result, pathogens, if present in raw vegetables, cannot be destroyed by tap water
and chlorine washing. Hence, probability distributions were fitted to the experimental
data using @RISK (Palisade Corp. NewField, NY). Thus, the normal distribution was
used to express the log reduction of water and chlorine washing (Carrasco et al., 2010;
Danyluk and Schaffner, 2011). The change of concentration of L. monocytogenes by
decontamination treatments from farm to table for low (Scenario #2) and high initial
concentration (Scenario #4) are presented in Figure A. 21 and A. 22 (Appendix).
4.3.3.4 Packaging
After the washing and sanitizing steps, the produce enters the packing line. In the
packaging process, there are several surfaces such as conveyors, handling equipment,
sorting tables, and packing containers (Johnston et al., 2006a). Poor cleaning on these
surfaces will not protect the produce against contamination by microorganisms. Even
pathogens such as L. monocytogenes cause cross-contamination (FAO and WHO, 2008).
Johnston et al., (2006a) determined that the contamination with E. coli on cabbages rose
from 0.7 log CFU/g to 0.86 log CFU/g during their removal from the conveyor belt to
the final box. Likewise, Prazak et al., (2002) pointed out that E. coli and L.
monocytogenes was present on transport bins, conveyor belts, and cooler surfaces used
for processing cabbages in the packaging process. As a result, these studies emphasize
the importance of hygiene and equipment sanitation to reduce the possibility of cross-
contamination.

86
4.3.3.5 Cross-contamination
Cross-contamination occurs when bacteria are passed from one food item to
another by handling mistakes, water washing, and packing equipment (Ding et al.,
2013). A recent study showed that the contamination loads of pathogens on various
kinds of surfaces ranged from 2.12 to 7.43 log CFU/g (Chen et al., 2001). Leafy green
vegetables such as spinach are kept under low temperature from farm to table, so the
growth of pathogenic microorganisms such as E. coli 0157:H7 and Salmonella is
limited. However, L. monocytogenes can grow during this period because the theoretical
minimum temperature for the growth of L. monocytogenes is -4.26oC (Koseki and Isobe,
2005a; Tromp et al., 2010). In this study, the cross-contamination scenario (Scenario #3,
#4, #5, and #6) was modeled by using a uniform distribution.
4.3.3.6 Irradiation
The reduction of L. monocytogenes in fresh baby spinach was determined by the
irradiation death model from experimental data (Gomes et al., 2011). According to this
study, the D10-value of Listeria spp. was 0.213 kGy. Therefore, the survival of L.
monocytogenes was calculated as:
𝑆𝑖𝑟𝑟 =𝑁
𝑁𝑜= 𝑒−𝐷 𝐷𝑜⁄ = 𝑒−2.303𝐷/0.213 = 𝑒−10.8122𝐷 (4.6)
herein, No refers to the initial number of microorganisms (CFU/g), N refers to the
number of remaining microorganisms (CFU/g) after exposure to dose D (in kGy), Do is
the mean lethal dose (in kGy), or the dose required to reduce the survival fraction S to
87
1/e (i.e., 37%) and D10 is the radiation D-value or required dose for 90% reduction of the
microbial population.
In the present study, the radiation dose was assumed as 1 kGy at the room
temperature (~21oC)) because this dose level is approved by the FDA and maintains
fresh baby spinach`s quality (Gomes et al., 2011).
4.3.3.7 Radiosensitization Strategies
When considering irradiation of fresh produce, producers need approaches to
reduce the required dose because the actual radiation dose required to reduce pathogen
can be very high (Puerta-Gomez et al., 2013b). One alternative is the combination of
Modified Atmosphere Packaging (MAP) with different atmospheres (e.g., 100% 02 and
50% N2) and ionizing radiation (Gomes et al., 2011). This approach showed that
although the doses required for the inactivation of pathogens (Salmonella spp. E. coli,
and Listeria spp.) in fresh baby spinach leaves decreased, the level of reduction of
pathogens increased. Gomes et al. (2013) also proved that 100% O2 atmospheres did not
cause any quality changes on fresh baby spinach leaves.
Irradiation treatment at low temperature is less effective to reduce
microorganisms in produce. Gomes et al. (2011) found a linear relationship between
radiation sensitivity and temperature, with a slope of -2.74*10-3 (±3.79*10-4), D10-
values/oC. This relationship was included in the irradiation treatment module of a risk
assessment model (Puerta-Gomez et al., 2013b). The reduction in Listeria spp.
population was then calculated as:

88
𝑆𝑖𝑟𝑟 = 𝑆𝑤𝑎𝑡𝑒𝑟 =𝐷𝑇
𝐷𝑀𝐴𝑃 (4.7)
herein, Sirr refers to the microbial population after the irradiation treatment (log CFU/g),
Swater refers to the population after the washing treatment (log CFU/g), DT refers to the
target dose (kGy), and DMAP refers to the calculated D10-value (kGy) at the specific
temperature and atmospheric conditions inside the package (MAP). Furthermore, Figure
A.1 (Appendix) shows the microbial distribution in the field and reduction at the
intervention steps, for two different initial loads of contamination.
4.3.3.8 Transport
Fresh baby spinaches should be transferred to market for sale and home for
consumption after harvesting. Temperature and time throughout transportation and
distribution are very important factors for the growth of L. monocytogenes. In this study,
it was assumed that the fresh baby spinach was distributed to chain markets and then it
was consumed at home. The temperature of transportation usually ranges from 4 to
15oC, whereas it sometimes increases up to 25oC (Ding et al., 2013). The time of
transportation of baby spinaches from the Rio Grande Valley to the closest city (San
Antonio, TX) and furthest big city (El Paso, TX) is approximately between 4 and 10
hours (Google Earth 7, Mountain View, CA). Therefore, the time throughout the
transportation process was determined by using a uniform distribution.
4.3.3.9 Growth of Listeria monocytogenes
The growth of L .monocytogenes in fresh baby spinach leaves from
transportation to the table was estimated using the Baranyi model (Eqs. 2.3 and 2.4,

89
Chapter II). The parameters of the Baranyi model (µmax, tlag and ymax) were also
calculated from Equations 3.9, 3.10, and 3.11 in Chapter III, respectively.
Time and temperature data used in this study was reported by Danyluk and
Schaffner (2011). These authors reported that the extreme value distribution was the best
fitting distribution of retail temperatures. They stated that leafy green vegetables is kept
between 4 and 7 days in the retail storage. The next step, home storage, represents the
expected change in pathogen level throughout storage in the consumer`s home. In the
present study, these data were modified by using several distributions (Table A.1,
Appendix).
4.4 Scenario Analysis
Table 4.3 presents all the different scenarios evaluated in this study. Each scenario
was simulated separately. Scenario #1 is based on the baseline of the supply chain (from
transportation to table) of fresh baby spinach. Scenario #2 is based on a combination of
baseline and the irradiation treatment (1 kGy at room temperature). Cross-contamination
was considered in Scenario #3, without irradiation. Scenarios #4, #5, and #6 includes
not only cross-contamination but also irradiation and Modified Atmosphere Packaging
(MAP), (O2 (100%) and N2:O2 (1:1). Lastly, Scenarios #7 and #8 simulated the case of
temperature abuse at the table and at the transportation step, respectively. Table A.1
(Appendix) summarizes all the cells in the Excel spreadsheet used for subsequent risk
calculation. Assumption made for this model including the following:

90
Cross-contamination did not occur without cross contamination Scenarios (#3,
#4, #5, #6).
Temperature abuse was not occurred without temperature abuse Scenarios (#7
and #8).
The initial contamination of L. monocytogenes in fresh baby spinach was
assumed to occur before the water washing treatments.
Time before the transportation step and after table was neglected.
All fresh baby spinach was consumed at home and any decontamination methods
would not be used without the decontamination treatments in the processing line.
4.5 Risk Characterization
Codex Alimentarius (1999) defines as “the process of determining the qualitative
and/or quantitative estimation, including attendant uncertainties, of the probability of
occurrence and severity of known or potential adverse health effects in a given
population based on hazard identification, hazard characterization, and exposure
assessment.”
The contamination levels of L. monocytogenes in fresh baby spinach at the point
of consumption were acquired from the exposure assessment and then fed into the
exponential dose-response model to administer the risk characterization portion of risk
assessment. According to the scenario of quantitative risk assessment model determined
in Table 4.3, the quantitative microbial risk assessment (QMRA) was built in an Excel
(Microsoft, Redmond, WA) spreadsheet, and then simulated by using Monte Carlo
techniques.
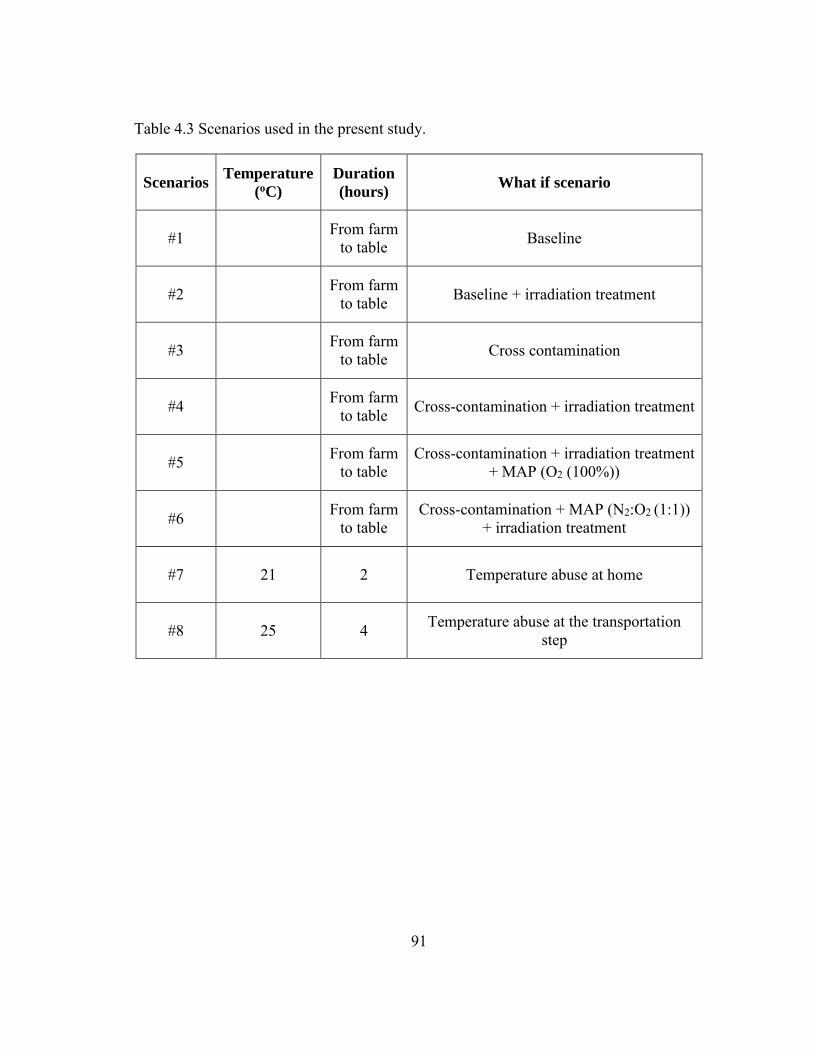
91
Table 4.3 Scenarios used in the present study.
Scenarios Temperature
(oC)
Duration
(hours) What if scenario
#1 From farm to table Baseline
#2 From farm to table Baseline + irradiation treatment
#3 From farm to table Cross contamination
#4 From farm to table Cross-contamination + irradiation treatment
#5 From farm to table
Cross-contamination + irradiation treatment + MAP (O2 (100%))
#6 From farm to table
Cross-contamination + MAP (N2:O2 (1:1)) + irradiation treatment
#7 21 2 Temperature abuse at home
#8 25 4 Temperature abuse at the transportation step

92
4.6 Monte Carlo Simulation
The Monte Carlo simulation, an alternative to analytic techniques, expresses a
powerful and accurate method for including both the stochastic and epistemic
uncertainty of a problem (Hald et al., 2004). A single point is spontaneously chosen
from each of the likelihood distributions assigned to each input parameter including
epistemic uncertainty in Monte Carlo simulation. These spontaneously chosen single
points are then used to compute a mathematical solution, as described by the risk
assessment model. This outcome is kept and this series iterate many thousand times.
Throughout each iteration, a unlike set of points for the inputs is chosen with points that
are more probably to happen, as described by the likelihood distribution, chosen more
repeatedly. The end outcome is a likelihood distribution for the output of interest,
represented by the mixture of ranges of repetitions of the input parameters. In this study,
each risk assessment model was simulated three times using the @RISK software
(Palisade Corp. New Field, NY) with 10,000 iterations.
The @Risk software is an important tool to conduct a probabilistic quantitative
microbiological risk assessment (QMRA). It provides an opportunity to simulate the
QMRA model built in an Excel spreadsheet.
4.7 Results and Discussion
The mean of prevalence (Figure A.23, Appendix) and initial concentration
(Figure A.24, Appendix) of L. monocytogenes on fresh baby spinach were calculated as
9.34% with a standard deviation of 0.121 and -0.669 log CFU/g with standard deviation
of 1.11 from several surveys (Table 4.1) and Carrasco et al. (2010) (Table 4.2),

93
respectively. The population of L. monocytogenes in fresh baby spinach leaves increased
by between -389.8 and 683.5% from transportation to consumption, based on the
different scenarios (Table 4.3). Higher relative growth (683.5%) was observed in the
cross-contamination Scenario (#3).
When evaluating the effectiveness of the decontamination treatments, application
of irradiation combined with modified atmosphere packaging MAP (N2:O2 (1:1)) was
more effective than other combinations because the relative growth of L. monocytogenes
was 66.8% (Table 4.4) even though cross-contamination occured. Carrasco et al. (2010)
also stated that the use of MAP (usually 5 to 10% CO2, 0.5 to 3% O2, and the balance of
N2 for RTE lettuce salads) postpones the growth of L. monocytogenes. In addition,
although the fresh baby spinach was contaminated by L. monocytogenes at harvesting
time, the population level of the pathogen at the table was reduced by the irradiation
treatment (Scenario #2) (Table 4.4). Thus, the irradiation treatment is a feasible
alternative to ensure the safety of fresh leafy greens without reducing their quality
attributes (low dose treatment at 1kGy).
Temperature abuse is an important issue for fresh produce. According to
Scenario #7, although cross contamination did not occur, the relative growth of L.
monocytogenes on fresh baby spinach leaves increased 296.7%. Furthermore,
temperature abuse at the transportation step (Scenario #8) increased 248.0% of the
relative growth of L. monocytogenes (Table 4.4). In addition, the point of temperature
abuse is important because if temperature abuse occurs before the retail step, the annual
number of cases of listeriosis will be 66% less than that those occurring at home (Table

94
Table 4.4 Calculated prevalence, initial and final population of Listeria
monocytogenes on fresh baby spinach leaves at time of consumption and relative growth.
Scenarios Prevalence
(%)
Initial
population
(log CFU/g)
Final
population (log
CFU/g)
Relative growth
(Eq. 4.5) (%)
#1
9.34 (0.121)
-0.669 (1.1083)
0.9778 (2.5450) 246.158
#2 -3.277 (3.342) -389.8356
#3 3.9035
(1.1988) 683.483
#4 0.996
(2.776) 248.879
#5 0.00258 (3.058) 100.386
#6 -0.222 (3.082) 66.8161
#7 1.316
(2.4524) 296.71
#8 0.99
(2.5174) 247.98
#1: Baseline
#2: Baseline + Irradiation
#3: Baseline + Cross contamination
#4: Baseline + Cross Contamination + Irradiation
#5: Baseline + Cross contamination + MAP (O2 (100%)) + Irradiation
#6: Baseline + Cross contamination + MAP (N2O2 (1:1)) + Irradiation
#7: Baseline +Temperature abuse (21oC, 2 hr) at the table
#8: Baseline + Temperature abuse (25oC, 4 hr) the transportation step

95
A.2, Appendix). These results support the recommendation that fresh baby spinach
leaves should be kept under the cold chain.
The cumulative frequencies for the overall probability of infection for the eight
scenarios are presented in Figure 4.2. With the exception of Scenario #2, no cross-
contamination, all the other scenarios yielded over 10% of the lot (Table 4.5). The
Scenario #2 yielded 5.8% of the lot as contaminated samples (Table 4.5). In addition, the
cross-contamination scenario (Scenario #3) yielded a percentage of tainted samples of
20.8%. Although the condition of Scenario #8 (25oC, 4 hours) represents higher
temperature abuse than that of Scenario #7 (21oC, 2 hours), Scenario #7 yielded 2 % of
tainted samples more than Scenario #8 (Figure 4.3). Thus, temperature abuse increases
the percentage of tainted samples due to an increase in pathogen population.
The effect of using Modified Atmosphere Packaging (MAP) strategies on the
cumulative frequency, in the sense of probability of infection is shown in Figure 4.4.
These results were simulated from same input and irradiation dose of 1 kGy. Scenarios
#5 and #6, (100% O2) and (N2:O2 (1:1)) yielded 10.3 and 10.1% of tainted product,
respectively. Therefore, the safety of fresh leafy greens, without considering the effect
on their quality attributes, can be ensured by the combination of the irradiation treatment
with MAP.

96
Table 4.5. Model parameters and calculated values for eight scenarios of the probability of infective dose of Listeria monocytogenes in fresh baby spinach leaves.

97
Figure 4.2 Probability of illness occurrence for Scenarios #1- #8.
#1: Baseline
#2: Baseline + Irradiation
#3: Baseline + Cross contamination
#4: Baseline + Cross Contamination + Irradiation
#5: Baseline + Cross contamination + MAP (O2 (100%)) + Irradiation
#6: Baseline + Cross contamination + MAP (N2O2 (1:1)) + Irradiation
#7: Baseline +Temperature abuse (21oC, 2 hr) at the table
#8: Baseline + Temperature abuse (25oC, 4 hr) the transportation step

98
Figure 4.3 Probability of illness occurrence in fresh baby spinach leaves base on
scenarios of temperature abuse.
#1: Baseline
#7: Baseline +Temperature abuse (21oC, 2 hr) at the table
#8: Baseline + Temperature abuse (25oC, 4 hr) the transportation step

99
Figure 4.4 Probability of infection occurrence in fresh baby spinach leaves irradiated at 1 kGy under different atmospheres at 21oC.
#2: Baseline + Irradiation
#4: Baseline + Cross Contamination + Irradiation
#5: Baseline + Cross contamination + MAP (O2 (100%)) + Irradiation
#6: Baseline + Cross contamination + MAP (N2O2 (1:1)) + Irradiation

100
The mean of serving size was 29-g (Figure A.25) and the annual number of
servings was calculated as 1.70x10⁸ (Eq. 4.3). Similar serving size (28-g) for vegetables
was reported by Food and Drug Administration and Center for Food Safety and Applied
Nutrition (FDA/CFSN) (2003). The estimated cases of listeriosis for the population
caused by fresh baby spinach consumption per year, ranged from 1.3x10⁻³ to 2.0x10⁵ for
high number of servings and ranged from 1.9x10⁻⁶ to 280 for low number of servings.
Similarly, Lynch et al. (2009) reported that the outbreaks related to fresh produce
increased because the number of servings increased. FDA/CFSAN (2003) reported that
predicted median cases of listeriosis for total U.S. population consuming vegetables on
per annum are 0.2. This result confirmed that the estimated cases of listeriosis for low
number of servings is more realistic than that for high number of servings.
The log value of exposure and cases are shown in Figure 4.5. There is always a
risk to increase the cases of illness with exposure in the home. This exposure was
postponed in the home storage and consumption stages. In addition, if the irradiation
treatment were applied, the estimated cases of listeriosis would be reduced by 99.95%.
Furthermore, the combination of irradiation and MAP could reduce the annual cases of
listeriosis by 99.99%. This result highlights the importance of introducing an irradiation
step to reduce the number of annual cases of listeriosis associated with leafy greens.
Up to now, the outbreaks of listeriosis associated with fresh baby spinach have
not been reported in the U.S. According to current policies in the U.S., a policy of “zero-
tolerance” of L. monocytogenes in ready-to-eat foods (i.e., products that may be
consumed without any further cooking or heating) is maintained by the FDA (Trinetta et

101
Figure 4.5 Comparison of risk between high and low no. of servings.

102
al., 2012). In addition, the Food and Drug Administration and Center for Food Safety
(FDA) and Applied Nutrition (CFSAN) (2003) reported that, based on their risk
assessment model, vegetables are in the low risk food categories due to their low median
serving size, contamination level, and growth rate. They reported that the median of
estimated number of cases of listeriosis per serving is 2.8x10⁻¹². However, in the present
study, the median of estimated number of cases of listeriosis per serving was between
1.58x10⁻¹⁴ and 2.38x10⁻⁶ for eight scenarios. The difference between these two results
suggest a potential overestimation of the values in the present study.
4.8 Conclusion
This study showed that the quantitative risk assessment model can be used to
estimate the effect of mitigation strategies to avoid potential cases of listeriosis in baby
spinach and other leafy greens. It is recommended to apply an irradiation step because
this decontamination method presented very significant results; it reduced 389.83% of
the initial population of L. monocytogenes in the leaves from farm to table under cold
chain. In addition, the estimated annual cases of listeriosis were reduced 99% when this
treatment was used. Besides, the use of irradiation in combination with Modified
Atmosphere Packaging (MAP) reduced the relative growth of the pathogen and the
estimated number cases of listeriosis. The relative growth of L. monocytogenes in fresh
baby was 246.15% based on the baseline scenario (no cross-contamination), while it was
66% when the combined treatments (irradiation plus MAP (N2:O2 (1:1)) were
considered, even though cross-contamination.

103
Based on these results, cross-contamination increased the risk of outbreaks.
Therefore, fresh baby spinach producers should periodically control their processing
systems. In addition, cold chain is very important to ensure safety of the produce. The
records of time and temperature should be regularly kept during the farm to table chain
even though the records after the market are very difficult to obtain. Furthermore, the
annual number of servings increased the estimated annual cases of listeriosis.
The developed model supplies a scientific base for risk managers and risk
business operators to gain a better understanding of the inhibition of the risk of listeriosis
because of fresh baby spinach consumption in spite of important uncertainty association
with the predictions.

104
CHAPTER V
CONCLUSION
This research focused on the quantitative microbial risk assessment of Listeria
monocytogenes in fresh baby spinach leaves.
The first part of this research evaluated the growth of L. monocytogenes and L.
innocua in fresh baby spinach as well as the reduction of the respective microorganisms
under water and chlorine treatments.
1. The reductions of L. monocytogenes and L. innocua in fresh baby spinach treated
by washing (water and chlorine) treatments were significantly different (P<0.05).
2. When the initial concentration of total mesophilic bacteria in fresh baby spinach
increased, the lag time and maximum growth rate of L. monocytogenes decreased
by 32.45% and 28.72% whereas that for L. innocua increased by 244.22% and
18.22% at 5°C, respectively.
3. When the initial concentration of total mesophilic bacteria in fresh baby spinach
increased, the maximum population density of L. monocytogenes did not change
whereas that for L. innocua was reduced by 1.91 log CFU/g at 36°C.
4. L. innocua should be tested before it is used as a surrogate for L. monocytogenes
due to the different conditions affecting the behavior of L. innocua and L.
monocytogenes
5. The Baranyi model and secondary models for maximum growth rate and
maximum population density provided accurate descriptions of the growth of L.
innocua and L. monocytogenes at temperature range of 5 to 36oC. However, the

105
secondary model for lag time did not provide an accurate description as well as
maximum growth rate and maximum population density for both
microorganisms.
The second part of this research consisted on a quantitative microbial risk
assessment for L. monocytogenes in fresh baby spinach leaves.
6. L. monocytogenes should be considered by producers for risk of listeriosis
because it can grow up to very high concentrations under favorable conditions
(eg, temperature).
7. Fresh produce should be periodically monitored for presence of pathogens in the
processing systems to prevent cross-contamination.
8. The records of time and temperature should be regularly maintained throughout
the farm to table chain to monitor temperature abuse.
9. The risk of listeriosis can be reduced by using Irradiation and Modified
Atmosphere Packaging (MAP) intervention steps.

106
CHAPTER VI
RECOMMENDATIONS FOR FURTHER STUDY
Recommendations for future research on validation of Listeria innocua as a
surrogate for L. monocytogenes and the quantitative risk assessment for L.
monocytogenes in fresh produce are to:
Test L. innocua under different environmental conditions such as temperature,
pH, relative humidity, and oxygen and nutrients availability and in several
commodities before used as a surrogate for L. monocytogenes.
Evaluate the effect of sub-population of the natural microflora on the growth of
L. innocua and L. monocytogenes in fresh baby spinach.
Determine the dynamic models to include all parameters, maximum growth rate,
lag time, and maximum population density which affected growth of L. innocua
and L. monocytogenes in leafy green vegetables
Collect data regarding prevalence and initial concentration of L. monocytogenes
in fresh baby spinach and other each commodities.
Collect data regarding temperature and time during harvesting, processing,
transportation, market and home storage for fresh baby spinach and leafy green
vegetables.
107
REFERENCES
Adavi, M. S. (2011). Electron Beam irradiation for improving safety of fruits and Vegetables. Master's thesis, Texas A&M University. Available electronically from http : / /hdl .handle .net /1969 .1 /ETD -TAMU -2011 -05 -9178.
Al-Zeyara, S. A., Jarvis, B., & Mackey, B. M. (2011). The inhibitory effect of natural microflora of food on growth of Listeria monocytogenes in enrichment broths. International Journal of Food Microbiology, 145(1), 98-105.
Amézquita, A., & Brashears, M. M. (2002). Competitive Inhibition of Listeria
monocytogenes in Ready-to-Eat Meat Products by Lactic Acid Bacteria. Journal
of Food Protection, 65(2), 316-325.
Anciso, J. & Gregory, A., (2010). Texas GAPs and GHPs food safety training curriculum. Published by Texas AgriLife Extension Service.
Arumugaswamy, R. K., Ali, G. R. R., & Hamid, S. N. B. A. (1994). Prevalence of Listeria monoctogenes in foods in Malaysia. International Journal of Food
Microbiology, 23(1), 117-121.
Babic, I., Roy, S., Watada, A., & Wergin, W. (1996). Changes in microbial populations on fresh cut spinach. International Journal of Food Microbiology, 31(1), 107-119.
Babic, I., & Watada, A. (1996). Microbial populations of fresh-cut spinach leaves affected by controlled atmospheres. Postharvest Biology and Technology, 9(2), 187-193.
Babic, I., Watada, A., & Buta, J. (1997). Growth of Listeria monocytogenes restricted by native microorganisms and other properties of fresh-cut spinach. Journal of Food
Protection, 60(8), 912-917.
Baranyi, J., & Roberts, T. A. (1994). A dynamic approach to predicting bacterial growth in food. International Journal of Food Microbiology, 23(3), 277-294.
Bennik, M. H., Vanloo, B., Brasseur, R., Gorris, L. G., & Smid, E. J. (1998). A novel bacteriocin with an YGNGV motif from vegetable-associated Enterococcus
mundtii: full characterization and interaction with target organisms. Biochimica
et Biophysica Acta (BBA)-Biomembranes, 1373(1), 47-58.
Beuchat, L. R. (1996a). Pathogenic microorganisms associated with fresh produce. Journal of Food Protection, 59(2), 204-216.
Beuchat, L. R. (1996b). Listeria monocytogenes: incidence on vegetables. Food Control,
7(4–5), 223-228. doi: http://dx.doi.org/10.1016/S0956-7135(96)00039-4

108
Beuchat, L. R. (2006). Vectors and conditions for preharvest contamination of fruits and vegetables with pathogens capable of causing enteric diseases. British Food
Journal, 108(1), 38-53.
Beuchat, L. R., & Brackett, R. E. (1990). Survival and Growth of Listeria
monocytogenes on Lettuce as Influenced by Shredding, Chlorine Treatment, Modified Atmosphere Packaging and Temperature. Journal of Food Science,
55(3), 755-758. doi: 10.1111/j.1365-2621.1990.tb05222.x
Bhattacharjee, S., Dasgupta, P., Paul, A. R., Ghosal, S., Padhi, K. K., & Pandey, L. P. (1998). Mineral element composition of spinach. Journal of the Science of Food
and Agriculture, 77(4), 456-458.
Brackett, R. (1999). Incidence, contributing factors, and control of bacterial pathogens in produce. Postharvest Biology and Technology, 15(3), 305-311.
Brandl, M. T. (2006). Fitness of Human Enteric Pathogens on Plants and Implications for Food Safety 1. Annu. Rev. Phytopathol., 44, 367-392.
Buchanan, R., Edelson, S., Miller, R., & Sapers, G. (1999). Contamination of intact apples after immersion in an aqueous environment containing Escherichia coli
O157: H7. Journal of Food Protection, 62(5), 444-450.
Burnett, A. B., & Beuchat, L. R. (2001). Comparison of sample preparation methods for recovering Salmonella from raw fruits, vegetables, and herbs. Journal of Food
Protection, 64(10), 1459-1465.
Burnett, A. B., Iturriaga, M. H., Escartin, E. F., Pettigrew, C. A., & Beuchat, L. R. (2004). Influence of Variations in Methodology on Populations of Listeria
monocytogenes Recovered from Lettuce Treated with Sanitizers. Journal of Food
Protection, 67(4), 742-750.
California Department of Health Services/U.S. Food and Drug Administration (CDHS/US FDA), (2007). Investigation of an Escherichia coli 0157:H7 outbreak associated with dole pre-packaged spinach. http://www.cdph.ca.gov/pubsforms/Documents/fdb%20eru%20Spnch%20EC%20Dole032007wph.PDF
Capozzi, V., Fiocco, D., Amodio, M. L., Gallone, A., & Spano, G. (2009). Bacterial stressors in minimally processed food. International Journal of Molecular
Sciences, 10(7), 3076-3105.
Carlin, F., & Morris, C. E. (1996). Influence of background microflora on Listeria
monocytogenes on minimally processed fresh broad-leaved endive (Cichorium endivia var. latifolia). Journal of Food Protection, 59(7), 698-703.
Carpentier, B., & Cerf, O. (2011). Review — Persistence of Listeria monocytogenes in food industry equipment and premises. International Journal of Food

109
Microbiology, 145(1), 1-8. doi: http://dx.doi.org/10.1016/j.ijfoodmicro.2011.01.005
Carrasco, E., Pérez-Rodríguez, F., Valero, A., & Zurera, G. (2008). Growth of Listeria
monocytogenes on shredded, ready-to-eat iceberg lettuce. Food Control, 19(5), 487-494.
Carrasco, E., Pérez‐Rodríguez, F., Valero, A., García‐Gimeno, R. M., & Zurera, G. (2010). Risk Assessment and Management of Listeria Monocytogenes in Ready‐to‐Eat Lettuce Salads. Comprehensive Reviews in Food Science and Food Safety,
9(5), 498-512.
Cassin, M. H., Lammerding, A. M., Todd, E. C. D., Ross, W., & McColl, R. S. (1998). Quantitative risk assessment for Escherichia coli O157:H7 in ground beef hamburgers. International Journal of Food Microbiology, 41(1), 21-44. doi: http://dx.doi.org/10.1016/S0168-1605(98)00028-2.
Cava-Roda, R. M., Taboada-Rodríguez, A., Valverde-Franco, M. T., & Marín-Iniesta, F. (2012). Antimicrobial activity of vanillin and mixtures with cinnamon and clove essential oils in controlling Listeria monocytogenes and Escherichia coli O157:
H7 in milk. Food and Bioprocess Technology, 5(6), 2120-2131. http://www.cdc.gov/listeria/pdf/listeria-annual-summary-2010-508c.pdf
Center for Disease Control and Prevention (CDC). (2010). National enteric disease surveillance Listeria annual summary, 2010. http://www.cdc.gov/listeria/pdf/listeria-annual-summary-2010-508c.pdf
Centers for Disease Control and Prevention (CDC), (2012). Multistate outbreak of listeriosis linked to whole cantaloupes from Jensen Farms, Colorado. http://www.cdc.gov/listeria/outbreaks/cantaloupes-jensen-farms/082712/index.html
Center for Disease Control and Prevention (CDC). (2013). Listeria (listeriosis). http://www.cdc.gov/listeria/statistics.html
Chen, Y., Jackson, K. M., Chea, F. P., & Schaffner, D. W. (2001). Quantification and variability analysis of bacterial cross-contamination rates in common food service tasks. Journal of Food Protection, 64(1), 72-80.
Chowdhury, B. R., Chakraborty, R., & Chaudhuri, U. R. (2007). Validity of modified Gompertz and Logistic models in predicting cell growth of Pediococcus
acidilactici AcH during the production of bacteriocin pediocin AcH. Journal of
Food Engineering, 80(4), 1171-1175.
Codex Alimentarius. (1999). Principles and guidelines for conduct of microbiological risk assessment. http://www.who.int/foodsafety/publications/micro/cac1999/en/

110
Codex Alimentarius. (2003). The codex code of hygienic practice for fruits and vegetables. ftp://ftp.fao.org/docrep/fao/010/a1389e/a1389e00.pdf
Cole, M., Jones, M., & Holyoak, C. (1990). The effect of pH, salt concentration and temperature on the survival and growth of Listeria monocytogenes. Journal of
Applied Microbiology, 69(1), 63-72.
Corbo, M. R., Campaniello, D., D’AMATO, D., Bevilacqua, A., & Sinigaglia, M. (2005). Behavior of Listeria monocytogenes and Escherichia coli 0157:H7 in fresh-sliced cactus-pear-fruit. Journal of Food Safety, 25(3), 157-172.
Cornu, M., Billoir, E., Bergis, H., Beaufort, A., & Zuliani, V. (2011). Modeling microbial competition in food: Application to the behavior of Listeria
monocytogenes and lactic acid flora in pork meat products. Food Microbiology,
28(4), 639-647.
Coroller, L., Leguérinel, I., Mettler, E., Savy, N., & Mafart, P. (2006). General model, based on two mixed Weibull distributions of bacterial resistance, for describing various shapes of inactivation curves. Applied and Environmental Microbiology,
72(10), 6493-6502.
Critzer, F. J., & Doyle, M. P. (2010). Microbial ecology of foodborne pathogens associated with produce. Current Opinion in Biotechnology, 21(2), 125-130.
Danyluk, M. D., & Schaffner, D. W. (2011). Quantitative assessment of the microbial risk of leafy greens from farm to consumption: preliminary framework, data, and risk estimates. Journal of Food Protection, 74(5), 700-708. doi: 10.4315/0362-028X.JFP-10-373.
De Roever, C. (1998). Microbiological safety evaluations and recommendations on fresh produce. Food Control, 9(6), 321-347.
De Simón, M., Tarragó, C., & Ferrer, M. D. (1992). Incidence of Listeria
monocytogenes in fresh foods in Barcelona (Spain). International Journal of
Food Microbiology, 16(2), 153-156. doi: http://dx.doi.org/10.1016/0168-1605(92)90008-Q
Ding, T., Wang, J., Forghani, F., Ha, S. D., Chung, M. S., Bahk, G. J., Oh, D. H. (2012). Development of predictive models for the growth of Escherichia coli O157: H7 on Cabbage in Korea. Journal of Food Science, 77(5), M257-M263.
Ding, T., Iwahori, J. i., Kasuga, F., Wang, J., Forghani, F., Park, M.-S., & Oh, D.-H. (2013). Risk assessment for Listeria monocytogenes on lettuce from farm to table in Korea. Food Control, 30(1), 190-199. doi: http://dx.doi.org/10.1016/j.foodcont.2012.07.014

111
Duh, Y.-H., & Schaffner, D. (1993). Modeling the effect of temperature on the growth rate and lag time of Listeria innocua and Listeria monocytogenes. Journal of
Food Protection, 56.
Ells, T. C., & Truelstrup Hansen, L. (2006). Strain and growth temperature influence Listeria spp. attachment to intact and cut cabbage. International Journal of Food
Microbiology, 111(1), 34-42.
Fahs, F., Mittelhammer, R. C., & McCluskey, J. J. (2009). E. coli outbreaks affect demand for salad vegetables. http://www.farmdoc.illinois.edu/policy/choices/20092/theme1/2009-2-06.pdf
Fairchild, T., & Foegeding, P. (1993). A proposed nonpathogenic biological indicator for thermal inactivation of Listeria monocytogenes. Applied and environmental
microbiology, 59(4), 1247-1250.
Fan, L., Song, J., McRae, K., Walker, B., & Sharpe, D. (2007). Gaseous ozone treatment inactivates Listeria innocua in vitro. Journal of Applied Microbiology, 103(6), 2657-2663.
Fang, T., Liu, Y., & Huang, L. (2013). Growth kinetics of Listeria monocytogenes and spoilage microorganisms in fresh-cut cantaloupe. Food Microbiology, 34(1), 174-181. doi: http://dx.doi.org/10.1016/j.fm.2012.12.005
Farber, J., & Peterkin, P. (1991). Listeria monocytogenes, a food-borne pathogen. Microbiological Reviews, 55(3), 476.
Farber, J., McKellar, R., & Ross, W. (1995). Modelling the effects of various parameters on the growth of Listeria monocytogenes on liver pâté. Food Microbiology, 12, 447-453.
Farber, J. M., Wang, S. L., Cai, Y., & Zhang, S. (1998). Changes in populations of Listeria monocytogenes inoculated on packaged fresh-Cut vegetables. Journal of
Food Protection, 61(2), 192-195.
Foegeding, P., & Stanley, N. (1990). Listeria monocytogenes F5069 thermal death times in liquid whole egg. Journal of Food Protection, 53(1), 6-8, 25.
Food and Drug Administration/Center for Food Safety and Applied Nutrition (FDA/CFSAN), (2003). Quantitative assessment of relative risk to public health from foodborne Listeria monocytogenes among selected categories of ready-to-eat foods. http://www.fda.gov/downloads/food/scienceresearch/researchareas/riskassessmentsafetyassessment/ucm197330.pdf
Food and Drug Administration (FDA), (2009). Guidance for industry: Guide to minimize microbial food safety hazards of leafy greens; Draft guidance.

112
http://www.fda.gov/Food/GuidanceRegulation/GuidanceDocumentsRegulatoryInformation/ProducePlantProducts/ucm174200.htm
Food and Drug Administration (FDA), (2010). Sanger Fresh Cut Produce Co. LLC, San Antonio, TX report. http://www.fda.gov/downloads/aboutfda/centersoffices/officeofglobalregulatoryoperationsandpolicy/ora/oraelectronicreadingroom/ucm232412.pdf
Food and Drug Administration (FDA). (2013). Recalls of foods & dietary supplements. http://www.fda.gov/Food/RecallsOutbreaksEmergencies/Recalls/default.htm
Francis, G. A., & O'Beirne, D. (1998). Effects of the indigenous microflora of minimally processed lettuce on the survival and growth of Listeria innocua. International
Journal of Food Science & Technology, 33(5), 477-488.
Francis, G. A., Thomas, C., & O'beirne, D. (1999). The microbiological safety of minimally processed vegetables. International Journal of Food Science &
Technology, 34(1), 1-22.
Francis, G. A., & O'Beirne, D. (2002). Effects of vegetable type and antimicrobial dipping on survival and growth of Listeria innocua and E. coli. International
Journal of Food Science & Technology, 37(6), 711-718.
Franz, E., Tromp, S., Rijgersberg, H., & Van Der Fels-Klerx, H. (2010). Quantitative microbial risk assessment for Escherichia coli O157: H7, Salmonella, and Listeria monocytogenes in leafy green vegetables consumed at salad bars. Journal of Food Protection, 73(2), 274-285.
Friedly, E. C. (2007). Listeria innocua use as a surrogate for Listeria monocytogenes. Master`s thesis, University of Arkansas. http://search.proquest.com/pqdtft/docview/304897282/fulltextPDF/1423E0B823B26C805E0/2?accountid=7082
Friedly, E., Crandall, P., Ricke, S., O'bryan, C., Martin, E., & Boyd, L. (2008). Identification of Listeria innocua surrogates for Listeria monocytogenes in hamburger patties. Journal of Food Science, 73(4), M174-M178.
Fujikawa, H., Kai, A., & Morozumi, S. (2004). A new logistic model for Escherichia
coli growth at constant and dynamic temperatures. Food Microbiology, 21(5), 501-509.
Gagliardi, J., Millner, P., Lester, G., & Ingram, D. (2003). On-farm and postharvest processing sources of bacterial contamination to melon rinds. Journal of Food
Protection, 66(1), 82-87.
Garg, N., Churey, J., & Splittstoesser, D. (1990). Effect of processing conditions on the microflora of fresh-cut vegetables. Journal of Food Protection, 53.

113
Garrido, V., García-Jalón, I., & Vitas, A. I. (2010). Temperature distribution in Spanish domestic refrigerators and its effect on Listeria monocytogenes growth in sliced ready-to-eat ham. Food Control, 21(6), 896-901.
Geysen, S., Verlinden, B., Geeraerd, A., Van Impe, J., Michiels, C., & Nicolaï, B. (2005). Predictive modelling and validation of Listeria innocua growth at superatmospheric oxygen and carbon dioxide concentrations. International
Journal of Food Microbiology, 105(3), 333-345.
Gibson, A. M., Bratchell, N., & Roberts, T. (1988). Predicting microbial growth: growth responses of salmonellae in a laboratory medium as affected by pH, sodium chloride and storage temperature. International Journal of Food Microbiology,
6(2), 155-178.
Gil, M. I., Selma, M. V., López-Gálvez, F., & Allende, A. (2009). Fresh-cut product sanitation and wash water disinfection: problems and solutions. International
Journal of Food Microbiology, 134(1), 37-45.
Glaser, P., Frangeul, L., Buchrieser, C., Rusniok, C., Amend, A., Baquero, F., Chakraborty, T. (2001). Comparative genomics of Listeria species. Science,
294(5543), 849-852.
Gleeson, E. (2005). Effects of process severity on survival and growth of Escherichia
coli and Listeria innocua on minimally processed vegetables. Food Control,
16(8), 677-685.
Gombas, D. E., Chen, Y., Clavero, R. S., & Scott, V. N. (2003). Survey of Listeria
monocytogenes in ready-to-eat foods. Journal of Food Protection, 66(4), 559-569.
Gomes, C., Moreira, R., Castell‐Perez, M., Kim, J., Da Silva, P., & Castillo, A. (2008). E‐Beam irradiation of bagged, ready‐to‐eat spinach leaves (Spinacea oleracea): An engineering approach. Journal of Food Science, 73(2), E95-E102.
Gomes, C., Da Silva, P., Moreira, R. G., Castell-Perez, E., Ellis, E., & Pendleton, M. (2009). Understanding E. coli internalization in lettuce leaves for optimization of irradiation treatment. International Journal of Food Microbiology, 135(3), 238-247.
Gomes, C., Moreira, R. G., & Castell‐Perez, E. (2011). Radiosensitization of Salmonella spp. and Listeria spp. in ready‐to‐eat baby spinach leaves. Journal of Food
Science, 76(1), E141-E148.
Gómez-López, V. M., Gobet, J., Selma, M. V., Gil, M. I., & Allende, A. (2013). Operating conditions for the electrolytic disinfection of process wash water from the fresh-cut industry contaminated with E. coli 0157: H7. Food Control, 29(1), 42-48.
114
González‐Fandos, E., Olarte, C., Giménez, M., Sanz, S., & Simón, A. (2001). Behaviour of Listeria monocytogenes in packaged fresh mushrooms (Agaricus bisporus). Journal of Applied Microbiology, 91(5), 795-805.
Guo, M., Jin, T. Z., Scullen, O. J., & Sommers, C. H. (2013). Effects of Antimicrobial Coatings and Cryogenic Freezing on Survival and Growth of Listeria innocua on Frozen Ready-to-Eat Shrimp during Thawing. Journal of Food Science, 78(8), M1195-M1200. doi: 10.1111/1750-3841.12180
Hald, T., Vose, D., Wegener, H. C., & Koupeev, T. (2004). A Bayesian Approach to Quantify the Contribution of Animal‐Food Sources to Human Salmonellosis. Risk Analysis, 24(1), 255-269.
Harris, L. J., Farber, J. N., Beuchat, L. R., Parish, M. E., Suslow, T. V., Garrett, E. H., & Busta, F. F. (2003). Outbreaks associated with fresh produce: Incidence, growth, and survival of pathogens in fresh and fresh-cut produce. Comprehensive
Reviews in Food Science and Food Safety, 2, 78-141. doi: 10.1111/j.1541-4337.2003.tb00031.x
Harvey, J., & Gilmour, A. (1993). Occurrence and characteristics of Listeria in foods produced in Northern Ireland. International Journal of Food Microbiology,
19(3), 193-205.
Heisick, J., Wagner, D., Nierman, M., & Peeler, J. (1989). Listeria spp. found on fresh market produce. Applied and Environmental Microbiology, 55(8), 1925-1927.
Hervás, C., Zurera, G., García, R., & Martinez, J. (2001). Optimization of computational neural network for its application in the prediction of microbial growth in foods. Food Science and Technology International-New York-, 7(2), 159-164.
Hitchins, A., & Whiting, R. (2001). Food-borne Listeria monocytogenes risk assessment. Food Additives & Contaminants, 18(12), 1108-1117.
Hoelzer, K., Pouillot, R., Egan, K., & Dennis, S. (2012a). Produce consumption in the United States: An analysis of consumption frequencies, serving sizes, processing forms, and high-consuming population subgroups for microbial risk assessments. Journal of Food Protection, 75(2), 328-340.
Hoelzer, K. P., Regis & Dennis, S. (2012b). Listeria monocytogenes growth dynamics on produce: a review of the data available data for predictive modeling. Foodborne Pathogens and Disease, 9(7), 661-673.
Hora, R., Warriner, K., Shelp, B. J., & Griffiths, M. W. (2005). Internalization of Escherichia coli O157: H7 following biological and mechanical disruption of growing spinach plants. Journal of Food Protection, 68(12), 2506-2509.
115
Houtsma, P., Kusters, B., De Wit, J., Rombouts, F., & Zwietering, M. (1994). Modelling growth rates of Listeria innocua as a function of lactate concentration. International Journal of Food Microbiology, 24(1), 113-123.
Howden, L. M., & Meyer, J. A., (2011). Age and sex composition in the United States: 2010 census brief. http://www.census.gov/prod/cen2010/briefs/c2010br-03.pdf
Huang, L. (2011). A new mechanistic growth model for simultaneous determination of lag phase duration and exponential growth rate and a new Bĕlehdrádek-type model for evaluating the effect of temperature on growth rate. Food
Microbiology, 28(4), 770-776.
Hwang, C.-A., & Sheen, S. (2011). Growth characteristics of Listeria monocytogenes as affected by a native microflora in cooked ham under refrigerated and temperature abuse conditions. Food Microbiology, 28(3), 350-355.
Ijabadeniyi, O. A., Minnaar, A., & Buys, E. M. (2011). Effect of attachment time followed by chlorine washing on the survival of inoculated Listeria
monocytogenes on tomatoes and spinach. Journal of Food Quality, 34(2), 133-141.
Institute of Food Research (IFR), (2013). Computational microbiology. http://www.ifr.ac.uk/safety/dmfit/
Johnston, L. M., Jaykus, L.-A., Moll, D., Martinez, M. C., Anciso, J., Mora, B., & Moe, C. L. (2005a). A field study of the microbiological quality of fresh produce. Journal of Food Protection, 68(9), 1840-1847.
Johnston, L. M., Moe, C. L., Moll, D., & Jaykus, L.-A. (2005b). The epidemiology of produce-associated outbreaks of foodborne disease Microbial Hazard
Identification in Fresh Fruit and Vegetables (pp. 37-72): John Wiley & Sons, Inc.
Johnston, M. A., Harrison, M. A., & Morrow, R. A. (2009). Microbial antagonists of Escherichia coli O157: H7 on fresh-cut lettuce and spinach. Journal of Food
Protection, 72(7), 1569-1575.
Juneja, V. K. (2003). Predictive model for the combined effect of temperature, sodium lactate, and sodium diacetate on the heat resistance of Listeria monocytogenes in beef. Journal of Food Protection, 66(5), 804-811.
Juneja, V. K., Melendres, M. V., Huang, L., Subbiah, J., & Thippareddi, H. (2009). Mathematical modeling of growth of Salmonella in raw ground beef under isothermal conditions from 10 to 45° C. International Journal of Food
Microbiology, 131(2), 106-111.
Kalmokoff, M., Austin, J., Wan, X. D., Sanders, G., Banerjee, S., & Farber, J. (2001). Adsorption, attachment and biofilm formation among isolates of Listeria
116
monocytogenes using model conditions. Journal of Applied Microbiology, 91(4), 725-734.
Kamat, A. S., & Nair, P. M. (1996). Identification of Listeria innocua as a biological indicator for inactivation of L. monocytogenes by some meat processing treatments. LWT - Food Science and Technology, 29(8), 714-720. doi: http://dx.doi.org/10.1006/fstl.1996.0111
Keskinen, L. A., Burke, A., & Annous, B. A. (2009). Efficacy of chlorine, acidic electrolyzed water and aqueous chlorine dioxide solutions to decontaminate Escherichia coli O157:H7 from lettuce leaves. International Journal of Food
Microbiology, 132(2–3), 134-140. doi: http://dx.doi.org/10.1016/j.ijfoodmicro.2009.04.006
Koseki, S., & Isobe, S. (2005a). Growth of Listeria monocytogenes on iceberg lettuce and solid media. International Journal of Food Microbiology, 101(2), 217-225.
Koseki, S., & Isobe, S. (2005b). Prediction of pathogen growth on iceberg lettuce under real temperature history during distribution from farm to table. International
Journal of Food Microbiology, 104(3), 239-248.
Koseki, S., Mizuno, Y., Kawasaki, S., & Yamamoto, K. (2011). A survey of iceberg lettuce for the presence of Salmonella, Escherichia coli O157: H7, and Listeria
monocytogenes in Japan. Journal of Food Protection, 74(9), 1543-1546.
Kozak, G., Macdonald, D., Landry, L., & Farber, J. (2013). Foodborne outbreaks in Canada linked to produce: 2001 through 2009. Journal of Food Protection,
76(1), 173-183.
Kreyenschmidt, J., Hübner, A., Beierle, E., Chonsch, L., Scherer, A., & Petersen, B. (2010). Determination of the shelf life of sliced cooked ham based on the growth of lactic acid bacteria in different steps of the chain. Journal of Applied
Microbiology, 108(2), 510-520.
Lammerding, A. M., & Paoli, G. M. (1997). Quantitative risk assessment: an emerging tool for emerging foodborne pathogens. Emerging infectious diseases, 3(4), 483.
Legnani, P. P., & Leoni, E. (2004). Effect of processing and storage conditions on the microbiological quality of minimally processed vegetables. International Journal
of Food Science & Technology, 39(10), 1061-1068.
Leroy, F., & De Vuyst, L. (2005). Simulation of the effect of sausage ingredients and technology on the functionality of the bacteriocin-producing Lactobacillus sakei CTC 494 strain. International Journal of Food Microbiology, 100(1), 141-152.
Li, Y., Brackett, R., Chen, J., & Beuchat, L. (2002). Mild heat treatment of lettuce enhances growth of Listeria monocytogenes during subsequent storage at 5 C or 15 C. Journal of Applied Microbiology, 92(2), 269-275.
117
Li, M. Y., Sun, X. M., Zhao, G. M., Huang, X. Q., Zhang, J. W., Tian, W., & Zhang, Q. H. (2013). Comparison of mathematical models of Lactic acid bacteria growth in vacuum-packaged raw beef stored at different temperatures. Journal of Food
Science, 78(4), M600-M604. doi: 10.1111/j.1750-3841.2012.02995.x
Lianou, A., & Sofos, J. N. (2007). A review of the incidence and transmission of Listeria
monocytogenes in ready-to-eat products in retail and food service environments. Journal of Food Protection, 70(9), 2172-2198.
Lin, C.-M., Fernando, S. Y., & Wei, C.-i. (1996). Occurrence of Listeria monocytogenes, Salmonella spp., Escherichia coli and E. coli O157: H7 in vegetable salads. Food
Control, 7(3), 135-140.
Lucier, G., & Glaser, L., (2010). Vegetables and melons outlook. http://usda01.library.cornell.edu/usda/ers/VGS//2010s/2010/VGS-04-22-2010.pdf
Lynch, M., Tauxe, R., & Hedberg, C. (2009). The growing burden of foodborne outbreaks due to contaminated fresh produce: risks and opportunities. Epidemiology and Infection, 137(3), 307.
Mafart, P. (2005). Food engineering and predictive microbiology: on the necessity to combine biological and physical kinetics. International Journal of Food
Microbiology, 100(1), 239-251.
Marks, B. P. (2008). Status of microbial modeling in food process models. Comprehensive Reviews in Food Science and Food Safety, 7(1), 137-143.
McKellar, R. (1997). A heterogeneous population model for the analysis of bacterial growth kinetics. International Journal of Food Microbiology, 36(2), 179-186.
McMeekin, T. A., Olley, J., & Ross, T. (1993). Predictive microbiology: theory and application.
McMeekin, T., Olley, J., Ratkowsky, D., Corkrey, R., & Ross, T. (2013). Predictive microbiology theory and application: Is it all about rates? Food Control, 29(2), 290-299.
Milillo, S. R., Badamo, J. M., Boor, K. J., & Wiedmann, M. (2008). Growth and persistence of Listeria monocytogenes isolates on the plant model Arabidopsis thaliana. Food Microbiology, 25(5), 698-704. doi: http://dx.doi.org/10.1016/j.fm.2008.03.003
Milillo, S. R., Friedly, E. C., Saldivar, J. C., Muthaiyan, A., O'bryan, C., Crandall, P. G., Ricke, S. C. (2012). A review of the ecology, genomics, and stress response of Listeria innocua and Listeria monocytogenes. Critical Reviews in Food Science
and Nutrition, 52(8), 712-725.

118
Milly, P., Toledo, R., & Chen, J. (2008). Evaluation of liquid smoke treated ready‐to‐eat (RTE) meat products for control of Listeria innocua M1. Journal of Food
Science, 73(4), M179-M183.
Monsalve, D. (2008). Development of predictive models for the growth of Listeria
monocytogenes on ready-to-eat meat and poultry products. Ph.D. thesis, the University of Nebraska. http://search.proquest.com/pqdtft/docview/304519493/fulltextPDF/1423E0D688B6EDB4919/1?accountid=7082
Montville, R., & Schaffner, D. (2005). Monte Carlo simulation of pathogen behavior during the sprout production process. Applied and Environmental Microbiology,
71(2), 746-753.
Morris, C. E., Monier, J., & Jacques, M. (1997). Methods for observing microbial biofilms directly on leaf surfaces and recovering them for isolation of culturable microorganisms. Applied and Environmental Microbiology, 63(4), 1570-1576.
Morris, C. E., & Monier, J.-M. (2003). The ecological significance of biofilm formation by plant-associated bacteria. Annual review of phytopathology, 41(1), 429-453.
Morrisey, K. M., Knickrehm, A. K., & Sakata, N. A. (2010). Evaluation of listeriosis screening, reporting and education procedures by obstetricians. http://www.cdhd.idaho.gov/pdfs/cd/Listeriosis_May10.pdf
Murphy, P., Rea, M., & Harrington, O. (1996). Development of a predictive model for growth of Listeria monocytogenes in a skim milk medium and validation studies in a range of dairy products. Journal of Applied Microbiology, 80(5), 557-564.
Murphy, R., Marks, B., Johnson, E., & Johnson, M. (2000). Thermal inactivation kinetics of Salmonella and Listeria in ground chicken breast meat and liquid medium. Journal of Food Science, 65(4), 706-710.
Neal, J. A. (2013). The effect of electron Beam irradiation and sanitizers in the reduction of pathogens and attachment prevention on spinach. Doctoral dissertation,Texas A&M University. Available electronically from http : //hdl .handle .net /1969 .1 /ETD -TAMU -2009 -05 -289.
Nilsson, R. E., Ross, T., & Bowman, J. P. (2011). Variability in biofilm production by Listeria monocytogenes correlated to strain origin and growth conditions. International Journal of Food Microbiology, 150(1), 14-24.
Nufer, U., Stephan, R., & Tasara, T. (2007). Growth characteristics of Listeria
monocytogenes, Listeria welshimer and Listeria innocua strains in broth cultures and a sliced bologna-type product at 4 and 7° C. Food Microbiology, 24(5), 444-451.
http://search.proquest.com/pqdtft/docview/304519493/fulltextPDF/1423E0D688B6EDB4919/1?accountid=7082
119
O'Bryan, C. A., Crandall, P. G., Martin, E. M., Griffis, C. L., & Johnson, M. G. (2006). Heat resistance of Salmonella spp., Listeria monocytogenes, Escherichia coli
0157: H7, and Listeria innocua M1, a potential surrogate for Listeria
monocytogenes, in meat and poultry: A review. Journal of Food Science, 71(3), R23-R30.
Olaimat, A. N., & Holley, R. A. (2012). Factors influencing the microbial safety of fresh produce: A review. Food Microbiology, 32(1), 1-19.
Ölmez, H., & Kretzschmar, U. (2009). Potential alternative disinfection methods for organic fresh-cut industry for minimizing water consumption and environmental impact. LWT-Food Science and Technology, 42(3), 686-693.
Omary, M., Testin, R., Barefoot, S., & Rushing, J. (1993). Packaging effects on growth of Listeria innocua in shredded cabbage. Journal of Food Science, 58(3), 623-626.
Painter, J. A., Hoekstra, R. M., Ayers, T., Tauxe, R. V., Braden, C. R., Angulo, F. J., & Griffin, P. M. (2013). Attribution of foodborne illnesses, hospitalizations, and deaths to food commodities by using outbreak data, United States, 1998–2008. Emerging Infectious Diseases, 19(3), 407.
Park, S., Szonyi, B., Gautam, R., Nightingale, K., Anciso, J., & Ivanek, R. (2012). Risk Factors for Microbial Contamination in Fruits and Vegetables at the Preharvest Level: A Systematic Review. Journal of Food Protection, 75(11), 2055-2081. doi: 10.4315/0362-028X.JFP-12-160.
Patil, S., Valdramidis, V., Cullen, P., Frias, J., & Bourke, P. (2010). Ozone inactivation of acid stressed Listeria monocytogenes and Listeria innocua in orange juice using a bubble column. Food Control, 21(12), 1723-1730.
Perez-Rodriguez, F., & Valero, A. (2013). Predictive microbiology in foods. London: Springer.
Petran, R., & Zottola, E. (1989). A study of factors affecting growth and recovery of Listeria monocytogenes Scott A. Journal of Food Science, 54(2), 458-460.
Pouillot, R., Lubran, M. B., Cates, S. C., & Dennis, S. (2010). Estimating parametric distributions of storage time and temperature of ready-to-eat foods for US households. Journal of Food Protection, 73(2), 312-321.
Pradhan, A. K., Ivanek, R., Grohn, Y. T., Bukowski, R., Geornaras, I., Sofos, J. N., & Wiedmann, M. (2010). Quantitative risk assessment of listeriosis-associated deaths due to Listeria monocytogenes contamination of deli meats originating from manufacture and retail. Journal of Food Protection, 73(4), 620-630.

120
Prazak, A. M., Murano, E. A., Mercado, I., & Acuff, G. R. (2002). Antimicrobial resistance of Listeria monocytogenes isolated from various cabbage farms and packing sheds in Texas. Journal of Food Protection, 65(11), 1796-1799.
Puerta-Gomez, A., Moreira, R., Kim, J., & Castell-Perez, E. (2013a). Modeling the growth rates of Escherichia coli spp. and Salmonella Typhimurium LT2 in baby spinach leaves under slow cooling. Food Control, 29(1), 11-17.
Puerta-Gomez, A. F., Kim, J., Moreira, R. G., Klutke, G. A., & Castell-Perez, M. E. (2013b). Quantitative assessment of the effectiveness of intervention steps to reduce the risk of contamination of ready-to-eat baby spinach with Salmonella. Food Control, 31(2), 410-418. doi: http://dx.doi.org/10.1016/j.foodcont.2012.10.022
Ratkowsky, D., Olley, J., McMeekin, T., & Ball, A. (1982). Relationship between temperature and growth rate of bacterial cultures. Journal of Bacteriology,
149(1), 1-5.
Raybaudi-Massilia, R. M., Mosqueda-Melgar, J., & Martín-Belloso, O. (2009). Antimicrobial activity of malic acid against Listeria monocytogenes, Salmonella
Enteritidis and Escherichia coli O157: H7 in apple, pear and melon juices. Food
Control, 20(2), 105-112.
Rodrıguez, A.M.C., Barco Alcalá, E. B., Gimeno, R.M.G., & Cosano, G. Z. (2000). Growth modelling of Listeria monocytogenes in packaged fresh green asparagus. Food Microbiology, 17(4), 421-427.
Rodriguez, O., Castell-Perez, M. E., Ekpanyaskun, N., Moreira, R. G., & Castillo, A. (2006). Surrogates for validation of electron beam irradiation of foods. International Journal of Food Microbiology, 110(2), 117-122.
Romero-Barrios, P., Hempen, M., Messens, W., Stella, P., & Hugas, M. (2013). Quantitative microbiological risk assessment (QMRA) of food-borne zoonoses at the European level. Food Control, 29(2), 343-349. doi: http://dx.doi.org/10.1016/j.foodcont.2012.05.043
Ronner, A. B., & Wong, A. (1993). Biofilm development and sanitizer inactivation of Listeria monocytogenes and Salmonella typhimurium on stainless steel and Buna-n rubber. Journal of Food Protection, 56.
Ross, T. (1996). Indices for performance evaluation of predictive models in food microbiology. Journal of Applied Microbiology, 81(5), 501-508.
Rosso, L., Lobry, J., Bajard, S., & Flandrois, J. (1995). Convenient model to describe the combined effects of temperature and pH on microbial growth. Applied and
Environmental Microbiology, 61(2), 610-616.
121
Sant'Ana, A. S., Igarashi, M. C., Landgraf, M., Destro, M. T., & Franco, B. D. (2012a). Prevalence, populations and pheno-and genotypic characteristics of Listeria
monocytogenes isolated from ready-to-eat vegetables marketed in São Paulo, Brazil. International Journal of Food Microbiology, 155(1), 1-9.
Sant’Ana, A. S., Franco, B. D., & Schaffner, D. W. (2012b). Modeling the growth rate and lag time of different strains of Salmonella enterica and Listeria
monocytogenes in ready-to-eat lettuce. Food Microbiology, 30(1), 267-273.
Sapers, G. M. (2001). Efficacy of washing and sanitizing methods for disinfection of fresh fruit and vegetable products. Food Technology and Biotechnology, 39(4), 305-312.
Scallan, E., Hoekstra, R. M., Angulo, F. J., Tauxe, R. V., Widdowson, M.-A., Roy, S. L., &Griffin, P. M. (2011). Foodborne illness acquired in the United States—major pathogens. Emerging Infectious Diseases, 17(1), 7.
Singh, N., Singh, R. K., Bhunia, A. K., & Stroshine, R. L. (2002). Efficacy of Chlorine dioxide, Ozone, and Thyme essential oil or a sequential washing in killing Escherichia coli O157:H7 on lettuce and baby carrots. LWT - Food Science and
Technology, 35(8), 720-729. doi: http://dx.doi.org/10.1006/fstl.2002.0933
Sivapalasingam, S., Friedman, C. R., Cohen, L., & Tauxe, R. V. (2004). Fresh produce: a growing cause of outbreaks of foodborne illness in the United States, 1973 through 1997. Journal of Food Protection, 67(10), 2342-2353.
Skandamis, P. N., Yoon, Y., Stopforth, J. D., Kendall, P. A., & Sofos, J. N. (2008). Heat and acid tolerance of Listeria monocytogenes after exposure to single and multiple sublethal stresses. Food Microbiology, 25(2), 294-303.
Slongo, A. P., Rosenthal, A., Quaresma Camargo, L. M., Deliza, R., Mathias, S. P., & Falcão de Aragão, G. M. (2009). Modeling the growth of lactic acid bacteria in sliced ham processed by high hydrostatic pressure. LWT-Food Science and
Technology, 42(1), 303-306.
Szabo, E., Scurrah, K., & Burrows, J. (2000). Survey for psychrotrophic bacterial pathogens in minimally processed lettuce. Letters in Applied Microbiology,
30(6), 456-460.
Szomolay, B., Klapper, I., Dockery, J., & Stewart, P. S. (2005). Adaptive responses to antimicrobial agents in biofilms. Environmental Microbiology, 7(8), 1186-1191. doi: 10.1111/j.1462-2920.2005.00797.x
Takeuchi, K., Matute, C. M., Hassan, A. N., & Frank, J. F. (2000). Comparison of the attachment of Escherichia coli O157: H7, Listeria monocytogenes, Salmonella
typhimurium, and Pseudomonas fluorescens to lettuce leaves. Journal of Food
Protection, 63(10), 1433-1437.

122
Tauxe, R. V. (1997). Emerging foodborne diseases: an evolving public health challenge. Emerging Infectious Diseases, 3(4), 425.
Te Giffel, M. C., & Zwietering, M. H. (1999). Validation of predictive models describing the growth of Listeria monocytogenes. International Journal of Food
Microbiology, 46(2), 135-149. doi: http://dx.doi.org/10.1016/S0168-1605(98)00189-5
Tian, J.-Q., Bae, Y.-M., Choi, N.-Y., Kang, D.-H., Heu, S., & Lee, S.-Y. (2012). Survival and growth of foodborne pathogens in minimally processed vegetables at 4 and 15 °C. Journal of Food Science, 77(1), M48-M50. doi: 10.1111/j.1750-3841.2011.02457.x
Tompkin, R. (2002). Control of Listeria monocytogenes in the food-processing environment. Journal of Food Protection, 65(4), 709-725.
Trias, R., Bañeras, L., Montesinos, E., & Badosa, E. (2010). Lactic acid bacteria from fresh fruit and vegetables as biocontrol agents of phytopathogenic bacteria and fungi. International Microbiology, 11(4), 231-236.
Tromp, S., Rijgersberg, H., & Franz, E. (2010). Quantitative microbial risk assessment for Escherichia coli O157: H7, Salmonella enterica, and Listeria monocytogenes in leafy green vegetables consumed at salad bars, based on modeling supply chain logistics. Journal of Food Protection, 73(10), 1830-1840.
Ukuku, D. O., & Fett, W. (2002). Behavior of Listeria monocytogenes inoculated on cantaloupe surfaces and efficacy of washing treatments to reduce transfer from rind to fresh-cut pieces. Journal of Food Protection, 65(6), 924-930.
United States Department of Agriculture/Environmental Protection Agency (USDA/EPA). (2012). Microbial risk assessment guideline pathogenic microorganisms with focus on food and water. http://www.epa.gov/raf/files/mra-guideline-final.pdf.
United States Department of Agriculture/Agricultural Research Service (USDA/ARS). (2013). Pathogen modeling program. http://ars.usda.gov/Services/docs.htm?docid=11550
United States Department of Agriculture/National Agricultural Statistics Service (USDA/NASS). (2013). Vegetables 2012 summary. http://usda01.library.cornell.edu/usda/current/VegeSumm/VegeSumm-01-29-2013.pdf
Valero, A., Hervás, C., García-Gimeno, R. M., & Zurera, G. (2007). Product unit neural network models for predicting the growth limits of Listeria monocytogenes. Food
Microbiology, 24(5), 452-464.

123
Van Houdt, R., & Michiels, C. W. (2010). Biofilm formation and the food industry, a focus on the bacterial outer surface. Journal of Applied Microbiology, 109(4), 1117-1131. doi: 10.1111/j.1365-2672.2010.04756.x
Wang, J., Rahman, S., Zhao, X. H., Forghani, F., Park, M. S., & Oh, D. H. (2013). Predictive models for the growth kinetics of Listeria monocytogenes on white Ccbbage. Journal of Food Safety.
Velani, S., & Roberts, D. (1991). Listeria monocytogenes and other Listeria spp. in prepacked mixed salads and individual salad ingredients. PHLS Microbiology Digest, 8(1), 21-22.
Vercammen, D., Van Derlinden, E., Logist, F., & Van Impe, J. J., (2013). Developing next-generation predictive models: Systems biology approach. Advances in Food
Process Engineering Research and Applications. Food Engineering Series 2013, pp. 547-565, Springer.
Warning, A., & Datta, A. K. (2013). Interdisciplinary engineering approaches to study how pathogenic bacteria interact with fresh produce. Journal of Food
Engineering, 114(4), 426-448. doi: http://dx.doi.org/10.1016/j.jfoodeng.2012.09.004
Warriner, K., Huber, A., Namvar, A., Fan, W., & Dunfield, K. (2009). Recent advances in the microbial safety of fresh fruits and vegetables. Advances in Food and
Nutrition Research, 57, 155-208.
Warriner, K., & Namvar, A. (2009). What is the hysteria with Listeria? Trends in Food
Science & Technology, 20(6), 245-254.
Whipps, J., Hand, P., Pink, D., & Bending, G. D. (2008). Phyllosphere microbiology with special reference to diversity and plant genotype. Journal of Applied
Microbiology, 105(6), 1744-1755.
World Health Organization/Food and Agriculture Organization (WHO/FAO), (2008). Microbial hazards in fresh leafy vegetables and herbs, Microbial risk assessment series, Meeting report. http://www.who.int/foodsafety/publications/micro/MRA_14_JEMRA.pdf
Wu, X. (2010). Development of a quantitative microbial risk assessment model for foodborne E. coli 0157:H7 infection: the risk of consuming lettuce. Master`s thesis, the University of Waterloo Waterlo, Ontario, Canada. https://uwspace.uwaterloo.ca/bitstream/10012/5113/1/Wu_Xiaofeng.pdf
Zhang, S., & Farber, J. (1996). The effects of various disinfectants against Listeria
monocytogenes on fresh-cut vegetables. Food Microbiology, 13(4), 311-321.
124
Zhuang, R., Beuchat, L., & Angulo, F. (1995). Fate of Salmonella montevideo on and in raw tomatoes as affected by temperature and treatment with chlorine. Applied
and Environmental Microbiology, 61(6), 2127-2131.
Zimmermann, M., Miorelli, S., Massaguer, P. R., & Falcão Aragão, G. M. (2011). Modeling the influence of water activity and ascospore age on the growth of Neosartorya fischeri in pineapple juice. LWT-Food Science and Technology,
44(1), 239-243.

125
APPENDIX
Figure A.1. The observed growth of Listeria monocytogenes depend on the initial concentration of total mesophilic bacteria on fresh baby spinach leaves at 5oC by fitting Baranyi model (Eq. 2.4).

126
Figure A.2. The observed growth of Listeria innocua depend on the initial concentration of total mesophilic bacteria on fresh baby spinach leaves at 5oC by fitting Baranyi model (Eq. 2.4).

127
Figure A.3. The observed growth of Listeria monocytogenes depend on the initial concentration of total mesophilic bacteria on fresh baby spinach leaves at 10oC by fitting Baranyi model (Eq. 2.4).

128
Figure A.4. The observed growth of Listeria innocua depend on the initial concentration of total mesophilic bacteria on fresh baby spinach leaves at 10oC by fitting Baranyi model (Eq. 2.4).

129
Figure A.5. The observed growth of Listeria monocytogenes depend on the initial concentration of total mesophilic bacteria on fresh baby spinach leaves at 20oC by fitting Baranyi model (Eq. 2.4).

130
Figure A.6. The observed growth of Listeria innocua depend on the initial concentration of total mesophilic bacteria on fresh baby spinach leaves at 20oC by fitting Baranyi model (Eq. 2.4).
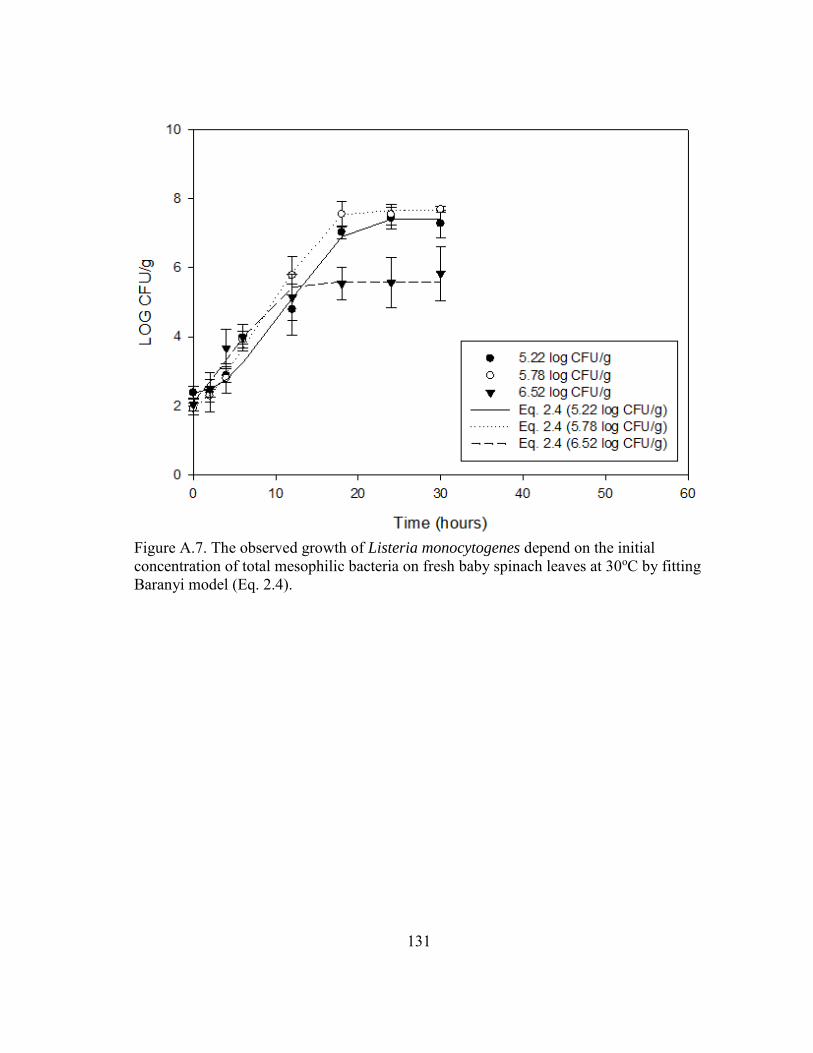
131
Figure A.7. The observed growth of Listeria monocytogenes depend on the initial concentration of total mesophilic bacteria on fresh baby spinach leaves at 30oC by fitting Baranyi model (Eq. 2.4).
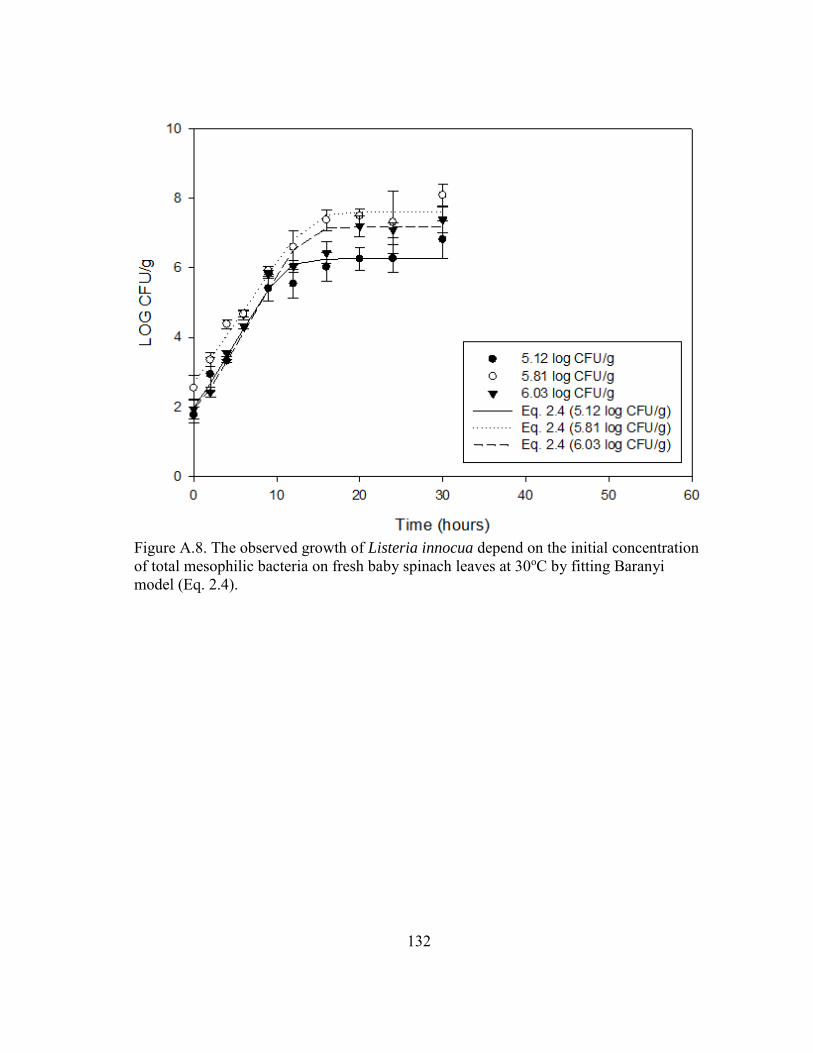
132
Figure A.8. The observed growth of Listeria innocua depend on the initial concentration of total mesophilic bacteria on fresh baby spinach leaves at 30oC by fitting Baranyi model (Eq. 2.4).

133
Figure A.9. The observed growth of Listeria monocytogenes depend on the initial concentration of total mesophilic bacteria on fresh baby spinach leaves at 36oC by fitting Baranyi model (Eq. 2.4).

134
Figure A.10. The observed growth of Listeria innocua depend on the initial concentration of total mesophilic bacteria on fresh baby spinach leaves at 36oC by fitting Baranyi model (Eq. 2.4).

135
Figure A.11. The observed growth of Listeria monocytogenes and Listeria innocua on fresh baby spinach leaves at 5oC by fitting Baranyi model (Eq. 2.4).
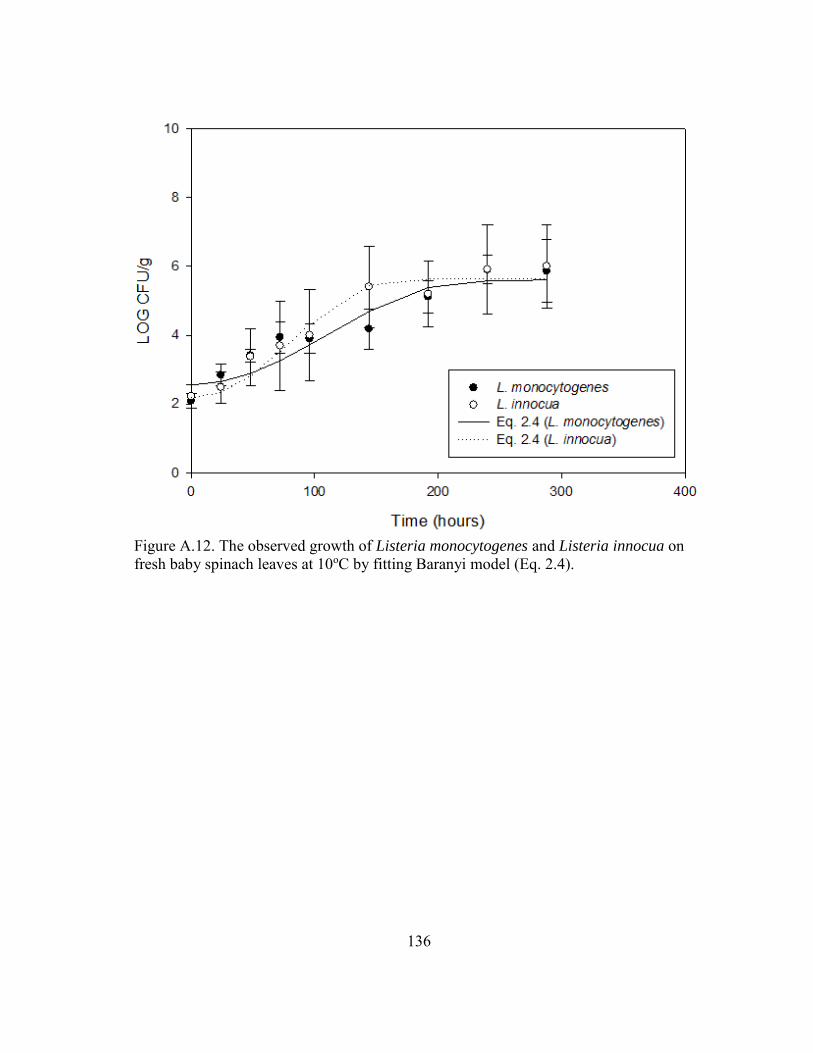
136
Figure A.12. The observed growth of Listeria monocytogenes and Listeria innocua on fresh baby spinach leaves at 10oC by fitting Baranyi model (Eq. 2.4).

137
Figure A.13. The observed growth of Listeria monocytogenes and Listeria innocua on fresh baby spinach leaves at 20oC by fitting Baranyi model (Eq. 2.4).
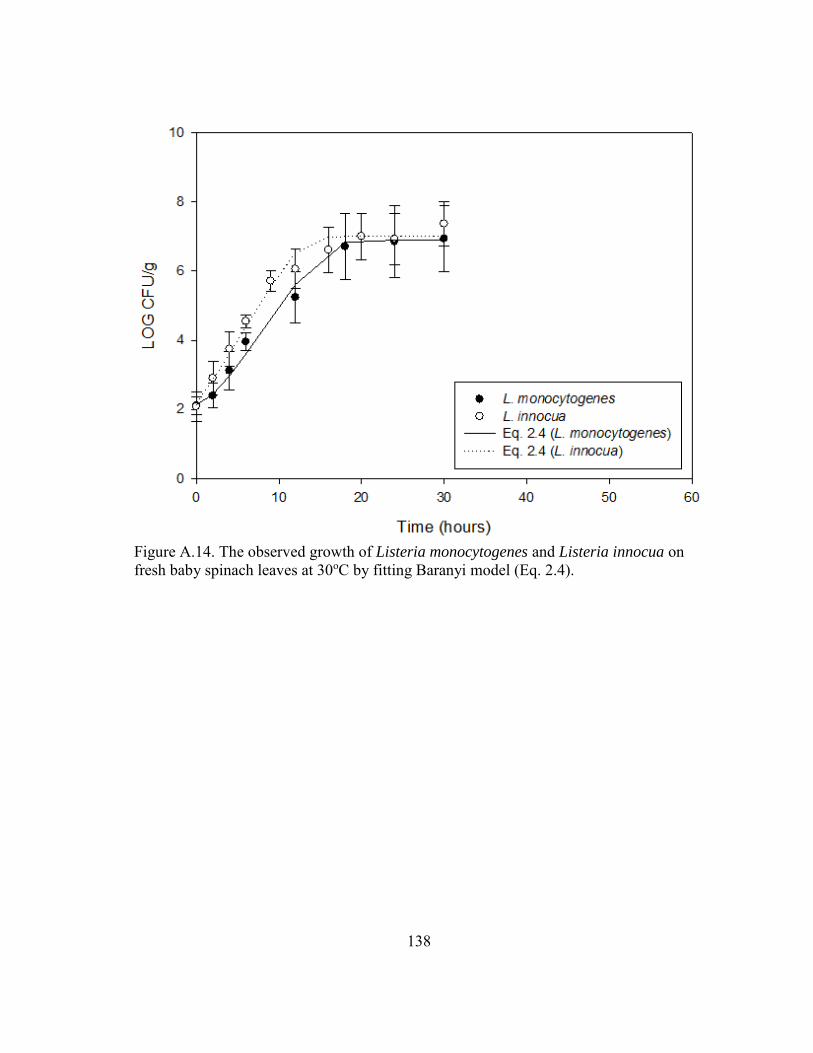
138
Figure A.14. The observed growth of Listeria monocytogenes and Listeria innocua on fresh baby spinach leaves at 30oC by fitting Baranyi model (Eq. 2.4).

139
Figure A.15. The observed growth of Listeria monocytogenes and Listeria innocua on fresh baby spinach leaves at 36oC by fitting Baranyi model (Eq. 2.4).

140
Figure A.16. Maximum growth rate for Listeria monocytogenes on fresh baby spinach leaves as a function of temperature.

141
Figure A.17. Maximum growth rate for Listeria innocua on fresh baby spinach leaves as a function of temperature.

142
Figure A.18. Lag time for Listeria monocytogenes on fresh baby spinach leaves as a function of temperature.

143
Figure A.19. Lag time for Listeria innocua on fresh baby spinach leaves as a function of temperature.
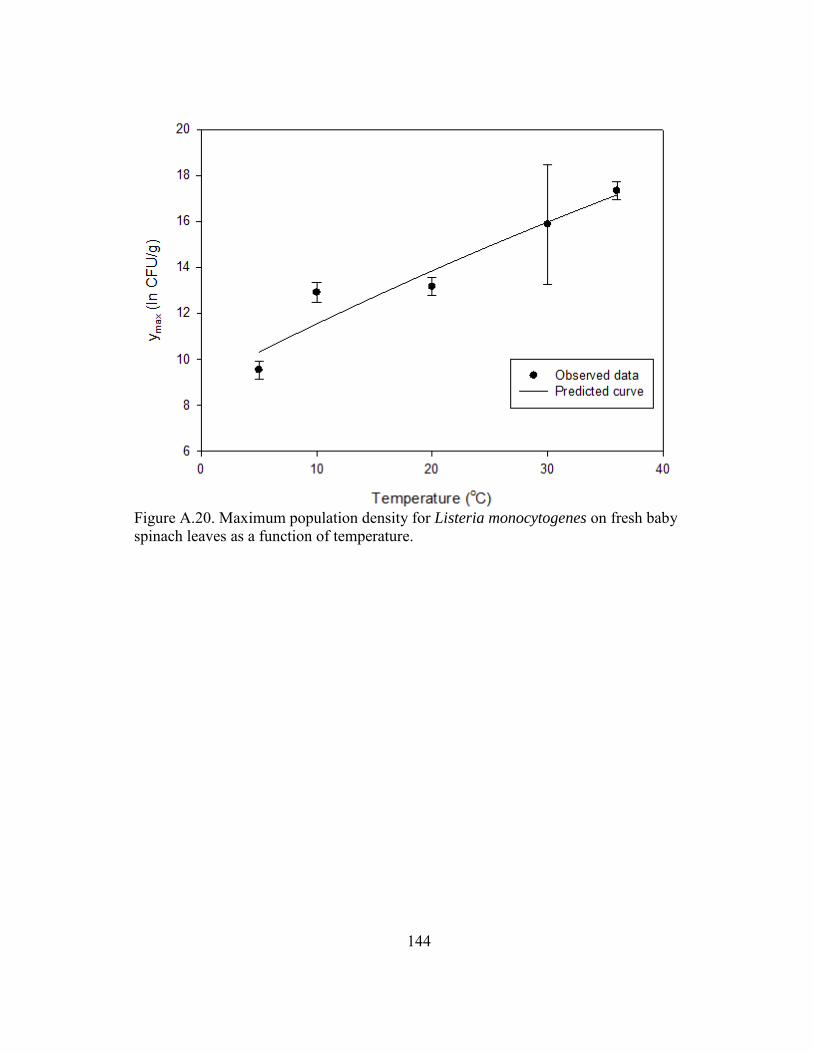
144
Figure A.20. Maximum population density for Listeria monocytogenes on fresh baby spinach leaves as a function of temperature.
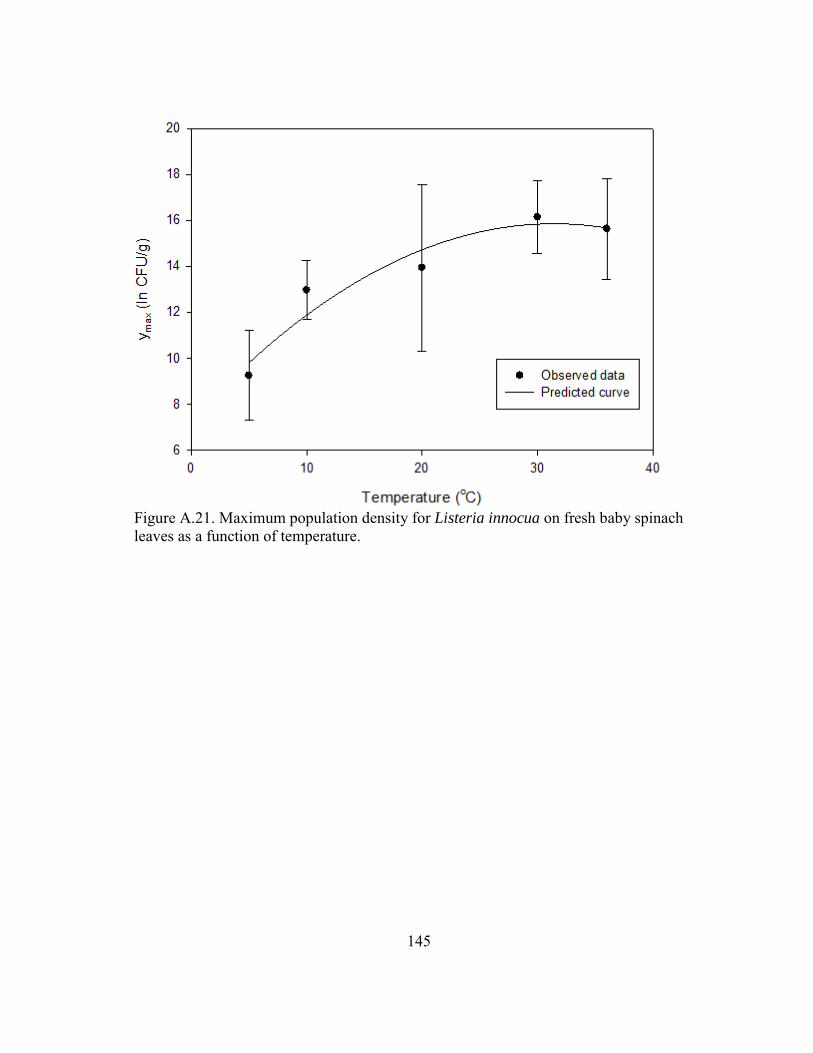
145
Figure A.21. Maximum population density for Listeria innocua on fresh baby spinach leaves as a function of temperature.

146
Figure A.22. The change of concentration of Listeria monocytogenes from farm to table (low initial concentration).

147
Figure A.23. The change of concentration of Listeria monocytogenes from farm to table (high initial concentration).

148
Figure A.24. Probability distribution of the prevalence of Listeria monocytogenes on fresh baby spinach leaves.

149
Figure A.25. Probability distribution of the initial concentration of Listeria
monocytogenes on fresh baby spinach leaves.
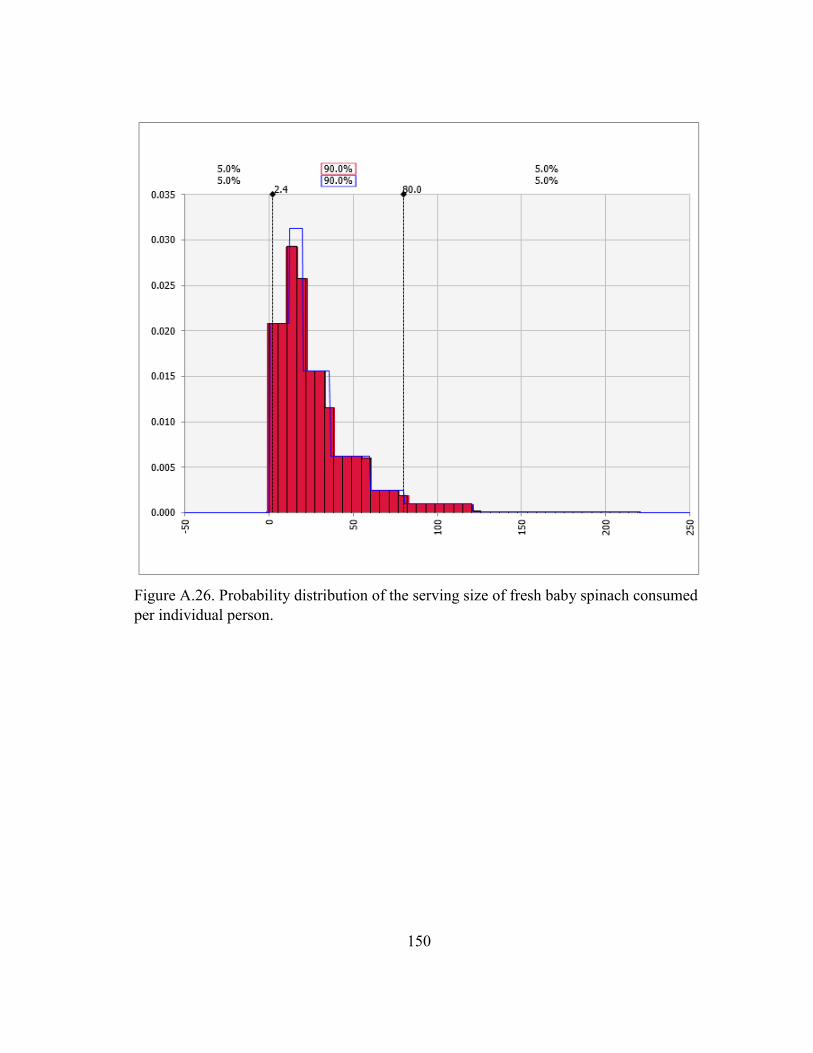
150
Figure A.26. Probability distribution of the serving size of fresh baby spinach consumed per individual person.

151
Figure A.27. Probability of infection vs. ingested dose of Listeria monocytogenes on fresh baby spinach leaves.
#1: Baseline
#2: Baseline + Irradiation
#3: Baseline + Cross contamination
#4: Baseline + Cross Contamination + Irradiation
#5: Baseline + Cross contamination + MAP (O2 (100%)) + Irradiation
#6: Baseline + Cross contamination + MAP (N2O2 (1:1)) + Irradiation
#7: Baseline +Temperature abuse (21oC, 2 hr) at the table
#8: Baseline + Temperature abuse (25oC, 4 hr) the transportation step

152
Table A.1 Overview of simulation variables and parameters.
Cell Unit Variable Value Source
G4 Percent Prevalence of contamination
spinach RiskCumul(E4,F4,J4:J16,I4:I16) Table 4.1
G5 Log CFU/g
Initial
Concentrations
RiskCumul(-1.4,4,{-1,0,1,2,3},{0.77,0.82,0.86,0.95,1})
Carrasco et al. (2010)
G6 Washing log
Reductions
G7 Log CFU/g Water RiskNormal(0.54,0.16)
G8 Log CFU/g Chlorine RiskNormal(0.42,0.22)
G9 Log CFU/g Cross Contamination RiskUniform(2.12,7.43) Ding et al.
(2013)
G10 Log CFU/g
Pathogen concentration after washing treatments
RiskOutput()+G5-G7-G8+G9
G11 kGy Irradiation Dose
G12 CFU/g Pathogen
concentration after irradiation
G13 Log CFU/g
Pathogen concentration after
disinfection treatments
RiskOutput()+G10
G14 LN CFU/g
Pathogen concentration after
disinfection treatments
RiskOutput()+(G10*LN(10))
G15 Transportation and
Retail Storage
G16 hours Transportation time RiskUniform(4,10) Ding et al. (2013)
G17 oC Temp, retail RiskExtvalue(4.9495,2.8227) Danyluk and Schaffner (2011)
G18 hours Time, retail RiskUniform(96,168) Danyluk and Schaffner (2011)
G19 hours Total time RiskUniform(G16,G18)

153
Table A.1 Overview of simulation variables and parameters (continued) (This part was modified from Danyluk and Schaffner (2010))
Cell Unit Variable Value Source
A20 Home storage
A21 oC Temp, home, mean 4.06
A22 oC Temp, difference from mean RiskExpon(2.31)
A23 oC Temp, above or below mean RiskBinomial(1,0.5)
A24 oC Home temp used RiskOutput()+IF(G23=1,G21+G22,G21-G22)
A25 oC Temperature for used RiskUniform(G24,G17)
A26 hours Min. time to first 27.12
A27 hours Max. time to first 68.16
A28 hours Min. time to first from farm to home RiskOutput()+(G19+G26)
A29 hours Max. time to first from farm to home RiskOutput()+G27+G19
A30 hours Time to first from farm to home RiskWeibull(G28,G29)
A31 hours Min. time to last 41.52
A32 hours Max. time to last 191.04
A33 hours Min. time to last from farm to home RiskOutput()+(G31+G19)
A34 hours Max. time to last from farm to home RiskOutput()+(G32+G19)
A35 hours Time to last RiskWeibull(G33,G34)
A36 hours Time to used if first is after last RiskOutput()+IF(G30>G35,G30,0)
A37 hours Time from uniform ditribution RiskUniform(G30,G35)
A38 hours Time selected for consumption RiskOutput()+IF(G36=0,G37,G36)

154
Table A.1 Overview of simulation variables and parameters (continued)
Cell Unit Variable Value Source
G39 Growth
G40 µmax b parameter 0.02645
G41 oC µmax Tmin parameter -4.26
G42 1/hours µmax RiskOutput()+((G40*(G25-G41))^2)
G43 tlag c parameters 0.0099
G44 tlag Tmin parameter -4.26
G45 hours tlag RiskOutput()+((G43*(G25-G44))^(-2))
G46 F(t) RiskOutput()+(G38+((1/G42)*LN((EXP(-
G42*G38))+(EXP(-G45*G42))-(EXP((-G42*G38)-(G42*G45))))))
G47 ymax A1 parameters -0.0009
G48 ymax A2 parameters 0.2592
G49 ymax A3 parameters 9.0512
G50 LN CFU/g ymax RiskOutput()+(((G47*(G25^2))+(G48*G25)+(G49)))
G51 Log CFU/g ymax RiskOutput()+(G50/LN(10))
G52 LN CFU/g y(t) RiskOutput()+((G14)+((G42*G46))-
(LN(1+(((EXP(G42*G46))-1)/(EXP(G50-(G14)))))))
G53 Log CFU/g y(t) RiskOutput()+(G52/LN(10))
G54 Log CFU/g
Limit level of if
>ymax RiskOutput()+(IF(G53<G51,G53,G51))

155
Table A.1 Overview of simulation variables and parameters (continued).
Cell Unit Variables Value Source
G55 Serving and
dose-response
G56 g Serving size RiskCumul(0,220,H71:H76,J71:J76)
Hoelzer et al. (2012)
G57 CFU/g Level non Log RiskOutput()+10^(G54)
G58 Level per serving RiskOutput()+G57*G56
G59 r-value 1.91E-10 Tromp et al. (2010)
G60 Probability of illness
RiskOutput()+(1-(EXP(-G59*G58)))
G61 Probability of illness (exposure) RiskOutput()+(G60*G4)
G62 Log Probability of illness RiskOutput()+LOG(G61)
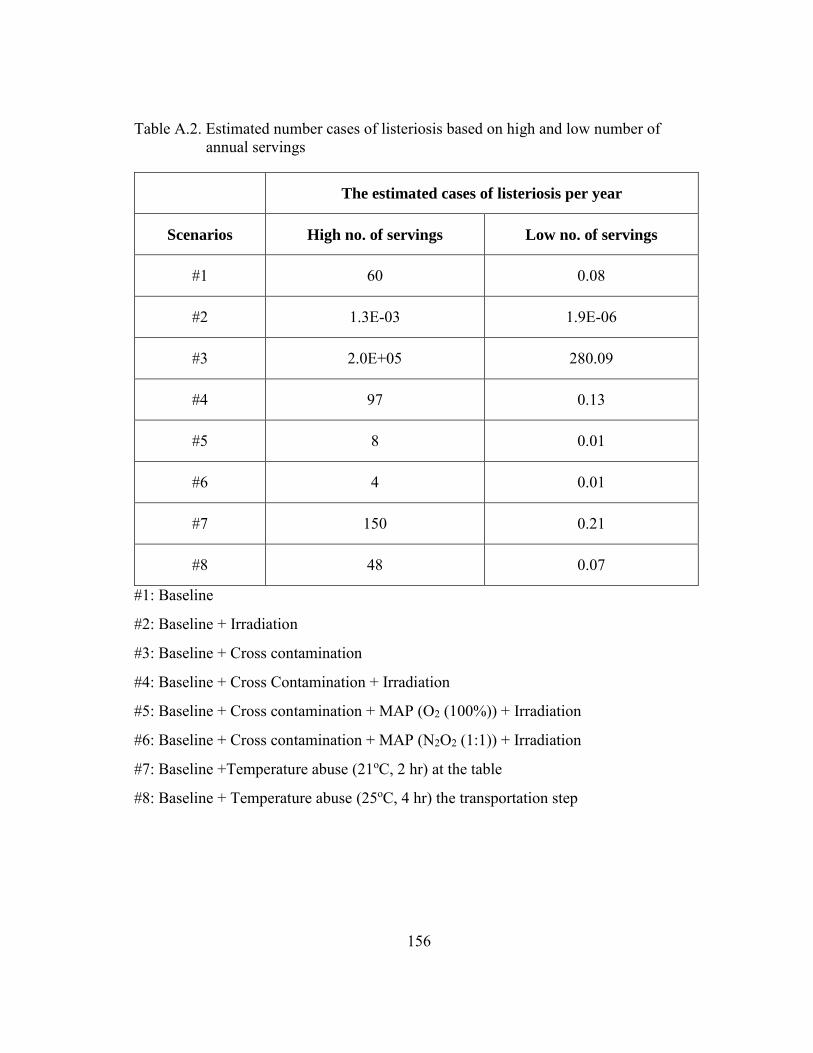
156
Table A.2. Estimated number cases of listeriosis based on high and low number of annual servings
The estimated cases of listeriosis per year
Scenarios High no. of servings Low no. of servings
#1 60 0.08
#2 1.3E-03 1.9E-06
#3 2.0E+05 280.09
#4 97 0.13
#5 8 0.01
#6 4 0.01
#7 150 0.21
#8 48 0.07
#1: Baseline
#2: Baseline + Irradiation
#3: Baseline + Cross contamination
#4: Baseline + Cross Contamination + Irradiation
#5: Baseline + Cross contamination + MAP (O2 (100%)) + Irradiation
#6: Baseline + Cross contamination + MAP (N2O2 (1:1)) + Irradiation
#7: Baseline +Temperature abuse (21oC, 2 hr) at the table
#8: Baseline + Temperature abuse (25oC, 4 hr) the transportation step