OM-Operations Strat& Comp
24
Operations Strategy & Competitiveness Case Study 2 (Air Deccan)
-
Upload
rohan-chopde -
Category
Documents
-
view
541 -
download
0
Transcript of OM-Operations Strat& Comp

Operations Strategy & Competitiveness
Case Study 2 (Air Deccan)
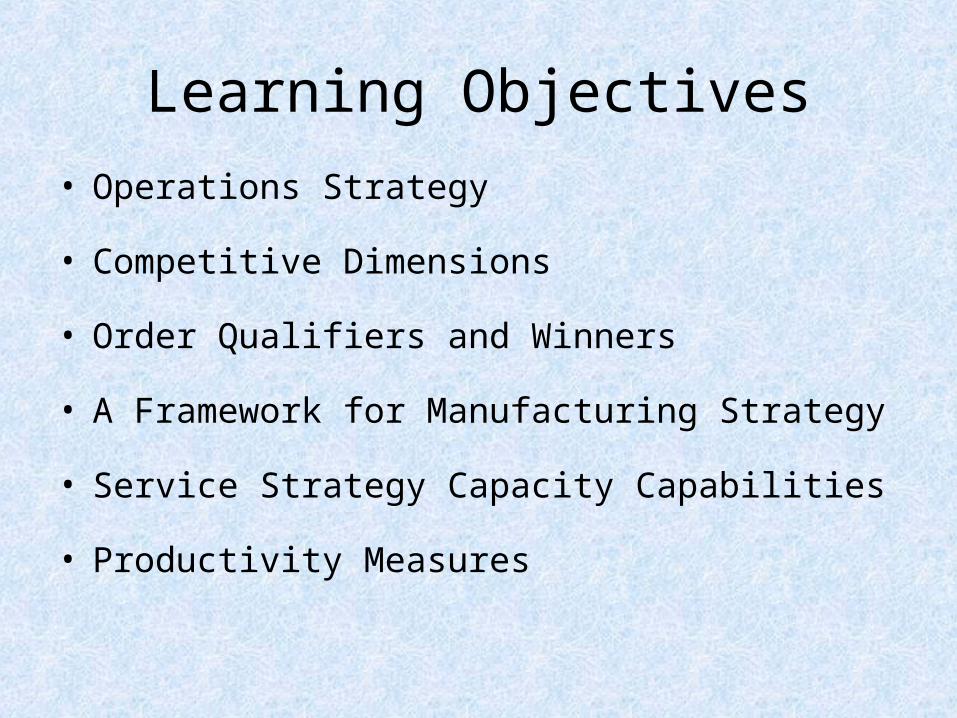
Learning Objectives• Operations Strategy
• Competitive Dimensions
• Order Qualifiers and Winners
• A Framework for Manufacturing Strategy
• Service Strategy Capacity Capabilities
• Productivity Measures

Operations Strategy
• Operations Strategy is: -- The approach, consistent with setting broad policies and plans for using the resources of a firm to best support its long-term competitive strategy. – The total pattern of decisions which shape the long term capabilities of an operations and their contribution to overall strategy (Slack & Lewis).

Competitive Dimensions
• Cost or Price – “Make the Product & Deliver the Service Cheap”• Product Quality and Reliability – “Make a Great Product & Deliver a Great Service”• Delivery Speed – “Make the Product & Deliver the Service Quickly”• Delivery Reliability – “Deliver It When Promised”

Competitive Dimensions
• Coping with Changes in Demand
– “Change Its Volume”
• Flexibility and New Product Introduction Speed
– “Change It”
• Other Product-Specific Criteria
– “Support it”

Dealing with Trade-offs

Order Winners & Qualifiers : A Market Requirement Perspective – Terry Hill
• Order qualifiers:
- Characteristics that customers perceive as minimum standards of acceptability to be considered as a potential purchase
• Order winners: - Characteristics of an organization’s goods or services that cause it to be perceived as better than the competition

Typical Order Qualifiers/Winners
• Price (Cost)• Design• Quality• Delivery speed• Delivery reliability• Demand flexibility
• Product/service range• Colours/patterns• Economy of use• Design leadership• Technical support• After sales service

Corporate Strategy Design Process-Robert Kaplan & David Norton
Strategy Map What it is about!
Financial Perspective
Customer Perspective
Internal Perspective
Learning & Growth Perspective
Improve Shareholder Value
A Motivated & Prepared Workforce
Build-Increase-Achieve
Customer Value Proposition

Kaplan and Norton’s Generic Strategy Map
• The Financial Perspective - Under this the two Basic Strategies for driving financial
performance are; -- Revenue Growth & -- Productivity
The revenue growth strategy is made up of two components: 1. Build the franchise : Develop new sources of revenue from new markets. 2. Increase Customer Value : Work with existing customer to expand relationships with company.

Kaplan and Norton’s Generic Strategy Map (Continued…)
The productivity strategy is made up of two components:
1. Improve cost structure : Lower direct and indirect costs, share common resources with other business units.
2. Improve asset utilization : Reduce working and fixed capital.

Kaplan and Norton’s Generic Strategy Map (Continued…)
• The Customer Perspective - There are three ways suggested as means of
differentiating a company from others in a marketplace:
1. Product Leadership 2. Customer Intimacy 3. Operational Excellence

Kaplan and Norton’s Generic Strategy Map (Continued…)
• The Internal Perspective - It defines the business processes and the specific
activities the organization must master to support the customer value proposition. It has following four perspectives:
1. Build the franchise (innovation processes) 2. Increase customer value (customer management
process) 3. Achieve operational excellence (operational processes) 4. Be a good corporate citizen (regulatory and
environmental processes)

Kaplan and Norton’s Generic Strategy Map (Continued…)
• The Learning and Growth Perspective - It defines the intangible assets needed to enable
activities and customer relationships to be conducted at high level of performance. They are;
1. Strategic competencies 2. Strategic technologies 3. Climate for action

Operations Strategy FrameworkCustomer needs
New Product Current Products
Competitive dimensions & requirements
Quality, Price, Dependability, Speed, Flexibility
Enterprise capability
Operations & Supplier capabilitiesR & D SystemsTechnology DistributionPeople
Support PlatformsFinancial management Human resource management Information management

Steps in Developing a Manufacturing Strategy• Objectives:-- to translate required competitive dimensions (obtained from
marketing) into specific performance requirements for operations, and
-- to make the plans necessary to ensure that operations (and enterprise) capabilities are sufficient to accomplish them.
• Steps: 1. Segment the market according to the product group 2. Identify product requirements, demand patterns, and profit
margins of each group 3. Determine order qualifiers and winners for each group 4. Convert order winners into specific performance
requirements

Service Strategy Capacity Capabilities
• Process-based – Capacities that transforms material or information
and provide advantages on dimensions of cost and quality
• Systems-based – Capacities that are broad-based involving the
entire operating system and provide advantages of short lead times and customize on demand
• Organization-based– Capacities that are difficult to replicate and
provide abilities to master new technologies

Strategy to deal with trade-off
• Plant-within-a-Plant (PWP) -- A concept in which different locations within a
facility are dedicated to different product lines, each operating with its own strategy to optimize cost and efficiency.
• Straddling -- Occurs when a company seeks to match what
a competitor is doing by adding new features, services, or technologies to existing activities.

Productivity as a Measure of Competitiveness
• Competitiveness - degree to which a nation can produce goods and services that
meet the test of international markets
• Productivity - ratio of output to input
• Output - sales made, products produced, customers served, meals
delivered, or calls answered
• Input - labor hours, investment in equipment, material usage, or square
footage

Productivity Measures
• Single factor (or partial) Productivity or or or
• Multifactor Productivity or • Total factor Productivity or
Output------------Capital
Output------------Materials
Output------------Energy
Output------------Labour
Output ---------------------------------Labour + Capital + Energy
Output------------------------------------Labour + Capital + Materials
Output-----------
Input
Goods & Services produced------------------------------------
All inputs used

Example 1:Productivity Measurement
• You have just determined that your service employees have used a total of 2400 hours of labor this week to process 560 insurance forms. Last week the same crew used only 2000 hours of labor to process 480 forms.
• Which productivity measure should be used?
• Is productivity increasing or decreasing?
• By what percent?

Example 2• A US manufacturing company operating a subsidiary in an LDC
(less developed country) shows the following results: US LDC Sales (units) 100,000 20,000 Labour (hours) 20,000 15,000 Raw material (currency) $20,000 FC 20,000 Capital equipment (hours) 60,000 5,000a) Calculate partial labour and capital productivity figures for the
parent and subsidiary. Do the results seem misleading?b) Compute the multifactor productivity figures for labour and
capital together. Are the results better?c) Calculate raw material productivity figures (units/Re where
Re.1 = FC 10). Explain why these figures might be greater in the subsidiary.

Example 3
• A retail store had sales of Rs. 45,000 in April and Rs. 56,000 in May. The store employs eight full-time workers who work 40-hour per week. In April the store had seven part-time workers at 10 hours/week, and in May the store had nine part-timers at 15 hours/week (assume four weeks in each month). Using sales value as the measure of output, what is the percentage change in productivity from April to May?

Example 4
• A fast-food restaurant serves hamburgers, cheeseburgers, and chicken sandwiches. The restaurant counts a cheese-burger as equivalent to 1.25 hamburgers and chicken sandwiches as 0.8 hamburger. Current employment is five full-time employees who work a 40-hour week. If the restaurant sold 700 hamburgers, 900 cheeseburgers, and 500 chicken sandwiches in one week, what is its productivity? What would its productivity have been if it had sold the same number of sandwiches (2,100) but the mix was 700 of each type?