
ACILITIES ANAGEMENT AND AINTENANCE - NewSchools Venture Fund: A

Olympia School District Capital F acilities Plan
2017-2022
August 1, 2016

Executive Summary
The Olympia School District's 2017-2022 Capital Facilities Plan (CFP) has been prepared as thedistrict's principal six-year facility planning document in compliance with the requirements of theWashington State Growth Management Act. This plan is developed based on the district’s recentlong range facilities master plan work, which looked at conditions of district facilities, projectedenrollment growth, utilization of current schools and the capacity of the district to meet these needsfrom 2010 to 2025. This report is the result of a volunteer Facilities Advisory Committee (FAC) whoworked with the district and a consulting team for nearly six months. In addition to this CFP and the 2011 master plan and the updates that are underway, the district may prepare other facilityplanning documents, consistent with board policies, to consider other needs of the district as may berequired.
This CFP consists of four elements: 1. An inventory of existing capital facilities owned by the Olympia School District including the
location and student capacity of each facility.
2. A forecast of future needs comparing student enrollment projections against permanent facilitystudent capacities. The basis of the enrollment forecast was developed by demographer Dr.W. Les Kendrick. An updated student generation rate for this plan and to calculate the impactfee was developed by demographer Michael McCormick.
3. The proposed locations and capacities of new and expanded facilities anticipated to be constructed or remodeled over the next six years and beyond.
4. A financing plan for the new and expanded facilities anticipated to be constructed over thenext six years. This plan outlines the source of funding for these projects including state revenues, local bond revenue, local levy revenue, impact fees, mitigation fees, and other revenues.
5. This CFP contains updates to plans that address how the district will respond to state policiesto reduce class size. The Legislature has recently enacted legislation that targets class sizereduction by the 2017-18 school year (SY), the Supreme Court has mandated implementationof this legislation, and an initiative of the people (I-1351) was enacted, significantly impactingschool housing needs. All three of these efforts/entities have included conversion of half-daykindergarten to full-day kindergarten as a high priority.
The 2011 Master Plan and updates contain multiple projects to expand the district’s facility capacityand major modernizations. Specifically the plan included major modernizations for Garfield (withexpanded capacity), Centennial, McLane, and Roosevelt Elementary Schools; limited modernizationfor Jefferson Middle School; and modernizations for Capital High School. The plan called for theconstruction of a new building, with expanded capacity, for the Olympia Regional Learning Academy.The plan called for the construction of a new elementary/intermediate school (serving grades 5-8) onthe east side of the district. In the 2015 Master Plan update to the 2011 Master Plan, this newintermediate school project will not move forward. The district will expand capacity at five elementaryschools via mini-buildings of permanent construction consisting of 10 classrooms each. In addition, in order to nearly double Avanti High School enrollment, Avanti is scheduled to expand to use theentire Knox building; the administration would move to a different building. At Olympia High School, the district would reduce reliance on 10 portables by building a new permanent building ofabout 22 classrooms. Finally, the plan includes a substantial investment in systems modernizationsand major repairs at facilities across the district.

This 2017-202 Capital Facilities Plan (CFP) is intended to guide the district in providing new capitalfacilities to serve projected increases in student enrollment as well as assisting the district to identifythe need and time frame for significant facility repair and modernization projects. The CFP will bereviewed on an annual basis and revised accordingly based on the updated enrollment and projectfinancing information available.

Capital Facilities Plan 2017-2022
Olympia School District August 1, 2017
Executive Summary
Table of Contents
I. School Capacity, Methodology and Levels of Service 1
Table A: Elementary School Capacities 5
Table B: Middle and High School Capacities 6
Olympia School District Building Locations 7
II. Forecast of Future Facility Needs 8
Enrollment Trends 9
Final Forecasts by Grade 11
Graph A: Low, Medium, and High Range Forecast (2015-2013) 12
Table C: 10-Year Enrollment Forecast by Grade Level 13
Chart 1: Elementary Enrollment Changes (Low, Medium, and High) 13
Chart 2: Middle School Enrollment Changes (Low, Medium, and High) 14
Chart 3: High School Enrollment Changes (Low, Medium, and High) 15
Table D: Projection Summary by School (October Headcount 2015-2030) 16
Student Generation Rates Used in Forecasts and Impact Fees 17
Class Size Reduction Assumptions 18
Table E: State Funded Class Size Reduction 18
Need for New Classrooms 19
Chart 4: Seating Capacity by Year – Elementary
Chart 5: Seating Capacity by Year – Middle School 21
Chart 6: Seating Capacity by Year – High School 22
III. Six-Year Planning and Construction Plan 23
History and Background 23
1
20

24 26
Overview of 2015 Facilities Advisory Committee Phase II Master Plan Update Recommendations Class Size Reduction Planning
Table F: Analysis of Portables, New Buildings, and Mini-Buildings 27
Table G: Westside Observations 28
Table H: Eastside Observations 28
Table I: Classroom Construction Recommendations 29
Utilization of Portables as Necessary 36
Table J: Capital Facilities Plan Considerations
IV. Finance Plan 38
Impact Fees 38
Table K: History of Impact Fees 40
State Assistance 40
Bond Revenue 40
Capital Fund Balance 41
Table L: Preliminary Revenue Estimates 41
V. Appendix A: Inventory of Unused District Property 43
Appendix B: Detail of Capital Facilities Projects 44
Appendix C: Impact Fee Calculations 48
Resolution 542 49
Determination of Nonsignificance 51
Environmental Checklist 52
36
I. School Capacity, Methodology and Levels of Service
The primary function of calculating school capacities is to allow observations and comparisons ofthe amount of space in schools across the Olympia School District (OSD) and plan for growth inthe number of students anticipated at each school. This information is used to make decisions on issues such as locations of specialty program offerings, enrollment boundaries, portable classroom units, new construction and the like.
School capacities are a general function of the number of classroom spaces, the number ofstudents assigned to each classroom, how often classrooms are used, and the extent of supportfacilities available for students, staff, parents and the community. The first two parameterslisted above provide a relatively straightforward calculation, the third parameter listed is relevantonly to middle and high schools, and the fourth parameter is often a more general series of checksand balances.
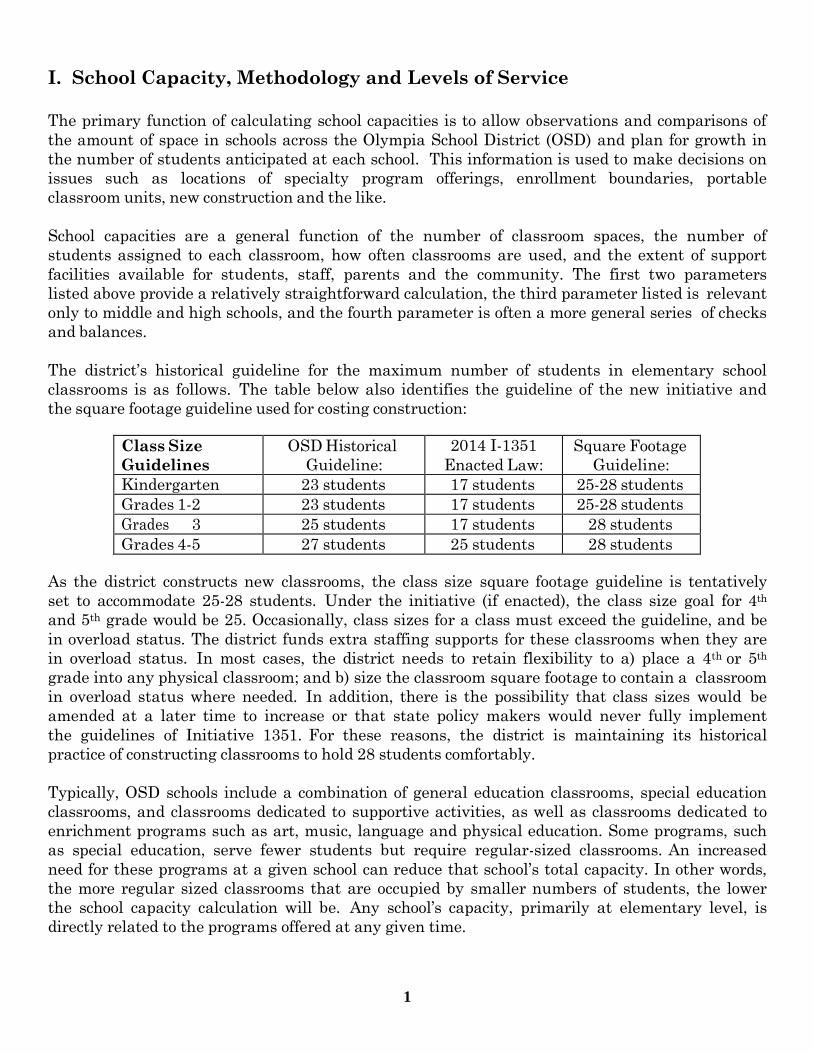
The district’s historical guideline for the maximum number of students in elementary schoolclassrooms is as follows. The table below also identifies the guideline of the new initiative andthe square footage guideline used for costing construction:
Class Size Guidelines
OSD Historical Guideline:
2014 I-1351 Enacted Law:
Square FootageGuideline:
Kindergarten 23 students 17 students 25-28 students Grades 1-2 23 students 17 students 25-28 students Grades 3 25 students 17 students 28 students Grades 4-5 27 students 25 students 28 students
As the district constructs new classrooms, the class size square footage guideline is tentativelyset to accommodate 25-28 students. Under the initiative (if enacted), the class size goal for 4th
and 5th grade would be 25. Occasionally, class sizes for a class must exceed the guideline, and bein overload status. The district funds extra staffing supports for these classrooms when they arein overload status. In most cases, the district needs to retain flexibility to a) place a 4th or 5th
grade into any physical classroom; and b) size the classroom square footage to contain a classroomin overload status where needed. In addition, there is the possibility that class sizes would beamended at a later time to increase or that state policy makers would never fully implementthe guidelines of Initiative 1351. For these reasons, the district is maintaining its historicalpractice of constructing classrooms to hold 28 students comfortably.
Typically, OSD schools include a combination of general education classrooms, special educationclassrooms, and classrooms dedicated to supportive activities, as well as classrooms dedicated toenrichment programs such as art, music, language and physical education. Some programs, suchas special education, serve fewer students but require regular-sized classrooms. An increasedneed for these programs at a given school can reduce that school’s total capacity. In other words,the more regular sized classrooms that are occupied by smaller numbers of students, the lowerthe school capacity calculation will be. Any school’s capacity, primarily at elementary level, isdirectly related to the programs offered at any given time.
1
Special education classroom use at elementary level includes supporting the Infant/ToddlerPreschool Program, Integrated Kindergarten Program, DLC Program (Developmental LearningClassroom, which serves students with moderate cognitive delays), Life Skills Program (studentswith significant cognitive delays), LEAP Program (Learning to Engage, be Aware and PlayProgram for students with significant behavior disabilities) and the ASD Program (students withautism spectrum disorders.) At middle and/ or high level, special education classroom use includessupporting the DLC Program, Life Skills Program, HOPE Program (Help Our People Excel forstudents with significant behavior disabilities) and the ASD Program.
Classrooms dedicated to specific supportive activities include serving IEP’s (Individual Education Plan) OT/PT services (Occupational and Physical Therapy), speech and language services, ELL services (English Language Learner), PATS services (Program for Academically TalentedStudents), as well as non-specific academic support for struggling students (primarily Title I ofthe No Child Left Behind Act.)
Of note, the district has a practice of limiting school size to create appropriately-sized learningcommunities. The district has a practice of limiting elementary school size to 500 students;middle school size to 800 students; and high school size to 1,800 students. These limits representa guide, but not an absolute policy limit and in this CFP update the guideline is adjustedslightly. The district’s 2015 review and update of the 2011 Master Plan included the FAC’srecommendation that exceeding these sizes was desirable if the school still functioned well, andthat a guideline should be exceeded when it made sense to do so. Therefore the plans for futureenrollment growth are based on this advice and some schools are intended to grow past thesesizes.
Methodology for Calculating Building Capacity
Elementary SchoolsFor the purpose of creating an annual CFP, student capacity at individual elementary schools iscalculated by using each school’s current room assignments. (E.g. How many general educationclassrooms are being used, and what grade level is being taught? How many different specialeducation classrooms are being used? How many classrooms are dedicated to supportive activitieslike the PATS Program, ELL students, etc.?)
Throughout the district’s elementary schools, special programs are located according to a combination of criteria including the proximity of students who access these special programs,the efficiency of staffing resources, and available space in individual schools. Since the locationof special programs can shift from year to year, the student capacities can also grow or retractdepending on where the programs are housed. This fluctuation is captured in what is termed the“Program Capacity” of each school. That is to say that “Program Capacity” is calculated based onthe programs offered at a given school each year, instead of a simple accounting of the number ofclassroom spaces. (See Table A.)
2

Middle and High SchoolsCapacity at middle schools and high school levels are based on the number of “teaching stations”that include general-use classrooms and specialized spaces, such as music rooms, computerrooms, physical education space, industrial arts space, and special education and/or classroomsdedicated to supportive activities. In contrast to elementary schools, secondary students simultaneously occupy these spaces to receive instruction. As a result, the district measures thesecondary school level of service based on a desired average class size and the total number ofteaching stations per building. The capacities of each secondary school are shown on Table B.
Building capacity is also governed by a number of factors including guidelines for maximumclass size, student demands for specialized classrooms (which draw fewer students than theguidelines allow), scheduling conflicts for student programs, number of work stations in laboratory settings, and the need for teachers to have a work space during their planning period.Together these limitations affect the overall utilization rate for the district’s secondary schools.
This rate, in terms of a percentage, is applied to the number of teaching stations multiplied bythe average number of students per classroom in calculating the effective capacity of each building. The levels of service for both middle and high school equates to an average classloading of 28 students based upon an 80% utilization factor. The only exception is Avanti HighSchool, the district’s alternative high school program, which does not consist of any specializedclassroom space and has relatively small enrollment, so a full 100% utilization factor was used tocalculate this school’s capacity
The master plan includes estimates for both current and maximum utilization. In this CFP wehave used the current utilization capacity level because it represents the ideal OSD configurations of programs and services at this time. It is important to note that there is verylittle added capacity generated by employing the maximum utilization standard.
Level of Service Variables Several factors may impact the district’s standard Level of Service (LOS) in the future including program demands, state and federal funding, collective bargaining agreements, legislativeactions, and available local funding. These factors will be reviewed annually to determine ifadjustments to the district’s LOS were warranted. The district is experiencing growth in itsspecial education preschool population and is exploring opportunities to provide other additionalor expanded programs to students in grades K-12. This review may result in a change to the standard LOS in future Capital Facilities Plans.
Alternative LearningThe district hosts the Olympia Regional Learning Academy (ORLA), which serves students fromboth within and outside of the district’s boundaries. The program, which began in 2006, nowserves approximately 350 students. Each year since 2006 the program’s enrollment has increasedand the proportion of students from within the Olympia School District has increased. Therefore, over time, the program will have a growing positive impact on available capacity within traditional district schools. As more students from within district schools migrate to ORLA, they free up capacity to absorb projected growth.
3

The Olympia School District is also committed to serving as this regional hub for alternativeeducation and services to families for non-traditional education. The program is providing education via on-line learning, home-school connect (education for students that are home-schooled), and Montessori elementary education.
Finally, Olympia School District is committed to providing families with alternatives to thetraditional public education, and keeping up with the growing demand for these alternatives,and is committed to providing ORLA students and families with a safe facility conducive tolearning.
Elementary School Technology In capacity analyses, the district has assumed that current computer labs will be converted toclassrooms. The ease of use, price, and industry trend regarding mobile computing afford thedistrict the opportunity to eventually convert six classrooms/portables from a computer lab into aclassroom.
Preschool Facilities The district houses 10 special needs preschool classrooms across the district. Recently, the district has been leasing space from a church due to a lack of classroom space. The CFP addresses the need to house these classrooms in district facilities. The analysis of classroom space assumesthat if an elementary school currently houses a preschool classroom, that the school retains that preschool classroom. However, the Board of Directors will also consider an option to housepreschool in one or two centralized spaces.
4

Table AElementary School Capacities (Current Utilization Standard and Current Class Size)
Computer Labs Converted to Classroom Computer Labs Converted to Classroom
Preschool Room Converted to K-5 Preschool RetainedHC = -Headcount Oct HC2014-15 Permanent Portable Total Permanent Portable TotalElementary Schools
Boston Harbor 137 168 42 210 168 0 168
Brown, LP 294 339 0 339 339 0 339
Centennial 529 357 105 462 357 105 462
Garfield 320 441 16 457 399 16 415
Hansen 470 399 105 504 399 105 504
Lincoln 294 273 0 273 273 0 273
Madison 248 252 0 252 231 0 231
Mt Kenny 362 331 63 394 310 63 373
McLane 328 331 42 373 310 42 352
Pioneer 440 365 42 407 365 42 407
Rooseve It 420 386 0 386 386 0 386
Totals 3,342 3,642 415 4,057 3,537 373 3,910
West SideElementary Totals(BES,GES,HES, Mt LES) 1,706 1,783 163 1,946 1,720 163 1,333East SideElementary Totals|BHES,CES, LES, MES, Mt KES, PES, RES) 2,136 1,359 252 2,111 1,317 210 2,027
5

Table BMiddle and Highs School Capacities (Current Utilization Standard and CurrentClass Size)
6
Bui Iding Capacities with 2010-2011 Program Utilization
General Education
Building Capacities with 2010-2011 Program Utilization
Special Education
Building Capacities with 2010-2011 Program Utilization
Special Education
Building Capacities with 2010-2011 Program Utilization
Specific Supportive Activities
Education Program Pol icy • Max, Capcity
HC=HeadcountOctHC
2M4-15
Hof
classrooms
Perm,
Capacity
Sof
portables
Port,
Capacity
Total
Capacity
(including
Sof
classrooms
Perm,
Capacity
Sof
portables
Port.
Capacity
Total
Capacity
[including
Sof
classrooms
Perm,
Capcity
Sof
portables
Port,
Capcity
Total
Capcity
[including
Sof
classrooms
Perm.
Capcity
Sof
portables
Port,
Capcity
Gen Ed
Capcity
(including
Perm.
Capcity
Port,
Capacity
Total
Capcity
(including
portables) portables) portables) portables) portables)
Middle Schools
Jefferson 413 25 718 0 0 718 3 26 0 0 26 3 26 0 0 26 5 0 0 0 0 744 0 744
Marshall 384 23 660 0 0 660 1 10 0 0 10 1 10 0 0 10 3 0 0 0 0 670 0 670
Reeves 403 24 689 1 29 718 1 8 0 0 8 1 8 0 0 8 3 0 0 0 0 697 29 726
Washington 758 32 918 0 0 918 0 0 0 0 0 0 0 0 0 0 4 0 2 0 0 918 0 918
Totals 1,958 104 2,985 1 29 3,014 5 44 0 0 44 5 44 0 0 44 15 0 2 0 0 3,029 29 3,058
•Utilization Factorfor mid<ileschools=80%
General Education Special Education Special Education Specific Supportive Activities
HC=HeadcountOctHC
2M4-15
Hof
classrooms
Perm,
Capacity
Sof
portables
Port,
Capacity
Total
Capacity
(including
Sof
classrooms
Perm,
Capacity
Sof
portables
Port.
Capacity
Total
Capacity
[including
Sof
classrooms
Perm,
Capacity
Sof
portables
Port,
Capacity
Total
Capcity
[including
Sof
classrooms
Perm.
Capcity
Sof
portables
Port,
Capcity
Gen Ed
Capcity
(including
Perm.
Capcity
Port,
Capacity
Total
Capcity
(including
portables) portables) portables) portables) portables)
HighSchools
Avanti 156 7 201 0 0 201 0 0 0 0 0 0 0 0 0 0 0 0 0 0 0 201 0 201
Capital 1,344 63 1,808 2 57 1,866 1 6 0 0 6 1 6 0 0 6 5 0 0 0 0 1,814 57 1,872
Olympia 1,726 72 2,066 6 172 2,239 2 12 3 24 36 2 12 3 24 36 0 0 0 0 0 2,078 196 2,275
High School Totals 3,226 142 4,075 8 230 4,305 3 18 3 24 42 3 18 3 24 42 5 0 0 0 0 4,093 254 4,347
•Utilization Factorfor Avanti=10®
•Utilization Factorforcomp, high schools=8®

Olympia School District Building Locations
Elementary Schools
1. Boston Harbor
2. L.P. Brown
3. Centennial
4. Garfield
5. Hansen
6. Lincoln
7. Madison
8. McKenny
9. McLane
10. Pioneer
11. Roosevelt
Middle Schools
12. Jefferson
13. Marshall
14. Reeves
15. Washington
High Schools
16. Avanti
17. Capital
18. Olympia
Other Facilities
19. New Market Voc. Skills Center
20. Transportation
21. Support Service Center
22. John Rogers
23. Olympia Regional Learning Academy
7
I Forecast of Future Facility Needs: Olympia School District Enrollment Projections I.
Summary Prepared by Demographer, Dr. Les Kendrick1
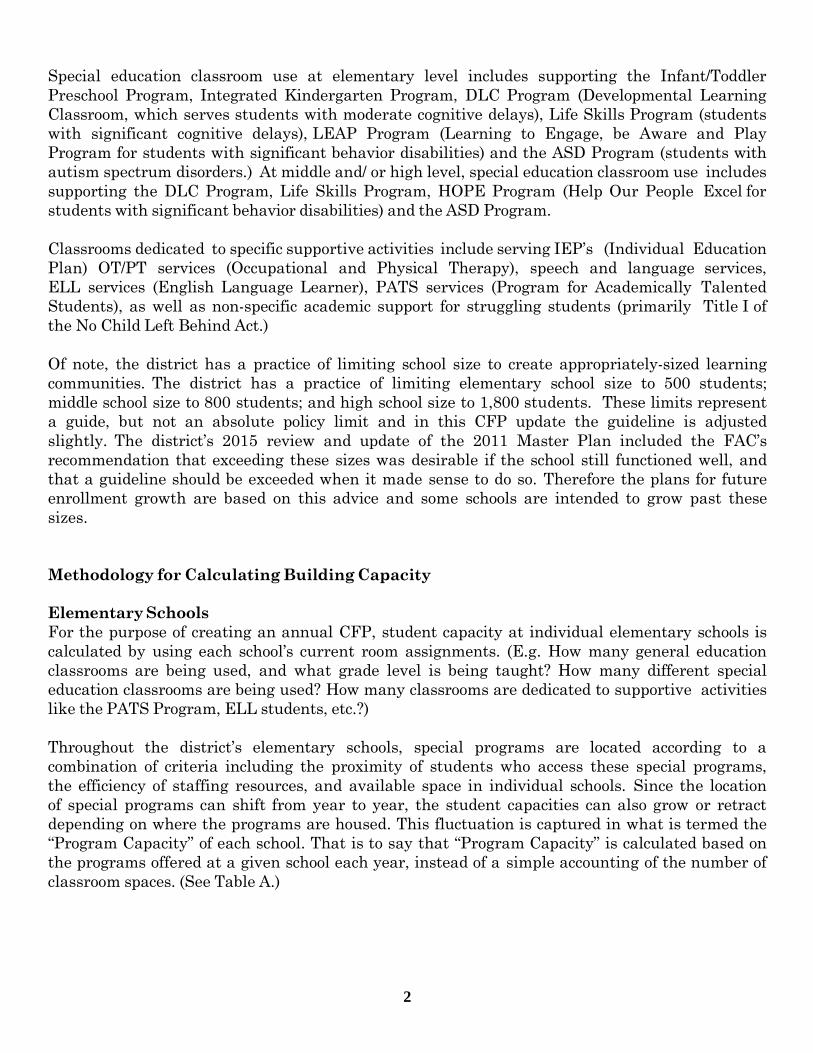
Enrollment in the Olympia School District has trended up over the past three years. This is in sharp contrast to the relatively flat enrollment trend that was in place for much of the past decade. Over the past three years we have seen improvements in the local and regional real estate market, and the entering kindergarten classes have been larger as the bigger birth cohorts from 2007 to 2009 have become eligible for school. These trends have contributed to the recent net gains in enrollment. The question is, will these trends continue or do we expect a return to a flat or declining pattern over the next decade?
In a report completed in 2011, a demographer predicted Olympia would begin to see a general upward trend in enrollment between 2011 and 2025, due to larger birth cohorts entering the schools and projected population and housing growth within the District boundary area. For the most part this pattern has held true, though the official enrollment in October 2014 was approximately 150 students below the medium range projection completed in March 2011. The purpose of this report is to update the enrollment projections and extend them out to 2030.
The first part of this analysis provides a general narrative describing the recent enrollment and demographic trends with a discussion of what is likely to happen in the future. The next part of the analysis is divided into sections which highlight specific demographic trends and their effect on enrollment. Each section begins with a set of bulleted highlights which emphasize the important information and conclusions to keep in mind when viewing the accompanying charts and tables.
Following this discussion, the detailed forecasts by grade level for the district are included. This section provides a variety of alternative forecasts including low, medium, and high range options that emphasize the uncertainty we encounter when trying to predict the future. The medium range forecast is recommended at this time, though it is important to give at least some consideration to the low and high alternatives in order to determine what actions might be taken if enrollment were to trend close to these options.
The final section presents enrollment projections by school. These projections are balanced to the medium range district forecast and are designed to assist with facilities planning, boundary adjustments, or other matters that are relevant in school district planning.
Finally, it is worth noting that sometimes there will be unpredictable changes in the local or regional environment (dramatic changes in the economy, the housing market, or even natural disasters) that can lead to enrollment trends that diverge widely from the estimates presented here. For this reason the district will update the long range projections periodically to take advantage of new information; typically a new update is prepared every 5 years.
1 Enrollment trends and projections prepared by Dr. William (“Les”) Kendrick, May 2015. 8

Enrollment Trends – Past, Present, and Future As noted in the introduction, enrollment in the Olympia School District has trended up in thepast three years. Olympia’s share of the county K-12 public school enrollment has also increasedduring this time period. Between 2000 and 2010 the district’s share of the County K-12 enrollment declined from 24.3% in October 2000, to 22.7% by October 2010. The NorthThurston and Yelm school districts saw big gains in their K-12 population between 2000 and2010, consistent with their overall gain in the general population. Since 2010, however, Olympia’s share of the K-12 public school market has increased to 23.1%.
Shifts and changes in school age populations over time are not unusual as housing development, local economic changes, and family preferences can lead to shifts and changes from year to year. Over the next decade, however, it is likely that most, if not all, of the school districts in the County will see some gain in their enrollment as the larger birth cohorts from recent years become eligible for school. Since 2007, Thurston County has seen an average of about 3000 births per year, with recent years trending even higher. This compares to an average of 2500 births a year that we saw between 1997 and 2006. As these larger birth cohorts have begun to reach school age (kids born in 2007 would be eligible for school in 2012) overall kindergarten enrollment in Thurston County has increased. In Olympia specifically, the 2014 kindergarten class was larger than any class from the previous 13 years.
Looking ahead, births are expected to continue to trend up some at least through 2025, with births in the county remaining above 3,000 for the foreseeable future. This trend is partly generational, as the grandchildren of the baby boomers reach school age, and partially due to a good State economy that continues to attract young adults who already have children or might be expected to have children in the future. The forecast from the State for Thurston County predicts that there will be more women in the population between the ages of 20 and 45 over the next decade than we have seen in the previous decade. As a result, we expect larger birth cohorts with accompanying gains in K-12 enrollment. This trend is also evident in the counties near Seattle (King, Pierce, Kitsap, and Snohomish). More births throughout the region mean that there will be more families with school-age children buying houses over the next decade.
In addition to birth trends, the real estate market is improving. According to a recently completed report by Mike McCormick, the Olympia School District saw a net gain of over 1,000 new single family units and over 600 multi-family units between 2009 and 2013. These numbers are substantially higher than results of the 2011 analysis.
New housing development typically brings more families with children into the district. According to the McCormick analysis, Olympia saw a gain of about 59 students for every 100 new single family homes that were built, and about 23 students for every 100 new multi-family units. These gains are in line with the averages seen in the Puget Sound area where there is typically an average gain of about 50 students per 100 new single family homes and 20-25 students for every 100 new multi-family units. These are averages, of course, and the numbers can vary widely across districts.
9

The McCormick results are also consistent with estimates from the Office of Financial Management (OFM) for the State of Washington. OFM reports that just under 1,800 housing units have been added to the district’s housing stock since the 2010 Census (2010 to 2014). If this pace were to continue, the district would see over 4,000 units added to the housing stock between 2010 and 2020.
There are reasons to project that the pace of new home development could be even greater. The OSD tracking of current housing projects shows that there are just over 3200 units (approximately 1,700 single family units and 1,500 multi-family units) that are in various stages of planning. Some of the units have been recently completed and others are moving at a very slow pace, so it is difficult to predict how many will be completed by 2020.2 Assuming complete build-out by 2020, this would add an additional 3,200 units to those already completed, resulting in a net gain of approximately 5,000 housing units between 2010 and 2020. This is reasonably close to the housing forecasts produced by the Thurston Regional Planning Council (TRPC), though the latter forecast also predicts that the average household size in Olympia will continue to drop over time, resulting in fewer residents per house (and perhaps fewer students per house as well).
Housing estimates are one factor that can be used when predicting future enrollment. Information about housing developments that are currently in the pipeline (i.e., projects that we know are on the books) can be used to help us forecast enrollment over the next five to six year period. Beyond that point we either need housing forecasts (which are available from the TRPC) or more general estimates of population growth and even K- 12 population growth that we can use to help calibrate and refine our long range forecasts.
Addressing population growth specifically, various estimates suggest that the Olympia SchoolDistrict will grow at about the same rate as the overall county over the next ten to fifteenyears. In addition, due to the larger birth cohorts referenced earlier, the Office of FinancialManagement (OFM) is predicting continued gains in the Age 5-19 population between now and2030 in its medium range forecast for the County. Given the projected growth in housing andpopulation, and the trends in births, the projections assume that enrollment in Olympia andthe County will continue to grow between now and 2025 at a healthy pace, with a slowinggrowth trend between 2025 and 2030. The latter trend occurs because as we go out further,graduating 12th grade classes get larger (as the large kindergarten classes from recent yearsroll up through the grades). Between 2025 and 2030, some of the gains from the largekindergarten classes begin to be offset by the size of each year’s exiting 12th grade class. Inaddition, the projections include a slight decline in the size of the birth cohorts that will beentering school during this time period.
There is, as always, some uncertainty in predicting the future. The hardest factor to predict isthe net gain or loss in the population that occurs from people moving into or out of an area.These changes, referred to as “migration”, can shift due to changes in the local, regional orState economy. In addition, large shifts in the military population in an area can also lead tounexpected changes in migration.
2 This includes only those projects that are not yet complete or were recently completed in 2014 10

As a result of this uncertainty alternative forecasts were developed. First, a series of forecasts,using different methods, were produced; these lend support to the medium range optionrecommended in the final section. And, in addition to the final medium range forecast, low andhigh alternatives that show what might happen if housing and population growth (especiallyK-12 population growth) were to be lower or higher than what assumed in the medium model.Accumulated over time, these differences show alternative scenarios for future enrollment. Although the medium range forecast is consistent with our expectations about births, population, and housing development, it is important to consider the low and high alternatives,since the unexpected does sometimes happen.
It should also be noted that the recommended forecast in this report is somewhat lower thanthe recommended forecast from 2011. This reflects the fact that the current birth forecasts, while still predicting gains compared to the previous decade, are lower than the forecasts from2011. This difference reflects recent changes in fertility rates (the number of children born towomen in their child-bearing years) and updated forecasts of the female population for ThurstonCounty that were completed after 2011. It also reflects the latest kindergarten trends which showOlympia enrolling a smaller proportion of the County kindergarten population.
The current forecast also takes account of the latest forecast of the Thurston County populationby age group, obtained from the Office of Financial Management (OFM). As a result of thisinformation and the data on births and kindergarten enrollment, the present forecast is lowerthan the one completed in 2011.
Final Forecasts by Grade A final low, medium, and high range forecast by grade level was produced for the district. Themedium forecast is recommended at this time.
• Medium Range Forecast: This forecast assumes the addition of approximately 476 newhousing units annually and population growth of about 1.3% a year between now and2030. It also assumes some overall growth in the school age population based on theexpected rise in births and the forecast of the Age 5-19 County population (OFM MediumRange Forecast).
• Low Range Forecast: This forecast assumes that the K-12 population will grow at a ratethat is about 1% less on an annual basis than the growth projected in the medium rangeforecast.
• High Range Forecast: This forecast assumes that the K-12 population will grow at a ratethat is about 1% more on an annual basis than the growth projected in the mediumrange forecast.
Considerations regarding the Forecast Although multiple models lend credibility to our medium range forecast, there is always a possibility that our forecast of future trends (births, population, and housing) could turn out tobe wrong. This is the reason for the low and high alternatives.
11

There are several key indicators to keep in mind when looking at future enrollment trends. These indicators are helpful for knowing when enrollment might start trending higher or lower than expected.
• Births - If births between 2015 and 2025 are higher or lower than our present forecasts, we can expect a corresponding increase or decrease in the overall enrollment.
• Also, it is useful to track the district's share of the county kindergarten enrollment. If it continues to decline as in recent years, or trends up more dramatically, this too will have a corresponding effect on long term enrollment growth.
• Migration - There has been a lot of discussion in recent years of young families opting for a more urban lifestyle in cities. This is certainly true of recent trends in Seattle where the K-12 enrollment has gone up dramatically as the number of families opting to stay in the City and attend city schools has increased. Similar trends can also be seen in the Bellevue School District. In Olympia, one should take note if there is more enrollment growth in the more urban areas of the district or, alternatively, less growth in outlying districts like Yelm that saw tremendous population and housing growth between the 2000 and 2010 Census. These trends, if present, might indicate that enrollment will trend higher than we are predicting in our medium range model.
Graph A: Low, Medium, and High Range Forecasts 2015-2030
Graph A is based on Birth Trends and Forecasts, Grade-to-Grade growth and an adjustment for projected future changes in housing growth and growth in the Age 5-19 population.
12
OC1-B □ci-ti □Ct-12 OCt-13 OCt-14 OCt-6 OCt-6 OCt-17 oct-6 OC1-B OCt-20 Oct-21 OCt-22 OCt-23 OCt-24 □Ct-25 OCt-26 Oct-27 OCt-28 OCt-29 OCt-30
w Gro wtn 9,497 9,536 9.60 9,642 9.669 9.75E 9,874 9.935 0.D31 0,03 OiS 0250 0'244 0293 0.30 O.3SE
^■M ed urn i Reco m mended) 9,137 9,08 9,214 9.268 9,487 9,593 9,723 9,863 9,995 0,096 0257 0438 0.607 0.754 0.901 0,963 T1D22 HD25 noet ft. 111 11,66
qri Gro win 9.689 9.9 C 0.03 0.359 0,540 0.778 11C32 11258 11473 H672 H772 Ttseo 11873 11938 11972 12.023

The table below displays the 10-year enrollment forecast, by grade level. Table CGrade Oct '14 Oct '15 Oct '16 Oct '17 Oct '18 Oct '19 Oct '20 Oct '21 Oct '22 Oct '23 Oct '24 Oct '25 |
K 634 656 658 669 661 671 716 722 727 733 7041 710 673 697 699 711 702 712 760 766 772 7772 688 728 689 714 715 728 718 728 778 784 7903 727 703 743 704 729 731 743 733 743 794 8004 700 746 722 763 723 748 750 762 752 762 8145 723 722 769 744 786 745 770 772 785 774 7856 686 715 713 760 735 777 738 763 764 777 7677 701 708 738 737 785 759 804 764 790 791 8048 672 714 721 752 750 799 775 821 779 806 8079 884 833 885 894 931 929 992 961 1,019 967 1,00010 878 889 837 889 898 935 936 999 968 1,026 97411 782 845 855 806 856 864 902 902 963 934 89812 807 792 856 867 816 867 882 921 921 983 953
Total 9,467 9,593 9,723 9,883 9,995 10,096 10,257 10,438 10,607 10,754 10,901 10,963Change 126 130 161 112 101 160 181 170 147 147 62% of Change 1.33% 1.36% 1.66% 1.13% 1.01% 1.58% 1.76% 1.63% 1.39% 1.37% 0.57%
Chart 1 depicts the number of new students expected at the elementary level for each of the 3 enrollment projections: low, medium and high. Based on the medium projection, in 10 years the district will need to be housing an additional 567 elementary-age students.
Chart 1: Elementary School Cumulative Enrollment Change; Low, Medium and High Projections
Cumm Change Ttl ES, from '14 Low -------Cumm Change Ttl ES, from '14, Med ------- Cumm Change Ttl ES, from '14, Hi
13

Chart 2 depicts the number of new students expected at the middle school level for each of the 3enrollment projections: low, medium and high. Based on the medium projection, in 10 years thedistrict will need to be housing an additional 322 middle school-age students.
Chart 2: Middle School Cumulative Enrollment Change; Low, Medium and High Projections
800
700
Middle School Cumulative Change, Low, Medium, and High Projections
May 2015 Projection
600
500
Cum Change MS, Low
Cum Change MS, Med
Cum Change MS, Hi
400
300
200
100 81
3 -
Oct '15 Oct '16 Oct '17 Oct '18 Oct '19 Oct '20 Oct '21 Oct '22 Oct '23 Oct '24 Oct '25 Oct '26 Oct '27 Oct '28 Oct '29 Oct '30
(100)
14

Chart 3 depicts the number of new students expected at the high school level for each of the 3enrollment projections: low, medium and high. Based on the medium projection, in 10 years thedistrict will need to be housing an additional 629 high school-age students.
Chart 3: High School Cumulative Enrollment Change; Low, Medium and High Projections
High School Cumulative Change, Low, Medium, and High Projections May 2015 Projection
1,400
1,200
1,000
800 753
600
400 314
250 214
247
200 98
71 42
-Oct '15 Oct '16 Oct '17 Oct '18 Oct '19 Oct '20 Oct '21 Oct '22 Oct '23 Oct '24 Oct '25 Oct '26 Oct '27 Oct '28 Oct '29 Oct '30
Cum Change HS, Low Cum Change HS, Med Cum Change HS, Hi
School Forecasts Forecasts were also created for schools. This involved allocating the district medium range projection to schools based on assumptions of differing growth rates in different service areas. Two sources of information were used for this forecast. First, housing development information by service area, provided by the Olympia School District, was used to forecast school enrollments between 2015 and 2020. (See next section for Student Generation Rate study results.) The average enrollment trends by grade were extrapolated into the future for each school. The numbers were then adjusted to account for additional growth or change due to new home construction. For the period between 2020 and 2030 adjustments to the school trends were based on housing forecasts by service area obtained from the Thurston Regional Planning Council.
15

For secondary schools, the entry grade enrollment forecasts (grade 6 and 9) were based on enrollment trends and housing, as well as estimates of how students feed from elementary into middle school and middle into high school. For alternative schools and programs it was assumed that their share of future enrollment would be consistent with recent trends. This means that ORLA, for example, would increase its enrollment over time, consistent with the overall growth in the district’s enrollment.
In all cases, the final numbers were balanced to the district medium projection which is assumed to be most accurate. This analysis by school allows the district to look at differential growth rates for different parts of the district and plan accordingly. Summary projections by school are provided on the following page.
Although the school projections are carried out to 2030, it is very likely that changes in demographics, program adjustments, and even district policy changes will lead to strong deviations from the projected numbers that far out. Because school service area projections are based on small numbers (30-50 per grade level in some cases) they are subject to greater distortion than district-level projections (especially over a longer range time period) and higher error rates. Estimates beyond five years should be used with caution.
Instead of focusing on the exact projection number for the period between 2020 and 2030, it is recommended that the focus be on the comparative general trend for each school. Is it going up more severely than other schools, down more severely, or staying about the same over time during this time frame?
Table D: Projection Summary by School (October Headcount 2015-2030) Medium Range Forecast Medium Projections
School Oct '15 Oct '16 Oct '17 Oct '18 Oct '19 Oct '20 Oct '21 Oct '22 Oct '23 Oct '24 Oct '25 Oct '26 Oct '27 Oct '28 Oct '29 Oct '30 Boston Harbor 130 122 117 115 122 122 125 129 133 136 139 141 140 139 138 137 Centennial 526 525 519 516 528 530 540 544 550 555 560 562 557 553 549 544 Garfield 327 332 332 335 333 336 343 350 357 363 367 367 365 362 359 356 Hansen 485 491 497 500 492 498 508 508 509 512 513 512 507 503 500 495 Lincoln 300 293 293 302 308 310 316 322 328 334 338 339 337 335 333 330 LP Brown 301 319 330 329 329 324 330 335 340 345 349 353 354 353 352 350 Madison 271 289 298 293 296 281 286 290 294 298 301 303 300 298 296 293 McKenny 361 359 370 370 368 372 379 401 422 439 453 457 454 448 442 437 McLane 351 371 367 381 392 396 404 401 400 401 400 399 396 393 390 386 Pioneer 459 465 481 491 498 504 513 510 510 510 510 509 503 499 494 489 Roosevelt 406 399 410 401 400 394 402 419 434 447 457 465 466 464 462 459 Jefferson 402 375 367 383 414 434 429 426 421 428 430 432 443 456 468 472 Marshall 387 384 387 408 428 422 430 428 431 433 426 420 420 425 430 429 Reeves 391 402 420 443 437 476 452 465 445 456 462 470 485 504 522 528 Washington 760 831 850 859 836 844 847 867 877 894 897 899 916 939 960 962 AHS 144 149 142 151 151 155 163 169 168 173 172 175 173 175 175 177 CHS 1,350 1,400 1,459 1,435 1,430 1,452 1,462 1,523 1,581 1,585 1,594 1,589 1,583 1,587 1,579 1,598 OHS 1,802 1,755 1,754 1,772 1,809 1,869 1,963 1,965 1,992 2,023 2,019 2,054 2,050 2,069 2,082 2,131 ORLA 265 266 269 271 273 276 280 284 288 292 295 296 296 297 298 299 ORLAB 175 198 221 239 252 262 266 270 275 278 280 281 281 282 283 284
9,593 9,723 9,883 9,995 10,096 10,257 10,438 10,607 10,754 10,901 10,963 11,022 11,025 11,081 11,111 11,156 Note: Numbers may not add to exact totals due to rounding
16

Student Generation Rates Used to Generate School Forecasts and Calculate Impact Fees Enrollment forecasts for each school involved allocating the district medium projection to schoolsbased on assumptions of differing growth rates in different service areas. Two sources of information were used for this forecast of student data. First, housing development informationby service area, provided by the City and County. Second, student generation rates are basedon City and County permits and OSD in-district enrollment data, 2009-20133.. The student generation rates are applied to future housing development information to identify where thegrowth will occur.
The process of creating the student generation rates involved comparing the addresses of allstudents with the addresses of each residential development in the prior 5 completed years.Those which matched were aggregated to show the number of students in each of the gradegroupings for each type of residential development. A total of 1,051 single family residentialunits were counted between 2009 and 2013 within the school district boundary. There are atotal of 624 students from these units. A total of 632 multiple family units were counted. Thereare 148 students associated with these units.4
Based on this information, the resulting student generation rates are as follows:
Student Generation Rates (Olympia only, not including Griffin; based on cumulative file 2009-2013 permits)
Single-Family Multi-Family Elementary Schools (K-5) 0.309 0.119 Middle Schools (6-8) 0.127 0.059 High Schools (9-12) 0.158 0.057 Total 0.594 0.234 Change from August 2013 Study5 15% Increase 11% Increase
Based on this data, the district enrolls about 59 students for every 100 single family homespermitted over a five-year period. The rate is highest in the most mature developments, Therates are lowest in the most recent years because it is likely that the district has not yet seen allthe students.
Again using the above data, the district enrolls about 23 students for every 100 multi-familyunits, but the rate varies considerably from year to year (most likely due to the type ofdevelopment- rental, condo, townhome, and the number of bedrooms of each). Utilizing the five-year average is probably best practice because it includes enough units and types to provide areliable measure of growth from multi-family homes.
3 Student generation rate study was conducted by Mike McCormick, February 2015. 4 McCormick, February2015. 5 August 2013 results were an average of 0.516 for single family homes and 0.212 for mult-family homes.
17
Class Size Reduction Assumptions
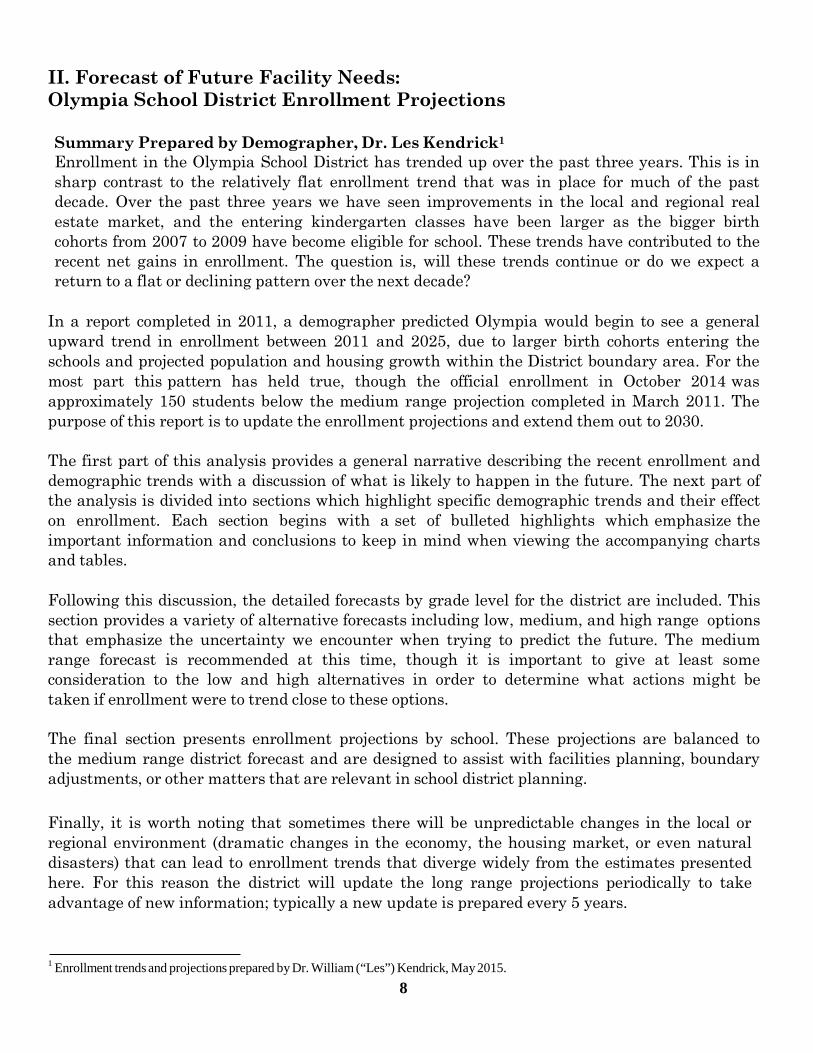
Elementary School Elementary school class size represents a major set of assumptions to project adequacy ofclassroom space. As of July 2015, the state Legislature delayed implementation of Initiative1351 by four years. However, the Legislature also reduced class size in kindergarten through the third grade. The Legislature did not decrease class size in grades 4 and 5, as presumablythese will be addressed once the initiative is implemented. Importantly, the Legislature hasdecreased class size differentially at average (typical) income and low income schools. The tablebelow depicts the class size reduction for grades K-3.
Table E: State Funded Class Size Reduction
2014-15 SY 2015-16 SY 2016-17 SY I-1351 Required
Students per Teacher(s)
Typical Income Schools
High Poverty Schools
Typical Income School
High Poverty Schools
Typical Income Schools
High Poverty Schools
Typical Income Schools
High Poverty Schools
Kindergarten 25.23 20.30 22.00 18.00 19.00 17.00 17.00 15.00 1st Grade 25.23 20.30 23.00 19.00 21.00 17.00 17.00 15.00 2nd Grade 25.23 24.10 24.00 22.00 22.00 18.00 17.00 15.00 3rd Grade 25.23 24.10 25.00 24.00 22.00 21.00 17.00 15.00
One additional nuance to the class size planning effort is that the text of I-1351 and theLegislative implementation guidance includes specialist teachers in the calculation of class size.Therefore, to reach a K-3 class size of 17, a school district will meet requirements by pairing 1.1teachers (1 full-time classroom and .05 PE and .05 music) with 19 students. All projections inthis document assume that specialist teachers are contributing to the class size accountability tests.
The Legislature has universally funded full day kindergarten (FDK) for fall 2016. Therefore,full day kindergarten (FDK) is also a major factor to the classroom space equation. In the 2015-16 SY, the district will convert 5 schools to offer mainly FDK, but the number of newclassrooms needed is small given that the district has been transitioning to FDK for several years. In the 2016-17 SY, the remaining 6 schools will offer mainly FDK; again only 2-3 newclassrooms will be needed to make this conversion given the progress the school district hasalready made.
An additional assumption in this analysis is that all computer labs will be disbanded andreplaced with mobile computer labs. This conserves several classrooms across the district andis consistent with best-resource practices.
Middle School Analysis of the need for new classrooms is based the following assumptions: • The district will continue to fund 1 teacher per 28 students; an enhanced level over the
state allocation of 1 teacher for every 28.7 students. The Legislature may reduce classsize to one teacher per 25 students, but we do not know when or if this will happen.
18
Therefore, analysis below is shown for a reduction to 27 from 28.7, assuming that theLegislature will not fund grades 6-8 class size at 25 students per teacher.
• The district will build classrooms to accommodate 30-32 students so as to ensure viabilityover the 30 year life of new construction and flexibility regardless of shifts in funding andclass offerings.
• The district will assume that each classroom is “empty” for 1 period per day the teachercan plan with his/her equipment rather than be forced to plan away from the classroombecause the space is used for another classroom offering. (80% utilization rate.)
• For any major project, the district will maximize classrooms in order to accommodatepotential class size reduction at grades 6-8. However, the district will not undertake aconstruction project for the sole reason of reducing class size; legislative policy is unpredictable and actions thus far indicate minimal commitment to secondary-grade class size reduction.
High School Analysis of the need for new classrooms is based the following assumptions: • The district will continue to fund 1 teacher per 28 students; an enhanced formula over
the state allocation of 1 teacher for every 28.7 students. The Legislature may reduceclass size to one teacher per 25 students; we do not know when or if this will happen.
• The district will build classrooms to accommodate 30-32 students so as to ensure viabilityover the 30 year life of new construction and flexibility regardless of shifts in funding andclass offerings.
• The district will meet or exceed the state requirement for laboratory science. • The district will raise retention rates toward graduation. • The district will assume that each classroom is “empty” for 1 period so that the teacher
can plan with his/her equipment rather than be forced to plan away from the classroombecause the space is used for another classroom offering. (80% utilization rate.)
• For any major project, the district will maximize classrooms in order to accommodatepotential class size reduction at grades 9-12. However, the district will not undertake aconstruction project for the sole reason of reducing class size; legislative policy is unpredictable and actions thus far indicate minimal commitment to secondary-grade class size reduction.
Need for New Classrooms In summary, the combination of enrollment projections (based on updated student generationrates and developments underway) and class size reduction, the district will need new classroomseats or student classroom capacity.
The chart on the next page depicts that, if class size is reduced to 19 students per classrooms(17 students per teacher), the district will have an immediate need for additional classrooms.The seating capacity deficit, based on the medium projection totals 415 students by October2020.
19
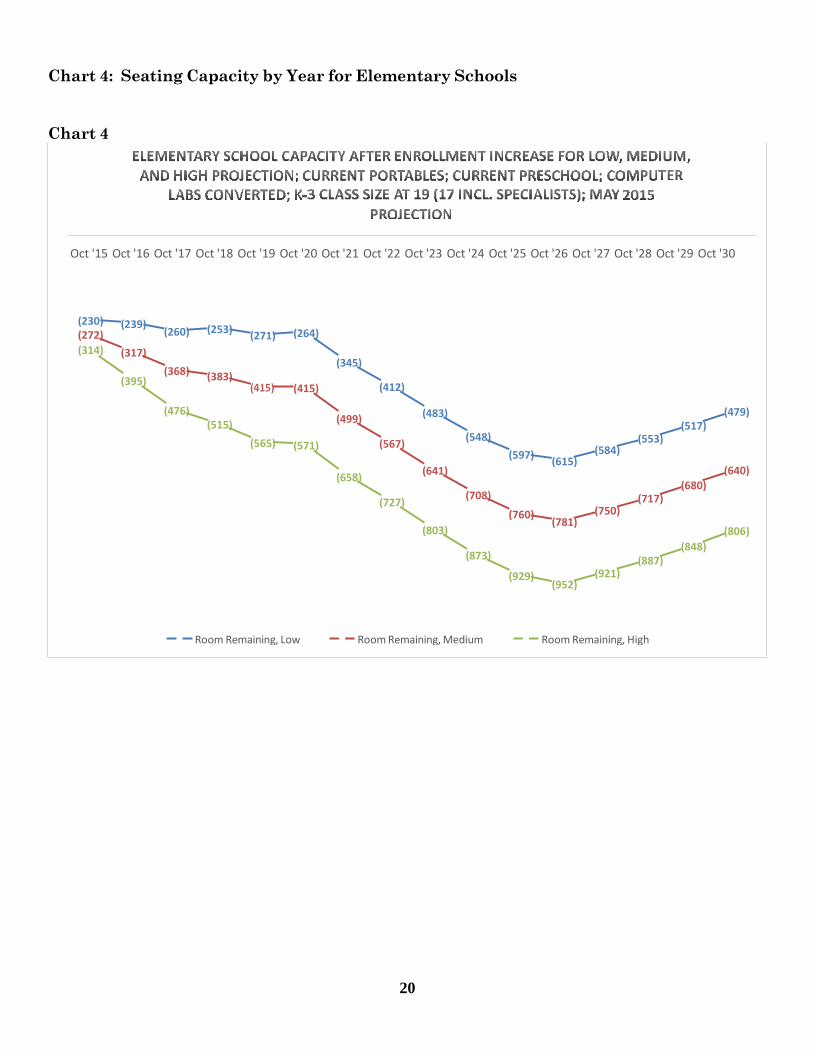
Chart 4: Seating Capacity by Year for Elementary Schools
Chart 4
Oct '15 Oct '16 Oct '17 Oct '18 Oct '19 Oct '20 Oct '21 Oct '22 Oct '23 Oct '24 Oct '25 Oct '26 Oct '27 Oct '28 Oct '29 Oct '30
(230) (272) (314)
(239) (260) (253) (271) (264)
(317)
(395) (368)
(345) (383)
(415) (412)
(476) (479) (515) (499) (483)
(517) (565) (571) (567) (548) (553)
(597) (584) (615)
(658) (641) (640) (680)
(727) (708) (717) (760) (750)
(803) (781)
(806)
(873) (848)
(887) (929) (921)
(952)
Room Remaining, Low Room Remaining, Medium Room Remaining, High
20

(43) (51) (61)
(78) (81) (83) (100)
(123) (144) (146)
Jefferson Room for Students Marshall Room for Students
Reeves Room for Students Washington Room for Students
Chart 5: Seating Capacity by Year by Middle School At the middle school level, seating capacity is sufficient at 3 of 4 middle schools. The deficit at Washington Middle School is highly dependent on development of two housing complexes:Bentridge and Ashton Woods.
Chart 5
208 219
190
246 254 238
207 187 192 195 200 193 191 189
68 173 117769 173 161 152 144
138 132 138 3209 136
178 165
134 140 140
153 149
132 129 5
11227 135 130 131
58 56
105 116 119 111
96 77
59 53
Oct '14 Oct '15 Oc(t15'1)6 Oct '17 Oct '18 Oc(t20'1) 9 Oct '20 Oct '21 Oct '22 Oct '23 Oct '24 Oct '25 Oct '26 Oct '27 Oct '28 Oct '29 Oct '30 (28) (31)
(34)
21

Chart 6: Seating Capacity by Year by High School At the high school level, seating capacity is sufficient through October 2020 at Olympia HighSchool and sufficient through October 2023 at Capital High School.
Chart 6
204 198
132 148
103 104 89
56
113 118
86
49
96 86
25
(11)Oct '14 Oct '15 Oct '16 Oct '17 Oct '18 Oct '19 Oct '20 Oct '21 Oct '22 Oct '23 Oct '24 Oct '25 Oct '26 Oct '27 Oct '28 Oct '29 Oct '30 (33) (37) (46) (41) (35) (39) (31)
(50)
(105) (107)
(134)
(165) (161)
(196) (192) (211)
(224)
(273)
Capital Room for Students Olympia Room for Students
22
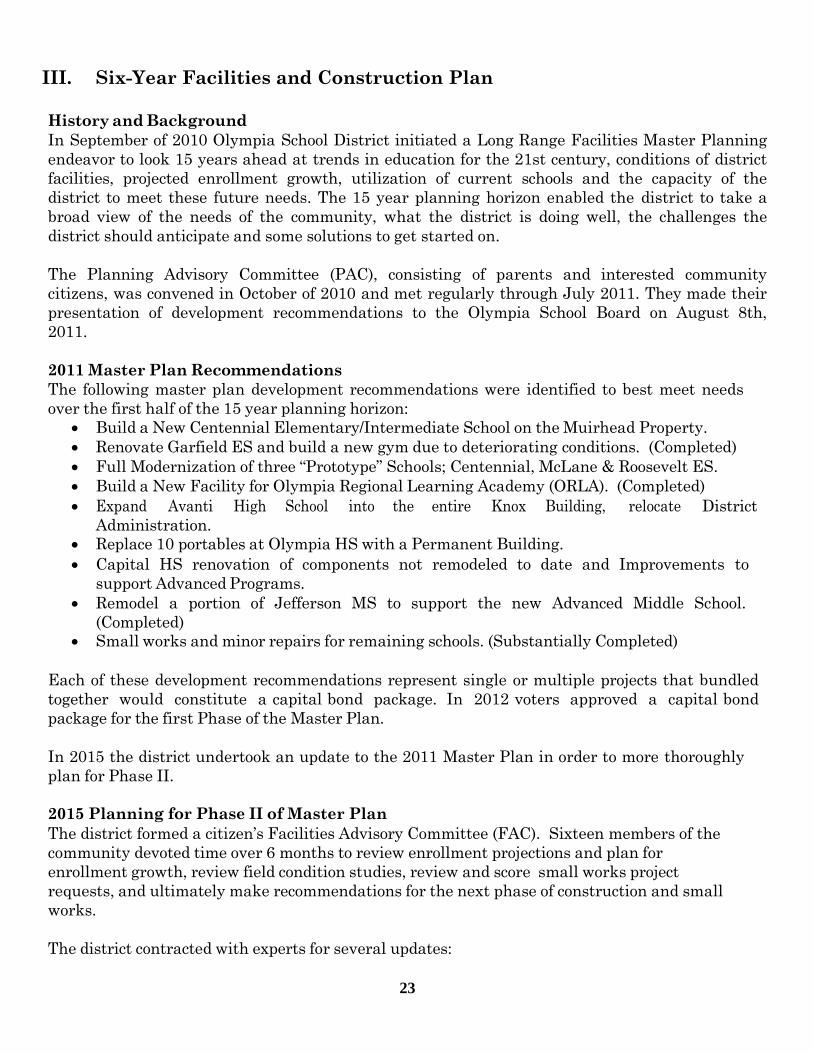
III. Six-Year Facilities and Construction Plan
History and BackgroundIn September of 2010 Olympia School District initiated a Long Range Facilities Master Planningendeavor to look 15 years ahead at trends in education for the 21st century, conditions of districtfacilities, projected enrollment growth, utilization of current schools and the capacity of thedistrict to meet these future needs. The 15 year planning horizon enabled the district to take abroad view of the needs of the community, what the district is doing well, the challenges thedistrict should anticipate and some solutions to get started on.
The Planning Advisory Committee (PAC), consisting of parents and interested communitycitizens, was convened in October of 2010 and met regularly through July 2011. They made theirpresentation of development recommendations to the Olympia School Board on August 8th,2011.
2011 Master Plan Recommendations The following master plan development recommendations were identified to best meet needsover the first half of the 15 year planning horizon: • Build a New Centennial Elementary/Intermediate School on the Muirhead Property. • Renovate Garfield ES and build a new gym due to deteriorating conditions. (Completed) • Full Modernization of three “Prototype” Schools; Centennial, McLane & Roosevelt ES. • Build a New Facility for Olympia Regional Learning Academy (ORLA). (Completed) • Expand Avanti High School into the entire Knox Building, relocate District
Administration. • Replace 10 portables at Olympia HS with a Permanent Building. • Capital HS renovation of components not remodeled to date and Improvements to
support Advanced Programs. • Remodel a portion of Jefferson MS to support the new Advanced Middle School.
(Completed) • Small works and minor repairs for remaining schools. (Substantially Completed)
Each of these development recommendations represent single or multiple projects that bundledtogether would constitute a capital bond package. In 2012 voters approved a capital bond package for the first Phase of the Master Plan.
In 2015 the district undertook an update to the 2011 Master Plan in order to more thoroughlyplan for Phase II.
2015 Planning for Phase II of Master Plan The district formed a citizen’s Facilities Advisory Committee (FAC). Sixteen members of thecommunity devoted time over 6 months to review enrollment projections and plan forenrollment growth, review field condition studies, review and score small works projectrequests, and ultimately make recommendations for the next phase of construction and smallworks.
The district contracted with experts for several updates:
23

• An analysis of play field conditions to determine how to ensure safe play by students andthe community.
• Enrollment projections (discussed previously). • Seismic analysis of each school to ensure that any needed seismic upgrades were built
into the construction plan. • A Site Study and Survey update for each school, a state-required analysis of major
mechanical systems.
District staff analyzed space utilization and readiness for class size reduction.
In addition, school administrators generated a Facilities Condition Assessment which compriseditems that each administrator felt must be addressed at their school. These items were analyzed to eliminate duplicates, identify items that were maintenance requirements (not new construction), and bundle items that were associated with a major remodel of the facility.Remaining items totaled about 120 small works items. These items analyzed for scope and cost,and were then scored using a rubric to rank urgency for investment. (The scoring rubric ratesthe condition, consequence of not addressing, educational impact of not addressing, and impacton capacity of the facility.) Finally, the Facilities Advisory Committee ranked each item on a 1- 3 scale (1-most important for investment).
The following describes the administrative recommendations which are largely based on the recommendations of the FAC. Where the administration recommendation varies from the FAC recommendation, this variation is noted.
Overview of Phase II Master Plan Update Recommendations (2015) (Recommendations are updated for 2016 changes to mini-building plans.)
1. Do not construct an Intermediate School adjacent to Centennial Elementary School. 2. Complete renovation of the remaining 26 year-old 3 Prototype Schools: Centennial,
McLane and Roosevelt Elementary Schools. (Garfield renovation is completed.) 3. Reduce class size and accommodate enrollment growth by expanding the number of
elementary classrooms across the school district with permanently constructed mini-buildings on the grounds of current schools (sometimes referred to as pods ofclassrooms).
4. Build a new building on the Olympia High School grounds to reduce reliance onportables and accommodate enrollment growth.
5. Renovate portions of Capital High School not previously renovated. 6. Build a sufficient theater for Capital High School. 7. Expand Avanti High School to create an alternative arts-based school and relieve
enrollment pressure from Olympia and Capital High Schools. This requires movingthe district administration office to another site.
8. Renovate playfields to improve safety and playability. 9. Invest in electronic key systems to limit access to schools and instigate lockdowns. 10. Address critical small works and HVAC or energy-improvement projects.
1. Do Not Construct an Intermediate School Adjacent to Centennial ESIn 2011 the Master Plan included a new school built on the Muirhead property. The
24

recommendation was based on projected enrollment on the Eastside that would compromise theeducation quality. At this time, the school is NOT recommended for construction. Two factors contribute to the updated recommendation. First, enrollment growth as proceed more slowlythan projected. Two housing developments on the Eastside are delayed for construction, one isscaled down in size, and one may not proceed at all. Second, based on a species listing asEndangered on by the U.S. Fish and Wildlife Department, the district must develop a HabitatConservation Plan (HCP) to mitigate the negative impact on the pocket gopher as a result ofconstruction. The HCP is reliant on a larger county-wide effort to identify mitigation options.The district continues to make progress to gain approval by the U.S. Fish and Wildlife Departmentto construct on the site.
The delay due to a need for an HCP is fortuitous, as enrollment patterns do not warrant building of the school at this time.
The Muirhead land must likely be used for a school in the upcoming decades, and will bepreserved for this purpose. However, in the meantime, the land can be used for its originalpurpose—agriculture. The districts farm-to-table program is housed on this site and will remain here for the near future.
Voters approved the resources for this construction in 2012. The resources have been retainedand set-aside. The district will request voter approval on an updated construction request, and ifapproved, will devote the resources to Phase II of the Master Plan accordingly.
2. Complete the Remodel of Prototype Schools: Centennial, Garfield, McLane & Roosevelt Elementary School Modernizations (Garfield was completed in 2014)
The four “prototype” schools built in the late 1980’s have some of the worst building conditionratings in the District. The 2009 facility condition survey and interviews with leaders of theschools identified problems with heating and cooling, inconsistent technology, poor air quality,parking and drop off/pick up issues, poor drainage in the playfields, security at the front doorand the multiple other entries, movable walls between classrooms that don't work, a shortage ofoffice space for specialists, teacher meeting space that is used for instruction, security at theperimeter of the site, storage and crowded circulation through the school. We have also learnedabout the frequent use of the pod's shared area outside the classrooms; while it’s heavily used,there isn't quiet space for small group or individual activities. These schools also lack a stage inthe multipurpose room. The 2010 Capital Levy made improvements to some of these conditions,but a comprehensive modernization of these schools is required to extend their useful lifeanother 20-30 years and make improvements to meet contemporary educational needs.
The 2011 Master Plan proposed a comprehensive modernization of Garfield, Centennial, McLaneand Roosevelt Elementary Schools to improve all of these conditions. The renovation of Garfield is now complete. The intent of the remaining projects is to do so as much as is feasible withinthe footprint of the school; the buildings are not well configured for additions. The exterior finishes of the schools will be refurbished; exterior windows and doors replaced as needed. Interiorspaces will be reconfigured to enhance security, efficiency and meet a greater range of diverseneeds than when the schools were first designed. Major building systems will be replaced andupdated. Site improvements would also be made.
25

The modernization and replacement projects should also consider aspects of the future educational vision outlined in the master plan, such as these: • Accommodate more collaborative hands on projects, so children learn how to work in
teams and respect others, • Work with personal mobile technology that individualizes their learning, • Creating settings for students to work independently, • Meeting the needs of a diverse range of learning styles and abilities, • Places for students to make presentations and display their work, • Teacher planning and collaboration, • Fostering media literacy among students and teachers, • Make the building more conducive to community use, while reducing the impact on
education and security, and • Support for music/art/science.
3. Invest in New Classrooms to Reduce Class Size and Respond to Enrollment GrowthIn November 2014, statewide voters approved Initiative 1351 to significantly reduce class size,Kindergarten through 12th grade. The reduction in class size is about 30 percent at theelementary level, 12 percent at the middle school level, and 12 percent at the high school level.
The 2015 Legislature enacted Engrossed House Bill 2266 to delay implementation of the initiativefor four years and simultaneously appropriated the operating resources to hire more teachersand reduce class size Kindergarten through 3rd grade in two increments over the next two years;the Legislature also created a lower class size for high poverty schools6. Please see page 18, Table E, for a summary of state funded class sizes.
In general, the district seating capacity at prior class sizes can hold 4,638 elementary students.At new class sizes (once fully implemented), the district can hold 4,057 students. This is adeficit of 28-30 classrooms by 2025.
As the district considered options to respond to this deficit, there are three main options: 1) Addportables to school grounds; 2) Build a new elementary school and change all boundaries to pullstudents into the new school and reduce enrollment at all other schools (only Boston Harborboundaries would be unchanged); 3) Add mini-buildings of classrooms at schools across theschool district. Table F on the following page displays on the following page displays the prosand cons of each of these options.
6 High poverty is defined as 50% or greater eligibility for Free or Reduced Price Lunch. In the 2015-16 SY, 3 schools qualify for this lower level of class size funding (LP Brown, Madison, and Garfield). In classroom-need projections the district has assumed that Hansen Elementary School may soon qualify for this lower class size threshold and therefore need more classrooms.
26

Table F: Benefits and Drawbacks of Investments in Portables, a New Building, or Mini-buildings
Table F (Green identifies a benefit of the option; orange identifies a concern of the option.) Portable New Building Mini-Buildings or Pod of Classrooms
Land Intensive: Requiresmore vacant land + land for
corridors between portables ateach school site (corridor land)
Cheapest option
Requires vacant land nearcenter of district
Most expensive ($35 millionplus cost of land)
Requires vacant land OR mustreplace portables and buildenough classrooms to both
replace portables and expandcapacity, BUT at 2 stories arespace efficient and requires
less “corridor” land than portables
Less expensive than a newschool because not buying new
land
Can be distributed across the district, does not require
boundary revisions
Requires re-drawing mostboundaries
Can be distributed across the district, does not require
boundary revisions
Least attractive New building can be designedwith full esthetic license
Nice looking (can be built tomatch school)
Variable number of portablescan be added (as few or as
many as required)
Can build variable number of classrooms (as few or as many
as required)
Set # of classrooms; not as variable as portables but more
flexible than a new school
Does not reduce strain on administrative space
Reduces strain on administrative space of
current schools by drawingaway excess enrollment
Reduces strain on administrative space ifdesigned accordingly
The administrative concurs with the FAC: the district should be less reliant on portables, buildmini-buildings instead of portables, and add mini-buildings to conserve resources and largelyretain current boundaries.
Based on these options and specific growth and class size reduction readiness, the districtmakes the following set of Westside and eastside observations in Table G and Table H on thefollowing pages.
27

Table G: Westside Observations
Table G OK in 2016? (w/Reduced Class
Size)
OK in 2020? (w/Reduced Class
Size)
OK in 2025? (w/Reduced Class
Size)
Number New Classrooms by
2025
Mini-BuildingThat Fits?
McLane (RemodelPlanned in
~2018)
Hansen (No
Remodel Pending)
No, Team TeachingRequired
Yes, with minor Team Teaching.If HES reaches High Poverty
Status, 3 Classrooms are
Needed
No, Team Teaching orNew Rooms
Required
Yes, with minor Team Teaching.If HES reaches High Poverty
Status, 3 Classrooms are
Needed
Same as 2020
Dependent onPoverty Status
3 New + 2 Replace
Portable (RP) +Music + 1
Special Needs(SN)
1 at current poverty level; 3if High Poverty
(HP)
Mini-building of 11 classrooms
will fit w/oimpinging on
play area or firelane.
Mini-building of11 classrooms
will fit.
Garfield (RemodelCompleted)
Yes Yes Yes 0, even at HP NA
LP Brown (No
Remodel Pending)
Yes, with minor Team Teaching,or 1 classroom is need for no
Team Teaching.
Yes, with minor Team Teaching,or 1 classroom is need for no
Team Teaching.
Yes, with minor Team Teaching,or 2 classrooms are need for no Team Teaching.
1-2 dependingon Team
Teaching model NA
Table H: Eastside Observations
Table H OK in 2016? (w/ ReducedClass Size)
OK in 2020? (w/ ReducedClass Size)
OK in 2025? (w/ ReducedClass Size)
Number New Classrooms by
2025
Mini-BuildingThat Fits?
McKenny(No
Remodel Planned)
Pioneer (NoRemodel Pending)
Yes
No; Team TeachingRequired
No; Need Team Teaching or 1
New Classroom
No; Team Teaching orNew Rooms
Required
No; Need Team Teaching or 8
New Classrooms
Same as 2020
8 New + 1 SN + Music
5 New + 2 RP* + Music + 1 SN
Mini-building of 11 classrooms will fit.
Need is highlydependent on 2
housingdevelopments
Mini-building of11 classrooms will fit. 1
Lincoln (NoRemodel Pending)
No; Team TeachingRequired
No; Team Teaching orNew Rooms
Required Same as 2020 3 New or Policy
Options
Mini-building of 7 classrooms will not fit. A building of
fewer classrooms is cost prohibitive.Pursue policy
options.
28
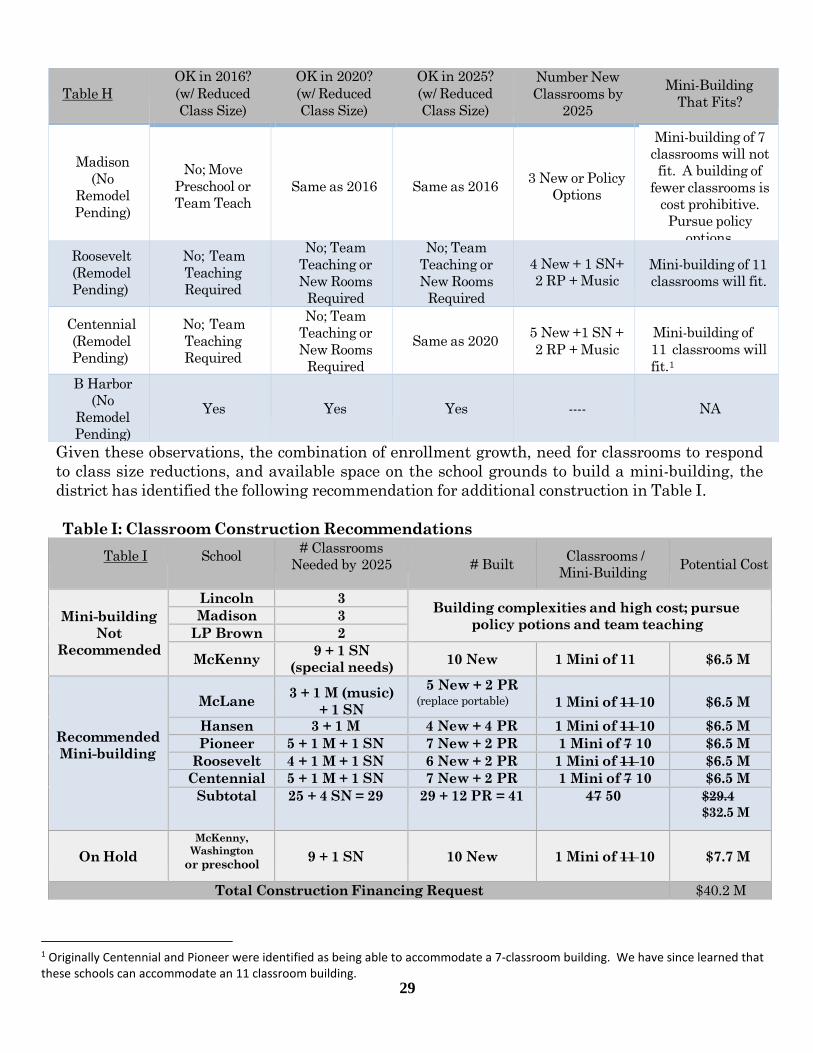
Table H OK in 2016? (w/ ReducedClass Size)
OK in 2020? (w/ ReducedClass Size)
OK in 2025? (w/ ReducedClass Size)
Number New Classrooms by
2025
Mini-BuildingThat Fits?
Madison (No
Remodel Pending)
Roosevelt (RemodelPending)
No; Move Preschool or Team Teach
No; Team TeachingRequired
Same as 2016
No; Team Teaching orNew Rooms
Required
Same as 2016
No; Team Teaching orNew Rooms
Required
3 New or PolicyOptions
4 New + 1 SN+ 2 RP + Music
Mini-building of 7 classrooms will not fit. A building of
fewer classrooms is cost prohibitive.Pursue policy
options
Mini-building of 11classrooms will fit.
Centennial (RemodelPending)
No; Team TeachingRequired
No; Team Teaching orNew Rooms
Required
Same as 2020 5 New +1 SN + 2 RP + Music
Mini-building of11 classrooms will fit.1
B Harbor (No
Remodel Pending)
Yes Yes Yes ---- NA
Given these observations, the combination of enrollment growth, need for classrooms to respondto class size reductions, and available space on the school grounds to build a mini-building, thedistrict has identified the following recommendation for additional construction in Table I.
Table I: Classroom Construction Recommendations Table I School # Classrooms
Needed by 2025 # Built Classrooms /Mini-Building Potential Cost
Mini-building Not
Recommended
Lincoln 3 Building complexities and high cost; pursue policy potions and team teaching Madison 3
LP Brown 2
McKenny 9 + 1 SN (special needs) 10 New 1 Mini of 11 $6.5 M
Recommended Mini-building
McLane 3 + 1 M (music) + 1 SN
5 New + 2 PR (replace portable) 1 Mini of 11 10 $6.5 M
Hansen 3 + 1 M 4 New + 4 PR 1 Mini of 11 10 $6.5 M Pioneer 5 + 1 M + 1 SN 7 New + 2 PR 1 Mini of 7 10 $6.5 M
Roosevelt 4 + 1 M + 1 SN 6 New + 2 PR 1 Mini of 11 10 $6.5 M Centennial 5 + 1 M + 1 SN 7 New + 2 PR 1 Mini of 7 10 $6.5 M
Subtotal 25 + 4 SN = 29 29 + 12 PR = 41 47 50 $29.4 $32.5 M
On Hold McKenny,
Washington or preschool
Total Co
9 + 1 SN
nstruction Financing Request
10 New 1 Mini of 11 10 $7.7 M
$40.2 M
1 Originally Centennial and Pioneer were identified as being able to accommodate a 7-classroom building. We have since learned that these schools can accommodate an 11 classroom building.
29
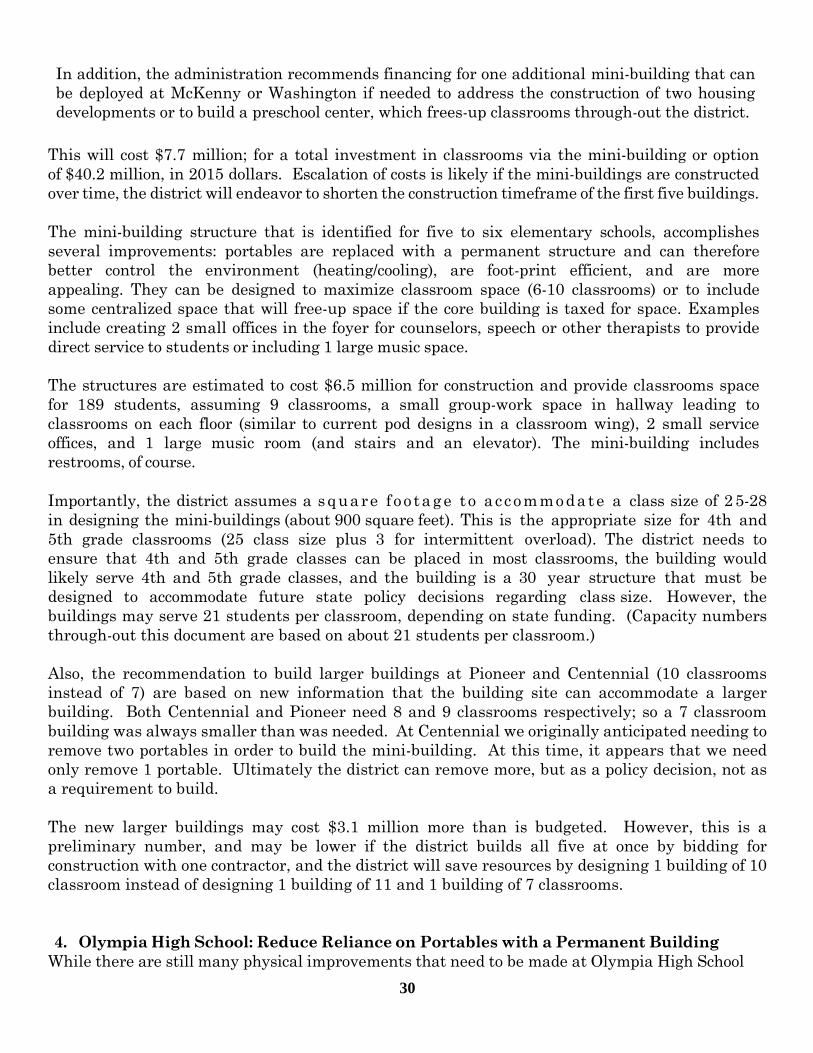
In addition, the administration recommends financing for one additional mini-building that canbe deployed at McKenny or Washington if needed to address the construction of two housingdevelopments or to build a preschool center, which frees-up classrooms through-out the district.
This will cost $7.7 million; for a total investment in classrooms via the mini-building or optionof $40.2 million, in 2015 dollars. Escalation of costs is likely if the mini-buildings are constructed over time, the district will endeavor to shorten the construction timeframe of the first five buildings.
The mini-building structure that is identified for five to six elementary schools, accomplishesseveral improvements: portables are replaced with a permanent structure and can thereforebetter control the environment (heating/cooling), are foot-print efficient, and are more appealing. They can be designed to maximize classroom space (6-10 classrooms) or to includesome centralized space that will free-up space if the core building is taxed for space. Examplesinclude creating 2 small offices in the foyer for counselors, speech or other therapists to providedirect service to students or including 1 large music space.
The structures are estimated to cost $6.5 million for construction and provide classrooms spacefor 189 students, assuming 9 classrooms, a small group-work space in hallway leading toclassrooms on each floor (similar to current pod designs in a classroom wing), 2 small serviceoffices, and 1 large music room (and stairs and an elevator). The mini-building includes restrooms, of course.
Importantly, the district assumes a square foo tage to accommodate a class size of 2 5-28in designing the mini-buildings (about 900 square feet). This is the appropriate size for 4th and5th grade classrooms (25 class size plus 3 for intermittent overload). The district needs to ensure that 4th and 5th grade classes can be placed in most classrooms, the building wouldlikely serve 4th and 5th grade classes, and the building is a 30 year structure that must bedesigned to accommodate future state policy decisions regarding class size. However, the buildings may serve 21 students per classroom, depending on state funding. (Capacity numbers through-out this document are based on about 21 students per classroom.)
Also, the recommendation to build larger buildings at Pioneer and Centennial (10 classroomsinstead of 7) are based on new information that the building site can accommodate a largerbuilding. Both Centennial and Pioneer need 8 and 9 classrooms respectively; so a 7 classroombuilding was always smaller than was needed. At Centennial we originally anticipated needing toremove two portables in order to build the mini-building. At this time, it appears that we need only remove 1 portable. Ultimately the district can remove more, but as a policy decision, not as a requirement to build.
The new larger buildings may cost $3.1 million more than is budgeted. However, this is a preliminary number, and may be lower if the district builds all five at once by bidding forconstruction with one contractor, and the district will save resources by designing 1 building of 10classroom instead of designing 1 building of 11 and 1 building of 7 classrooms.
4. Olympia High School: Reduce Reliance on Portables with a Permanent BuildingWhile there are still many physical improvements that need to be made at Olympia High School
30

(HS), one of the greatest needs that the Planning Advisory Committee (PAC) identified in 2010is the replacement of 10 portables with permanent space. District informal guidelines targets1,800 students is the desired maximum enrollment that Olympia HS should serve. These 10portables, while temporary capacity, are part of the high school’s capacity for that manystudents. The PAC’s recommendation was that these portables should be replaced with a newpermanent building and they considered some options with respect to the kinds of spaces thatnew permanent area should include: a. Replicate the uses of the current portables in new permanent space. b. Build new area that operates somewhat separate from the comprehensive HS to offer a
new model. c. Build new area that is complimentary to the comprehensive high school, but a distinction
from current educational model (if the current educational model has a high proportionof classrooms to specialized spaces, build new area with primarily specialized spacefollowing some of the themes the PAC considered for future learning environments,including: • Demonstrate a place for 21st century learning. • Retain students who are leaving for alternative programs at college or skills centers. • Partner with colleges to deliver advanced services. • Create a culture that equalizes the disparity between advanced students and those still
needing remediation without holding either group back. • Individualized and integrated assisted by personal mobile technology, a social, networked
and collaborative learning environment. • A place where students spend less of their time in classes, the rest in small group and
individual project work that contributes to earning course credits. • All grades, multi grade classes. • Art and science blend. • Convert traditional shops to more contemporary educational programs, environmental
science, CAD/CNC manufacturing, health careers, biotechnology, material science, greeneconomy/energy & waste, etc.
• More informal learning space for work done on computers by small teams and individuals.
• Collaborative planning spaces, small conference rooms with smart boards. • A higher percentage of specialized spaces to classroom/seminar spaces. • Focus on labs (research), studios (create) and shops (build) learn core subjects through
projects in these spaces. (cross-credit for core subjects). • Blend with the tech center building and curriculum. • Consider the integration of specialized “elective” spaces with general education. All
teachers contribute to integrated curriculum. • Provide a greater proportion of area in the school for individual and small group project
work. • Support deep exploration of subjects and crafting rich material and media, support
inquiry and creativity.
Music and science programs are strong draws to Olympia High School, which also offers anAP curriculum. Conversation with school leaders found support for the idea of includingmore specialized spaces in the new building. Some of the suggested programs include: • More science, green building, energy systems, environmental sciences.
31

• Material sciences and engineering. • Art/technology integration, music, dance, recording. • Stage theater, digital entertainment. • Need place for workshops, presentations, poetry out loud.
An idea that garnered support was to combine the development of a new building with thespaces in the school’s Tech Building, a relatively new building on campus, detached from the rest of the school. The Tech Building serves sports medicine, health career technician, biotechnology and microbiology. It also has a wood shop that is used only two periods/per dayand an auto shop that is not used all day so alternative uses of those spaces should be considered.
A new building could be added onto the east side of the Tech Building to form a more diversecombination of learning settings that blend art and science.
Enrollment projections show that Olympia High School will exceed 1,800 students in the futureby more than 400 students later in the 15 year planning horizon. A new building could servealternative schedules, morning and afternoon sessions to double the number of students servedby the building. A hybrid online arrangement could serve more students in the Olympia HSenrollment area without needing to serve more than 1,800 students on site at any given time. If the combination of the Tech Building and this new addition was operated somewhat autonomously from the comprehensive high school, alternative education models could be implemented that would draw disaffected students back into learning in ways that engage themthrough more “hands on” experiential education.
5. Capital High School Modernization and STEM PathwayCapital High School has received three major phases of improvements over the last 15 years,but more improvements remain, particularly on the exterior of the building. The majority of thefinishes on the exterior are from the original construction in 1975, approaching 40 years ago.Most of the interior spaces and systems have seen improvements made, but some changes forcontemporary educational considerations can still bring improvement.
One of the primary educational considerations the Planning Advisory Committee (PAC) exploredis driven by the creation of the new Jefferson Advanced Math and Science (JAMS) program,which is centered around Science, Technology, Engineering and Math (STEM) programs, andthe need to provide a continuing pathway for STEM students in that program who will later attend Capital HS. Relatively small improvements can be made to Capital HS that relate to STEM education and also support Capital High School’s International Baccalaureate (IB) focus as well.
The conversations with the PAC and leaders in the school focused on 21st century skills likecreative problem solving, teamwork and communication, proficiency with ever changing computing, networking and communication/media technologies.
Offering an advanced program at the middle school was the impetus for the new JAMS program.Career and Technical Education (CTE) is changing at Capital HS to support STEM education and accommodate the students coming from Jefferson. Math and science at Capital HS wouldbenefit from more integration. Contemporary CTE programs are transforming traditional shop programs like wood and metal shop into engineering, manufacturing and green buildingtechnologies. Employers are looking for graduates who can think critically and problem solve;
32

mapping out the steps in a process and knowing how to receive a part, make their contributionand hand it off to the next step in fabrication. Employers want good people skills; collaboratingand communicating well with others. Increasingly these skills will be applied working with colleagues in other countries and cultures. Global awareness will be important. JAMS at the middle school level, and STEM and IB at high school level can be a good fit in this way.
The JAMS curriculum is a pathway into IB. The school is adjusting existing programs to accommodate IB programs. The JAMS program supports the Capital HS IB program throughthe advanced nature of the curriculum. 60 students are currently enrolled in IB and it wasrecently affirmed as a program the district would continue to support. The advanced nature ofthe JAMS program could increase enrollment in the Capital HS IB program. Leaders in the school intend that all students need to be part of this science/math focus.
Capital High School is intentional about connecting to employers and to people from other cultures through distance learning. The district is working with Intel as a partner, bringingengineers in and having students move out to their site for visits and internships. Currentlythere is video conferencing in Video Production studio space. College courses can be broughtinto the high school, concentrating on courses that are a pathway to the higher education. Thedistrict is already partnering with universities on their engineering and humanities programs toprovide university credits; like with St. Martins University on CADD and Robotics. The University of Washington is interested in offering university credit courses at the high school inforeign language, social studies and English. Comcast is on the advisory committee for communicationtechnologies.
The development recommendation for Capital High School is to remodel the classroom pods tobring back the open collaborative learning areas in the center of each pod. The more mobilelearning assistive technologies like laptops and tablet computers, with full time access to anetwork of information and people to collaborate with are changing the way students can engage with the course material, their teachers and their peers. Further development is alsorecommended in the shops and adjacent media/technology studios. Minor renovations in thesespaces can greatly enhance their fitness for supporting the contemporary JAMS initiatives. Thebuilding area of these interior renovations is estimated to be 10% of the total building area.
Extensive renovation of the original exterior walls, windows, doors and roof areas that have notbeen recently improved is the other major component of this development recommendation.
6. Build a Theater sized for the Student-body of Capital High SchoolIn 2000 when Capital High School was partially remodeled, construction costs were escalatingand a decision had to be made to address a too-small cafeteria and commons area. At the time,the available solution was to reduce the theater by 200 seats. As the school has grown, and willgrow further in the next 10 years, the reduced-size theater is now too small for the school. Thetheater cannot hold even one class of students, and can barely hold an evening performance forthe Jefferson or Marshall Middle School orchestra, choir or band.
Remodeling the current theater was designed and priced. The cost of the remodel is as much asbuilding a new theater and the remodeled theater would have several deficiencies. (In order toremodel the theater, the roof would need to be raised and the commons reduced.)
Therefore, the administration is recommending the construction of a new theater on the south-side of the gyms. The new theater will have 500 seats, 200 more than the current theater.
7. Avanti High SchoolThrough the master plan process in 2010 and 2015, the district affirmed the importance of
33
Avanti High School and directed that the master plan include options for the future of theschool. Avanti has changed its intent in recent years to provide an arts-based curriculum delivery with an entrepreneurial focus. Enrollment will be increased to 250 students with greater outreach to middle school students in the district who may choose Avanti as an alternativeto the comprehensive high schools, Olympia and Capital High Schools. The school appreciatesits current location, close proximity to the arts and business community downtown and the partnership with Madison Elementary School.
The six classrooms in the building are not well suited to the Avanti curriculum as it is developingand hinder the growth of the school. The settings in the school should better reflect the disciplines being taught through “hands on” learning. The school integrates the arts as a way tolearn academic basics. Avanti creates a different learning culture through personalizing education, focuses on depth over breadth, and teaches good habits of the heart and mind. Students come together in seminars, so space is needed for “town hall” communication sessions.The auditorium does not work well for the town hall sessions; it is designed for presentations ofinformation to an audience and seating impedes audience participation--the school needs moreoptions.
Recently Avanti has expanded by two classrooms and Knox Administrative space has beenreduced.
Facility Options Considered: • Take over the Knox Center, move administration to another location, • Expand on the Knox Center site in the district warehouse space, move warehouse to the
transportation site, or • Find a new site for the school, either leased space or on district-owned property.
Twelve learning settings were identified as an appropriate compliment of spaces with the intentfor them all to support teaching visual and performing arts:
1. Drama (writing plays, production) 2. Music/recording studio (writing songs) 3. Dance (math/rhythm) 4. Painting/drawing 5. Three dimensional art (physical & digital media, game design) 6. Photography/video/digital media (also support science & humanities) 7. Language arts 8. Humanities 9/10. Math/math11/12. Science/science
Additional support spaces: special needs, library, independent study, food service, collaborativestudy areas, administration/counselors, community partnerships.
This development recommendation proposes that Avanti High School move into the entire KnoxBuilding, including the district warehouse space. Light renovation of the buildings would create
34

appropriate space of the kind and quality that the curriculum and culture of the school need.
District administration would move to a facility where the office environment can be arranged ina more effective and space efficient manner and the warehouse is sufficient to eliminate the needfor leased warehouse space. The Knox Building would return to full educational use. This optionwas seen by the 2010 Planning Advisory Committee to be the most cost effective alternative.
The long-term growth of Avanti High School is also seen as a way, over time, to relieve thepressure of projected enrollment growth at Olympia High School.
The 2015 Facility Advisory Committee also supported the expansion of Avanti, regardless ofwhether or not the school would ultimately reduce enrollment pressure at Olympia or CapitalHigh Schools. The administration recommendation is to budget $9.9 million to remodel the 2nd and 3rd floorsof the Knox building, expanding Avanti by about 12 classrooms. At this time the recommendationdoes not include a remodel of the current warehouse, as this is cost prohibitive. If fewer upgradesare necessary in the main building, then the district will consider updating the warehouse for morecareer and technical education options.
8. Renovate Playfields to Improve Safety and Playability Based on FAC support for improved fields and playgrounds, the district is recommendingthe installation of 2 turf fields and renovation of an additional 8 fields. The cost is estimated at $6.9 million. Specifically, the district recommends the following improvements:
a) North Street field at OHS: renovate the field with installation of new sod. b) Henderson Street field at OHS: install a synthetic turf field, low level lighting and
minor fencing.c) Football/soccer field at CHS: install a synthetic turf field, low level lighting and minor
fencing.2
d) Jefferson, Marshall and Reeves field: renovate the field with sod.e) Lincoln: renovate the playfield with seed and improve the playground. f) Centennial, McLane and Roosevelt: renovate the fields with seeds (after remodel of the
buildings).
9. Invest in Electronic Key Systems to Limit Access to Schools and Instigate Lockdowns
The district is recommending the investment of $2 million in key systems across the district,targeting schools that have not been upgraded as part of a remodel.
2 The administrative recommendation for turf fields includes low-level lighting and fencing for each; lighting/fencing is included to extend play hours to off-set the higher expense of a turf field (with natural in-fill). The CHS football and Henderson turf field with natural in-fill and lighting and fencing will cost $3.3 million. If the hours cannot be extended with lighting, the administrative recommendation is to renovate the Capital football and Henderson fields with improved drainage and new sod, instead of turf, and use the remaining resources to renovate the Capital soccer, Washington, Jefferson, and Marshall fields (drainage/sod) and running tracks. This alternative increases the hours-of-play available generally in the community as these fields are generally considered less “playable” in their current state. Improved drainage and new sod at the Henderson field, Washington, and CHS football and soccer fields, and drainage, sod and improve running tracks at Jefferson and Marshall fields would cost $3 million; roughly the same as the two turf fields.
35

10. Address Critical Small Works and HVAC or Energy-Improvement ProjectsThe district will pursue state of Washington energy grants for a portion of a total investment of $8.5 million.
In addition, the small works roster is summarized below. The roster represents the facilitiesprojects that must be undertaken in the near future. While we have attempted to plan for a sixyear small- works list, the new items may be identified during the life of the CFP.
Improve and upgrade: • parking lots and paving at five schools; • drainage and controls, and/or repair foundations at five schools/sites; • electrical service and new fire or intrusion alarm systems at four schools, security cameras
at multiple schools, access controls at multiple schools and perimeter fencing at fiveschools;
• roofing at three schools, install roof tie-off safety equipment at multiple sites, and caulkand/or paint and renovate siding at four sites;
• gutter systems at two schools; • interior and classroom capital improvements at twelve sites; and • wiring and electrical systems at two sites.
In addition, the district Board of Directors will determine the next steps for the John Rogersbuilding. This building has been in service for 50 years and requires significant upgrades. In the upcoming six-year period the district will either demolish the building (and seed the field), orthe district will perform small repairs to decommission the building for possible use at a latertime (when Roosevelt or other buildings are being remodeled
Utilization of Portables as NecessaryThe CFP continues to include expenditures for portables, as these represent a foundation investment where enrollment is faster than expected. Portables are considered to be a last-resort and are utilized where other options are not possible.
Capital Facilities Plan (CFP) Project Revisions for Class Size ReductionsTable J below describes several components of the CFP analysis. First, the table describes therecommended construction built into the district’s facilities plan. The second column identifies if the project is included in the Impact Fee Calculation; the third column identifies the reasonthe project is included or not.
36

Table J: CFP Considerations Included in
Project 2017
Impact Reason
Fee? CentennialElementary
School Yes This project adds seating capacity for 189 students.
Roosevelt Elementary School No This project adds seating capacity for 189 students.
McLaneElementary Yes This project adds seating capacity for 189 students. HansenElementary
School Yes This project adds seating capacity for 189 students.
PioneerElementary School Yes This project adds seating capacity for 189 students.
Olympia High School Yes This project will add capacity to accommodate additional growth of 176
students.
Portables No The plan includes the cost of 5 portables but these are a second priority to
mini-buildings. Capital High School
Modernization No Plans re: adding capacity to CHS are not yet determined.
Avanti High School No This project will add capacity, but may be completed beyond the timeframe of the 2015 CFP.
Cost of Converting Portables to Permanent ConstructionFurther, the value of converting a portable into permanent construction is included in full in thecalculation of the impact fee. This bears further explanation. The impact fee calculation isbased on construction costs (costs that are within the timeframe of the CFP) associated withgrowth, divided by the number of growth/seats/students. So, if the CFP includes a plan toconstruct a $10 million structure to house 100 students; and 90 students are generated by newhousing/developments, then the per student cost of construction to accommodate growth is$90,000 (($10,000,000/100)*(90/100) = $90,000). This is the amount that is included in the calculation of the impact fee. Even if the new building replaces 50 portable seats, the calculationis the same: what is the cost of planned construction, and what proportion is associated with seats needed to accommodate growth, and therefore, what is the per growth seat cost of construction regardless of prior use of portables?
The number of students expected to be driven by growth is the key factor (90 in this example).The student growth must be based on upcoming growth and cannot be based on prior growth(from the example above, it could not be based on 50 + 90). It is important to note from that,regardless of the number of portables being converted, a proportional cost of a $6.5 million mini-building is included based on expected growth; portable conversion is not deducted from thecalculation.
37

IV. Finance Plan
Impact Fees
Impact fees are utilized to assist in funding capital improvement projects required to serve newdevelopment. For example, local bond monies from the 1990 authority and impact fees wereused to plan, design, and construct Hansen Elementary School and Marshall Middle School.The district paid part of the costs of these new schools with a portion of the impact feescollected. Using impact fees in this manner delays the need for future bond issues and/orreduces debt service on outstanding bonds. Thurston County, the City of Olympia and the Cityof Tumwater all collect school impact fees on behalf of the district.
Impact fees must be reasonably related to new development and the need for public facilities.While some public services use service areas or zones to demonstrate benefit to development,there are four reasons why the use of zones is inappropriate for school impact fees: 1) theconstruction of a new school benefits residential developments outside the immediate servicearea because the new school relieves overcrowding in other schools; 2) some facilities andprograms of the district are used by students throughout the district (Special Education, Optionsand PATS programs); 3) school busing is provided for a variety of reasons including specialeducation students traveling to centralized facilities and transportation of students for safetyor due to distance from schools; 4) uniform system of free public schools throughout the districtis a desirable public policy objective.
The use of zones of any kind, whether municipal, school attendance boundaries, or some othermethod, conflict with the ability of the school board to provide reasonable comparability inpublic school facilities. Based on this analysis, the district impact fee policy shall be adoptedand administered on a district-wide basis.
Current impact fee rates, current student generation rates, and the number of additional singleand multi-family housing units projected over the next six year period are sources of information the district uses to project the fees to be collected.
These fees are then allocated for capacity-related projects as recommended by a citizens’ facilities advisory committee and approved by the Board of Directors.
The fee calculation is prescribed by law: • The calculation is designed to identify the cost of the need for new classrooms space for new
students associated with new development. • The cost of constructing classrooms for current students is not included in the impact fee
calculation. • The calculation includes the cost of sit acquisition costs, school construction costs, any costs
for temporary facilities. o Facility Cost / Facility Capacity = Cost per Seat / Student Generation Rate = Cost per
Single Family Home (or Cost per Multi-family Home). o The Cost per Single Family Home is then discounted for 1) any state construction
funding the district receives and 2) a credit for the taxes that the home will generatefor the upcoming 10 years.
38

o In this example, a $15,000,000 facility, and a .20 single-family home student generation rate is calculated as such: $15,000,000 / 500 = $30,000 * .20 = $6,000. This $6,000 is then reduced by state construction funds ($9 per home in $2015) and a 10-year tax credit ($1,912 in 2015). This leaves a single family home rate of $4,079 (example amount only).
o The Olympia School District Board of Directors would then reduce the $4,079 by a“discount rate”. This is the margin that districts use to ensure that they do not collecttoo much impact fee (and possibly pay back part of the fees if construction costs arereduced or state construction funding is increased.) The Olympia School District hastypically used a discount rate of 15%, which would leave a single family home impactfee of $3,467 ($4,079 * .85).
The prescribed calculation, the district’s construction plan in the CFP planning horizon, expectedstate revenue and expected taxes credited to new housing developments yield an impact fee asfollows:
2017 Single Family Home $5,298 $58 increase over 2016 2017 Multi-Family Home $2,520 $22 increase over 2016
The Table K on the following page identifies the historical impact fees.
39

Table K: Historical Impact Fees
Single Multi- Downtown Discount Family Family Residence Mobile Home
Year Percentage Home Fee Home Fee Fee Fee
1992 67 $894 $746 $791 1993 67 $1,703 $746 $791 1994 55 $1,717 $742 $1,385 1995 70 $1,754 $661 $1,033 1996 52 $1,725 $661 $1,176 1997 51 $1,729 $558 1998 56 $1,718 $532 1999 50 & 70 $2,949 $1,874 2000 50 & 70 $2,949 $1,874 2001 50 & 70 $2,949 $1,874 $841 2002 50 & 70 $2,949 $1,874 $841 2003 50 & 70 $2,949 $1,874 $841 2004 50 & 70 $2,949 $1,874 $841 2005 40 & 60 $4,336 $3,183 $957 2006 45 & 60 $4,336 $3,183 $957 2007 15 $5,042 $1,833 $874 2008 15 $5,042 $1,833 $0 2009 15 $4,193 $1,770 $0 2010 15 $2,735 $1,156 $0 2011 15 $659 $1,152 $0 2012 15 $2,969 $235 $0 2013 15 $5,179 $0 $0 2014 15 $5,895 $1,749 $0 2015 15 $4,978 $1,676 $0 2016 15 $5,240 $2,498 $0 2017 15 $5,298 $2,520
Prior 10-Yr Avg $4,206 $1,553 10-Yr Avg Incl 2016 $4,219 $1,459
Eligibility for State Funding Assistance The district is currently in the process of applying for state construction funding assistance. Based on eligibility criteria, and experience obtaining funding for the remodel of Garfield Elementary, we estimate that the district will qualify for at least $12 million for the remodel ofCentennial, McLane, and Roosevelt Elementary Schools. This is a conservative estimate, as the district qualified for about $6 million for the Garfield remodel.
Bond Revenue The primary source of school construction funding is voter-approved bonds. Bonds are typicallyused for site acquisition, construction of new schools, modernization of existing facilities and other capital improvement projects. A 60% super-majority voter approval is required to pass abond. Bonds are then retired through the collection of local property taxes. Proceeds from bondsales are limited by bond covenants and must be used for the purposes for which bonds areissued. They cannot be converted to a non-capital or operating use. As described earlier, the vastmajority of the funding for all district capital improvements since 2003 has been local bonds.
$0 Proposed
40

The projects contained in this plan exceed available resources in the capital fund, and anticipated School Impact and Mitigation Fee revenue. The Board of Directors sold bonds inJune 2012, allowing an additional $82 million in available revenue for construction projects.
Further, the amount of the requested 2012 bond will not fully cover the anticipated projectsthrough 2019, described above. The Board of Directors will likely submit an additional BondingAuthority request during the period covered by this CFP, but as of September 2015, the Boardhas not yet finalized action on a February 2016 request to voters. As of this drafting, the financeplan assumes that the Board will request voter approval of $161 million in construction bondauthority for the February 2016 election.
Current Balance in Capital FundThe finance plan for this schedule of capital plan is heavily dependent on the current balance inthe district’s Capital Fund. The balance of $42.2 million is made up of many sources, but 2main sources. First, in 2012 voters approved bond resources for construction of an IntermediateSchool. Construction of the school has not been undertaken due to a lag in enrollment andlisting of an endangered species on the property. The district is working through a HabitatConservation Plan, to gain the ability to build on the property. However, the most recent citizen’s planning committee (FAC discussed earlier) has recommended that this school not bebuilt. Therefore, the $28 million in bond resources have been preserved and are available to bedevoted to this project. Second, the district successfully qualified for state construction assistance of $10 million for the construction of ORLA and remodel of Garfield. These resources are preserved. The balance of resources are a combination of impact fees, mitigation fees, and asmall amount of capital levy funds.
41
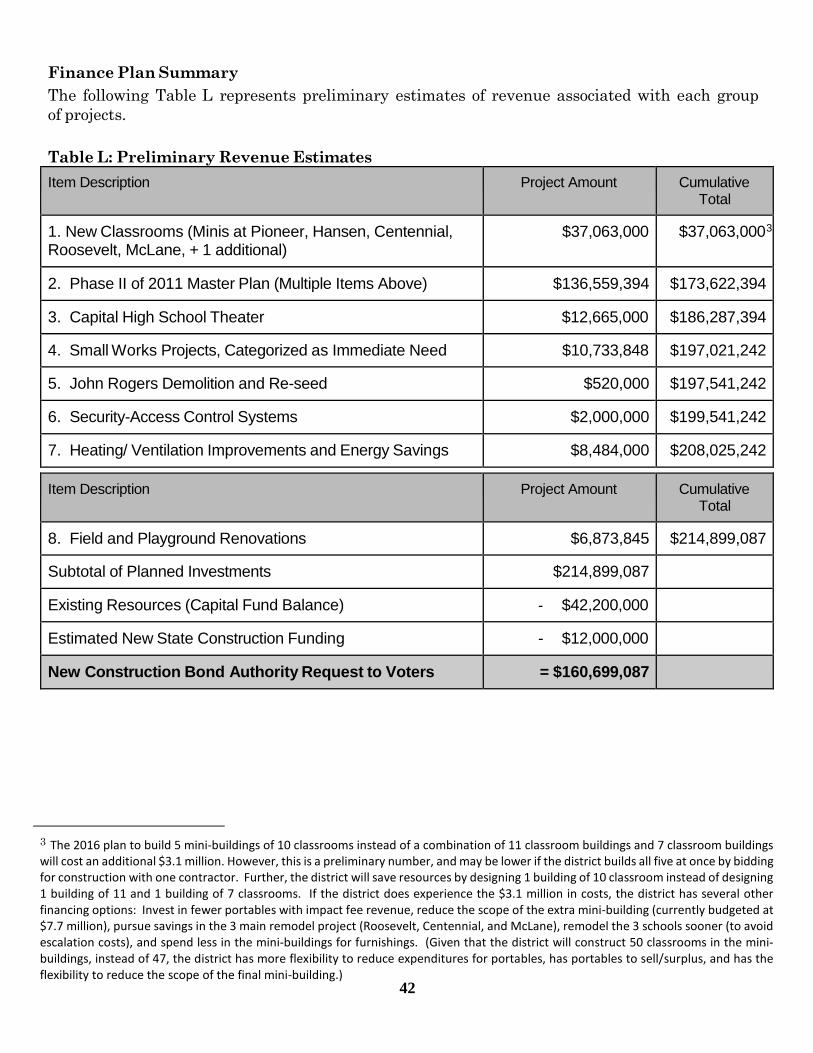
Finance Plan Summary The following Table L represents preliminary estimates of revenue associated with each groupof projects.
Table L: Preliminary Revenue Estimates Item Description Project Amount Cumulative
Total
1. New Classrooms (Minis at Pioneer, Hansen, Centennial, Roosevelt, McLane, + 1 additional)
$37,063,000 $37,063,0003
2. Phase II of 2011 Master Plan (Multiple Items Above) $136,559,394 $173,622,394
3. Capital High School Theater $12,665,000 $186,287,394
4. Small Works Projects, Categorized as Immediate Need $10,733,848 $197,021,242
5. John Rogers Demolition and Re-seed $520,000 $197,541,242
6. Security-Access Control Systems $2,000,000 $199,541,242
7. Heating/ Ventilation Improvements and Energy Savings $8,484,000 $208,025,242
Item Description Project Amount Cumulative Total
8. Field and Playground Renovations $6,873,845 $214,899,087
Subtotal of Planned Investments $214,899,087
Existing Resources (Capital Fund Balance) - $42,200,000
Estimated New State Construction Funding - $12,000,000
New Construction Bond Authority Request to Voters = $160,699,087
3 The 2016 plan to build 5 mini-buildings of 10 classrooms instead of a combination of 11 classroom buildings and 7 classroom buildings will cost an additional $3.1 million. However, this is a preliminary number, and may be lower if the district builds all five at once by bidding for construction with one contractor. Further, the district will save resources by designing 1 building of 10 classroom instead of designing 1 building of 11 and 1 building of 7 classrooms. If the district does experience the $3.1 million in costs, the district has several other financing options: Invest in fewer portables with impact fee revenue, reduce the scope of the extra mini-building (currently budgeted at $7.7 million), pursue savings in the 3 main remodel project (Roosevelt, Centennial, and McLane), remodel the 3 schools sooner (to avoid escalation costs), and spend less in the mini-buildings for furnishings. (Given that the district will construct 50 classrooms in the mini-buildings, instead of 47, the district has more flexibility to reduce expenditures for portables, has portables to sell/surplus, and has the flexibility to reduce the scope of the final mini-building.)
42
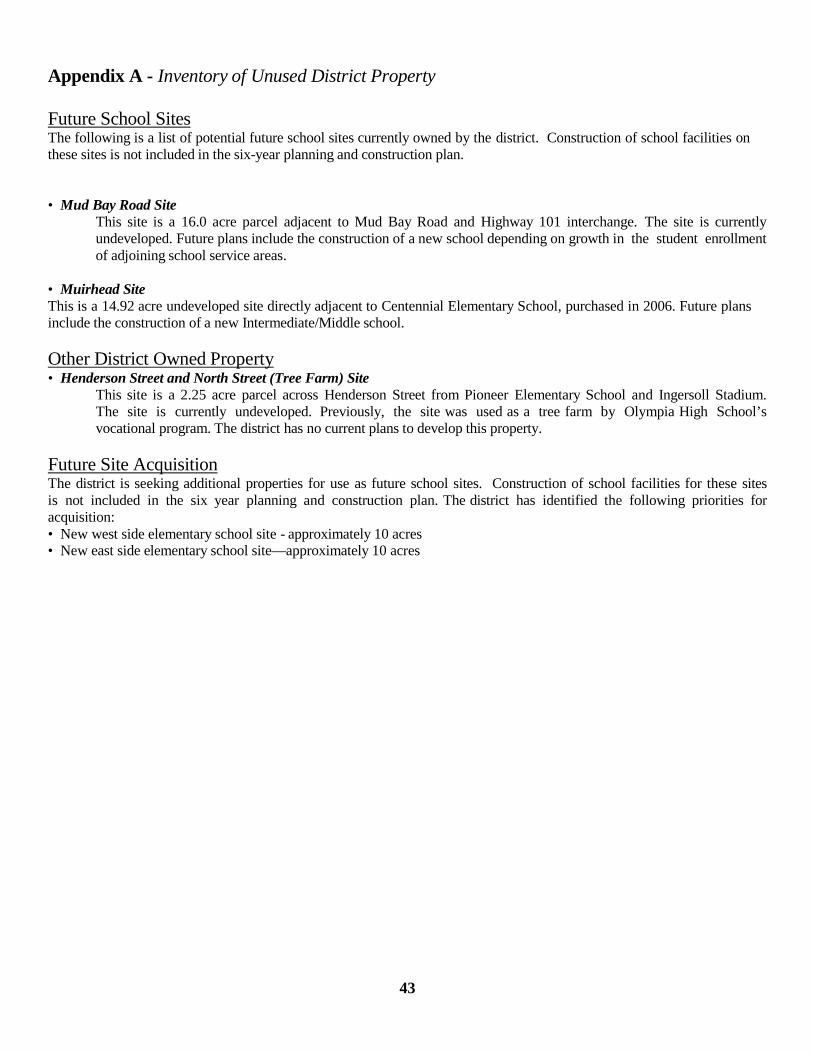
Appendix A - Inventory of Unused District Property
Future School Sites The following is a list of potential future school sites currently owned by the district. Construction of school facilities on these sites is not included in the six-year planning and construction plan.
• Mud Bay Road Site This site is a 16.0 acre parcel adjacent to Mud Bay Road and Highway 101 interchange. The site is currently undeveloped. Future plans include the construction of a new school depending on growth in the student enrollment of adjoining school service areas.
• Muirhead Site This is a 14.92 acre undeveloped site directly adjacent to Centennial Elementary School, purchased in 2006. Future plans include the construction of a new Intermediate/Middle school.
Other District Owned Property • Henderson Street and North Street (Tree Farm) Site
This site is a 2.25 acre parcel across Henderson Street from Pioneer Elementary School and Ingersoll Stadium. The site is currently undeveloped. Previously, the site was used as a tree farm by Olympia High School’s vocational program. The district has no current plans to develop this property.
Future Site Acquisition The district is seeking additional properties for use as future school sites. Construction of school facilities for these sites is not included in the six year planning and construction plan. The district has identified the following priorities for acquisition: • New west side elementary school site - approximately 10 acres • New east side elementary school site—approximately 10 acres
43

Appendix B - Detail of Capital Facilities Projects
Elementary School Modernization Grades K-4 ProjectName: CentennialElementarySchool
Modernization
Location: 2637 45th Ave SE, Olympia
Site: 11.8 acres
Capacity: 357 students (189 seats new student capacity) (New Lower Utilization Standard)
Square Footage: 45,345 s.f.
Cost: Total project: $27.9 million, including a $6.5 million mini-building of 10classrooms and a $800,000 field renovation.
ProjectDescription: Major modernization of existing school facility. Modernization work will include all new interior finishes and fixtures, furniture and equipment, as well as exterior finishes.
Status: Subject to bond approval, the district anticipates this facility will be available in 2019.
Elementary School Modernization Grades K-5 ProjectName: McLane ElementarySchool
Modernization
Location: 200 Delphi Road SW, Olympia
Site: 8.2 acres
Capacity: 310 students (189 seats new student capacity) (New Lower Utilization Standard)
Square Footage: 45,715 s.f.
Cost: Total project: $23.5 million, including a $6.5 million mini-building of 10 classroomsand a $700,000 field renovation.
ProjectDescription: Major modernization of existing school facility. Modernization work will include all new interior finishes and fixtures, furniture and equipment, as well as exterior finishes.
Status: Subject to bond approval, the district anticipates this facility will be available in 2019.
44

Elementary School Modernization Grades K-5 ProjectName: RooseveltElementarySchool
Modernization
Location: 1417 San Francisco Ave NE , Olympia
Site: 6.4 acres
Capacity: 386 students (189 seats new student capacity) (New Lower Utilization Standard)
Square Footage: 47,616 s.f.
Cost: Total project: $22.4 million, including a $6.5 million mini-building of 10 classroomsand $800,000 field renovation.
ProjectDescription: Major modernization of existing school facility. Modernization work will include all new interior finishes and fixtures, furniture and equipment, as well as exterior finishes.
Status: Subject to bond approval, the district anticipates this facility will be available in 2020.
High School Modernization Grades 9-12 Project Name: Capital High School
Modernization
Location: 2707 Conger Ave NW, Olympia
Site: 40 acres
Capacity: 1,496 students (new student capacity not yet determined) (Current Utilization Standard)
Square Footage: 254,772 s.f.
Cost: Total project: $20.6 million
ProjectDescription: Modify classroom pod areas and other portions of the existing school in order tosupport educational trends and students matriculating from the Jefferson Advanced Math and Science program. Replace older failing exterior finishes and roofing.
Status: Subject to bond approval, the district anticipates this facility will be available in 2021.
45

High School Addition Grades 9-12 ProjectName: OlympiaHigh School
Addition / portable replacement
Location: 1302 North Street SE, Olympia
Site: 40 acres
Capacity: will limit to 1,811 students; adds 280 permanent seats, which is 70 new seating/student capacity
(Current Utilization Standard)
Square Footage: 233,960 s.f.
Cost: Total project: $24.3 million
ProjectDescription: Provide additional permanent building area to replace ten portable classrooms.Support educational trends with these new spaces.
Status: Subject to bond approval, the district anticipates this facility will be available in 2020.
Elementary School Expansion Grades K-5 ProjectName: Pioneer and Hansen Elementary Schools
Capacity: Replace portables with new two-story structures at each school. Adds 189 studentseats to each school to address new capacity of 82 students needed at Pioneer and 67 students needed at Hansen.
Cost: Each structure will cost $6.5 million. Pioneer costs associated with growth and therefore, impact fees, total $2.1 million; Hansen growth costs total $700,000.
Status: Subject to bond approval, the district anticipates this facility will be available in 2019.
46

High School Addition/Admin. Center Grades 9-12 ProjectName: Avanti High School
Addition & Modernization & Re-location of district Administrative Center
Location: Avanti HS: 1113 Legion Way SE, Olympia (currently located on 1st floor of district
AdministrativeCenter
DistrictAdministrativeCenter: To be determined
Site: Avanti HS: 7.5 acres
Capacity: Avanti HS: Will limit to 250 students (Current Utilization Standard)
District Administrative Center: To be determined
Square Footage: Avanti HS: 78,000 s.f.
District Administrative center: To be determined
Cost: Avanti HS : Total project: $9.9 million District Administrative Center: Estimated $7.8 million
ProjectDescriptions: Avanti HS: Expand Avanti High School by allowing the school to occupy all three floors of the District Administrative Center. Expanding the school will allow additional programsand teaching and learning options that might not be available at the comprehensivehigh schools.
District Administrative Center: Provide a new location for administrative offices somewhere in the downtown vicinity.
Status: Subject to bond approval, the district anticipates this facility will be available in 2020.
47

Appendix C - SF and MF Impact Fee Calculations
SCHOOL IMPACT FEE CALCULATIONS
DISTRICT Olympia School District YEAR 2017 - SF and MF Residence
School Site Acquisition Cost: ((AcresxCost per Acre)/Facility Capacity)xStudent Generation Factor
Student Student Facility Cost/ Facility Factor Factor Cost/ Cost/ Acreage Acre Capacity SFR MFR SFR MFR
Elementary 10.00 $ - 400 0.309 0.119 $0 $0 Middle 20.00 $ - 600 0.127 0.059 $0 $0 High 40.00 $ - 1,000 0.158 0.057 $0 $0
TOTAL $0 $0
School Construction Cost: ((Facility Cost/Facility Capacity)xStudent Generation Factor)x(permanent/Total Sq Ft)
Student Student %Perm/ Facility Facility Factor Factor Cost/ Cost/ Total Sq.Ft. Cost Capacity SFR MFR SFR MFR
Elementary 95.00% $ 10,377,922 339 0.309 0.119 $8,987 $3,461 Middle 95.00% 210 0.127 0.059 $0 $0 High 95.00% $ 7,581,451 176 0.096 0.039 $3,929 $1,596
TOTAL $12,915 $5,057
Temporary Facility Cost: ((Facility Cost/Facility Capacity)xStudent Generation Factor)x(Temporary/Total Square Feet)
Student Student Cost/ Cost/ %Temp/ Facility Facility Factor Factor SFR MFR Total Sq.Ft. Cost Size SFR MFR
Elementary 5.00% $ 250,000 25 0.309 0.119 $155 $60 Middle 5.00% $ - 0 0.127 0.059 $0 $0 High 5.00% $ - 0 0.096 0.039 $0 $0
$155 $60
State Matching Credit: Boeckh Index X SPI Square Footage X District Match % X Student Factor
Student Student Boeckh SPI District Factor Factor Cost/ Cost/ Index Footage Match % SFR MFR SFR MFR
Elementary $ 206.76 90 52.24% 0.309 0.119 $3,004 $1,157 Middle $ 206.76 108 0.00% 0.127 0.059 $0 $0 High $ 206.76 130 0.00% 0.096 0.039 $0 $0
$3,004 $1,157
Tax Payment Credit: SFR MFR Average Assessed Value $298,580 $77,512 Capital Bond Interest Rate 3.71% 3.71% Net Present Value of Average Dwelling $2,457,095 $637,867 Years Amortized 10 10 Property Tax Levy Rate $1.5600 $1.5600
Present Value of Revenue Stream $3,833 $995
Fee Summary: Single Multi-Family Family
Site Acquistion Costs $0 $0 Permanent Facility Cost $12,915 $5,057 Temporary Facility Cost $155 $60 State Match Credit ($3,004) ($1,157) Tax Payment Credit ($3,833) ($995)
FEE (AS CALCULATED) $6,233 $2,964
FEE (AS DISCOUNTED 15%) $5,298 $2,520
48

,Lis u Olympia School District
RESOLUTION 552
CAPITAL FACILITIES PLAN 2017-2022
WHEREAS, the Olympia School District No. 111 (the "District") is responsible for providing public educational
services at the elementary, middle and high school levels to students now residing or who will reside in the District,
and;
WHEREAS, new residential developments have major impacts on the public school facilities in the District,
and;
WHEREAS, the District is often unable to fund and construct permanent school facilities to keep pace with
the rate residential developments are constructed, and;
WHEREAS, the intent of the Legislature in enacting the Growth Management Act (the "GMA") is to ensure
that adequate facilities are available to serve new growth and development, and;
WHEREAS, the GMA authorizes impact fees in order to provide an additional source of revenue for financing
public facilities, and;
WHEREAS, the GMA authorizes counties, cities and towns to impose school impact fees on behalf of school
districts, and;
WHEREAS, the District desires to cooperate with the cities of Olympia and Tumwater (the "cities") and with
Thurston County in the implementation of the GMA and in the assessment and collection of school impact fees, and;
WHEREAS, the GMA requires impact fees to be imposed through established procedures and criteria, and;
WHEREAS, the GMA requires a schedule of fees for each type of development activity and requires that the
schedule be based upon a formula or other method of calculating such impact fees, and;
WHEREAS, the GMA permits local jurisdictions to provide for an exemption from the payment of impact fees
for low-income housing and other development activities with broad public purposes; and
WHEREAS, the Board of Directors supports such an exemption for low-income housing located within the
District; and
WHEREAS, the District has studied the need for additional school facilities to serve new developments and
has developed a Capital Facilities Plan, and;
WHEREAS, the District has reviewed the cost of providing school facilities and evaluated the need for new
revenues to finance additional facilities, and;
WHEREAS, the District has developed, after extensive study and analysis, a methodology for calculating
school impact fees, and;
Resolution No. 552 Capital Facilities Plan 2017-2022 Page Two
WHEREAS, the results of the study are set forth in the Olympia School District Capital Facilities Plan (the "CFP") 2017-2022, and;
WHEREAS, the CFP provides a schedule of fees for each type of development activity in compliance with the GMA;
NOW, THEREFORE, BE IT RESOLVED by the Board of Directors of the Olympia School District No. 111, Thurston County, Washington, as follows:
That the Board of Directors of the Olympia School District No. 111, hereby adopts the Olympia School District Capital Facilities Plan 2017-2022, which sets forth, among other components, the need for district capital projects, the cost of providing school facilities, the need for new revenues to finance additional facilities, the methodology for calculating school impact fees, and a schedule of fees for each type of development activity as required by the GMA; and,
That the Board of Directors of the Olympia School District No. 111 requests the cities of Olympia and Tumwater, and Thurston County, to adopt the CFP as the basis for imposing school impact fees within the cities of Olympia and Tumwater, and in Thurston County; and,
That the Board of Directors of the Olympia School District No. 111 requests the cities of Olympia and Tumwater to provide for an exemption from the payment of school impact fees for low-income housing, and that Thurston County include such an exemption in a County ordinance adopting school impact fees.
ADOPTED by the Board of Directors of the Olympia School District No. 111, Thurston County, Washington, at an open public meeting thereof, notice of which was given as required by law, held the 1st day of August, 2016, the following Directors being present and voting therefore:
OLYMPIA SCHOOL DISTRICT NO. 111 A municipal corporation of the State of Washington
&(---,MariA. Campeau, resident
AaxL___
Eileen Thomson, V' ent
ta_16.\ ontermini, • 'rector
Attest: len Wilhelm, Director
47ominic G. Cvitanich, Secretary Frank L Wilson, Director
s"nol Growib •
Communication-Achievement-Professional Growth-Safety

DETERMINATION OF NONSIGNIFICANCE
Issued with a 14 day comment and appeals period
Description of Proposal:
This threshold determination analyzes the environmental impacts associated with the following actions, which are so closely related to each other that they are in effect a single course of action:
1. The adoption of the Olympia School District's Capital Facilities Plan 2017-2022 by the Olympia School District No. 111 for the purposes of planning for the facilities needs of the District;
2. The amendment of the Comprehensive Plans of Thurston County, and the Plans of the Cities of Tumwater and Olympia to include the Olympia School District's Capital Facilities Plan 2017-2022 as part of the Capital Facilities Element of these jurisdictions' Comprehensive Plans; and
Proponent: Olympia School District No. 111
Location of the Proposal:
The Olympia School District includes an area of approximately 80 square miles. The City of Olympia and parts of the City of Tumwater and parts of unincorporated Thurston County fall within the District's boundaries.
Lead Agency:
Olympia School District No. 111
The lead agency for this proposal has determined that the proposal does not have a probable significant adverse environmental impact on the environment. An environmental impact statement (EIS) is not required under RCW 43.21C.030(2)(c). This decision was made after a review of the completed environmental checklist and other information on file with the lead agency. This information is available to the public upon request.
This Determination of Nonsignificance (DNS) is issued under WAC 197-11-340(2). The lead agency will not act on this proposal for 14 days from the date of issue. Comments must be submitted before 12:01 p.m., July 27, 2016. The responsible official will reconsider the DNS based on timely comments and may retain, modify, or, if significant adverse impacts are likely, withdraw the DNS. If the DNS is retained, it will be final after the expiration of the comment deadline.
Responsible Official: Ms. Jennifer Priddy, Assistant Superintendent Olympia School District No. 111
Telephone: (360) 596-6120
Address: 1113 Legion Way S.E. Olympia School District, Room 210 Olympia, WA 98501
You may appeal this determination in writing before 12:01 p.m., July 27, 2016, to Ms. Jennifer Priddy, Assistant Superintendent, Olympia School District No. 111, 1113 Legion Way S.E., Olympia, WA, 98501.
Date of Issue: July 7, 2016 Date Published: July 14, 2016

WAC 197-11-960 - Environmental checklist.
ENVIRONMENTAL CHECKLIST – OLYMPIA SCHOOL DISTRICT - CAPITAL FACILITIES PLAN 2017-2022 Purpose of checklist:
The State Environmental Policy Act (SEPA), chapter 43.21C RCW, requires all governmental agencies to consider the environmental impacts of a proposal before making decisions. An environmental impact statement (EIS) must be prepared for all proposals with probable significant adverse impacts on the quality of the environment. The purpose of this checklist is to provide information to help you and the agency identify impacts from your proposal (and to reduce or avoid impacts from the proposal, if it can be done) and to help the agency decide whether an EIS is required.
Instructions for applicants:
This environmental checklist asks you to describe some basic information about your proposal. Governmental agencies use this checklist to determine whether the environmental impacts of your proposal are significant, requiring preparation of an EIS. Answer the questions briefly, with the most precise information known, or give the best description you can.
You must answer each question accurately and carefully, to the best of your knowledge. In most cases, you should be able to answer the questions from your own observations or project plans without the need to hire experts. If you really do not know the answer, or if a question does not apply to your proposal, write "do not know" or "does not apply." Complete answers to the questions now may avoid unnecessary delays later.
Some questions ask about governmental regulations, such as zoning, shoreline, and landmark designations. Answer these questions if you can. If you have problems, the governmental agencies can assist you.
The checklist questions apply to all parts of your proposal, even if you plan to do them over a period of time or on different parcels of land. Attach any additional information that will help describe your proposal or its environmental effects. The agency to which you submit this checklist may ask you to explain your answers or provide additional information reasonably related to determining if there may be significant adverse impact.
Use of checklist for Non-project proposals:
Complete this checklist for Non-project proposals, even though questions may be answered "does not apply." IN ADDITION, complete the SUPPLEMENTAL SHEET FOR NON-PROJECT ACTIONS (part D).
For Non-project actions, the references in the checklist to the words "project," "applicant," and "property or site" should be read as "proposal," "proposer," and "affected geographic area," respectively.
A. BACKGROUND
1. Name of proposed project, if applicable:
The adoption of the Olympia School District's (OSD) 2017-2022 Capital Facilities Plan (CFP) for the purposes of planning for the District's facility needs. The City of Olympia and the City of Tumwater will incorporate the District's CFP into their Comprehensive Plans. Thurston County will also incorporate this Plan into the County's Comprehensive Plan. A copy of the District's CFP is available for review in the District's offices.
2. Name of applicant: Olympia School District No. 111
3. Address and phone number of applicant and contact person: Jennifer Priddy, Assistant Superintendent Olympia School District 1113 Legion Way SE Olympia, WA 98501
4. Date checklist prepared: July 7, 2016
1

5. Agency requesting checklist: Olympia School District is Lead Agency
6. Proposed timing or schedule (including phasing, if applicable): The CFP is scheduled to be adopted by the District on November 2, 2015. After adoption, the District will forward the CFP to the City of Olympia and the City of Tumwater for inclusion in the Comprehensive Plans for these jurisdictions. The District will also forward the CFP to Thurston County for inclusion in the County's Comprehensive Plan. The District will continue to update the CFP annually. The projects included in the CFP have been or will be subject to project-level environmental review when appropriate.
7. Do you have any plans for future additions, expansion, or further activity related to or connected with this proposal? If yes, explain. The CFP sets forth the capital improvement projects that the District plans to implement over the next six years. Some of these plans will be dependent upon the passage of a construction bond proposal to be presented to voters for the February 2016 election. The construction projects proposed include the construction of multiple new classrooms (mini-buildings) district-wide to reduce reliance on the use of portables, and implement state policy to reduce class sizes; modernization and renovation of Centennial, Roosevelt, and McLane Elementary Schools, including construction of an auxiliary gym at Centennial Elementary School; modernization and renovations of portions of the school, including windows, roofing, and exterior siding, and partial flooring and finishes at Capital High School; construction of a theater/performance center at Capital High School; construction of a building of approximately 22 classrooms to reduce reliance on portables and respond to enrollment growth at Olympia High School; renovation and modernization of the Knox Administrative Building for expanded enrollment and/or additional educational uses or programming at Avanti High School; upgrade and improve heating, ventilation and finishes for the Administration; acquire and update land and/or real estate; acquire, construct and/or renovate athletic fields at ten schools for school and community use; install energy saving equipment and/or improve heating and ventilation at thirteen sites; acquire, construct and install parking lots and paving at five schools; acquire, construct and install drainage and controls, and/or repair foundations at five schools/sites; acquire, construct and install electrical service and new fire or intrusion alarm systems at four schools, security cameras at multiple schools, access controls at multiple schools and perimeter fencing at five schools; acquire, construct and install roofing at three schools, install roof tie-off safety equipment at multiple sites, and caulk and/or paint and renovate siding at four sites; acquire and replace gutter systems at two schools; acquire, construct and install systems to control access to schools; acquire, construct and install interior and classroom capital improvements at twelve sites; acquire, construct and install upgraded wiring and electrical systems at two sites; provide for emerging emergency repairs; decommission and/or demolish one building; and acquire, construct and equip portables as necessary to construct and renovate schools and respond to capacity needs.
8. List any environmental information you know about that has been prepared, or will be prepared, directly related to this proposal. The projects included in the CFP have undergone or will undergo additional environmental review, when appropriate, as they are developed.
9. Do you know whether applications are pending for governmental approvals of other proposals directly affecting the property covered by your proposal? If yes, explain.
None known of.
10. List any government approvals or permits that will be needed for your proposal, if known.
2

The District anticipates that the City of Olympia and the City of Tumwater will adopt the CFP into the Comprehensive Plans for these jurisdictions. Thurston County will also adopt the CFP into its Comprehensive Plan.
11. Give brief, complete description of your proposal, including the proposed uses and the size of the project and site. There are several questions later in this checklist that ask you to describe certain aspects of your proposal. You do not need to repeat those answers on this page. (Lead agencies may modify this form to include additional specific information on project description.)
This is a non-project action. This proposal involves the adoption of the OSD CFP 2017-2022 for the purpose of planning the District's facility needs. The District's CFP will be incorporated into the Comprehensive Plans of the City of Olympia and the City of Tumwater. Thurston County will also incorporate the CFP into its Comprehensive Plan. The projects included in the CFP have been or will be subject to project-level environmental review when appropriate. A copy of the CFP may be viewed at the District's offices.
12. Location of the proposal. Give sufficient information for a person to understand the precise location of your proposed project, including a street address, if any, and section, township, and range, if known. If a proposal would occur over a range of area, provide the range or boundaries of the site(s). Provide a legal description, site plan, vicinity map, and topographic map, if reasonably available. While you should submit any plans required by the agency, you are not required to duplicate maps or detailed plans submitted with any permit applications related to this checklist.
The CFP will affect the OSD. The District includes an area of approximately 80 square miles. The City of Olympia and parts of the City of Tumwater and unincorporated Thurston County fall within the District's boundaries. A detailed map of the District's boundaries can be viewed at the District's offices.
B. ENVIRONMENTAL ELEMENTS
1. Earth
a. General description of the site (circle one): Flat, rolling, hilly, steep slopes, mountainous, other.
The OSD is comprised of a variety of topographic land forms and gradients. Specific topographic characteristics of the sites at which the projects included in the CFP are located have been or will be identified during project-level environmental review when appropriate.
b. What is the steepest slope on the site (approximate percent slope)?
Specific slope characteristics at the sites of the projects included in the CFP have been or will be identified during project-level environmental review.
c. What general types of soils are found on the site (for example, clay, sand, gravel, peat, muck)? If you know the classification of agricultural soils, specify them and note any agricultural land of long-term commercial significance and whether the proposal results in removing any of these soils.
Specific soil types found at the sites of the projects included in the CFP have been or will be identified during project-level environmental review when appropriate.
d. Are there surface indications or history of unstable soils in the immediate vicinity? If so, describe.
Unstable soils may exist within the OSD. Specific soil limitations on individual project sites have been or will be identified at the time of project-level environmental review when appropriate.
e. Describe the purpose, type, total area, and approximate quantities and total affected area of any filling, excavation and grading proposed. Indicate source of fill.
3

Individual projects included in the CFP have been or will be subject, when appropriate, to project-level environmental review and local approval at the time of proposal. Proposed grading projects, as well as the purpose, type, quantity, and source of any fill materials to be used have been or will be identified at that time.
f. Could erosion occur as a result of clearing, construction, or use? If so, generally describe.
It is possible that erosion could occur as a result of the construction projects currently proposed in the CFP. The erosion impacts of the individual projects have been or will be evaluated on a site-specific basis at the time of project-level environmental review when appropriate. Individual projects have been or will be subject to local approval processes.
g. About what percent of the site will be covered with impervious surfaces after project construction (for example, asphalt or buildings)?
The construction projects included in the CFP have required or will require the construction of impervious surfaces. The extent of any impervious cover constructed will vary with each project included in the CFP. This issue has been or will be addressed during project-level environmental review when appropriate.
h. Proposed measures to reduce or control erosion, or other impacts to the earth, if any:
The erosion potential of the projects included in the CFP and appropriate control measures have been or will be addressed during project-level environmental review when appropriate. Relevant erosion reduction and control requirements have been or will be met.
2. Air
a. What types of emissions to the air would result from the proposal during construction, operation, and maintenance when the project is completed? If any, generally describe and give approximate quantities if known.
Various emissions, many construction-related, may result from the individual projects included in the CFP. The air-quality impacts of each project have been or will be evaluated during project-level environmental review when appropriate. Please see the Supplemental Sheet for Non-project Actions.
b. Are there any off-site sources of emissions or odor that may affect your proposal? If so, generally describe.
Any off-site sources of emissions or odor that may affect the individual projects included in the CFP have been or will be addressed during project-level environmental review when appropriate.
c. Proposed measures to reduce or control emissions or other impacts to air, if any:
The individual projects included in the CFP have been or will be subject to project-level environmental review and relevant local approval processes when appropriate. The District has been or will be required to comply with all applicable air regulations and air permit requirements. Proposed measures specific to the individual projects included in the CFP have been or will be addressed during project-level environmental review when appropriate. Please see the Supplemental Sheet for Non-project Actions.
3. Water
a. Surface:
1) Is there any surface water body on or in the immediate vicinity of the site (including year-round and seasonal streams, saltwater, lakes, ponds, wetlands)? If yes, describe type and provide names. If
4

appropriate, state what stream or river it flows into.
There is a network of surface water bodies within the OSD. The surface water bodies that are in the immediate vicinity of the projects included in the CFP have been or will be identified during project level environmental review when appropriate. When necessary, the surface water regimes and flow patterns have been or will be researched and incorporated into the designs of the individual projects.
2) Will the project require any work over, in, or adjacent to (within 200 feet) the described waters? If yes, please describe and attach available plans.
The projects included in the CFP may require work near the surface waters located within the OSD. Applicable local approval requirements have been or will be satisfied.
3) Estimate the amount of fill and dredge material that would be placed in or removed from surface water or wetlands and indicate the area of the site that would be affected. Indicate the source of fill material.
Information with respect to the placement or removal of fill and dredge material as a component of the projects included in the CFP has been or will be provided during project-level environmental review when appropriate. Applicable local regulations have been or will be satisfied.
4) Will the proposal require surface water withdrawals or diversions? Give general description, purpose, and approximate quantities if known.
Any surface water withdrawals or diversions required in connection with the projects included in the CFP have been or will be addressed during project-level environmental review when appropriate.
5) Does the proposal lie within a 100-year floodplain? If so, note location on the site plan.
Each project included in the CFP, if located in a floodplain area, has been or will be required to meet applicable local regulations for flood areas.
6) Does the proposal involve any discharges of waste materials to surface waters? If so, describe the type of waste and anticipated volume of discharge.
Specific information regarding the discharge of waste materials that may be required as a result of the projects included in the CFP has been or will be provided during project-level environmental review when appropriate. Please see the Supplemental Sheet for Non-project Actions.
b. Ground:
1) Will ground water be withdrawn from a well for drinking water or other purposes? If so, give a general description of the well, proposed uses and approximate quantities withdrawn from the well. Will water be discharged to ground water? Give general description, purpose, and approximate quantities if known.
Individual projects included in the CFP may impact groundwater resources. The impact of the individual projects included in the CFP on groundwater resources has been or will be addressed during project-level environmental review when appropriate. Each project has been or will be subject to applicable local regulations. Please see the Supplemental Sheet for Non-project Actions.
2) Describe waste material that will be discharged into the ground from septic tanks or other sources, if any (for example: Domestic sewage; industrial, containing the following chemicals. . . ; agricultural;
5

etc.). Describe the general size of the system, the number of such systems, the number of houses to be served (if applicable), or the number of animals or humans the system(s) are expected to serve.
The discharges of waste material that may take place in connection with the projects included within the CFP have been or will be addressed during project-level environment review.
c. Water runoff (including stormwater):
1) Describe the source of runoff (including storm water) and method of collection and disposal, if any (include quantities, if known). Where will this water flow? Will this water flow into other waters? If so, describe.
Individual projects included in the CFP may have stormwater runoff consequences. Specific information regarding the stormwater impacts of each project has been or will be provided during project-level environmental review when appropriate. Each project has been or will be subject to applicable local stormwater regulations.
2) Could waste materials enter ground or surface waters? If so, generally describe.
The projects included in the CFP may result in the discharge of waste materials into ground or surface waters. The specific impacts of each project on ground and surface waters have been or will be identified during project-level environmental review when appropriate. Each project has been or will be subject to all applicable regulations regarding the discharge of waste materials into ground and surface waters. Please see the Supplemental Sheet for Non-project Actions.
2) Does the proposal alter or otherwise affect drainage patterns in the vicinity of the site? If so, describe.
Individual projects included in the CFP may alter or otherwise affect drainage patterns. Specific information regarding the alternation or impact to drainage patterns has been or will be provided during project-level environmental review when appropriate.
d. Proposed measures to reduce or control surface, ground, runoff water, and drainage pattern impact if any:
Specific measures to reduce or control runoff impacts associated with the projects included in the CFP have been or will be addressed during project-level environmental review when appropriate.
4. Plants
a. Check or circle types of vegetation found on the site: deciduous tree: alder, maple, aspen, other evergreen tree: fir, cedar, pine, other shrubs grass pasture crop or grain wet soil plants: cattail, buttercup, bullrush, skunk cabbage, other water plants: water lily, eelgrass, milfoil, other other types of vegetation
A variety of vegetative zones are located within the OSD. Inventories of the vegetation located on the sites of the projects proposed in the CFP have been or will be developed during project-level environmental review when appropriate.
6
b. What kind and amount of vegetation will be removed or altered?
Some of the projects included in the CFP may require the removal or alteration of vegetation. The specific impacts on vegetation of the projects included in the CFP have been or will be identified during project-level environmental review when appropriate.
c. List threatened or endangered species known to be on or near the site.
The specific impacts to these species from the individual projects included in the CFP have been or will be determined during project-level environmental review when appropriate.
d. Proposed landscaping, use of native plants, or other measures to preserve or enhance vegetation on the site, if any:
Measures to preserve or enhance vegetation at the sites of the projects included in the CFP have been or will be identified during project-level environmental review when appropriate. Each project is or will be subject to applicable local landscaping requirements.
5. Animals
a. List any birds and other animals which have been observed on or near the site or are known to be on or near the site. Examples include:
birds: hawk, heron, eagle, songbirds, other: mammals: deer, bear, elk, beaver, other: fish: bass, salmon, trout, herring, shellfish, other:
An inventory of species that have been observed on or near the sites of the projects proposed in the CFP has been or will be developed during project-level environmental review when appropriate.
b. List any threatened or endangered species known to be on or near the site.
Inventories of threatened or endangered species known to be on or near the sites of the projects included in the CFP have been or will be developed during project-level environmental review when appropriate.
c. Is the site part of a migration route? If so, explain.
The impacts of the projects included in the CFP on migration routes have been or will be addressed during project-level environmental review when appropriate.
d. Proposed measures to preserve or enhance wildlife, if any:
Appropriate measures to preserve or enhance wildlife have been or will be determined during project-level environmental review when appropriate.
e. List any invasive animal species known to be on or near the site.
Inventories of invasive known to be on or near the sites of the projects included in the CFP have been or will be developed during project-level environmental review when appropriate.
6. Energy and natural resources
7

a. What kinds of energy (electric, natural gas, oil, wood stove, solar) will be used to meet the completed project's energy needs? Describe whether it will be used for heating, manufacturing, etc.
The State Board of Education requires the completion of a life-cycle cost analysis of all heating, lighting, and insulation systems before it will permit specific school projects to proceed. The energy needs of the projects included in the CFP have been or will be determined at the time of specific engineering and site design planning when appropriate. Please see the Supplemental Sheet for Non-project Actions.
b. Would your project affect the potential use of solar energy by adjacent properties? If so, generally describe.
The impacts of the projects included in the CFP on the solar potential of adjacent projects have been or will be addressed during project-level environmental review when appropriate
c. What kinds of energy conservation features are included in the plans of this proposal? List other proposed measures to reduce or control energy impacts, if any:
Energy conservation measures proposed in connection with the projects included in the CFP have been or will be considered during project-level environmental review when appropriate.
7. Environmental health
a. Are there any environmental health hazards, including exposure to toxic chemicals, risk of fire and explosion, spill, or hazardous waste, that could occur as a result of this proposal? If so, describe.
Please see the Supplemental Sheet for Non-project Actions.
1) Describe any known or possible contamination at the site. Please see the Supplemental Sheet for Non-project Actions.
2) Describe existing hazardous chemicals/conditions that might affect project development and design. This includes underground hazardous liquid and gas transmission pipelines located within the project area and in the vicinity.
Please see the Supplemental Sheet for Non-project Actions.
3) Describe any toxic or hazardous chemicals that might be stored, used, or produced during the project’s development or construction, or at any time during the operating life of the project.
Please see the Supplemental Sheet for Non-project Actions.
4) Describe special emergency services that might be required.
Please see the Supplemental Sheet for Non-project Actions.
5) Proposed measures to reduce or control environmental health hazards, if any:
The projects included in the CFP comply or will comply with all current codes, standards, rules, and regulations.
Individual projects have been or will be subject to project-level environmental review and local approval at the time they are developed, when appropriate.
b. Noise
1) What types of noise exist in the area which may affect your project (for example: traffic, equipment, operation, other)?
8

A variety of noises from traffic, construction, residential, commercial, and industrial areas exists within the OSD. The specific noise sources that may affect the projects included in the CFP have been or will be identified during project-level environmental review when appropriate.
2) What types and levels of noise would be created by or associated with the project on a short-term or a long-term basis (for example: traffic, construction, operation, other)? Indicate what hours noise would come from the site.
The projects included in the CFP may create normal construction noises that will exist on short-term bases only. The construction projects could increase traffic around the construction sites on a short-term basis. Because the construction of additional high school capacity will increase the capacity of the District's school facilities, this project may create a slight increase in traffic-related or operations-related noise on a long-term basis. Similarly, the placement of portables at school sites will increase the capacity of school facilities and may create a slight increase in traffic-related or operations-related noise. Neither of these potential increases is expected to be significant. Please see the Supplemental Sheet for Non-project Actions.
3) Proposed measures to reduce or control noise impacts, if any:
The projected noise impacts of the projects included in the CFP have been or will be evaluated and mitigated during project-level environmental review when appropriate. Each project is or will be subject to applicable local regulations.
8. Land and shoreline use
a. What is the current use of the site and adjacent properties? Will the proposal affect the current land uses on nearby or adjacent properties? If so, describe.
There are a variety of land uses within the OSD, including residential, commercial, industrial, institutional, utility, open space, recreational, etc.
b. Has the project site been used as working farmlands or working forest lands? If so, describe. How much agricultural or forest land of long-term commercial significance will be converted to other uses as a result of the proposal, if any? If resource lands have not been designated, how many acres in farmland or forest land tax status will be converted to nonfarm or nonforest uses? .
The known sites for the projects included in the CFP have not been used recently for agriculture.
1) Will the proposal affect or be affected by surrounding working farm or forest land normal business operations, such as oversize equipment access, the application of pesticides, tilling, and harvesting? If so, how?
c. Describe any structures on the site.
The structures located on the sites for the projects included in the CFP have been or will be identified and described during project-level environmental review when appropriate.
d. Will any structures be demolished? If so, what?
The structures located on the sites for the projects included in the CFP have been or will be identified and described during project-level environmental review when appropriate.
e. What is the current zoning classification of the site?
The sites that are covered under the CFP have a variety of zoning classifications under the applicable zoning
9

codes. Site-specific zoning information has been or will be identified during project-level environmental review when appropriate.
f. What is the current comprehensive plan designation of the site?
Inventories of the comprehensive plan designations for the sites of the projects included in the CFP have been or will be completed during project-level environmental review when appropriate.
g. If applicable, what is the current shoreline master program designation of the site?
Shoreline master program designations of the sites of the projects included in the CFP have been or will be identified during project-level environmental review when appropriate.
h. Has any part of the site been classified as a critical area by the city or the county? If so, specify.
Any environmentally sensitive areas located on the sites of the projects included in the CFP have been or will be identified during project-level environmental review.
i. Approximately how many people would reside or work in the completed project?
The OSD currently serves over 9,000 full-time equivalent (FTE) students. Enrollment is expected to continue to increase over the next 20 years. The District employs approximately 1,200 people.
j. Approximately how many people would the completed project displace?
Any displacement of people caused by the projects included in the CFP has been or will be evaluated during project-level environmental review when appropriate. However, it is not anticipated that the CFP, or any of the projects contained therein, will displace any people.
k. Proposed measures to avoid or reduce displacement impacts, if any:
Individual projects included in the CFP have been or will be subject to project-level environmental review and local approval when appropriate. Proposed mitigating measures have been or will be developed at that time, when necessary.
l. Proposed measures to ensure the proposal is compatible with e xisting and projected land uses and plans, if any:
The compatibility of the specific projects included in the CFP with existing uses and plans has been or will be assessed as part of the comprehensive planning process and during project-level environmental review when appropriate.
m. Proposed measures to ensure the proposal is compatible with nearby agricultural and forest lands of long-term commercial significand, if any:
The compatibility of the specific projects included in the CFP with existing uses and plans has been or will be assessed as part of the comprehensive planning process and during project-level environmental review when appropriate.
9. Housing
10

a. Approximately how many units would be provided, if any? Indicate whether high, middle, or low-income housing.
No housing units would be provided in connection with the completion of the projects included in the CFP.
b. Approximately how many units, if any, would be eliminated? Indicate whether high, middle, or low-income housing.
It is not anticipated that the projects included in the CFP will eliminate any housing units. The impacts of the projects included in the CFP on existing housing have been or will be evaluated during project-level environmental review when appropriate.
c. Proposed measures to reduce or control housing impacts, if any:
Measures to reduce or control any housing impacts caused by the projects included in the CFP have been or will be addressed during project-level environmental review when appropriate.
10. Aesthetics
a. What is the tallest height of any proposed structure(s), not including antennas; what is the principal exterior building material(s) proposed?
The aesthetic impacts of the projects included in the CFP have been or will be addressed during project-level environmental review when appropriate.
b. What views in the immediate vicinity would be altered or obstructed?
The aesthetic impacts of the projects included in the CFP have been or will be addressed during project-level environmental review when appropriate.
c. Proposed measures to reduce or control aesthetic impacts, if any:
Appropriate measures to reduce or control the aesthetic impacts of the projects included in the CFP have been or will be determined on a project-level basis when appropriate.
11. Light and glare
a. What type of light or glare will the proposal produce? What time of day would it mainly occur?
The light or glare impacts of the projects included in the CFP have been or will be addressed during project-level environmental review, when appropriate.
b. Could light or glare from the finished project be a safety hazard or interfere with views?
The light or glare impacts of the projects included in the CFP have been or will be addressed during project level environmental review when appropriate.
c. What existing off-site sources of light or glare may affect your proposal?
Off-site sources of light or glare that may affect the projects included in the CFP have been or will be evaluated during project-level environmental review when appropriate.
d. Proposed measures to reduce or control light and glare impacts, if any:
11

Proposed measures to mitigate light and glare impacts have been or will be addressed during project level environmental review when appropriate.
12. Recreation
a. What designated and informal recreational opportunities are in the immediate vicinity?
There are a variety of formal and informal recreational facilities within the OSD.
b. Would the proposed project displace any existing recreational uses? If so, describe.
The recreational impacts of the projects included in the CFP have been or will be addressed during project-level environmental review when appropriate. The projects included in the CFP, including proposed new school facilities, may enhance recreational
opportunities and uses.
c. Proposed measures to reduce or control impacts on recreation, including recreation opportunities to be provided by the project or applicant, if any:
Adverse recreational effects of the projects included in the CFP have been or will be subject to mitigation during project-level environmental review when appropriate. School facilities usually provide recreational facilities to the community in the form of play fields and gymnasiums.
13. Historic and cultural preservation
a. Are there any buildings, structures, or sites, located near the site that are over 45 years old listed in or eligible for listing in national, state, or local preservation registers located on or near the site? If so, specifically describe.
There are no known places or objects listed on, or proposed for, such registers for the project sites included in the CFP. The existence of historic and cultural resources on or next to the sites has been or will be addressed in detail during project-level environmental review when appropriate.
b. Generally are there any landmarks, features, or other evidence of Indian or historic use of occupation? This may include human burials or old cemeteries. Are there any material evidence, artifacts, or areas of cultural importance on or near the site? Please list any professional studies conducted at the site to identify such resources.
An inventory of historical sites at or near the sites of the projects included in the CFP has been or will be developed during project-level environmental review when appropriate.
c. Describe the methods used to assess the potential impact to cultural and historic resources on or near the project site. Examples include consultation with tribes and the department or archeology and historic preservation, archeological surveys, historic maps, GIS data, ect.
d. Proposed measures to avoid, minimize or compensate for the loss, changes to, and disturbance to resources. Please include plans for the above and any permits that may be required.
Appropriate measures will be proposed on a project-level basis when appropriate.
14. Transportation
12

a. Identify public streets and highways serving the site, or affected geographic area, and describe proposed access to the existing street system. Show on site plans, if any.
The impact on public streets and highways of the individual projects included in the CFP have been or will be addressed during project-level environmental review when appropriate.
b. Is the site or affected geographic area currently served by public transit? If so, generally describe. If not, what is the approximate distance to the nearest transit stop?
The relationship between the specific projects included in the CFP and public transit has been or will be addressed during project-level environmental review when appropriate.
c. How many additional parking spaces would the completed project or nonproject proposal have? How many would the project or proposal eliminate?
Inventories of parking spaces located at the sites of the projects included in the CFP and the impacts of specific projects on parking availability have been or will be conducted during project-level environmental review when appropriate.
d. Will the proposal require any new improvements to existing roads, streets, pedestrian, bicycle or state transportation facilities, not including driveways? If so, generally describe (indicate whether public or private).
The need for new streets or roads, or improvements to existing streets and roads has been or will be addressed during project-level environmental review when appropriate.
e. Will the project or proposal use (or occur in the immediate vicinity of) water, rail, or air transportation? If so, generally describe.
Use of water, rail, or air transportation has been or will be addressed during project-level environmental review when appropriate.
f. How many vehicular trips per day would be generated by the completed project? If known, indicate when peak volumes would occur and what percentage of the volume would be trucks (such as commercial and nonpassenger vehicles). What data or transportation models were sued to make these estimates?
The traffic impacts of the projects included in the CFP have been or will be addressed during project-level environmental review when appropriate.
g. Will the proposal interfere with, affect, or be affected by the movement of agricultural and forest products on roads or streets in the area? If so, generally describe.
The impact of the transportation of agricultural and forest products in relation to projects included in the CFP have been or will be addressed during project-level environmental review when appropriate.
h. Proposed measures to reduce or control transportation impacts, if any:
The mitigation of traffic impacts associated with the projects included in the CFP has been or will be addressed during project-level environmental review when appropriate.
15. Public services
a. Would the project result in an increased need for public services (for example: fire protection, police protection, health care, schools, other)? If so, generally describe.
13

The District does not anticipate that the projects identified in the CFP will significantly increase the need for public services.
b. Proposed measures to reduce or control direct impacts on public services, if any.
New school facilities have been or will be built with automatic security systems, fire alarms, smoke alarms, heat sensors, and sprinkler systems.
16. Utilities
a. Circle utilities currently available at the site: electricity, natural gas, water, refuse service, telephone, sanitary sewer, septic system, other.
Electricity, natural gas, water, refuse service, telephone, and sanitary sewer utilities are available at the known sites of the projects included in the CFP. The types of utilities available at specific project sites have been or will be addressed in more detail during project-level environmental review when appropriate.
b. Describe the utilities that are proposed for the project, the utility providing the service, and the general construction activities on the site or in the immediate vicinity which might be needed.
Utility revisions and construction needs have been or will be identified during project-level environmental review when appropriate.
d. Signature The above answers are true and complete to the best of my knowledge. I understand that the lead agency is relying on them to make its decision.
Signature ______________________________
Date Submitted _______________________________
D.SUPPLEMENTAL SHEET FOR NON-PROJECT ACTIONS
(do not use this sheet for project actions)
Because these questions are very general, it may be helpful to read them in conjunction with the list of the elements of the environment.
When answering these questions, be aware of the extent the proposal or the types of activities likely to result from the proposal, would affect the item at a greater intensity or at a faster rate than if the proposal were not implemented. Respond briefly and in general terms.
1. How would the proposal be likely to increase discharge to water; emissions to air; production, storage, or release of toxic or hazardous substances; or production of noise?
To the extent the CFP makes it more likely that school facilities, as well as several small works projects, will be constructed, some of these environmental impacts will be more likely. Additional impermeable surfaces, such as roofs, access roads, and sidewalks could increase stormwater runoff, which could enter surface or ground waters. Heating systems, emergency generators, and other school equipment that is installed pursuant to the CFP could result in air emissions. The projects included in the CFP should not require the production, storage, or
14

release of toxic or hazardous substances, with the possible exception of the storage of diesel fuel or gasoline for emergency generating equipment. The District does not anticipate a significant increase in the production of noise from its facilities, although the projects included in the CFP will increase the District's student capacities.
Proposed measures to avoid or reduce such increases are:
Proposed measures to mitigate any such increases described above have been or will be addressed during project-level environmental review when appropriate. Stormwater detention and runoff will meet applicable County and/or City requirements and may be subject to National Pollutant Discharge Elimination System (NPDES) permitting requirements. Discharges to air will meet applicable air pollution control requirements. Fuel oil will be stored in accordance with local and state requirements.
2. How would the proposal be likely to affect plants, animals, fish, or marine life?
The CFP itself will have no impact on these elements of the environment. The projects included in the CFP may require clearing plants off of the project sites and a loss to animal habitat. These impacts have been or will be addressed in more detail during project-level environmental review when appropriate. The projects included in the CFP are not likely to generate significant impacts on fish or marine life.
Proposed measures to protect or conserve plants, animals, fish, or marine life are:
Specific measures to protect and conserve plants, animals, and fish cannot be identified at this time. Specific mitigation proposals will be identified, however, during project-level environmental review when appropriate.
3. How would the proposal be likely to deplete energy or natural resources?
The construction of the projects included in the CFP will require the consumption of energy.
Proposed measures to protect or conserve energy and natural resources are:
The projects included in the CFP will be constructed in accordance with applicable energy efficiency standards.
4. How would the proposal be likely to use or affect environmentally sensitive areas or areas designated (or eligible or under study) for governmental protection; such as parks, wilderness, wild and scenic rivers, threatened or endangered species habitat, historic or cultural sites, wetlands, floodplains, or prime farmlands?
The CFP and individual projects contained therein should have no impact on these resources.
Proposed measures to protect such resources or to avoid or reduce impacts are:
Appropriate measures have been or will be proposed during project-level environmental review when appropriate. Updates of the CFP will be coordinated with Thurston County and the Cities of Tumwater and Olympia as part of the Growth Management Act process, one of the purposes of which is to protect environmentally sensitive areas. To the extent the District's facilities planning process is part of the overall growth management planning process, these resources are more likely to be protected.
5. How would the proposal be likely to affect land and shoreline use, including whether it would allow or encourage land or shoreline uses incompatible with existing plans?
15

The CFP will not have any impact on land or shoreline use that is incompatible with existing comprehensive plans, land use codes, or shoreline management plans. The District does not anticipate that the CFP or the projects contained therein will directly affect land and shoreline uses in the area served by the District.
Proposed measures to avoid or reduce shoreline and land use impacts are:
No measures to avoid or reduce land use impacts resulting from the CFP or the projects contained therein are proposed at this time.
6. How would the proposal be likely to increase demands on transportation or public services and utilities?
The construction projects included in the CFP may create temporary increases in the District's need for public services and utilities. The new school facilities will increase the District's demands on transportation and utilities. These increases are not expected to be significant.
Proposed measures to reduce or respond to such demand(s) are:
No measures to reduce or respond to such demands are proposed at this time.
7. Identify, if possible, whether the proposal may conflict with local, state, or federal laws or requirements for the protection of the environment.
The CFP will not conflict with any laws or requirements for the protection of the environment.
16