ollege Affordability and Transparency xplanation ormcollegecost.ed.gov/catc/resources/2012-13 CATEF...
60
College Affordability and Transparency Explanation Form Summary Guide to College Costs for the 2012-13 Collection Year
-
Upload
hoangtuyen -
Category
Documents
-
view
216 -
download
2
Transcript of ollege Affordability and Transparency xplanation ormcollegecost.ed.gov/catc/resources/2012-13 CATEF...

College Affordability and Transparency Explanation Form
Summary Guide to College Costs for the 2012-13
Collection Year
2
Abstract
Section 132 of the Higher Education Act of 1965, as amended (HEA), requires institutions
on the annual College Affordability and Transparency Center lists of schools with the
highest increases in tuition and fees and net price (cost of attendance after grant and
scholarship aid) to explain to the Secretary of Education why their costs have gone up and
how they will address these rising costs. Further, the HEA requires the Secretary to issue
an annual report summarizing the responses provided by these institutions and outlining
the methodology employed to collect and interpret the information.
Accordingly, this Summary Guide to College Costs summarizes the responses that
institutions on the 2012 College Affordability and Transparency Center lists provided to
the Department of Education (the Department) through the online College Affordability
Transparency Explanation Form (CATEF) and describes the Department’s methodology.
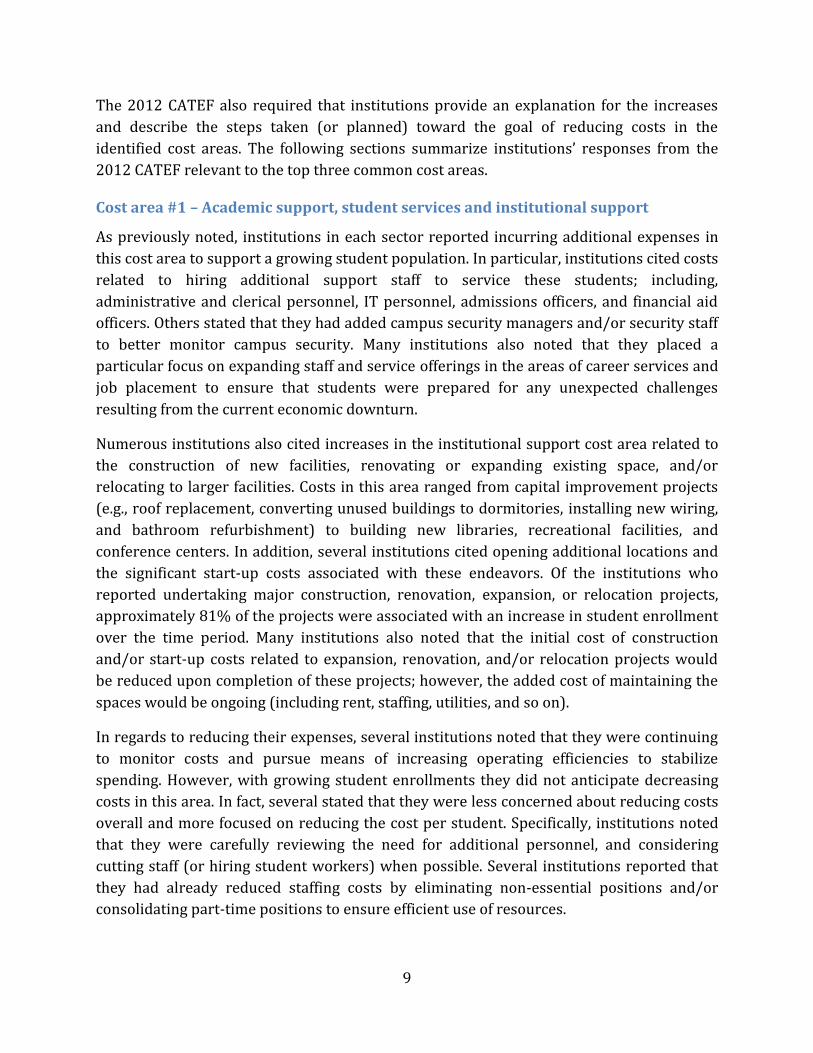
The 2012 CATEF asked institutions to provide (1) an explanation for the areas in the
institution’s budget with the highest percentage increase in costs; (2) a description of any
steps the institution has taken toward reducing these costs; and (3) whether student
charges are within the exclusive control of the institution. Among the major findings noted,
of the 539 institutions that completed the survey, nearly 40 percent cited rising student
enrollments as the predominant factor in cost increases. These increases were primarily
attributed to the need for additional staff, rising costs related to student services and
residential life, and facilities maintenance and expansion. In fact, about 25% of institutions
on the 2012 lists reported undertaking major construction and/or expansion projects,
noting the significant costs associated with this type of project. In addition, 47% of public
institutions reported that they did not have exclusive control of student charges, citing
state-level organizations, legislators, and/or governing boards as partially or primarily
responsible for establishing their tuition and/or fee rates.

3
Table of Contents
Abstract ..................................................................................................................................................................... 2
Executive Summary.............................................................................................................................................. 4
Introduction ............................................................................................................................................................ 5
Explanations of Cost Increases ........................................................................................................................ 8
Cost area #1 – Academic support, student services and institutional support ................... 9
Cost area #2 – Instruction ..................................................................................................................... 11
Cost area #3 – Other expenses ............................................................................................................ 12
Appendix I: 2012 Published Tuition List ................................................................................................. 15
Appendix II: 2012 Published Net Price List ............................................................................................ 34
Appendix III: Response Rates to Collection Form ................................................................................ 54
Appendix IV: Cost Areas Selected by Sector ........................................................................................... 56
Appendix V: Glossary of Terms ................................................................................................................... 59

4
Executive Summary
The 2012 CATEF examined seven major cost areas: (1) Academic support, student services
and institutional support; (2) Auxiliary enterprises; (3) Independent operations; (4)
Instruction; (5) Net grant aid to students / scholarships and fellowships; (6) Other expenses;
and (7) Research and public service.1 Of these cost areas, the following three were most
commonly identified as having the highest percentage increase in costs over the three-year
period for schools on both the tuition list and the net price list:
• Academic support, student services, and institutional support;
• Instruction; and
• Other expenses (this includes instructional materials for students; technology
upgrades and investments in IT infrastructure; rent; taxes; facilities maintenance,
renovation, and expansion; and advertising and marketing).
Similar to last year’s CATEF, nearly 40 percent of institutions stated that rising student
enrollments led to increases across several cost areas. These increases were most
commonly attributed to the need for additional staff in support of this growth in student
population. As such, the costs associated with hiring these staff—namely, salaries and
benefits—added to increasing expenses. Institutions primarily cited expenditures related
to hiring additional instructors; however, several reported adding personnel to help
maintain the student support structure (e.g., admissions, academic advising, student affairs,
financial aid, and career services/job placement).
With increased student enrollment, institutions also cited rising costs related to residential
life (e.g., on-campus housing and food services), campus security, and facility-related
expenditures (e.g., maintenance and repair costs). In fact, about 28% of institutions on the
tuition list and 23% of institutions on the net price list reported undertaking major
construction and/or expansion projects to accommodate the growth in student
enrollments. This included building new classrooms and housing facilities, renovating or
expanding existing space, and/or relocating to larger facilities. Specifically, institutions
noted the significant costs associated with this type of construction and/or expansion. This
included the increased expense of maintaining these larger facilities, along with higher rent
and additional utility costs.
In regards to reducing these expenses, several institutions stated that they could not
foresee lowering costs if student enrollments continued to grow. One institution noted that,
“the increase in costs represents a deliberate investment in education and student support
services. Hence, the institution has not set a goal of reducing these expenses.” Many
1 See the glossary provided for definitions of the cost areas described.

5
institutions added that they did not anticipate lowering costs in the areas of instruction,
staffing, or student services; however, they were actively looking for other ways to reduce
costs. This included adding recycling programs, focusing on energy conservation,
streamlining administrative processes, seeking out lower cost vendors for materials and
supplies, and replacing expensive third party contracts with internal personnel. A number
of institutions also reported exploring alternative instructional delivery methods (e.g.,
hybrid and online instruction).
Institutions also noted that once costly construction and expansion projects were
completed, and their facilities were capable of sustaining current levels of enrollment
growth, they stopped, or significantly decreased, new building and expansion projects. In
addition, many of these institutions reported that they were successfully paying down the
debt related to these projects without taking on additional expenses.
Several respondents cited factors outside of the institution’s control as reasons for the
increases in tuition, fees, and net price. For example, institutions on the net price list stated
that increases in cost of living—and an overall demographic shift from students living with
family to students living without family—resulted in an increase in the average overall cost
of attendance between 2007-08 and 2009-10. In particular, this was reported by 2-year
and less than 2-year institutions that do not offer on-campus housing. In turn, this
attributed to the increase in net price during this time period. Furthermore, about 22% of
public institutions on both lists (and nearly 40% of public institutions on the tuition list)
stated that decreases in state appropriations was a major factor and directly impacted
charges to students.
In addition, about 45% of public 4-year institutions and 70% of public 2-year institutions
reported that they did not have exclusive control of student charges. In fact, these
institutions stated that state-level organizations, legislators, and/or governing boards are
responsible for establishing their tuition and/or fee rates. Institutions located in Alabama,
California, Colorado, Florida, Georgia, North Carolina, Pennsylvania, Texas, and Tennessee
reported that a state-level agency, Board of Regents, and/or other governing board almost
exclusively controls their tuition and/or fee rates. These and other public institutions
reported that they submitted recommendations regarding student charges; however, the
final determination was made at the state-level in each case cited. Moreover, institutions
located in the nine states listed above accounted for nearly half of the public institutions on
both the tuition and net price lists.
Introduction
The Higher Education Act of 1965, as amended (HEA), includes provisions for improved
transparency in college tuition prices for potential students and their parents. As part of

6
these provisions, the United States Department of Education (ED) is required to release a
total of six lists related to student costs at America’s colleges and universities. Using data
collected by the National Center for Education Statistics (NCES) through the Integrated
Postsecondary Education Data System (IPEDS)2, each list is generated annually and
released via the publicly available College Affordability and Transparency Center (CATC)
website by July 1st.
Specifically, the following lists are published for each of the nine institutional sectors:
• Highest tuition and required fees: A list of the five percent of institutions that have
the highest tuition and required fees for the most recent academic year.
• Highest net price: A list of the five percent of institutions that have the highest net
price for the most recent academic year.
• Lowest tuition and required fees: A list of the ten percent of institutions that have
the lowest tuition and required fees for the most recent academic year.
• Lowest net price: A list of the ten percent of institutions that have the lowest net
price for the most recent academic year.
• Highest increase in tuition and required fees: A list of the five percent of
institutions that have the largest increase in tuition and required fees, expressed as a percentage change, over the most recent three-year period.
• Highest increase in net price: A list of the five percent of institutions that have the
largest increase in net price, expressed as a percentage change, over the most recent three-year period.
The HEA defines net price as “the average yearly price of attendance actually charged to
first-time, full-time undergraduate students receiving student aid at an institution of higher
education after deducting such aid.” In IPEDS, the total cost of attendance is the sum of
published tuition and required fees, books and supplies, and the weighted average for
room and board and other expenses.3 The net price is then generated by subtracting the
average amount of federal, state/local government, or institutional grant or scholarship aid
from the total cost of attendance.
2 IPEDS is a mandatory data collection for institutions that participate in, or are applicants for participation in, any federal student financial aid program authorized by Title IV of the HEA, as amended 20 USC 1094 (a)(17), HEA section 487(a)(17) and 34 CFR 668.14(b)(19). More information about IPEDS is available at http://nces.ed.gov/ipeds. 3 For public institutions that report tuition and fees and average net price for the full academic year, the lists are based on the in-state or in-district tuition rate. For institutions that charge a comprehensive fee (a combined tuition, required fees, and room and board charge) for an academic year, the comprehensive fee was used to represent tuition and required fees. In addition, some institutions charge by entire programs rather than by academic year. For these schools, referred to in IPEDS as “program reporters,” tuition and fees and average net price are for the institution’s largest program.

7
The 2012 lists were posted on the CATC website on June 12, 2012; however, each list was
generated using data collected during the 2010-11 IPEDS data collection cycle. Specifically,
the 2012 list for highest increase in tuition and fees was based on the percentage change in
tuition and fees between 2008-09 and 2010-11; and the list for highest increase in net price
was based on the percentage change in net price between 2007-08 and 2009-10.4 Each
year, institutions have the opportunity to review the data they submitted during the
previous year and revise it, if necessary, using the IPEDS Prior Year Revision System. The
lists posted on the CATC website reflect any revisions made by institutions using this
process. In addition, both the originally reported data and revised data for all Title IV
institutions are publicly available via the IPEDS Data Center.
Institutions that are on the list of schools with the highest percentage change in tuition and
required fees, or the list of schools with the highest percentage change in net price, must
submit a report to the Secretary of Education that explains why costs have increased and
what steps the institution is taking to decrease these costs. To aid institutions in complying
with this requirement, ED established the online College Affordability and Transparency
Explanation Form (CATEF) for institutions on either list to report their required
information. Specifically, the 2012 CATEF asked institutions to provide (1) an explanation
for the areas in the institution’s budget with the highest percentage increases in costs over
the three-year time period5; (2) a description of any steps the institution has taken (or
intends to take) toward reducing these costs; and (3) whether student charges are within
the exclusive control of the institution, and if not, the identity of the agency (or agencies)
responsible for determining increases. In addition, each survey response was reviewed to
ensure that institutions adequately responded to the questions and presented data
relevant to the specific cost area.
Section 132(e)(2) of the HEA requires the secretary to issue an annual report summarizing
institution’s responses to their inclusion on the College Affordability and Transparency lists
of schools where student costs are increasing at the highest rates. Accordingly, section 3 of
this report summarizes and explains the institutions’ responses from the 2012 CATEF.
There were 276 institutions on the published list of schools with the highest increase in
tuition and fees (referred to in this report as the “tuition list”), 280 institutions on the
published list of schools with the highest increase in net price (“net price list”), and 28
institutions that appeared on both lists.6
4 The law includes an exemption from these two lists for any institution whose increase in tuition and fees, or net price, is less than $600 for the three-year period. 5 These cost areas were automatically identified by the system based on data previously reported by the institution in the IPEDS Finance component. 6 Appendix III provides more information on the number of institutions, by sector, that provided information required by law through the CATEF. Please note that 8 of the institutions on the tuition list and 23 institutions on the net price

8
Explanations of Cost Increases
The 2012 CATEF examined seven major cost areas.7 For each institution completing the
CATEF, the three cost areas with the highest percentage increases over the three-year
period were automatically identified based on data previously reported by the institution
in the IPEDS Finance component.8 These data highlighted the following three cost areas
most frequently identified as having the highest percentage increases over the time period
for institutions on both the tuition list and the net price list: Academic support, student
services, and institutional support; Instruction; and Other expenses.9
list had since closed, or were no longer participants in any Title IV federal student financial aid programs. As such, these institutions were not required to complete the CATEF. 7 In addition to the cost areas listed in Table 1, the CATEF also examined the Independent operations cost area. However, the number of institutions with increases in this cost area identified as among the highest in their institution’s budget over the three-year period was statistically insignificant for the purpose of this report. A complete listing of the number of institutions identified for all seven major cost areas—by institutional sector—can be found in Appendix IV. 8 A small subset of institutions (29 on the tuition list and 5 on the net price list) did not complete the IPEDS Finance component during the first year of the relevant three-year period. In these cases, the 2012 CATEF required that these institutions identify the areas in their budget with the highest percentage increases in costs over the three-year period from the list of available cost areas. 9 Since the CATEF looked at the top three cost areas within each institution’s budget with the highest percentage increase over the three-year period, institutions are included in more than one cost area count and institutions may be on both lists.
Table 1. Number of institutions on the tuition list and on the net price list identified as having the greatest increases in each cost area, and the median percentage change in total dollars, by cost area and list.
Cost Area Tuition List Net Price List
Number of
institutions
Median percent
change in
total dollars
Number of
institutions
Median percent
change in
total dollars
Academic support, student services
and institutional support*
217 50% 198 41%
Instruction 164 42% 142 30%
Other expenses 105 > 200% 117 > 200%
Net grant aid to students /
scholarships and fellowships
75 129% 70 98%
Auxiliary enterprises 46 66% 50 58%
Research and public service* 44 39% 46 76%
*Depending on the version of the IPEDS Finance survey forms completed, institutions are required to either
combine expenses for these categories or report expenses for each as a separate line item. For the purposes of
this report, these categories have been combined for comparability across all institutions. A more detailed
breakdown of the number of institutions, by sector, reporting data for each individual category (where
applicable) can be found in Appendix IV.
9
The 2012 CATEF also required that institutions provide an explanation for the increases
and describe the steps taken (or planned) toward the goal of reducing costs in the
identified cost areas. The following sections summarize institutions’ responses from the
2012 CATEF relevant to the top three common cost areas.
Cost area #1 – Academic support, student services and institutional support
As previously noted, institutions in each sector reported incurring additional expenses in
this cost area to support a growing student population. In particular, institutions cited costs
related to hiring additional support staff to service these students; including,
administrative and clerical personnel, IT personnel, admissions officers, and financial aid
officers. Others stated that they had added campus security managers and/or security staff
to better monitor campus security. Many institutions also noted that they placed a
particular focus on expanding staff and service offerings in the areas of career services and
job placement to ensure that students were prepared for any unexpected challenges
resulting from the current economic downturn.
Numerous institutions also cited increases in the institutional support cost area related to
the construction of new facilities, renovating or expanding existing space, and/or
relocating to larger facilities. Costs in this area ranged from capital improvement projects
(e.g., roof replacement, converting unused buildings to dormitories, installing new wiring,
and bathroom refurbishment) to building new libraries, recreational facilities, and
conference centers. In addition, several institutions cited opening additional locations and
the significant start-up costs associated with these endeavors. Of the institutions who
reported undertaking major construction, renovation, expansion, or relocation projects,
approximately 81% of the projects were associated with an increase in student enrollment
over the time period. Many institutions also noted that the initial cost of construction
and/or start-up costs related to expansion, renovation, and/or relocation projects would
be reduced upon completion of these projects; however, the added cost of maintaining the
spaces would be ongoing (including rent, staffing, utilities, and so on).
In regards to reducing their expenses, several institutions noted that they were continuing
to monitor costs and pursue means of increasing operating efficiencies to stabilize
spending. However, with growing student enrollments they did not anticipate decreasing
costs in this area. In fact, several stated that they were less concerned about reducing costs
overall and more focused on reducing the cost per student. Specifically, institutions noted
that they were carefully reviewing the need for additional personnel, and considering
cutting staff (or hiring student workers) when possible. Several institutions reported that
they had already reduced staffing costs by eliminating non-essential positions and/or
consolidating part-time positions to ensure efficient use of resources.

10
Figure 1 highlights the top five reasons cited by institutions on both lists for increases
within the Academic support, student services, and institutional support cost area.
Figure 1. Top five explanations cited by institutions on the tuition list and on the net price list for increases in costs related to Academic support, student services, and institutional support.

11
Cost area #2 – Instruction
Once again, a growth in student enrollments and the need to hire additional instructors to
expand course offerings topped the list of reasons reported by institutions for increases in
this cost area. In fact, roughly 46% of institutions on both lists cited hiring additional staff
as the reason for higher instruction costs. Of these institutions, nearly 70% also
experienced an increase in enrollment over the same time period. In addition, many
institutions reported that they hired additional personnel to teach and/or support new
programs, or changes in the existing curriculum, offered at the institution. In many cases,
additional space and/or equipment was required in support of these new and/or expanded
programs of study.
Some for-profit institutions reported a change in ownership as another reason for
increases in this cost area. These institutions stated that the change in ownership resulted
in the hiring of new staff along with significant changes to institutional and instructional
management. In addition, about 9% of institutions on both lists cited the rising costs of
providing employee health benefits as a major factor in increased expenditures in this area.
As with other cost areas, many institutions stated that costs have stabilized in the area of
Instruction. However, if student enrollments continued to grow, these institutions also
added that they did not anticipate decreasing costs in this area. Many institutions noted
that they are looking for ways to operate more efficiently and limit additional cost
increases, but they are struggling to keep costs down while hiring and retaining the
faculty/ staff necessary to meet student needs. Moreover, institutions reported that they
must offer competitive salaries and benefit packages to recruit and retain qualified
instructors. As such, this further complicates the issue of how to limit spending in this cost
area. As one institution stated, “In order to maintain the high quality education we provide
our students (i.e., excellent teaching staff, state-of-the-art equipment, up-to-date software
programs, etc.) we cannot reduce our costs.”
Several institutions stated that they would limit hiring, reduce personnel, streamline
program offerings, and/or utilize more adjunct instructors to lower the costs associated
with instruction. However, many institutions reported that they did not foresee decreases
in this cost area if the student population continues to grow.

12
Figure 2 highlights the top five reasons cited by institutions on both lists for increases
within the Instruction cost area.
Cost area #3 – Other expenses
Generally, any institutional expenses that fall outside the scope of the other specified cost
areas are classified within the Other expenses cost area. For example, while institutions
reported increases in other cost areas related to and/or resulting from construction,
renovation, and expansion projects, the development costs of these projects were included
in the Other expenses category. As such, facilities improvement and expansion was at the
top of the list of reasons cited for cost increases in this area.
Figure 2. Top five explanations cited by institutions on the tuition list and on the net price list for increases in costs related to Instruction.

13
According to the data, approximately 26% of institutions reported increased expenditures
in this cost area related to major construction, relocation, and/or expansion projects
undertaken during the three-year period. Of these institutions, about 77% also experienced
an increase in student enrollment during the time period. Examples of costs in this area
ranged from capital improvement projects (e.g., roof replacement and parking lot repaving)
to major construction or renovation of additional classroom space, student/recreational
centers, and bookstores. In addition, several institutions reported refurbishing areas of the
campus not in use, or that had fallen into disrepair, to more efficiently maximize their
existing space in response to the growing student population.
Institutions also reported including expenses related to the overall operation and
maintenance of their facilities under this cost area (e.g., building maintenance, repair, and
custodial services). As such, institutions in each sector reported expenses related to hiring
additional staff (e.g., additional maintenance and custodial staff) due to increases in facility
space and student enrollment. Many institutions also reported increased expenditures for
security staff, along with the cost of cameras and other security equipment. In addition to
servicing larger locations and a growing student population, several institutions added that
their increased security expenditures were attributable to a heightened national awareness
and intensified public concerns about campus security.
Many institutions also cited cost increases in this area related to the purchase of equipment
and supplies. As with other expenditures, these costs were frequently linked to increased
student enrollment and facilities expansion. This included instructional materials; office
supplies; new computers, software, and related technology; copy machines; cleaning
supplies; and paper products (e.g. paper towels, toilet paper, etc.). In addition, a number of
institutions reported increases in costs related to furnishing new or renovated student
spaces—including desks, tables, chairs, and student work stations.
Unique to the Other expenses cost area, institutions from a wide-range of sectors, on both
the tuition list and the net price list, cited cost increases related to the disposal of assets. In
these cases, the institutions reported incurring a loss when they sold property for less than
the recorded value. These institutions largely noted that these were one-time incidents. As
such, in response they planned on implementing a higher level of care when valuing
property and its expected return rate in the future. In addition, several for-profit
institutions reported increased spending in the Other expenses cost area that was related to
the payment of federal and state income taxes, and additional advertising expenditures.
In responses to these rising costs, many institutions stated that they have implemented
more rigorous cost containment strategies—including careful planning, budgeting, and the
conservation of materials and supplies. Institutions added that they were exercising
increased vigilance, actively reviewing the annual budget for operating costs to determine

14
possible reductions and monitoring spending to ensure they receive the best prices for all
purchases. In addition, institutions noted that they were being more conservative with
cleaning products, office supplies, and paper products. In one case, an institution reported
that a “Procurement Committee” had been established to review institutional purchases.
Figure 3 highlights the top five reasons cited by institutions on both lists for increases
within the Other expenses cost area.
Figure 3. Top five explanations cited by institutions on the tuition list and on the net price list for increases in costs related to Other expenses.

15
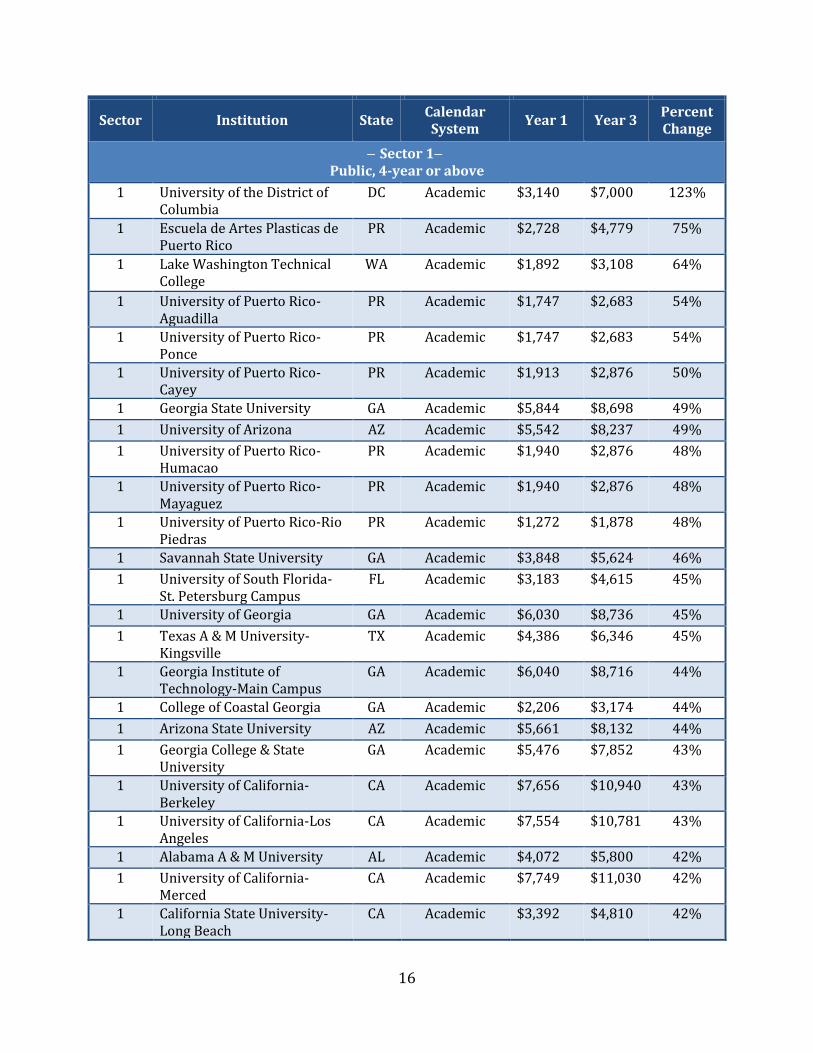
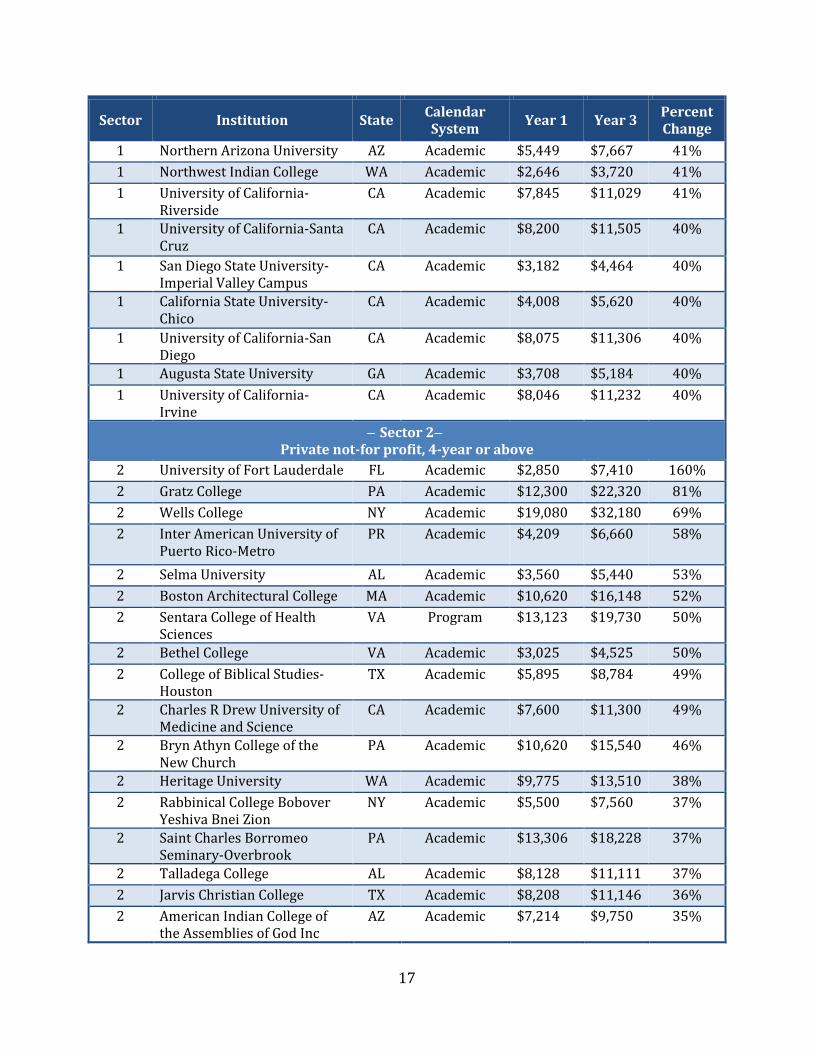
Appendix I:
2012 Published Tuition List
16
Sector Institution State Calendar System
Year 1 Year 3 Percent Change
Public, 4-year or above
1 University of the District of Columbia
DC Academic $3,140 $7,000 123%
1 Escuela de Artes Plasticas de Puerto Rico
PR Academic $2,728 $4,779 75%
1 Lake Washington Technical College
WA Academic $1,892 $3,108 64%
1 University of Puerto Rico-Aguadilla
PR Academic $1,747 $2,683 54%
1 University of Puerto Rico-Ponce
PR Academic $1,747 $2,683 54%
1 University of Puerto Rico-Cayey
PR Academic $1,913 $2,876 50%
1 Georgia State University GA Academic $5,844 $8,698 49%
1 University of Arizona AZ Academic $5,542 $8,237 49%
1 University of Puerto Rico-Humacao
PR Academic $1,940 $2,876 48%
1 University of Puerto Rico-Mayaguez
PR Academic $1,940 $2,876 48%
1 University of Puerto Rico-Rio Piedras
PR Academic $1,272 $1,878 48%
1 Savannah State University GA Academic $3,848 $5,624 46%
1 University of South Florida-St. Petersburg Campus
FL Academic $3,183 $4,615 45%
1 University of Georgia GA Academic $6,030 $8,736 45%
1 Texas A & M University-Kingsville
TX Academic $4,386 $6,346 45%
1 Georgia Institute of Technology-Main Campus
GA Academic $6,040 $8,716 44%
1 College of Coastal Georgia GA Academic $2,206 $3,174 44%
1 Arizona State University AZ Academic $5,661 $8,132 44%
1 Georgia College & State University
GA Academic $5,476 $7,852 43%
1 University of California-Berkeley
CA Academic $7,656 $10,940 43%
1 University of California-Los Angeles
CA Academic $7,554 $10,781 43%
1 Alabama A & M University AL Academic $4,072 $5,800 42%
1 University of California-Merced
CA Academic $7,749 $11,030 42%
1 California State University-Long Beach
CA Academic $3,392 $4,810 42%
17
Sector Institution State Calendar System
Year 1 Year 3 Percent Change
1 Northern Arizona University AZ Academic $5,449 $7,667 41%
1 Northwest Indian College WA Academic $2,646 $3,720 41%
1 University of California-Riverside
CA Academic $7,845 $11,029 41%
1 University of California-Santa Cruz
CA Academic $8,200 $11,505 40%
1 San Diego State University-Imperial Valley Campus
CA Academic $3,182 $4,464 40%
1 California State University-Chico
CA Academic $4,008 $5,620 40%
1 University of California-San Diego
CA Academic $8,075 $11,306 40%
1 Augusta State University GA Academic $3,708 $5,184 40%
1 University of California-Irvine
CA Academic $8,046 $11,232 40%
Private not-for profit, 4-year or above
2 University of Fort Lauderdale FL Academic $2,850 $7,410 160%
2 Gratz College PA Academic $12,300 $22,320 81%
2 Wells College NY Academic $19,080 $32,180 69%
2 Inter American University of Puerto Rico-Metro
PR Academic $4,209 $6,660 58%
2 Selma University AL Academic $3,560 $5,440 53%
2 Boston Architectural College MA Academic $10,620 $16,148 52%
2 Sentara College of Health Sciences
VA Program $13,123 $19,730 50%
2 Bethel College VA Academic $3,025 $4,525 50%
2 College of Biblical Studies-Houston
TX Academic $5,895 $8,784 49%
2 Charles R Drew University of Medicine and Science
CA Academic $7,600 $11,300 49%
2 Bryn Athyn College of the New Church
PA Academic $10,620 $15,540 46%
2 Heritage University WA Academic $9,775 $13,510 38%
2 Rabbinical College Bobover Yeshiva Bnei Zion
NY Academic $5,500 $7,560 37%
2 Saint Charles Borromeo Seminary-Overbrook
PA Academic $13,306 $18,228 37%
2 Talladega College AL Academic $8,128 $11,111 37%
2 Jarvis Christian College TX Academic $8,208 $11,146 36%
2 American Indian College of the Assemblies of God Inc
AZ Academic $7,214 $9,750 35%

18
Sector Institution State Calendar System
Year 1 Year 3 Percent Change
2 City College-Gainesville FL Academic $9,540 $12,866 35%
2 Baptist University of the Americas
TX Academic $4,490 $6,000 34%
2 Humacao Community College PR Academic $4,587 $6,090 33%
2 Huntsville Bible College AL Academic $3,025 $4,005 32%
2 Harrisburg University of Science and Technology
PA Academic $14,750 $19,500 32%
2 Central Christian College of the Bible
MO Academic $10,100 $13,200 31%
2 Uta Mesivta of Kiryas Joel NY Academic $5,000 $6,500 30%
2 College of St. Mary Magdalen NH Academic $12,350 $16,000 30%
2 American Baptist College TN Academic $4,800 $6,194 29%
2 School of Urban Missions CA Academic $7,105 $9,120 28%
2 Carver Bible College GA Academic $4,630 $5,920 28%
2 Arkansas Baptist College AR Academic $5,818 $7,432 28%
2 O'More College of Design TN Academic $17,160 $21,900 28%
2 Pacific Northwest College of Art
OR Academic $22,006 $27,926 27%
2 Paul Quinn College TX Academic $9,780 $12,350 26%
2 Providence College RI Academic $31,394 $39,435 26%
2 Colegio Pentecostal Mizpa PR Academic $2,510 $3,150 25%
2 Ashland University Dwight Schar College of Nursing
OH Academic $11,420 $14,260 25%
2 Young Harris College GA Academic $16,630 $20,740 25%
2 New Hampshire Institute of Art
NH Academic $15,690 $19,560 25%
2 Miles College AL Academic $7,968 $9,896 24%
2 Saint Louis Christian College MO Academic $11,450 $14,200 24%
2 William Jewell College MO Academic $23,000 $28,450 24%
2 Southern California Institute of Architecture
CA Academic $22,590 $27,850 23%
2 Hendrix College AR Academic $26,080 $32,040 23%
2 John Dewey College-University Division
PR Academic $4,460 $5,475 23%
2 Dowling College NY Academic $20,310 $24,890 23%
2 Northwestern Health Sciences University
MN Academic $7,944 $9,718 22%
2 Trinity College of Nursing and Health Sciences
IL Academic $17,959 $21,961 22%
2 Thomas More College of Liberal Arts
NH Academic $13,200 $16,100 22%

19
Sector Institution State Calendar System
Year 1 Year 3 Percent Change
2 Saint Augustines College NC Academic $14,124 $17,160 21%
2 Rabbinical College of Ohr
Shimon Yisroel
NY Academic $6,600 $8,000 21%
2 East Texas Baptist University TX Academic $16,140 $19,550 21%
2 Roosevelt University IL Academic $19,000 $23,000 21%
2 Concordia College-Selma AL Academic $6,100 $7,370 21%
2 Howard University DC Academic $15,010 $18,120 21%
2 Somerset Christian College NJ Academic $11,190 $13,480 20%
2 Brigham Young University-
Hawaii
HI Academic $3,600 $4,330 20%
2 New Hope Christian College OR Academic $10,335 $12,430 20%
2 Abilene Christian University TX Academic $18,930 $22,760 20%
2 Bluefield College VA Academic $15,640 $18,800 20%
2 Regent University VA Academic $10,280 $12,330 20%
2 The King’s College NY Academic $22,850 $27,350 20%
2 Hiwassee College TN Academic $12,790 $15,300 20%
2 International Baptist College AZ Academic $9,310 $11,134 20%
2 Houston Baptist University TX Academic $19,390 $23,180 20%
2 Pacific States University CA Academic $13,400 $16,000 19%
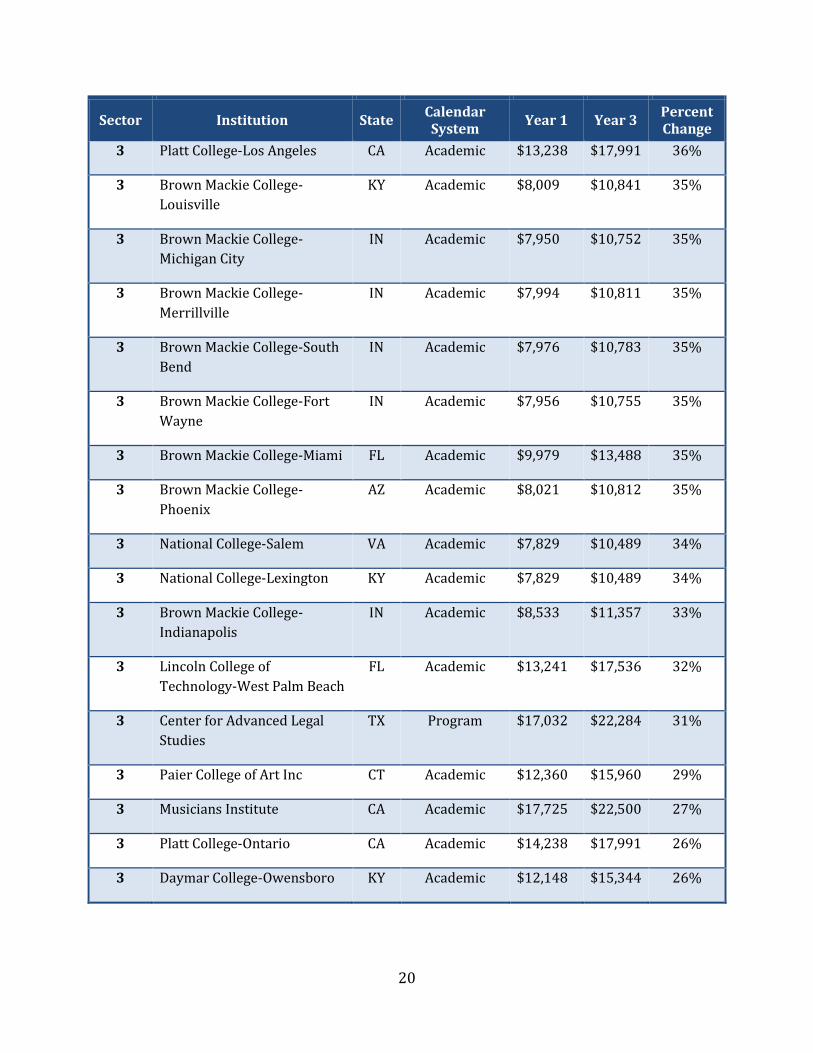
Private for-profit, 4-year or above
3 New England Culinary
Institute
VT Program $24,788 $52,600 112%
3 LA College International CA Program $19,500 $36,300 86%
3 Swedish Institute a College of
Health Sciences
NY Academic $8,300 $11,375 37%
20
Sector Institution State Calendar System
Year 1 Year 3 Percent Change
3 Platt College-Los Angeles CA Academic $13,238 $17,991 36%
3 Brown Mackie College-
Louisville
KY Academic $8,009 $10,841 35%
3 Brown Mackie College-
Michigan City
IN Academic $7,950 $10,752 35%
3 Brown Mackie College-
Merrillville
IN Academic $7,994 $10,811 35%
3 Brown Mackie College-South
Bend
IN Academic $7,976 $10,783 35%
3 Brown Mackie College-Fort
Wayne
IN Academic $7,956 $10,755 35%
3 Brown Mackie College-Miami FL Academic $9,979 $13,488 35%
3 Brown Mackie College-
Phoenix
AZ Academic $8,021 $10,812 35%
3 National College-Salem VA Academic $7,829 $10,489 34%
3 National College-Lexington KY Academic $7,829 $10,489 34%
3 Brown Mackie College-
Indianapolis
IN Academic $8,533 $11,357 33%
3 Lincoln College of
Technology-West Palm Beach
FL Academic $13,241 $17,536 32%
3 Center for Advanced Legal
Studies
TX Program $17,032 $22,284 31%
3 Paier College of Art Inc CT Academic $12,360 $15,960 29%
3 Musicians Institute CA Academic $17,725 $22,500 27%
3 Platt College-Ontario CA Academic $14,238 $17,991 26%
3 Daymar College-Owensboro KY Academic $12,148 $15,344 26%
21
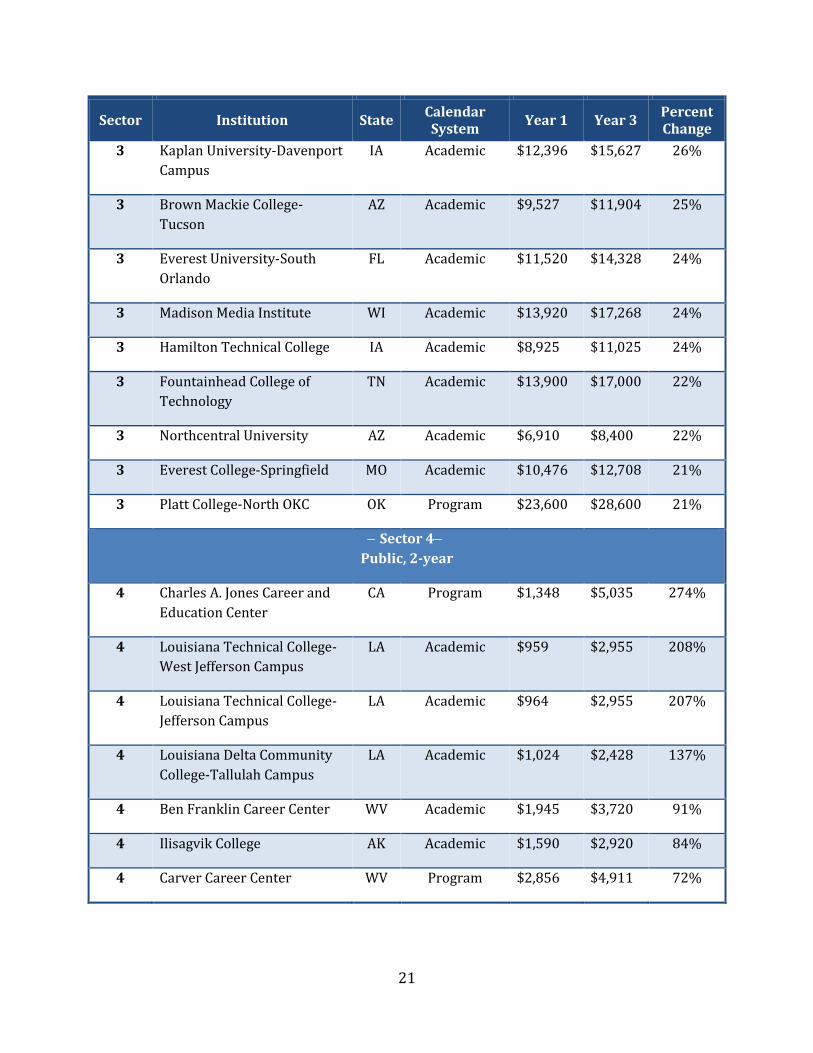
Sector Institution State Calendar System
Year 1 Year 3 Percent Change
3 Kaplan University-Davenport
Campus
IA Academic $12,396 $15,627 26%
3 Brown Mackie College-
Tucson
AZ Academic $9,527 $11,904 25%
3 Everest University-South
Orlando
FL Academic $11,520 $14,328 24%
3 Madison Media Institute WI Academic $13,920 $17,268 24%
3 Hamilton Technical College IA Academic $8,925 $11,025 24%
3 Fountainhead College of
Technology
TN Academic $13,900 $17,000 22%
3 Northcentral University AZ Academic $6,910 $8,400 22%
3 Everest College-Springfield MO Academic $10,476 $12,708 21%
3 Platt College-North OKC OK Program $23,600 $28,600 21%
Public, 2-year
4 Charles A. Jones Career and
Education Center
CA Program $1,348 $5,035 274%
4 Louisiana Technical College-
West Jefferson Campus
LA Academic $959 $2,955 208%
4 Louisiana Technical College-
Jefferson Campus
LA Academic $964 $2,955 207%
4 Louisiana Delta Community
College-Tallulah Campus
LA Academic $1,024 $2,428 137%
4 Ben Franklin Career Center WV Academic $1,945 $3,720 91%
4 Ilisagvik College AK Academic $1,590 $2,920 84%
4 Carver Career Center WV Program $2,856 $4,911 72%

22
Sector Institution State Calendar System
Year 1 Year 3 Percent Change
4 Cape Girardeau Career and
Technology Center
MO Program $6,591 $11,200 70%
4 Columbus Technical College GA Academic $1,527 $2,468 62%
4 Wiregrass Georgia Technical
College
GA Academic $1,572 $2,528 61%
4 Carolinas College of Health
Sciences
NC Program $11,960 $19,095 60%
4 Navajo Technical College NM Academic $1,015 $1,620 60%
4 Nebraska Indian Community
College
NE Academic $2,620 $4,080 56%
4 Northwest Kansas Technical
College
KS Program $5,555 $8,525 53%
4 Sowela Technical Community
College
LA Academic $1,512 $2,307 53%
4 Texas State Technical College
Harlingen
TX Academic $3,414 $5,205 52%
4 Robeson Community College NC Academic $1,404 $2,132 52%
4 West Georgia Technical
College
GA Academic $1,551 $2,355 52%
4 Delgado Community College LA Academic $1,947 $2,955 52%
4 Southwestern Community
College
NC Academic $1,241 $1,873 51%
4 Georgia Northwestern
Technical College
GA Academic $1,539 $2,268 47%
4 Albany Technical College GA Academic $1,539 $2,268 47%
4 Southwest Georgia Technical
College
GA Academic $1,539 $2,268 47%
4 Savannah Technical College GA Academic $1,539 $2,268 47%

23
Sector Institution State Calendar System
Year 1 Year 3 Percent Change
4 Middle Georgia Technical
College
GA Academic $1,539 $2,268 47%
4 Moultrie Technical College GA Academic $1,539 $2,268 47%
4 Okefenokee Technical
College
GA Academic $1,539 $2,268 47%
4 Sandersville Technical
College
GA Academic $1,539 $2,268 47%
4 Southeastern Technical
College
GA Academic $1,539 $2,268 47%
4 Atlanta Technical College GA Academic $1,542 $2,271 47%
4 Augusta Technical College GA Academic $1,551 $2,280 47%
4 Heart of Georgia Technical
College
GA Academic $1,551 $2,280 47%
4 Ogeechee Technical College GA Academic $1,554 $2,283 47%
4 Lanier Technical College GA Academic $1,566 $2,295 47%
4 North Georgia Technical
College
GA Academic $1,581 $2,310 46%
4 American Samoa Community
College
AS Academic $1,990 $2,900 46%
4 South Georgia Technical
College
GA Academic $1,611 $2,340 45%
4 Waycross College GA Academic $1,992 $2,872 44%
4 Lee County High Tech Center
Central
FL Program $2,889 $4,158 44%
4 Western Suffolk BOCES NY Program $24,999 $34,999 40%
4 Virginia Western Community
College
VA Academic $2,380 $3,332 40%

24
Sector Institution State Calendar System
Year 1 Year 3 Percent Change
4 Pikes Peak Community
College
CO Academic $4,498 $6,268 39%
4 Toledo Public Schools Adult
& Continuing Education
OH Program $11,060 $15,400 39%
4 Mississippi Gulf Coast
Community College
MS Academic $1,952 $2,712 39%
Private not-for-profit, 2-year
5 Central Maine Medical Center
College of Nursing & Health
Professions
ME Academic $4,110 $9,165 123%
5 University of Pittsburgh
Medical Center-Shadyside
School of Nursing
PA Academic $7,500 $16,368 118%
5 NAWCC School of Horology PA Program $15,840 $27,170 72%
5 CVPH Medical Center School
of Radiologic Technology
NY Program $10,495 $16,550 58%
5 Portland Actors
Conservatory
OR Academic $5,725 $8,775 53%
5 Carnegie Institute of
Integrative Medicine and
Massotherapy
OH Program $8,496 $12,640 49%
5 American Academy of
Dramatic Arts-New York
NY Academic $20,000 $29,120 46%
5 Little Priest Tribal College NE Academic $2,985 $4,060 36%
Private for-profit, 2-year
6 Pennsylvania School of
Business
PA Academic $900 $8,975 897%

25
Sector Institution State Calendar System
Year 1 Year 3 Percent Change
6 YTI Career Institute-
Mechanicsburg
PA Program $12,230 $26,285 115%
6 International Beauty School MD Program $11,400 $24,000 111%
6 YTI Career Institute-Altoona PA Program $11,800 $22,400 90%
6 Visions in Hair Design
Institute of Cosmetology
WI Program $5,238 $9,725 86%
6 Paul Mitchell the School-
Lexington
KY Program $8,620 $15,185 76%
6 Lucas Marc Academy WA Program $8,543 $15,000 76%
6 Taylor College FL Academic $8,283 $13,960 69%
6 Marinello Schools of Beauty-
Layton
UT Program $10,500 $17,100 63%
6 Josef's School of Hair Design
Inc-Grand Forks
ND Program $8,100 $13,100 62%
6 Josef's School of Hair Design
Inc-Fargo Downtown
ND Program $8,100 $13,100 62%
6 Southern Career College FL Program $12,575 $19,725 57%
6 ImageWorks Academy of
Hair Design
UT Program $11,000 $17,250 57%
6 Professional Training Centers FL Program $24,775 $38,595 56%
6 Paul Mitchell the School-
Monroe
WI Program $9,000 $14,000 56%
6 Marinello Schools of Beauty-
Provo
UT Program $11,000 $17,100 55%
6 Oliver Finley Academy of
Cosmetology
ID Program $10,925 $16,975 55%
6 Louisiana Culinary Institute LA Program $18,100 $28,075 55%
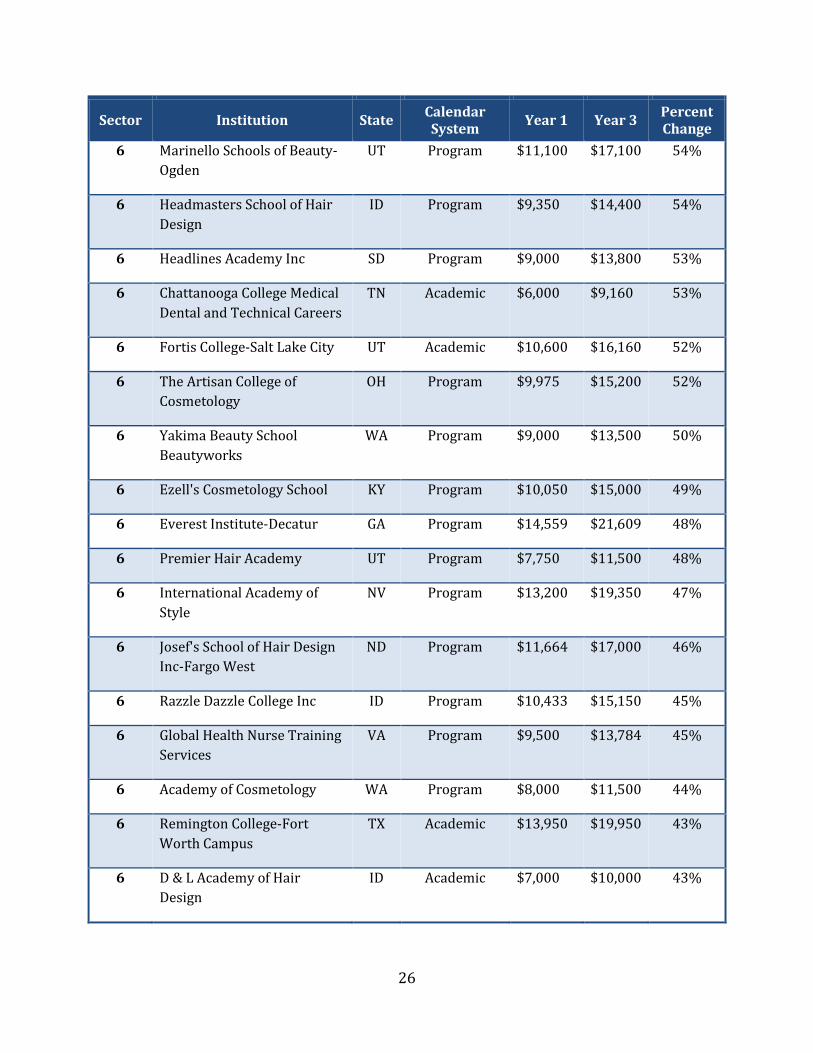
26
Sector Institution State Calendar System
Year 1 Year 3 Percent Change
6 Marinello Schools of Beauty-
Ogden
UT Program $11,100 $17,100 54%
6 Headmasters School of Hair
Design
ID Program $9,350 $14,400 54%
6 Headlines Academy Inc SD Program $9,000 $13,800 53%
6 Chattanooga College Medical
Dental and Technical Careers
TN Academic $6,000 $9,160 53%
6 Fortis College-Salt Lake City UT Academic $10,600 $16,160 52%
6 The Artisan College of
Cosmetology
OH Program $9,975 $15,200 52%
6 Yakima Beauty School
Beautyworks
WA Program $9,000 $13,500 50%
6 Ezell's Cosmetology School KY Program $10,050 $15,000 49%
6 Everest Institute-Decatur GA Program $14,559 $21,609 48%
6 Premier Hair Academy UT Program $7,750 $11,500 48%
6 International Academy of
Style
NV Program $13,200 $19,350 47%
6 Josef's School of Hair Design
Inc-Fargo West
ND Program $11,664 $17,000 46%
6 Razzle Dazzle College Inc ID Program $10,433 $15,150 45%
6 Global Health Nurse Training
Services
VA Program $9,500 $13,784 45%
6 Academy of Cosmetology WA Program $8,000 $11,500 44%
6 Remington College-Fort
Worth Campus
TX Academic $13,950 $19,950 43%
6 D & L Academy of Hair
Design
ID Academic $7,000 $10,000 43%

27
Sector Institution State Calendar System
Year 1 Year 3 Percent Change
6 International College of
Broadcasting
OH Academic $10,300 $14,660 42%
6 J Boutique College of Beauty CA Program $11,925 $16,925 42%
6 Bay Vista College of Beauty CA Program $11,925 $16,925 42%
6 Antonelli College-Hattiesburg MS Academic $10,560 $14,850 41%
6 Fortis College-Cincinnati OH Academic $12,490 $17,518 40%
6 Lincoln Technical Institute-
Fern Park
FL Program $17,125 $23,950 40%
6 Corinth Academy of
Cosmetology
MS Program $4,900 $6,850 40%
6 Fortis College-Tampa FL Academic $12,225 $17,023 39%
6 Mr Leons School of Hair
Design-Moscow
ID Program $9,126 $12,605 38%
6 Everest College-Arlington VA Academic $11,443 $15,750 38%
6 Morgantown Beauty College
Inc
WV Program $11,452 $15,740 37%
6 Aveda Institute-Provo UT Program $9,900 $13,600 37%
6 Carson City Beauty Academy NV Program $14,500 $19,900 37%
6 The Hair Academy ND Program $7,120 $9,720 37%
Public, less-than-2-year
7 Hacienda La Puente Adult
Education
CA Program $150 $1,800 1100%
7 Marion County Technical
Education Center
SC Program $1,090 $6,480 494%
7 Red River Technology Center OK Program $957 $3,755 292%
7 J Everett Light Career Center IN Academic $6,595 $15,000 127%

28
Sector Institution State Calendar System
Year 1 Year 3 Percent Change
7 Monongalia County Technical
Education Center
WV Academic $1,050 $2,360 125%
7 Martinez Adult Education CA Program $900 $1,800 100%
7 Culpeper Cosmetology
Training Center
VA Program $8,050 $13,900 73%
7 Northeast Technology
Center-Kansas
OK Program $1,973 $3,306 68%
7 Taylor Technical Institute FL Program $1,888 $3,125 66%
7 Mahoning County Career and
Technical Center
OH Program $5,760 $9,058 57%
7 Tri County Regional
Vocational Technical High
School
MA Program $4,350 $6,735 55%
Private not-for-profit, less-than-2-year
8 Hawaii Technology Institute HI Program $5,200 $9,275 78%
8 Shear Excellence
International Hair Academy
FL Program $8,500 $12,100 42%
8 Valley Grande Institute for
Academic Studies
TX Program $16,830 $22,185 32%
8 Cayce Reilly School of
Massotherapy
VA Program $7,975 $10,500 32%
8 Southeastern School of
Cosmetology
AL Program $6,450 $8,300 29%
Private for-profit, less-than-2-year
9 Kevosnik School of Hair
Design
GA Program $990 $8,275 736%
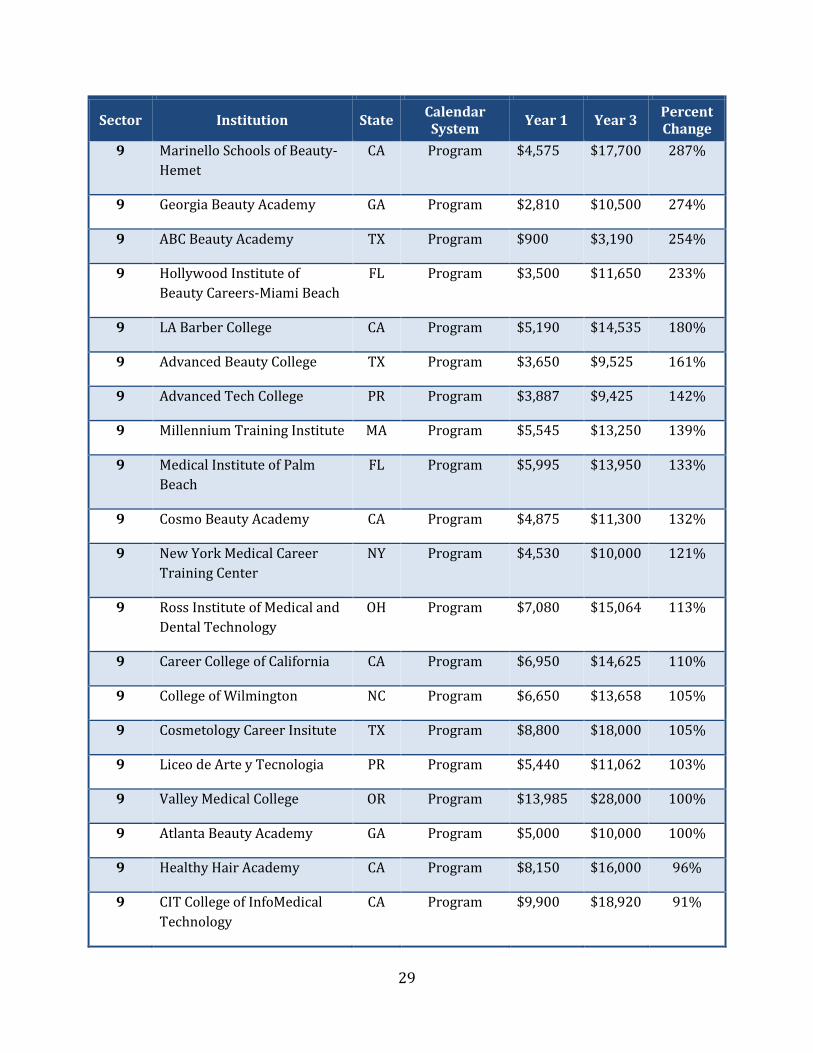
29
Sector Institution State Calendar System
Year 1 Year 3 Percent Change
9 Marinello Schools of Beauty-
Hemet
CA Program $4,575 $17,700 287%
9 Georgia Beauty Academy GA Program $2,810 $10,500 274%
9 ABC Beauty Academy TX Program $900 $3,190 254%
9 Hollywood Institute of
Beauty Careers-Miami Beach
FL Program $3,500 $11,650 233%
9 LA Barber College CA Program $5,190 $14,535 180%
9 Advanced Beauty College TX Program $3,650 $9,525 161%
9 Advanced Tech College PR Program $3,887 $9,425 142%
9 Millennium Training Institute MA Program $5,545 $13,250 139%
9 Medical Institute of Palm
Beach
FL Program $5,995 $13,950 133%
9 Cosmo Beauty Academy CA Program $4,875 $11,300 132%
9 New York Medical Career
Training Center
NY Program $4,530 $10,000 121%
9 Ross Institute of Medical and
Dental Technology
OH Program $7,080 $15,064 113%
9 Career College of California CA Program $6,950 $14,625 110%
9 College of Wilmington NC Program $6,650 $13,658 105%
9 Cosmetology Career Insitute TX Program $8,800 $18,000 105%
9 Liceo de Arte y Tecnologia PR Program $5,440 $11,062 103%
9 Valley Medical College OR Program $13,985 $28,000 100%
9 Atlanta Beauty Academy GA Program $5,000 $10,000 100%
9 Healthy Hair Academy CA Program $8,150 $16,000 96%
9 CIT College of InfoMedical
Technology
CA Program $9,900 $18,920 91%
30
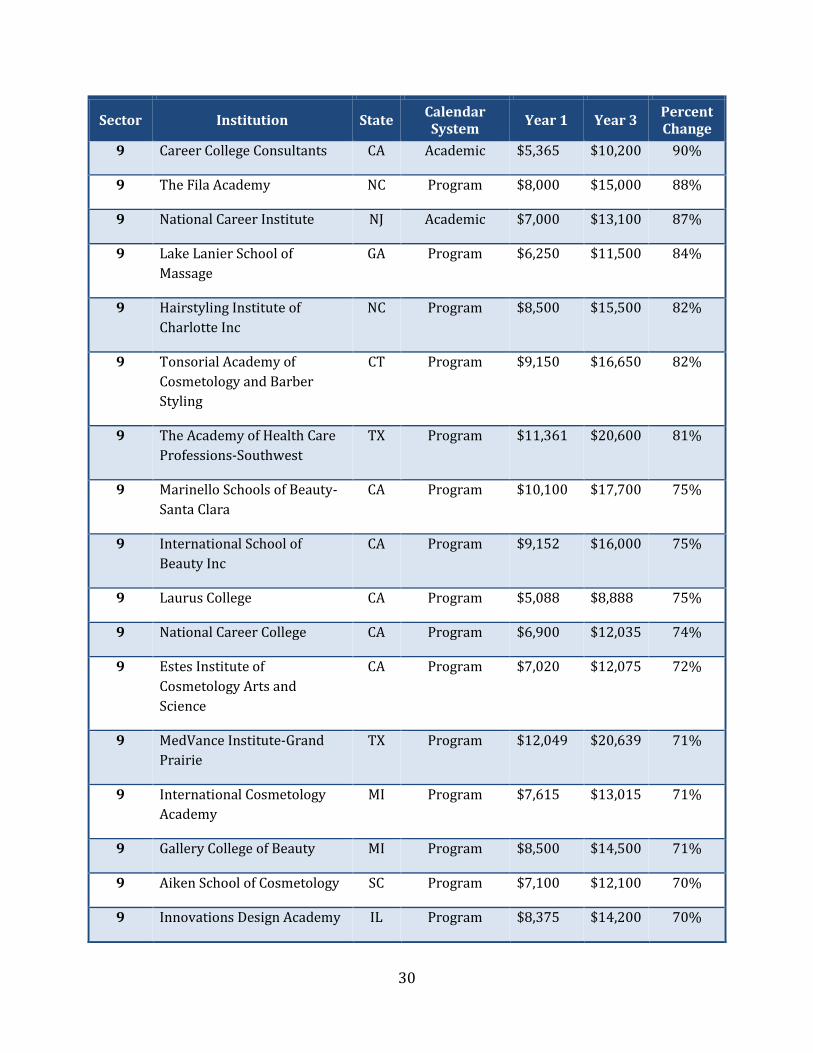
Sector Institution State Calendar System
Year 1 Year 3 Percent Change
9 Career College Consultants CA Academic $5,365 $10,200 90%
9 The Fila Academy NC Program $8,000 $15,000 88%
9 National Career Institute NJ Academic $7,000 $13,100 87%
9 Lake Lanier School of
Massage
GA Program $6,250 $11,500 84%
9 Hairstyling Institute of
Charlotte Inc
NC Program $8,500 $15,500 82%
9 Tonsorial Academy of
Cosmetology and Barber
Styling
CT Program $9,150 $16,650 82%
9 The Academy of Health Care
Professions-Southwest
TX Program $11,361 $20,600 81%
9 Marinello Schools of Beauty-
Santa Clara
CA Program $10,100 $17,700 75%
9 International School of
Beauty Inc
CA Program $9,152 $16,000 75%
9 Laurus College CA Program $5,088 $8,888 75%
9 National Career College CA Program $6,900 $12,035 74%
9 Estes Institute of
Cosmetology Arts and
Science
CA Program $7,020 $12,075 72%
9 MedVance Institute-Grand
Prairie
TX Program $12,049 $20,639 71%
9 International Cosmetology
Academy
MI Program $7,615 $13,015 71%
9 Gallery College of Beauty MI Program $8,500 $14,500 71%
9 Aiken School of Cosmetology SC Program $7,100 $12,100 70%
9 Innovations Design Academy IL Program $8,375 $14,200 70%

31
Sector Institution State Calendar System
Year 1 Year 3 Percent Change
9 Park West Barber School NC Program $6,164 $10,349 68%
9 Career College of San Diego CA Program $7,479 $12,554 68%
9 Universal Barber College AZ Program $9,000 $15,000 67%
9 Borner's Barber College CA Program $10,500 $17,000 62%
9 Salon & Spa Institute TX Program $8,500 $13,650 61%
9 Aguadilla Technical College PR Program $5,730 $9,155 60%
9 American Auto Institute CA Program $10,075 $16,040 59%
9 International Renowned
Beauty Academy
TX Program $7,640 $12,140 59%
9 Mr Waynes School of Unisex
Hair Design
TN Program $8,492 $13,492 59%
9 Eves College of Hairstyling OK Program $9,900 $15,695 59%
9 MCed Career College CA Program $10,150 $16,040 58%
9 Liberty Technical College PR Program $6,500 $10,256 58%
9 Victoria's Academy of
Cosmetology
WA Program $7,803 $12,300 58%
9 Transformed Barber and
Cosmetology Academy
MO Program $9,600 $15,100 57%
9 Avant Gard The School IN Program $7,530 $11,830 57%
9 Lincoln Technical Institute-
Brockton
MA Program $11,147 $17,454 57%
9 Trend Setters School of
Cosmetology
MO Program $7,000 $10,957 57%
9 Lees School of Cosmetology AR Program $10,780 $16,870 56%
9 B Street Design School of
International Hair Styling-
Manhattan
KS Program $9,910 $15,500 56%

32
Sector Institution State Calendar System
Year 1 Year 3 Percent Change
9 Lawton Career Institute-
Warren
MI Program $9,000 $14,000 56%
9 Lawton Career Institute-Oak
Park
MI Program $9,000 $14,000 56%
9 Academy of Salon and Spa AR Program $9,200 $14,115 53%
9 Baldwin Beauty School-South
Austin
TX Program $7,900 $12,100 53%
9 Delta Technical College MS Program $8,975 $13,700 53%
9 Margate School of Beauty Inc FL Program $5,600 $8,530 52%
9 Marinello Schools of Beauty-
Sacramento
CA Program $11,650 $17,700 52%
9 American School of Business LA Program $8,300 $12,600 52%
9 Beyond 21st Century Beauty
Academy
CA Program $7,371 $11,145 51%
9 Micropower Career Institute NY Program $8,605 $13,000 51%
9 Alabama State College of
Barber Styling
AL Program $4,731 $7,138 51%
9 Volunteer Beauty School-
Nashville
TN Program $9,850 $14,800 50%
9 Mojave Barber College CA Program $10,000 $15,000 50%
9 New York School for Medical
and Dental Assistants
NY Program $9,500 $14,250 50%
9 B Street Design School of
International Hair Styling-
Topeka
KS Program $9,250 $13,750 49%
9 Toni & Guy Hairdressing
Academy-Worcester
MA Program $10,200 $15,105 48%
9 Fayetteville Beauty College NC Program $6,600 $9,750 48%

33

34
Appendix II:
2012 Published Net Price List
35
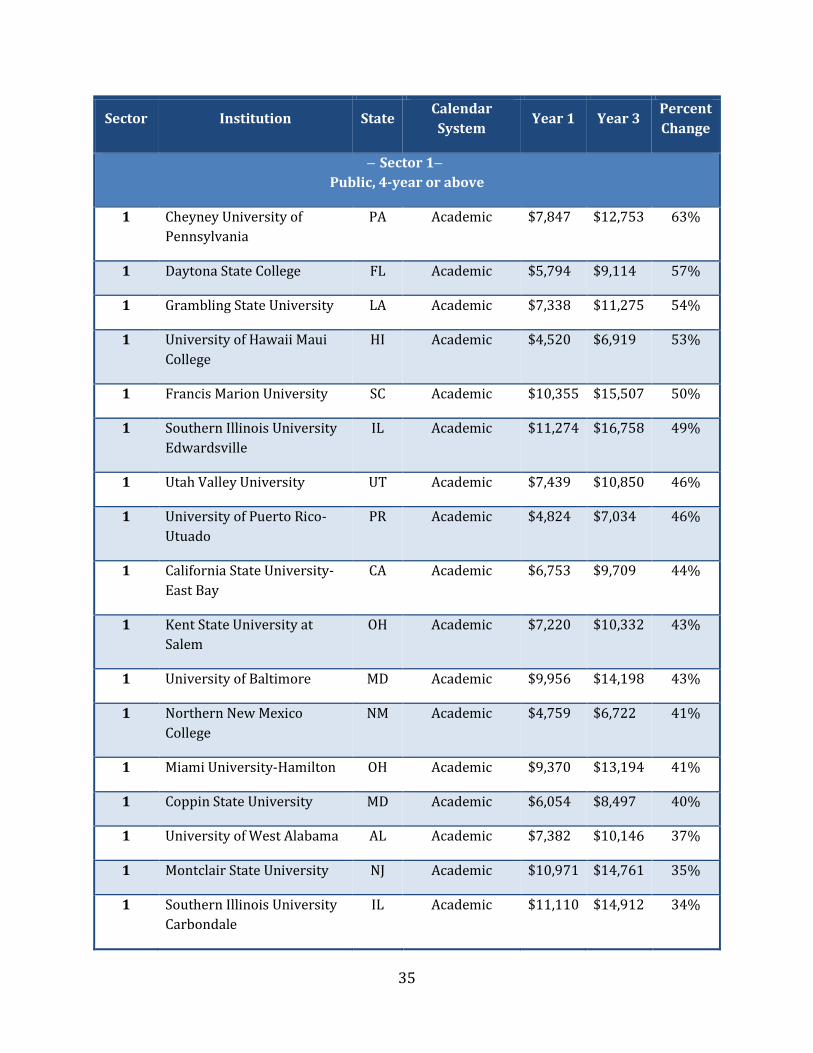
Sector Institution State Calendar
System Year 1 Year 3
Percent
Change
Public, 4-year or above
1 Cheyney University of
Pennsylvania
PA Academic $7,847 $12,753 63%
1 Daytona State College FL Academic $5,794 $9,114 57%
1 Grambling State University LA Academic $7,338 $11,275 54%
1 University of Hawaii Maui
College
HI Academic $4,520 $6,919 53%
1 Francis Marion University SC Academic $10,355 $15,507 50%
1 Southern Illinois University
Edwardsville
IL Academic $11,274 $16,758 49%
1 Utah Valley University UT Academic $7,439 $10,850 46%
1 University of Puerto Rico-
Utuado
PR Academic $4,824 $7,034 46%
1 California State University-
East Bay
CA Academic $6,753 $9,709 44%
1 Kent State University at
Salem
OH Academic $7,220 $10,332 43%
1 University of Baltimore MD Academic $9,956 $14,198 43%
1 Northern New Mexico
College
NM Academic $4,759 $6,722 41%
1 Miami University-Hamilton OH Academic $9,370 $13,194 41%
1 Coppin State University MD Academic $6,054 $8,497 40%
1 University of West Alabama AL Academic $7,382 $10,146 37%
1 Montclair State University NJ Academic $10,971 $14,761 35%
1 Southern Illinois University
Carbondale
IL Academic $11,110 $14,912 34%
36
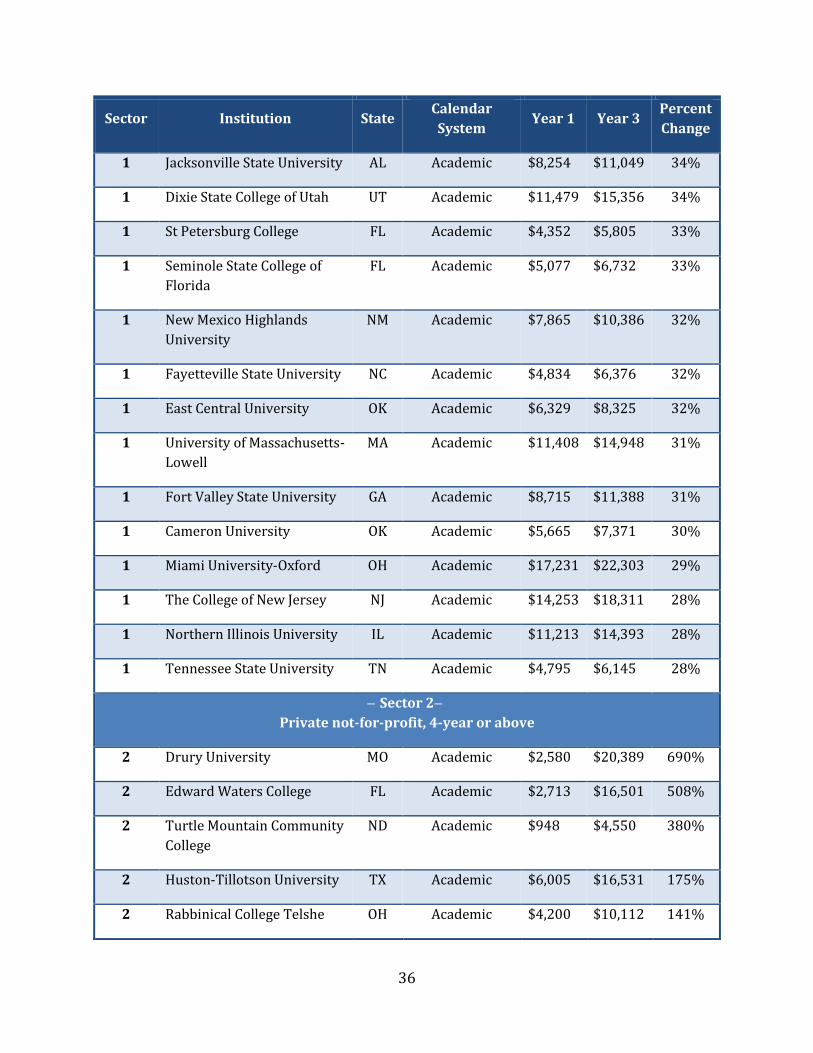
Sector Institution State Calendar
System Year 1 Year 3
Percent
Change
1 Jacksonville State University AL Academic $8,254 $11,049 34%
1 Dixie State College of Utah UT Academic $11,479 $15,356 34%
1 St Petersburg College FL Academic $4,352 $5,805 33%
1 Seminole State College of
Florida
FL Academic $5,077 $6,732 33%
1 New Mexico Highlands
University
NM Academic $7,865 $10,386 32%
1 Fayetteville State University NC Academic $4,834 $6,376 32%
1 East Central University OK Academic $6,329 $8,325 32%
1 University of Massachusetts-
Lowell
MA Academic $11,408 $14,948 31%
1 Fort Valley State University GA Academic $8,715 $11,388 31%
1 Cameron University OK Academic $5,665 $7,371 30%
1 Miami University-Oxford OH Academic $17,231 $22,303 29%
1 The College of New Jersey NJ Academic $14,253 $18,311 28%
1 Northern Illinois University IL Academic $11,213 $14,393 28%
1 Tennessee State University TN Academic $4,795 $6,145 28%
Private not-for-profit, 4-year or above
2 Drury University MO Academic $2,580 $20,389 690%
2 Edward Waters College FL Academic $2,713 $16,501 508%
2 Turtle Mountain Community
College
ND Academic $948 $4,550 380%
2 Huston-Tillotson University TX Academic $6,005 $16,531 175%
2 Rabbinical College Telshe OH Academic $4,200 $10,112 141%

37
Sector Institution State Calendar
System Year 1 Year 3
Percent
Change
2 Saint Charles Borromeo
Seminary-Overbrook
PA Academic $7,233 $17,410 141%
2 Sinte Gleska University SD Academic $6,400 $14,809 131%
2 Touro College NY Academic $2,444 $5,554 127%
2 Hiwassee College TN Academic $5,112 $11,455 124%
2 Universidad Teologica del
Caribe
PR Academic $2,910 $6,177 112%
2 Philadelphia Biblical
University-Langhorne
PA Academic $11,595 $24,355 110%
2 Niagara University NY Academic $8,463 $17,123 102%
2 Bellevue University NE Academic $6,514 $11,813 81%
2 American Baptist College TN Academic $7,487 $13,349 78%
2 Donnelly College KS Academic $6,499 $11,554 78%
2 Cornish College of the Arts WA Academic $19,531 $34,047 74%
2 Ecclesia College AR Academic $11,515 $19,999 74%
2 School of Urban Missions CA Academic $10,090 $17,463 73%
2 Columbia College MO Academic $10,840 $18,402 70%
2 Heritage University WA Academic $6,017 $10,092 68%
2 Our Lady of Holy Cross
College
LA Academic $3,283 $5,463 66%
2 Northwestern Health
Sciences University
MN Academic $13,573 $22,004 62%
2 Peirce College PA Academic $9,967 $16,132 62%
2 Brigham Young University-
Hawaii
HI Academic $7,870 $12,571 60%

38
Sector Institution State Calendar
System Year 1 Year 3
Percent
Change
2 Beth Hamedrash Shaarei
Yosher Institute
NY Academic $3,268 $5,153 58%
2 International Baptist College AZ Academic $11,909 $18,649 57%
2 Miles College AL Academic $8,251 $12,677 54%
2 Wesley College DE Academic $18,033 $27,674 53%
2 Ner Israel Rabbinical College MD Academic $7,401 $11,288 53%
2 Heritage Christian
University
AL Academic $7,783 $11,780 51%
2 Rabbinical Academy Mesivta
Rabbi Chaim Berlin
NY Academic $5,718 $8,648 51%
2 BryanLGH College of Health
Sciences
NE Academic $14,784 $22,061 49%
2 Reinhardt University GA Academic $13,276 $19,712 48%
2 Bais Medrash Toras Chesed NJ Academic $5,487 $8,073 47%
2 Rabbinical College of Long
Island
NY Academic $7,553 $11,072 47%
2 Mesivtha Tifereth Jerusalem
of America
NY Academic $4,167 $6,096 46%
2 Messenger College MO Academic $10,339 $15,086 46%
2 Yeshiva D'monsey
Rabbinical College
NY Academic $5,000 $7,288 46%
2 Millikin University IL Academic $12,527 $18,131 45%
2 John Dewey College-
University Division
PR Academic $1,457 $2,105 44%
2 Ouachita Baptist University AR Academic $10,615 $15,265 44%
2 National-Louis University IL Academic $17,238 $24,734 43%
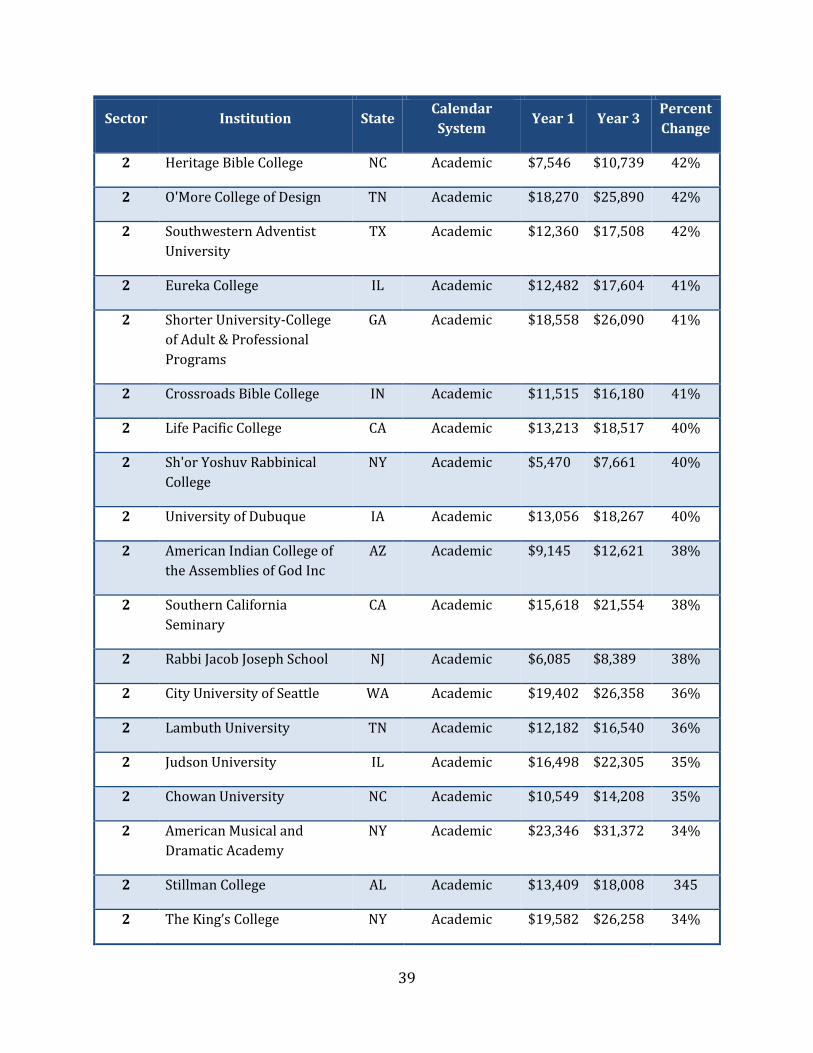
39
Sector Institution State Calendar
System Year 1 Year 3
Percent
Change
2 Heritage Bible College NC Academic $7,546 $10,739 42%
2 O'More College of Design TN Academic $18,270 $25,890 42%
2 Southwestern Adventist
University
TX Academic $12,360 $17,508 42%
2 Eureka College IL Academic $12,482 $17,604 41%
2 Shorter University-College
of Adult & Professional
Programs
GA Academic $18,558 $26,090 41%
2 Crossroads Bible College IN Academic $11,515 $16,180 41%
2 Life Pacific College CA Academic $13,213 $18,517 40%
2 Sh'or Yoshuv Rabbinical
College
NY Academic $5,470 $7,661 40%
2 University of Dubuque IA Academic $13,056 $18,267 40%
2 American Indian College of
the Assemblies of God Inc
AZ Academic $9,145 $12,621 38%
2 Southern California
Seminary
CA Academic $15,618 $21,554 38%
2 Rabbi Jacob Joseph School NJ Academic $6,085 $8,389 38%
2 City University of Seattle WA Academic $19,402 $26,358 36%
2 Lambuth University TN Academic $12,182 $16,540 36%
2 Judson University IL Academic $16,498 $22,305 35%
2 Chowan University NC Academic $10,549 $14,208 35%
2 American Musical and
Dramatic Academy
NY Academic $23,346 $31,372 34%
2 Stillman College AL Academic $13,409 $18,008 345
2 The King’s College NY Academic $19,582 $26,258 34%

40
Sector Institution State Calendar
System Year 1 Year 3
Percent
Change
2 Maharishi University of
Management
IA Academic $13,924 $18,645 34%
Private for-profit, 4-year or above
3 International Academy of
Design and Technology-
Sacramento
CA Academic $5,223 $16,123 209%
3 National American
University-Albuquerque
NM Academic $6,732 $17,940 166%
3 Bryant and Stratton College-
Parma
OH Academic $10,139 $19,022 88%
3 Daymar Institute-Clarksville TN Academic $13,453 $25,193 87%
3 Globe Institute of
Technology
NY Academic $13,651 $24,502 79%
3 National American
University-Bloomington
MN Academic $8,912 $15,871 78%
3 Expression College for
Digital Arts
CA Academic $5,984 $10,592 77%
3 Bryant & Stratton College-
Cleveland
OH Academic $11,763 $20,212 72%
3 Keiser University-Ft
Lauderdale
FL Academic $10,215 $17,469 71%
3 National American
University-Roseville
MN Academic $10,228 $16,801 64%
3 National University College-
Bayamon
PR Academic $5,374 $8,686 62%
3 Angley College FL Academic $15,842 $24,923 57%
3 National American
University-Brooklyn Center
MN Academic $10,742 $16,892 57%
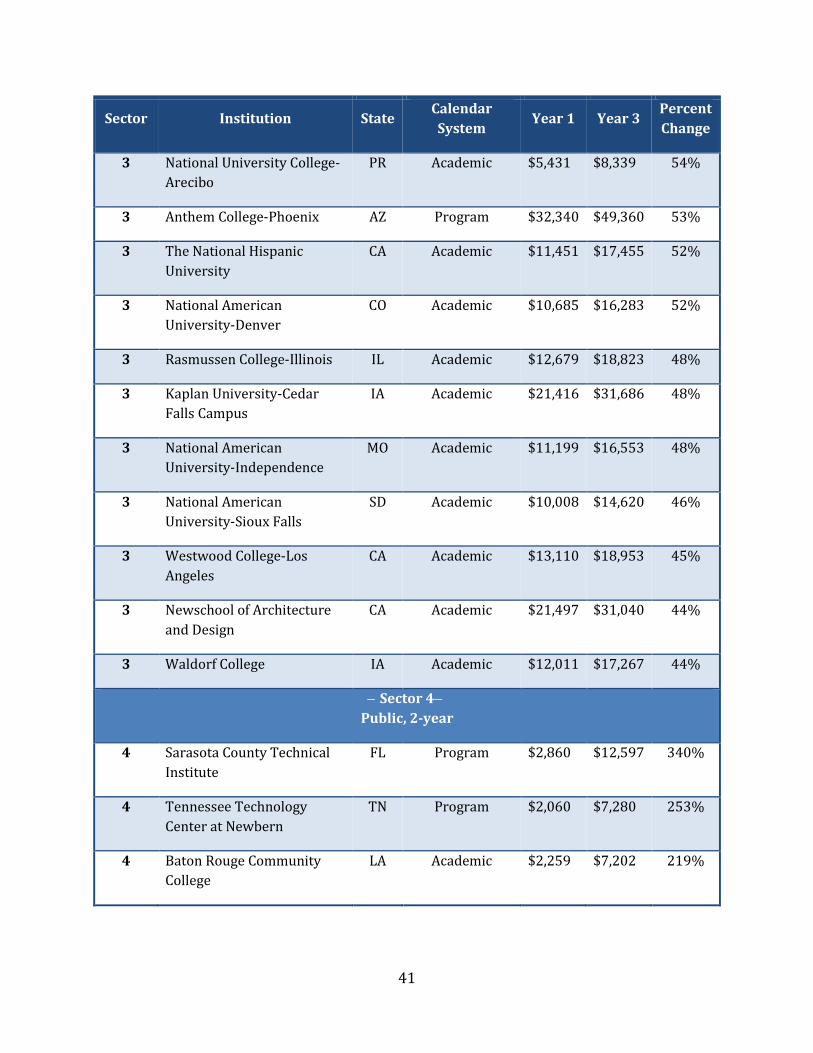
41
Sector Institution State Calendar
System Year 1 Year 3
Percent
Change
3 National University College-
Arecibo
PR Academic $5,431 $8,339 54%
3 Anthem College-Phoenix AZ Program $32,340 $49,360 53%
3 The National Hispanic
University
CA Academic $11,451 $17,455 52%
3 National American
University-Denver
CO Academic $10,685 $16,283 52%
3 Rasmussen College-Illinois IL Academic $12,679 $18,823 48%
3 Kaplan University-Cedar
Falls Campus
IA Academic $21,416 $31,686 48%
3 National American
University-Independence
MO Academic $11,199 $16,553 48%
3 National American
University-Sioux Falls
SD Academic $10,008 $14,620 46%
3 Westwood College-Los
Angeles
CA Academic $13,110 $18,953 45%
3 Newschool of Architecture
and Design
CA Academic $21,497 $31,040 44%
3 Waldorf College IA Academic $12,011 $17,267 44%
Public, 2-year
4 Sarasota County Technical
Institute
FL Program $2,860 $12,597 340%
4 Tennessee Technology
Center at Newbern
TN Program $2,060 $7,280 253%
4 Baton Rouge Community
College
LA Academic $2,259 $7,202 219%

42
Sector Institution State Calendar
System Year 1 Year 3
Percent
Change
4 Moore Norman Technology
Center
OK Program $2,100 $5,640 169%
4 Eastern West Virginia
Community and Technical
College
WV Academic $2,726 $7,294 168%
4 Coastline Community
College
CA Academic $3,138 $8,274 164%
4 Southeastern Illinois College IL Academic $4,538 $11,293 149%
4 Tennessee Technology
Center at Knoxville
TN Program $2,472 $5,784 134%
4 Central Carolina Community
College
NC Academic $3,172 $7,380 133%
4 Saddleback College CA Academic $5,972 $13,461 125%
4 Illinois Eastern Community
Colleges-Frontier
Community College
IL Academic $1,407 $3,059 117%
4 Crafton Hills College CA Academic $4,016 $8,614 114%
4 Tennessee Technology
Center at Jackson
TN Program $3,156 $6,696 112%
4 New River Community and
Technical College
WV Academic $4,149 $8,305 100%
4 Tohono O'Odham
Community College
AZ Academic $3,594 $7,029 96%
4 Paul D Camp Community
College
VA Academic $2,998 $5,847 95%
4 Los Angeles Harbor College CA Academic $4,830 $9,414 95%
4 Itawamba Community
College
MS Academic $3,641 $6,964 91%

43
Sector Institution State Calendar
System Year 1 Year 3
Percent
Change
4 Richard Bland College of the
College of William and Mary
VA Academic $4,595 $8,771 91%
4 Mt. San Antonio College CA Academic $3,098 $5,913 91%
4 Leech Lake Tribal College MN Academic $3,863 $7,302 89%
4 Davidson County
Community College
NC Academic $5,293 $9,948 88%
4 Illinois Eastern Community
Colleges-Wabash Valley
College
IL Academic $1,671 $3,096 85%
4 Ozarka College AR Academic $3,600 $6,654 85%
4 Napa Valley College CA Academic $6,007 $11,098 85%
4 Uintah Basin Applied
Technology College
UT Program $4,548 $8,340 83%
4 Saginaw Chippewa Tribal
College
MI Academic $3,757 $6,884 83%
4 Rio Hondo College CA Academic $4,800 $8,711 81%
4 Flint Hills Technical College KS Academic $5,241 $9,488 81%
4 Nunez Community College LA Academic $2,013 $3,634 81%
4 Atlantic Technical Center FL Program $7,284 $12,696 74%
4 Orange Coast College CA Academic $3,219 $5,563 73%
4 South Arkansas Community
College
AR Academic $4,380 $7,541 72%
4 Prairie State College IL Academic $2,730 $4,641 70%
4 Northwest Shoals
Community College-Muscle
Shoals
AL Academic $3,288 $5,545 69%

44
Sector Institution State Calendar
System Year 1 Year 3
Percent
Change
4 North Florida Community
College
FL Academic $1,042 $1,754 68%
4 Lorain County Community
College
OH Academic $2,522 $4,230 68%
4 Irvine Valley College CA Academic $6,154 $10,064 64%
4 Western Wyoming
Community College
WY Academic $3,871 $6,311 63%
4 Lively Technical Center FL Program $7,448 $12,096 62%
4 Chaffey College CA Academic $6,094 $9,786 61%
4 Pinellas Technical Education
Center-Clearwater
FL Program $10,206 $16,380 60%
4 Tennessee Technology
Center at Dickson
TN Program $5,184 $8,304 60%
4 Oklahoma City Community
College
OK Academic $4,549 $7,260 60%
4 John C Calhoun State
Community College
AL Academic $2,976 $4,738 59%
4 Canada College CA Academic $4,556 $7,215 58%
4 Fort Berthold Community
College
ND Academic $3,053 $4,825 58%
4 Spoon River College IL Academic $5,737 $9,066 58%
4 McDowell Technical
Community College
NC Academic $5,631 $8,856 57%
4 Bridgemont Community and
Technical College
WV Academic $1,915 $3,010 57%
4 Isothermal Community
College
NC Academic $4,376 $6,792 55%

45
Sector Institution State Calendar
System Year 1 Year 3
Percent
Change
Private not-for-profit, 2-year
5 St Joseph School of Nursing RI Academic $4,801 $18,164 278%
5 Iowa Health-Des Moines
School of Radiologic
Technology
IA Academic $3,692 $12,272 232%
5 Graham Hospital School of
Nursing
IL Academic $5,846 $17,061 192%
5 Southeast Missouri Hospital
College of Nursing and
Health Sciences
MO Academic $5,801 $14,960 158%
5 Los Angeles ORT College-Los
Angeles Campus
CA Program $7,356 $16,152 120%
5 Los Angeles ORT College-
Van Nuys Campus
CA Program $8,484 $17,196 103%
5 Emil Fries Piano Hospital
and Training Center
WA Academic $11,000 $22,200 102%
Private for-profit, 2-year
6 The School of Hairstyling ID Program $2,976 $26,808 801%
6 Bryant and Stratton College-
Main Syracuse
NY Academic $1,906 $14,627 667%
6 American College of
Technology
MO Program $1,792 $13,636 661%
6 Marinello Schools of Beauty-
Ogden
UT Program $3,456 $13,008 276%
6 Harrison College-Elkhart IN Academic $5,255 $16,560 215%
6 Pennsylvania School of
Business
PA Academic $1,121 $2,805 150%
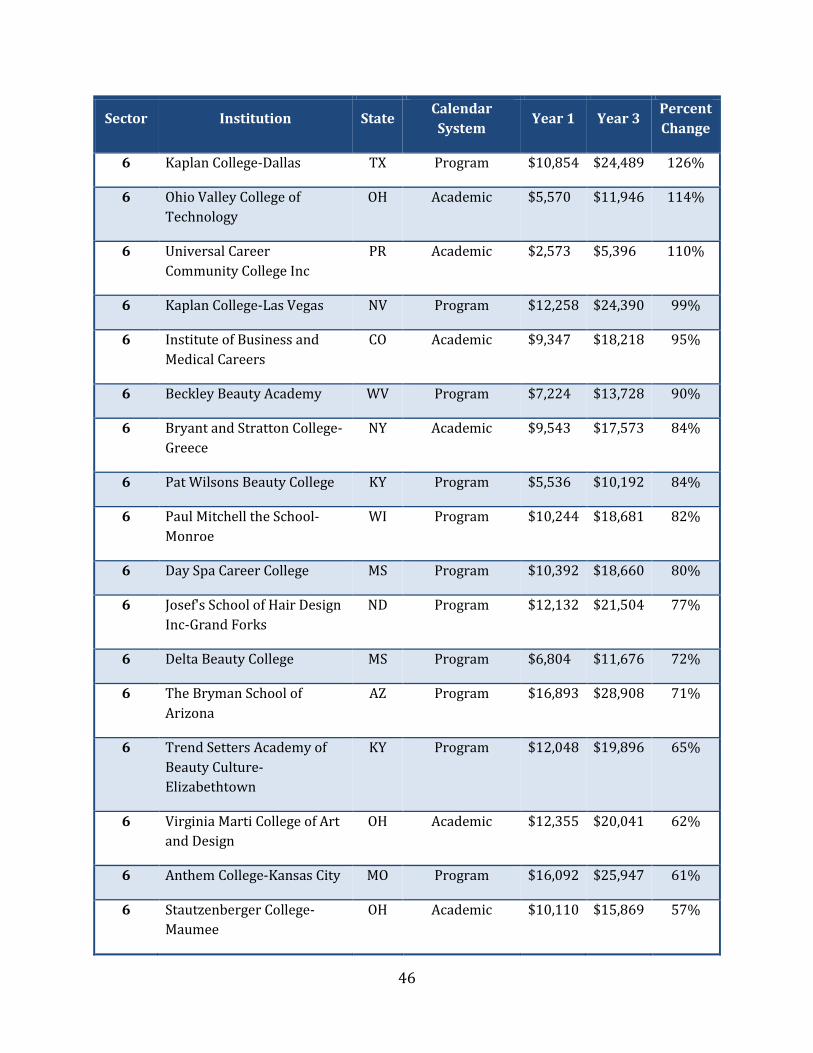
46
Sector Institution State Calendar
System Year 1 Year 3
Percent
Change
6 Kaplan College-Dallas TX Program $10,854 $24,489 126%
6 Ohio Valley College of
Technology
OH Academic $5,570 $11,946 114%
6 Universal Career
Community College Inc
PR Academic $2,573 $5,396 110%
6 Kaplan College-Las Vegas NV Program $12,258 $24,390 99%
6 Institute of Business and
Medical Careers
CO Academic $9,347 $18,218 95%
6 Beckley Beauty Academy WV Program $7,224 $13,728 90%
6 Bryant and Stratton College-
Greece
NY Academic $9,543 $17,573 84%
6 Pat Wilsons Beauty College KY Program $5,536 $10,192 84%
6 Paul Mitchell the School-
Monroe
WI Program $10,244 $18,681 82%
6 Day Spa Career College MS Program $10,392 $18,660 80%
6 Josef's School of Hair Design
Inc-Grand Forks
ND Program $12,132 $21,504 77%
6 Delta Beauty College MS Program $6,804 $11,676 72%
6 The Bryman School of
Arizona
AZ Program $16,893 $28,908 71%
6 Trend Setters Academy of
Beauty Culture-
Elizabethtown
KY Program $12,048 $19,896 65%
6 Virginia Marti College of Art
and Design
OH Academic $12,355 $20,041 62%
6 Anthem College-Kansas City MO Program $16,092 $25,947 61%
6 Stautzenberger College-
Maumee
OH Academic $10,110 $15,869 57%

47
Sector Institution State Calendar
System Year 1 Year 3
Percent
Change
6 Joe Kubert School of Cartoon
and Graphic Art
NJ Academic $15,393 $24,147 57%
6 Creative Images Institute of
Cosmetology-South Dayton
OH Program $16,779 $26,282 57%
6 Bryant and Stratton College-
Syracuse North
NY Academic $10,714 $16,758 56%
6 Anthem College-Minnesota MN Program $17,262 $26,811 55%
6 Glenwood Beauty Academy CO Program $11,145 $17,250 55%
6 Denver Academy of Court
Reporting
CO Academic $11,600 $17,949 55%
6 High-Tech Institute-Dallas TX Program $16,839 $25,857 54%
6 Galen College of Nursing-San
Antonio
TX Program $14,676 $22,488 53%
6 Miami-Jacobs Career
College-Sharonville
OH Academic $11,853 $18,135 53%
6 Metro Business College-
Rolla
MO Academic $6,980 $10,671 53%
6 Hussian School of Art PA Academic $10,218 $15,537 52%
6 Professional Training
Centers
FL Program $22,704 $34,248 51%
6 Total Look School of
Cosmetology & Massage
Therapy
IA Program $10,430 $15,666 50%
6 Western Hills School of
Beauty and Hair Design
OH Program $18,375 $27,510 50%
6 Stautzenberger College-
Brecksville
OH Academic $12,931 $19,273 49%
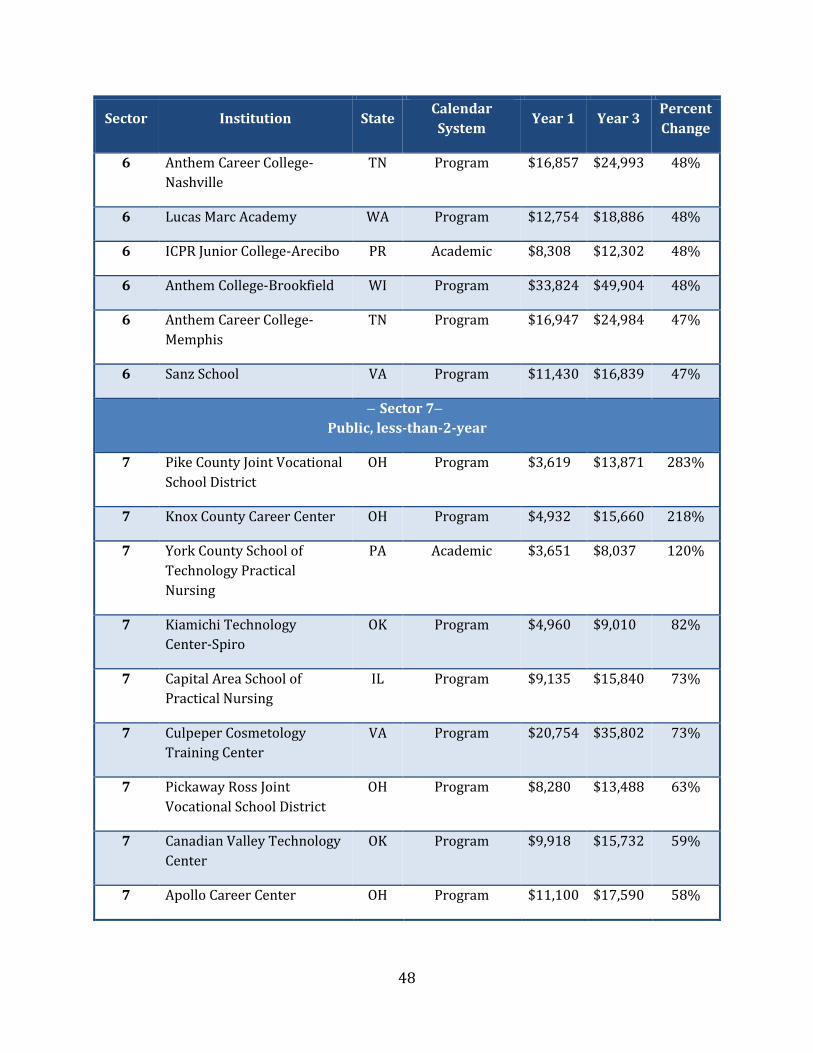
48
Sector Institution State Calendar
System Year 1 Year 3
Percent
Change
6 Anthem Career College-
Nashville
TN Program $16,857 $24,993 48%
6 Lucas Marc Academy WA Program $12,754 $18,886 48%
6 ICPR Junior College-Arecibo PR Academic $8,308 $12,302 48%
6 Anthem College-Brookfield WI Program $33,824 $49,904 48%
6 Anthem Career College-
Memphis
TN Program $16,947 $24,984 47%
6 Sanz School VA Program $11,430 $16,839 47%
Public, less-than-2-year
7 Pike County Joint Vocational
School District
OH Program $3,619 $13,871 283%
7 Knox County Career Center OH Program $4,932 $15,660 218%
7 York County School of
Technology Practical
Nursing
PA Academic $3,651 $8,037 120%
7 Kiamichi Technology
Center-Spiro
OK Program $4,960 $9,010 82%
7 Capital Area School of
Practical Nursing
IL Program $9,135 $15,840 73%
7 Culpeper Cosmetology
Training Center
VA Program $20,754 $35,802 73%
7 Pickaway Ross Joint
Vocational School District
OH Program $8,280 $13,488 63%
7 Canadian Valley Technology
Center
OK Program $9,918 $15,732 59%
7 Apollo Career Center OH Program $11,100 $17,590 58%

49
Sector Institution State Calendar
System Year 1 Year 3
Percent
Change
Private not-for-profit, less-than-2-year
8 Hawaii Technology Institute HI Program $1,488 $12,480 739%
8 Employment Solutions-
College for Technical
Education
KY Program $8,109 $20,439 152%
8 Mercy Hospital School of
Practical Nursing
FL Program $10,260 $18,972 85%
8 Manhattan School of
Computer Technology
NY Program $8,225 $13,377 63%
Private for-profit, less-than-2-year
9 Lawton Career Institute-Oak
Park
MI Program $2,970 $15,102 408%
9 InterCoast Colleges-Orange CA Program $6,810 $21,370 214%
9 Regency Beauty Institute-
Winston-Salem
NC Program $10,320 $31,776 208%
9 Liberty Technical College PR Program $2,538 $7,218 184%
9 Toni & Guy Hairdressing
Academy-Shoreline
WA Program $6,270 $16,907 170%
9 Quality Technical and
Beauty College
PR Program $2,400 $6,300 163%
9 School of Automotive
Machinists
TX Program $16,452 $42,588 159%
9 Leston College PR Program $2,232 $5,712 156%
9 CIT College of InfoMedical
Technology
CA Program $14,952 $38,094 155%

50
Sector Institution State Calendar
System Year 1 Year 3
Percent
Change
9 Xenon International
Academy-Kansas City
KS Program $9,878 $24,068 144%
9 Mid-Cities Barber College TX Program $3,696 $8,604 133%
9 Woodward Beauty College OK Program $8,099 $18,317 126%
9 Thanh Le College School of
Cosmetology
CA Program $6,102 $13,698 124%
9 BioHealth College CA Program $15,414 $34,398 123%
9 Texas Vocational Schools Inc TX Program $7,630 $16,800 120%
9 Estes Institute of
Cosmetology Arts and
Science
CA Program $9,384 $20,004 113%
9 Lawton Career Institute-
Warren
MI Program $7,330 $15,390 110%
9 Drake College of Business-
Elizabeth
NJ Program $10,507 $22,029 110%
9 Arthur's Beauty College Inc AR Program $8,292 $17,232 108%
9 Marinello Schools of Beauty-
Hemet
CA Program $12,116 $23,907 97%
9 Ravenscroft Beauty College IN Program $11,628 $22,788 96%
9 Strand College of Hair
Design
SC Program $13,247 $25,584 93%
9 Pipo Academy of Hair
Design
TX Program $5,642 $10,528 87%
9 Euclid Beauty College OH Program $17,700 $32,904 86%
9 Michael's School of Beauty GA Program $7,788 $14,448 86%
9 Elite Academy of Beauty
Arts
NY Program $9,204 $17,064 85%

51
Sector Institution State Calendar
System Year 1 Year 3
Percent
Change
9 Total International Career
Institute
FL Program $5,910 $10,914 85%
9 American Beauty Institute OK Program $11,436 $20,580 80%
9 Award Beauty School MD Program $11,928 $20,580 73%
9 American Professional
Institute
GA Program $12,053 $20,711 72%
9 Eclipse School of
Cosmetology and Barbering
MO Program $7,568 $12,892 70%
9 Institute of Beauty
Occupation and Technology
Course
PR Program $5,355 $9,060 69%
9 Central State Massage
Academy
OK Program $8,050 $13,610 69%
9 Winston Salem Barber
School
NC Program $5,090 $8,600 69%
9 Rosel School of Cosmetology IL Program $4,590 $7,740 69%
9 Anthem College-Portland OR Program $16,830 $28,296 68%
9 Houston Training School-
Jacinto City
TX Program $4,536 $7,614 68%
9 Lees School of Cosmetology AR Program $12,612 $21,000 67%
9 International Cosmetology
Academy
MI Program $14,820 $24,480 65%
9 National Beauty College TX Program $20,232 $32,808 62%
9 Toni & Guy Hairdressing
Academy-Colorado Springs
CO Program $11,506 $18,623 62%
9 Arthur's Beauty School Inc-
Conway
AR Program $10,128 $16,368 62%
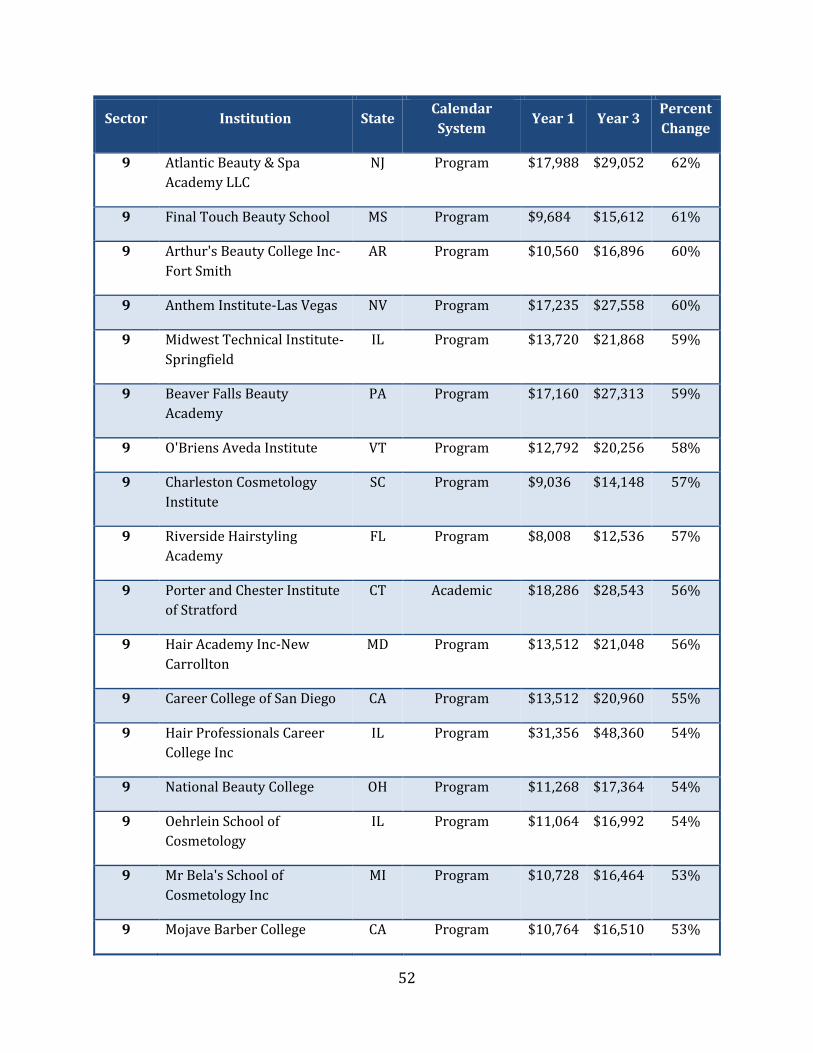
52
Sector Institution State Calendar
System Year 1 Year 3
Percent
Change
9 Atlantic Beauty & Spa
Academy LLC
NJ Program $17,988 $29,052 62%
9 Final Touch Beauty School MS Program $9,684 $15,612 61%
9 Arthur's Beauty College Inc-
Fort Smith
AR Program $10,560 $16,896 60%
9 Anthem Institute-Las Vegas NV Program $17,235 $27,558 60%
9 Midwest Technical Institute-
Springfield
IL Program $13,720 $21,868 59%
9 Beaver Falls Beauty
Academy
PA Program $17,160 $27,313 59%
9 O'Briens Aveda Institute VT Program $12,792 $20,256 58%
9 Charleston Cosmetology
Institute
SC Program $9,036 $14,148 57%
9 Riverside Hairstyling
Academy
FL Program $8,008 $12,536 57%
9 Porter and Chester Institute
of Stratford
CT Academic $18,286 $28,543 56%
9 Hair Academy Inc-New
Carrollton
MD Program $13,512 $21,048 56%
9 Career College of San Diego CA Program $13,512 $20,960 55%
9 Hair Professionals Career
College Inc
IL Program $31,356 $48,360 54%
9 National Beauty College OH Program $11,268 $17,364 54%
9 Oehrlein School of
Cosmetology
IL Program $11,064 $16,992 54%
9 Mr Bela's School of
Cosmetology Inc
MI Program $10,728 $16,464 53%
9 Mojave Barber College CA Program $10,764 $16,510 53%

53
Sector Institution State Calendar
System Year 1 Year 3
Percent
Change
9 Arthur's Beauty School Inc-
Pine Bluff
AR Program $10,452 $15,864 52%
9 TDDS Technical Institute OH Program $3,516 $5,334 52%
9 Medical Professional
Institute
MA Program $16,548 $25,092 52%
54
Appendix III:
Response Rates to Collection Form

55
As previously noted, institutions on the tuition list and/or the net price list posted on June
12, 2012 were required to report information on cost increases using the online CATEF. As
shown in Table 2, most institutions required to complete the survey did so—about 97
percent of institutions on the tuition list, 98 percent of institutions on the net price list, and
96 percent of institutions on both lists. A total of 14 institutions were non-compliant.
Table 2. Responses to the College Affordability and Transparency Explanation Form, by list and
institutional sector.
Sector Tuition List Only Net Price List Only On Both Lists
Number of
institutions
required to
complete
survey
Number
that
completed
survey
Number of
institutions
required to
complete
survey
Number
that
completed
survey
Number of
institutions
required to
complete
survey
Number
that
completed
survey
Public
4-year 33 31 31 31 0 0
2-year 40 40 51 49 0 0
Less-than-2-year 9 9 8 8 1 1
Private for-profit
4-year 28 28 23 22 0 0
2-year 40 39 36 35 6 6
Less-than-2-year 59 56 50 49 8 8
Private non-profit
4-year 50 49 48 47 13 12
2-year 5 5 7 7 0 0
Less-than-2-year 4 4 3 3 0 0
Total 268 261 257 251 28 27
When completing the survey, some institutions indicated that the percentage increase in
one or more of their identified cost areas was all or partially attributable to a change in
their method of financial accounting over the three-year period. In fact, about 20% of
institutions on the tuition list, and 30% of institutions on the net price list, reported that
they had changed their method of classifying expenses during the three-year time period.
In these cases, the institutions were asked to identify what they felt were their true areas of
greatest cost increase and/or the true driver of the percentage increase in tuition and fees
or the percentage increase in net price in addition to providing an explanation for the
system-identified cost areas.

56
Appendix IV:
Cost Areas Selected by Sector
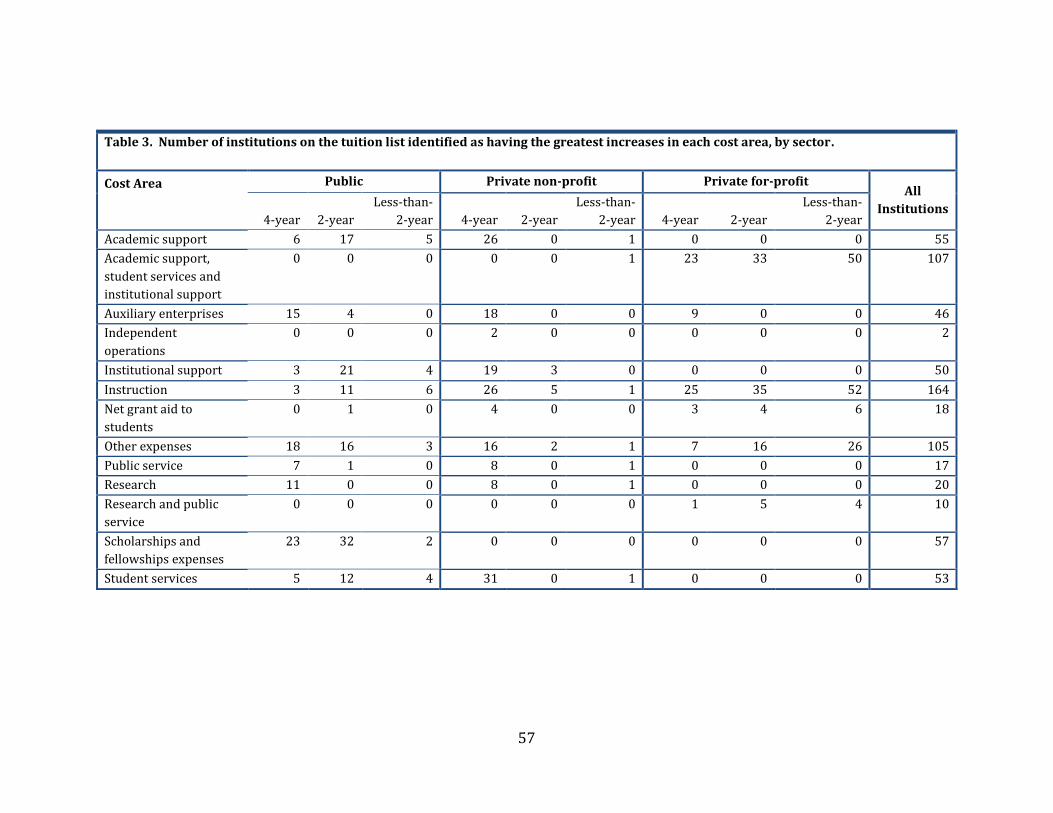
57
Table 3. Number of institutions on the tuition list identified as having the greatest increases in each cost area, by sector.
Cost Area Public Private non-profit Private for-profit All
Institutions 4-year 2-year
Less-than-
2-year 4-year 2-year
Less-than-
2-year 4-year 2-year
Less-than-
2-year
Academic support 6 17 5 26 0 1 0 0 0 55
Academic support,
student services and
institutional support
0 0 0 0 0 1 23 33 50 107
Auxiliary enterprises 15 4 0 18 0 0 9 0 0 46
Independent
operations
0 0 0 2 0 0 0 0 0 2
Institutional support 3 21 4 19 3 0 0 0 0 50
Instruction 3 11 6 26 5 1 25 35 52 164
Net grant aid to
students
0 1 0 4 0 0 3 4 6 18
Other expenses 18 16 3 16 2 1 7 16 26 105
Public service 7 1 0 8 0 1 0 0 0 17
Research 11 0 0 8 0 1 0 0 0 20
Research and public
service
0 0 0 0 0 0 1 5 4 10
Scholarships and
fellowships expenses
23 32 2 0 0 0 0 0 0 57
Student services 5 12 4 31 0 1 0 0 0 53
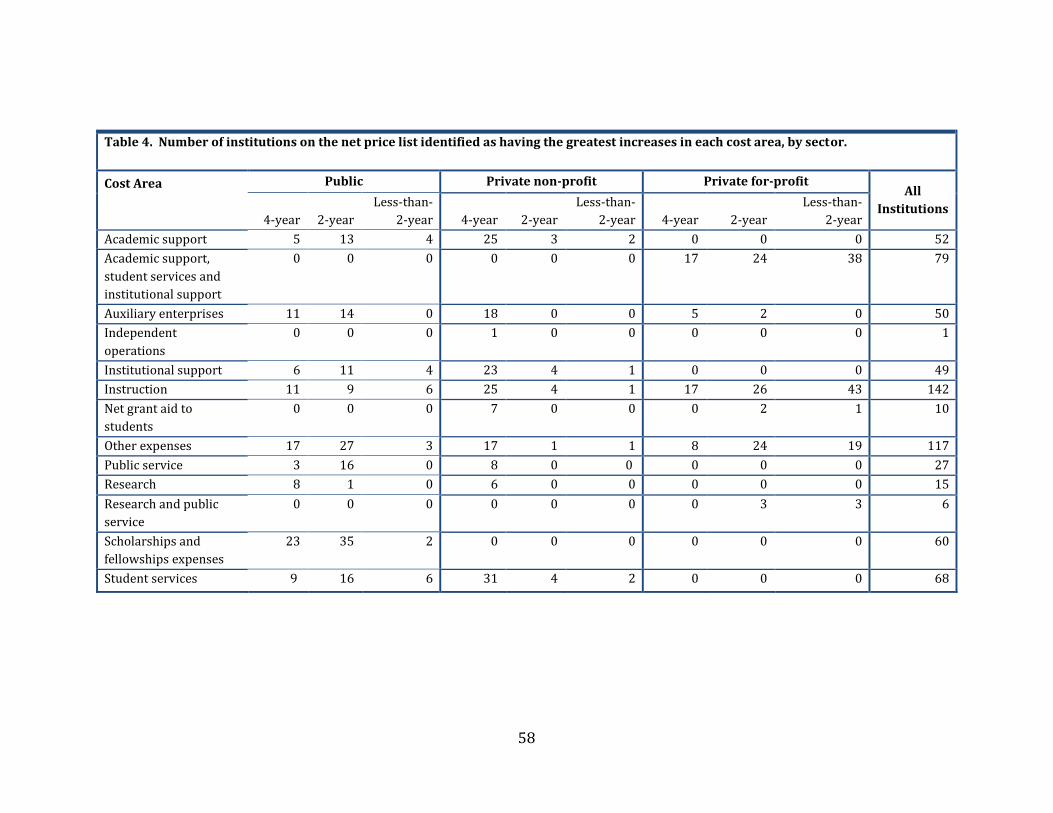
58
Table 4. Number of institutions on the net price list identified as having the greatest increases in each cost area, by sector.
Cost Area Public Private non-profit Private for-profit All
Institutions 4-year 2-year
Less-than-
2-year 4-year 2-year
Less-than-
2-year 4-year 2-year
Less-than-
2-year
Academic support 5 13 4 25 3 2 0 0 0 52
Academic support,
student services and
institutional support
0 0 0 0 0 0 17 24 38 79
Auxiliary enterprises 11 14 0 18 0 0 5 2 0 50
Independent
operations
0 0 0 1 0 0 0 0 0 1
Institutional support 6 11 4 23 4 1 0 0 0 49
Instruction 11 9 6 25 4 1 17 26 43 142
Net grant aid to
students
0 0 0 7 0 0 0 2 1 10
Other expenses 17 27 3 17 1 1 8 24 19 117
Public service 3 16 0 8 0 0 0 0 0 27
Research 8 1 0 6 0 0 0 0 0 15
Research and public
service
0 0 0 0 0 0 0 3 3 6
Scholarships and
fellowships expenses
23 35 2 0 0 0 0 0 0 60
Student services 9 16 6 31 4 2 0 0 0 68

59
Appendix V:
Glossary of Terms
60
Academic support Includes activities and services that support the institution's primary missions of instruction, research, and public service.
Auxiliary enterprises Essentially self-supporting operations of the institution that exist to furnish a service to students, faculty, or staff, and that charge a fee that is directly related to, although not necessarily equal to, the cost of the service. Examples are residence halls, food services, student health services, college unions, college stores, and barber shops when the activities are operated as auxiliary enterprises. Please split intercollegiate athletics out into its own category.
Independent operations
Expenses associated with operations that are independent of or unrelated to the primary missions of the institution (i.e., instruction, research, public service) although they may contribute indirectly to the enhancement of these programs.
Institutional support Expenses for the day-to-day operational support of the institution.
Instruction Includes expenses of the colleges, schools, departments, and other instructional divisions of the institution and expenses for departmental research and public service that are not separately budgeted.
Net grant aid to students
The portion of scholarships and fellowships granted by an institution that exceeds the amount applied to institutional charges such as tuition and fees or room and board.
Public service Includes activities established primarily to provide non-instructional services beneficial to individuals and groups external to the institution.
Research Includes activities specifically organized to produce research outcomes and commissioned by an agency either external to the institution or separately budgeted by an organizational unit within the institution.
Scholarships and fellowships
That portion of scholarships and fellowships granted that exceeds the amount applied to institutional charges such as tuition and fees or room and board.
Student services Includes admissions, registrar activities, and activities whose primary purpose is to contribute to students'' emotional and physical well-being and to their intellectual, cultural, and social development outside the context of the formal instructional program. Examples are career guidance, counseling, and financial aid administration.