
Olivier Coibion Yuriy Gorodnichenko Rupal Kamdar … THE FORMATION OF EXPECTATIONS, INFLATION AND...
65
1 THE FORMATION OF EXPECTATIONS, INFLATION AND THE PHILLIPS CURVE Olivier Coibion Yuriy Gorodnichenko Rupal Kamdar UT Austin & NBER UC Berkeley & NBER UC Berkeley
Transcript of Olivier Coibion Yuriy Gorodnichenko Rupal Kamdar … THE FORMATION OF EXPECTATIONS, INFLATION AND...

1
THE FORMATION OF EXPECTATIONS, INFLATION
AND THE PHILLIPS CURVE
Olivier Coibion Yuriy Gorodnichenko Rupal Kamdar
UT Austin & NBER UC Berkeley & NBER UC Berkeley
2
HOW DO AGENTS FORM THEIR EXPECTATIONS? One of the most fundamental questions in macroeconomics, finance, and
other fields in economics.
3
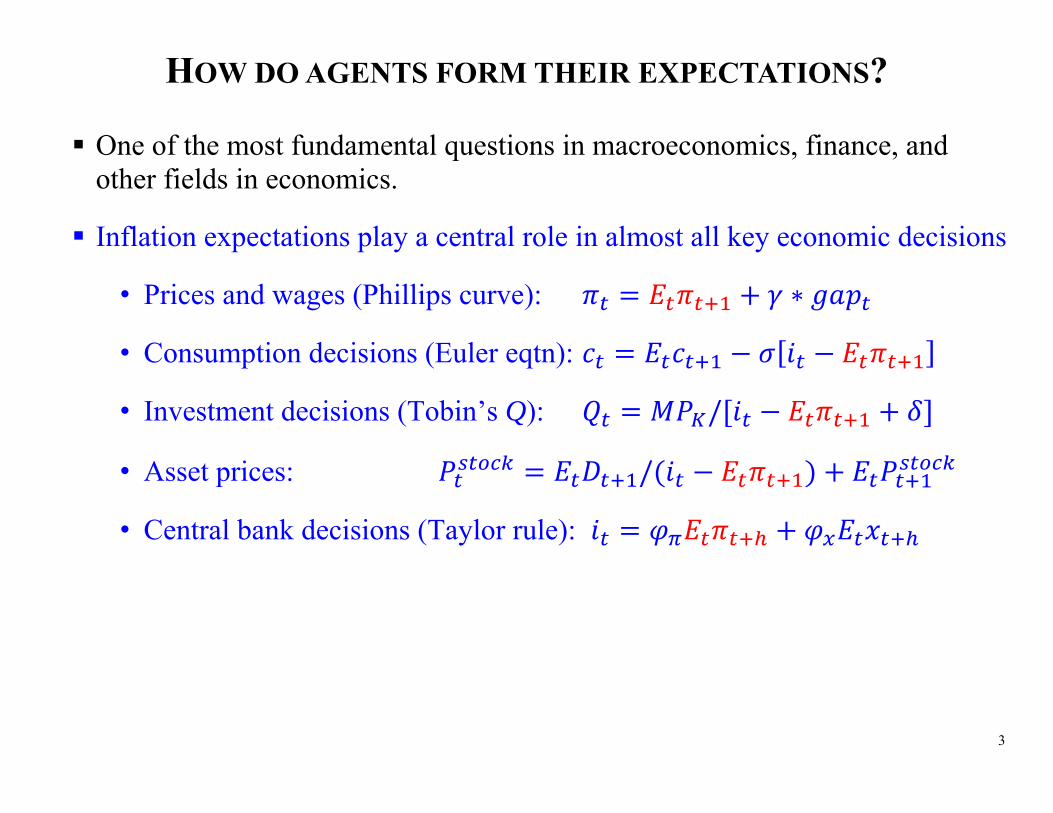
HOW DO AGENTS FORM THEIR EXPECTATIONS? One of the most fundamental questions in macroeconomics, finance, and
other fields in economics.
Inflation expectations play a central role in almost all key economic decisions
• Prices and wages (Phillips curve): ∗
• Consumption decisions (Euler eqtn):
• Investment decisions (Tobin’s Q): /
• Asset prices: /
• Central bank decisions (Taylor rule):
4
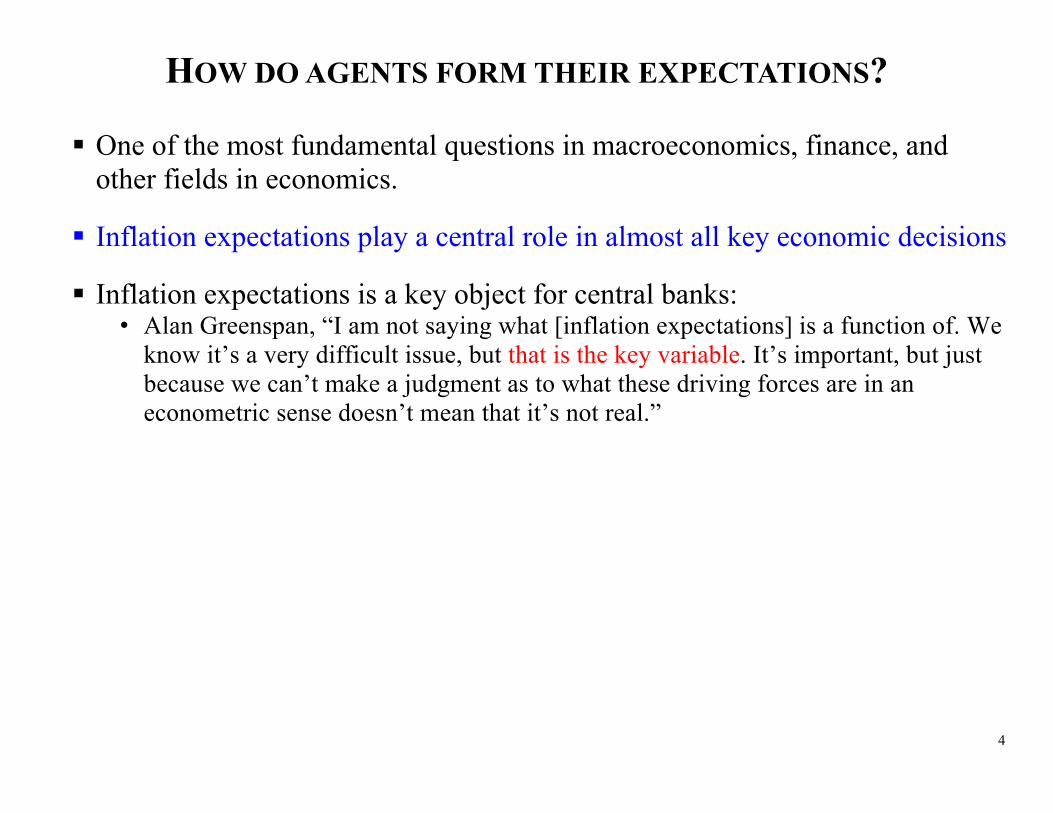
HOW DO AGENTS FORM THEIR EXPECTATIONS? One of the most fundamental questions in macroeconomics, finance, and
other fields in economics.
Inflation expectations play a central role in almost all key economic decisions
Inflation expectations is a key object for central banks: • Alan Greenspan, “I am not saying what [inflation expectations] is a function of. We
know it’s a very difficult issue, but that is the key variable. It’s important, but just because we can’t make a judgment as to what these driving forces are in an econometric sense doesn’t mean that it’s not real.”

5
HOW DO AGENTS FORM THEIR EXPECTATIONS? One of the most fundamental questions in macroeconomics, finance, and
other fields in economics.
Inflation expectations play a central role in almost all key economic decisions
Inflation expectations is a key object for central banks: • Alan Greenspan, “I am not saying what [inflation expectations] is a function of. We
know it’s a very difficult issue, but that is the key variable. It’s important, but just because we can’t make a judgment as to what these driving forces are in an econometric sense doesn’t mean that it’s not real.”
• Ben Bernanke (2007): “How should we measure inflation expectations, and how should we use that information for forecasting and controlling inflation? I certainly do not have complete answers to those questions, but I believe that they are of great practical importance. … Information on the price expectations of businesses--who are, after all, the price setters in the first instance--… is particularly scarce.”
6
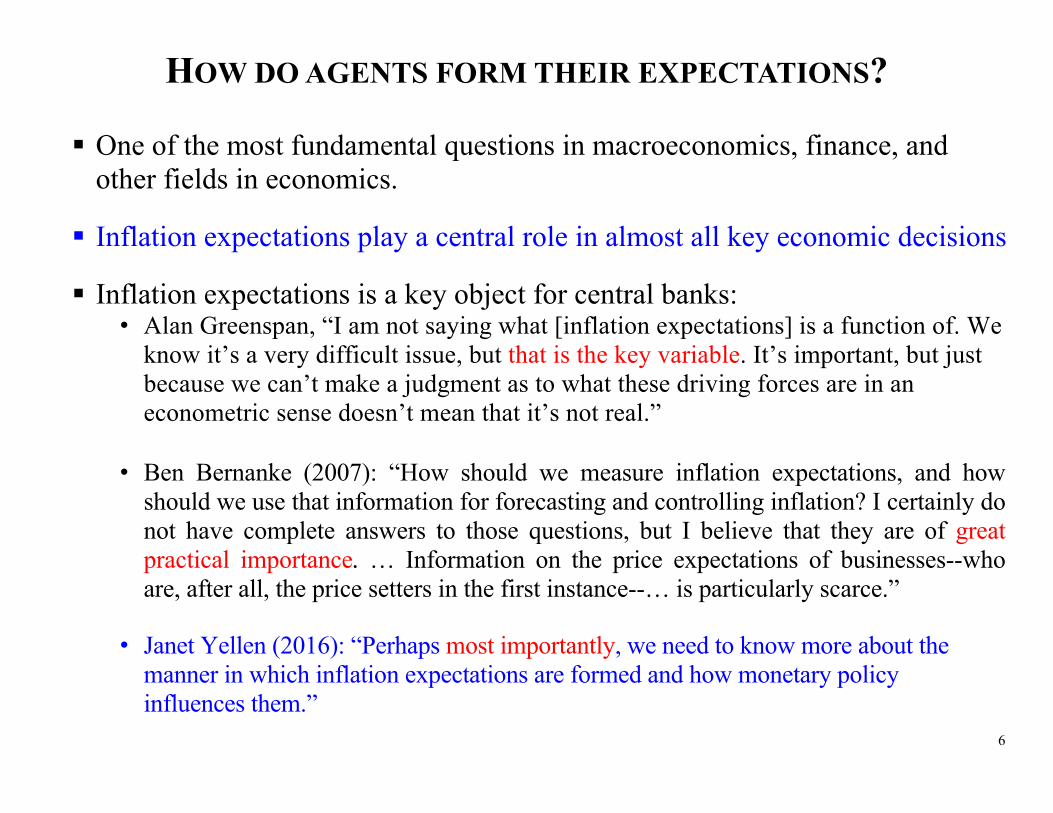
HOW DO AGENTS FORM THEIR EXPECTATIONS? One of the most fundamental questions in macroeconomics, finance, and
other fields in economics.
Inflation expectations play a central role in almost all key economic decisions
Inflation expectations is a key object for central banks: • Alan Greenspan, “I am not saying what [inflation expectations] is a function of. We
know it’s a very difficult issue, but that is the key variable. It’s important, but just because we can’t make a judgment as to what these driving forces are in an econometric sense doesn’t mean that it’s not real.”
• Ben Bernanke (2007): “How should we measure inflation expectations, and how should we use that information for forecasting and controlling inflation? I certainly do not have complete answers to those questions, but I believe that they are of great practical importance. … Information on the price expectations of businesses--who are, after all, the price setters in the first instance--… is particularly scarce.”
• Janet Yellen (2016): “Perhaps most importantly, we need to know more about the
manner in which inflation expectations are formed and how monetary policy influences them.”

7
HOW DO AGENTS FORM THEIR EXPECTATIONS? One of the most fundamental questions in macroeconomics, finance
and other fields in economics.
Frameworks:
• Full-information rational expectations (FIRE)
• Sticky-information
• Imperfect information
•
•
• Non-rational expectations (adaptive)
Rational Expectations models subject to frictions/costs.

8
HOW DO AGENTS FORM THEIR EXPECTATIONS? One of the most fundamental questions in macroeconomics, finance
and other fields in economics.
Frameworks:
• Full-information rational expectations (FIRE)
• Sticky-information
• Imperfect information
• Bounded rationality
• Learning
• Non-rational expectations (adaptive)
Rational Expectations models subject to frictions/costs.

9
HOW DO AGENTS FORM THEIR EXPECTATIONS? One of the most fundamental questions in macroeconomics, finance,
and other fields in economics.
Frameworks:
• Full-information rational expectations (FIRE)
• Sticky-information
• Noisy information
• Bounded rationality
• Learning
• Non-rational expectations (adaptive)
Rational Expectations models subject to frictions/costs.
Rationality but no knowledge of the economy structure.
10
LET THERE BE FIRE Muth (1961): expectations should be model consistent.
11
LET THERE BE FIRE Muth (1961): expectations should be model consistent.
Lucas (1972+): Make a case for FIRE • Lucas critique (abandon “old” Keynesian economic models in favor of
equilibrium models characterized by agents with rational expectations)
12
LET THERE BE FIRE Muth (1961): expectations should be model consistent.
Lucas (1972+): Make a case for FIRE • Lucas critique (abandon “old” Keynesian economic models in favor of
equilibrium models characterized by agents with rational expectations)
Now almost every central bank uses FIRE-based models
13
LET THERE BE FIRE Muth (1961): expectations should be model consistent.
Lucas (1972+): Make a case for FIRE • Lucas critique (abandon “old” Keynesian economic models in favor of
equilibrium models characterized by agents with rational expectations)
Now almost every central bank uses FIRE-based models
Phillips curve:
• Old style: Phillips (1958), Samuelson and Solow (1960)
• New style: Fischer (1977), Taylor (1977), Calvo (1983)

14
LET THERE BE FIRE Muth (1961): expectations should be model consistent.
Lucas (1972+): Make a case for FIRE • Lucas critique (abandon “old” Keynesian economic models in favor of
equilibrium models characterized by agents with rational expectations)
Now almost every central bank uses FIRE-based models
Phillips curve:
• Old style: Phillips (1958), Samuelson and Solow (1960)
• New style: Fischer (1977), Taylor (1977), Calvo (1980)
• New Keynesian Phillips Curve = dominant framework Micro-founded FIRE-based Forward-looking

15
MEASURING INFLATION EXPECTATIONS Are rational expectations consistent with micro-level evidence
provided by survey data?
16
MEASURING INFLATION EXPECTATIONS Are rational expectations consistent with micro-level evidence
provided by survey data?
• Pervasive deviations from FIRE in survey data
• FIRE may be a good proxy in the long-run
17
MEASURING INFLATION EXPECTATIONS Are rational expectations consistent with micro-level evidence
provided by survey data?
• Pervasive deviations from FIRE in survey data
• FIRE may be a good proxy in the long-run
Vast literature but some macroeconomists are skeptical…
Prescott (1977): “Like utility, expectations are not observed, and surveys cannot be used to test the rational expectations hypothesis. One can only test if some theory, whether it incorporates rational expectations or, for the matter, irrational expectations, is or is not consistent with observations”
18
MEASURING INFLATION EXPECTATIONS Are rational expectations consistent with micro-level evidence
provided by survey data?
• Pervasive deviations from FIRE in survey data
• FIRE may be a good proxy in the long-run
Vast literature but some macroeconomists are skeptical…
Prescott (1977): “Like utility, expectations are not observed, and surveys cannot be used to test the rational expectations hypothesis. One can only test if some theory, whether it incorporates rational expectations or, for the matter, irrational expectations, is or is not consistent with observations”
Pushback to Prescott (Zarnowitz, Lovell, Manski, etc.): one should not discount data even if it’s inconsistent with a beautiful theory.
19
ALTERNATIVES TO FIRE
• Sticky-information
• Noisy information (rational inattention)
Rational Expectations models subject to frictions/costs.

20
ALTERNATIVES TO FIRE
• Sticky-information
• Noisy information (rational inattention)
• Bounded rationality
Mis-specified model which makes sense
Rational Expectations models subject to frictions/costs.
21
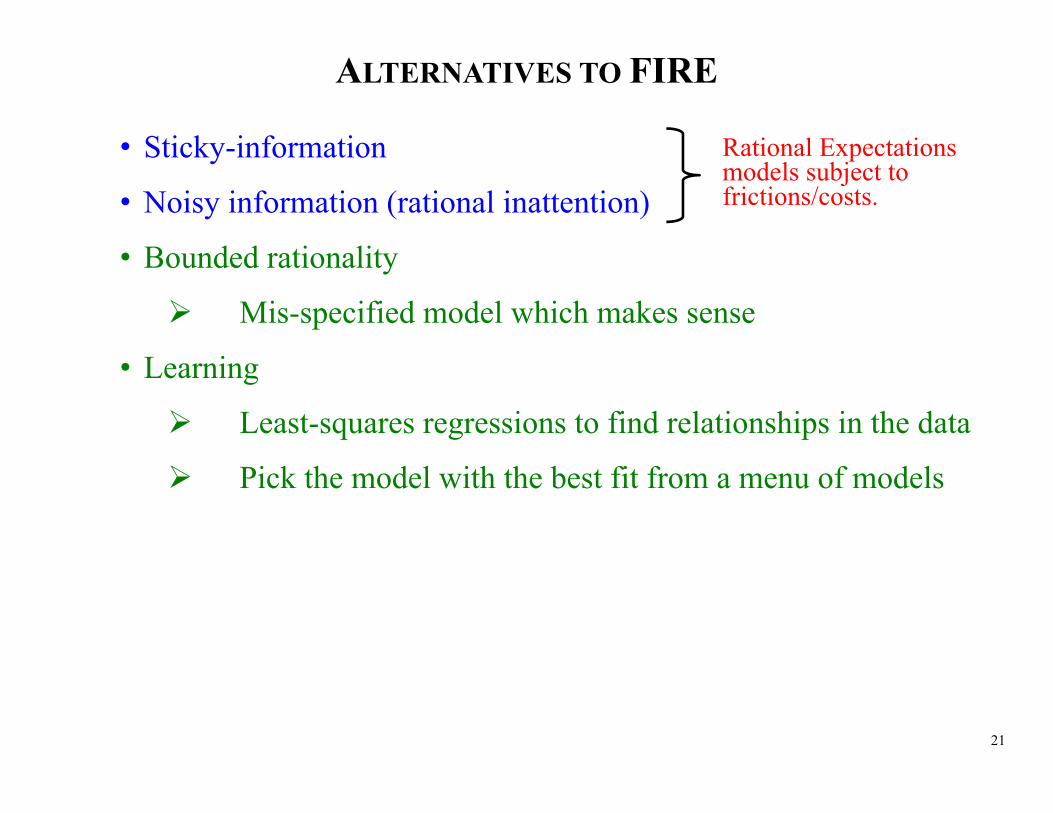
ALTERNATIVES TO FIRE
• Sticky-information
• Noisy information (rational inattention)
• Bounded rationality
Mis-specified model which makes sense
• Learning
Least-squares regressions to find relationships in the data
Pick the model with the best fit from a menu of models
Rational Expectations models subject to frictions/costs.
22
PHILLIPS CURVE WITH FIRE NKPC:
23
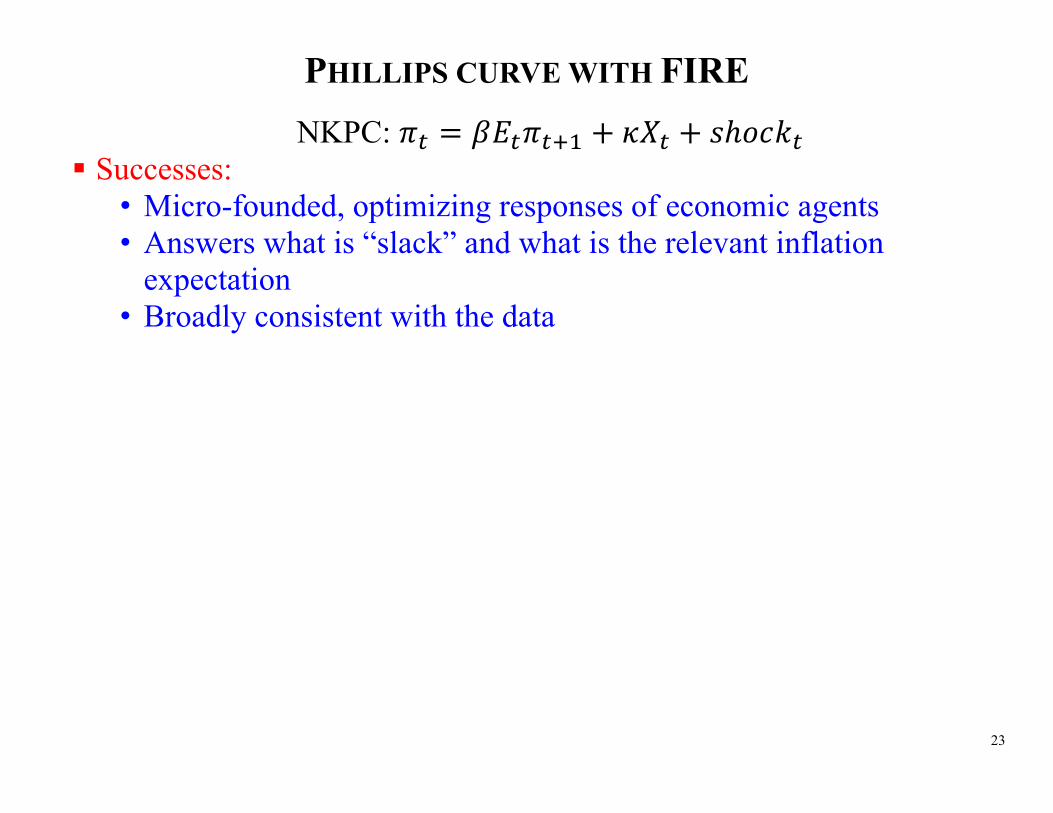
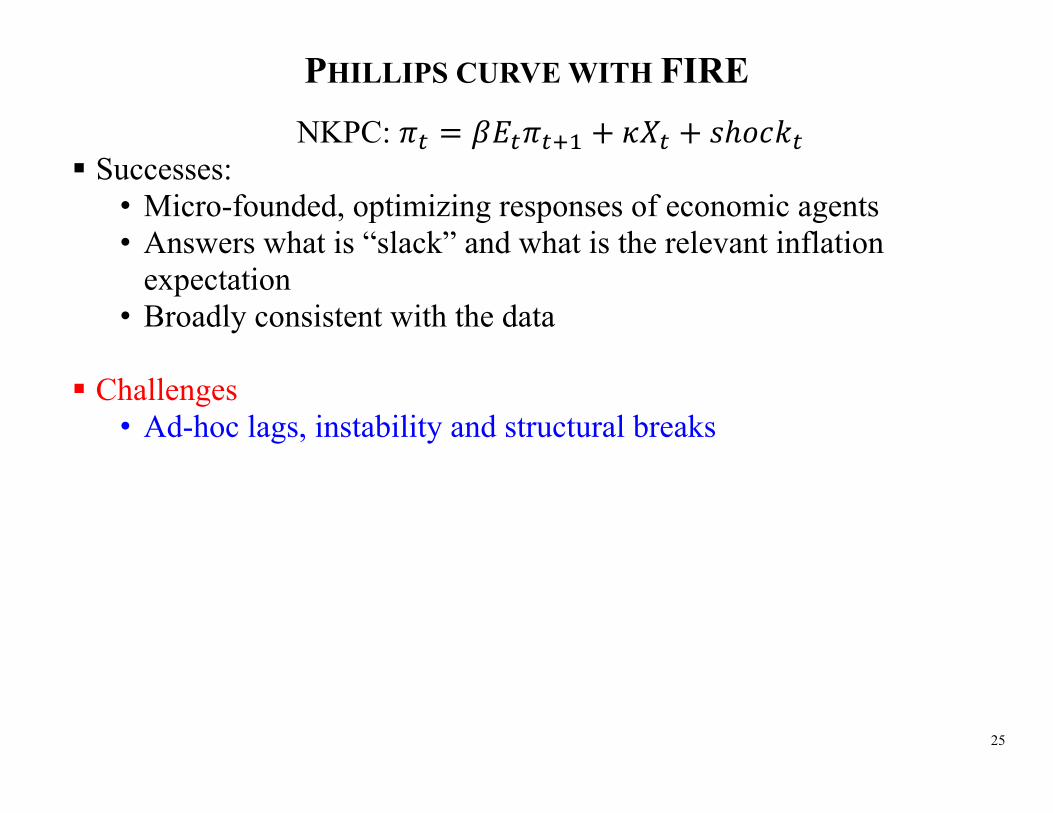
PHILLIPS CURVE WITH FIRE NKPC:
Successes: • Micro-founded, optimizing responses of economic agents • Answers what is “slack” and what is the relevant inflation
expectation • Broadly consistent with the data
24
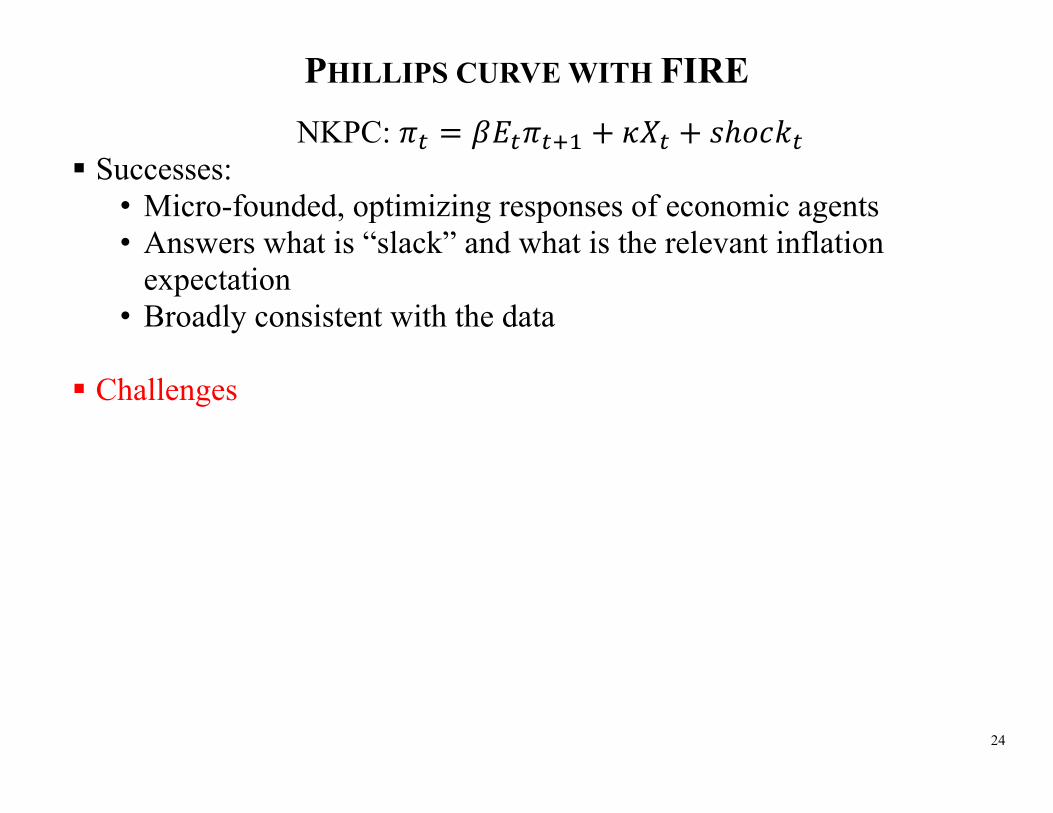
PHILLIPS CURVE WITH FIRE NKPC:
Successes: • Micro-founded, optimizing responses of economic agents • Answers what is “slack” and what is the relevant inflation
expectation • Broadly consistent with the data
Challenges
25
PHILLIPS CURVE WITH FIRE NKPC:
Successes: • Micro-founded, optimizing responses of economic agents • Answers what is “slack” and what is the relevant inflation
expectation • Broadly consistent with the data
Challenges
• Ad-hoc lags, instability and structural breaks

26
PHILLIPS CURVE WITH FIRE NKPC:
Successes: • Micro-founded, optimizing responses of economic agents • Answers what is “slack” and what is the relevant inflation
expectation • Broadly consistent with the data
Challenges
• Ad-hoc lags, instability and structural breaks • Low out-of-sample predictive power
27
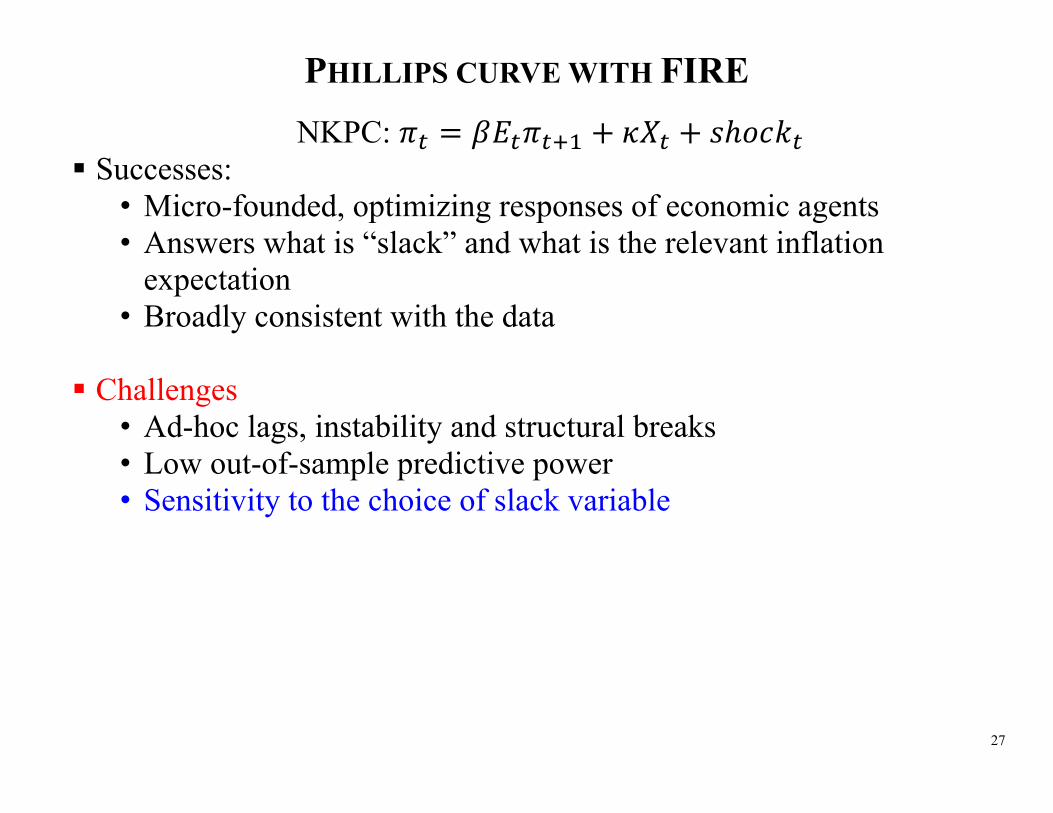
PHILLIPS CURVE WITH FIRE NKPC:
Successes: • Micro-founded, optimizing responses of economic agents • Answers what is “slack” and what is the relevant inflation
expectation • Broadly consistent with the data
Challenges
• Ad-hoc lags, instability and structural breaks • Low out-of-sample predictive power • Sensitivity to the choice of slack variable

28
PHILLIPS CURVE WITH FIRE NKPC:
Successes: • Micro-founded, optimizing responses of economic agents • Answers what is “slack” and what is the relevant inflation
expectation • Broadly consistent with the data
Challenges
• Ad-hoc lags, instability and structural breaks • Low out-of-sample predictive power • Sensitivity to the choice of slack variable • Missing disinflation

29
MISSING DISINFLATION
07Q4
08Q1
08Q2
08Q3
09Q1
09Q2
09Q309Q4
10Q1
10Q2
10Q3
10Q4
11Q111Q2
11Q3
11Q4
12Q1
12Q2
12Q312Q4
13Q1
-6-4
-20
24
t-E t
BAC
K
-3 -2 -1 0 1 2 3 4 5Unemployment gap
1960Q1-1984Q41985Q1-2007Q32007Q3-2013Q1
30
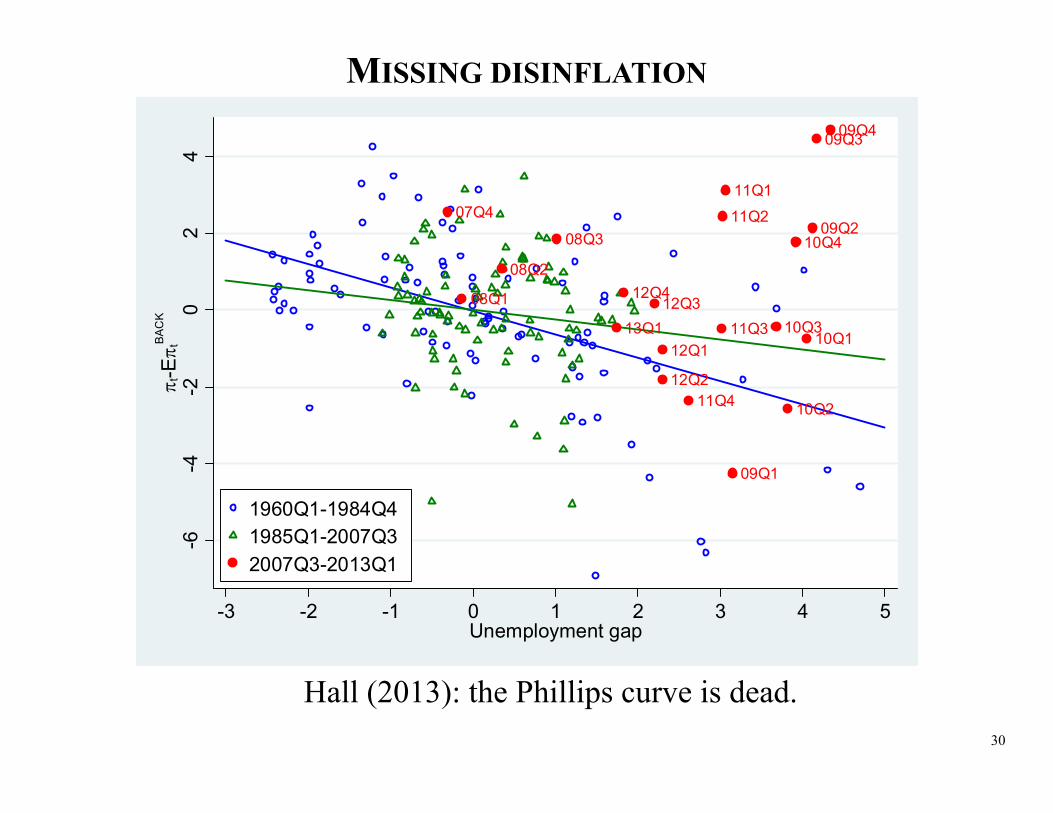
MISSING DISINFLATION
Hall (2013): the Phillips curve is dead.
07Q4
08Q1
08Q2
08Q3
09Q1
09Q2
09Q309Q4
10Q1
10Q2
10Q3
10Q4
11Q111Q2
11Q3
11Q4
12Q1
12Q2
12Q312Q4
13Q1
-6-4
-20
24
t-E t
BAC
K
-3 -2 -1 0 1 2 3 4 5Unemployment gap
1960Q1-1984Q41985Q1-2007Q32007Q3-2013Q1
31
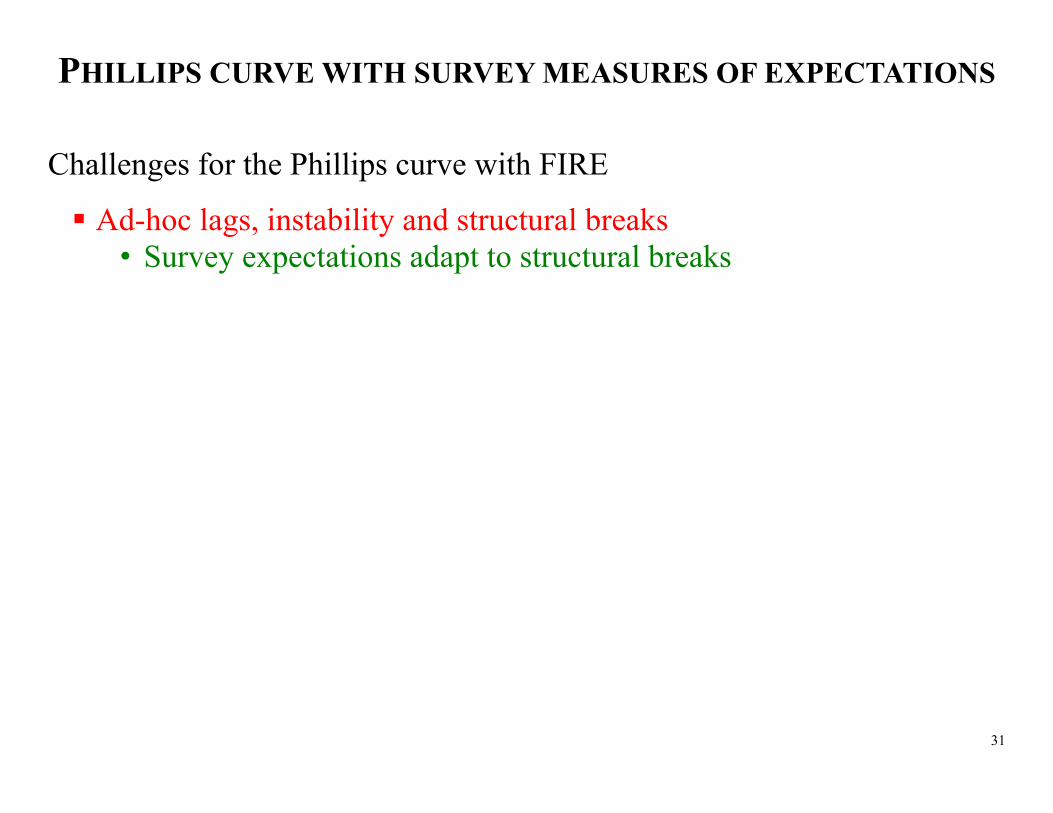
PHILLIPS CURVE WITH SURVEY MEASURES OF EXPECTATIONS
Challenges for the Phillips curve with FIRE
Ad-hoc lags, instability and structural breaks • Survey expectations adapt to structural breaks

32
PHILLIPS CURVE WITH SURVEY MEASURES OF EXPECTATIONS
Challenges for the Phillips curve with FIRE
Ad-hoc lags, instability and structural breaks • Survey expectations adapt to structural breaks
Low out-of-sample predictive power
• Survey expectations are strong predictors of future inflation

33
PHILLIPS CURVE WITH SURVEY MEASURES OF EXPECTATIONS
Challenges for the Phillips curve with FIRE
Ad-hoc lags, instability and structural breaks • Survey expectations adapt to structural breaks
Low out-of-sample predictive power
• Survey expectations are strong predictors of future inflation Sensitivity to the choice of slack variable
• The curve is more robust with survey measures of expectations
34
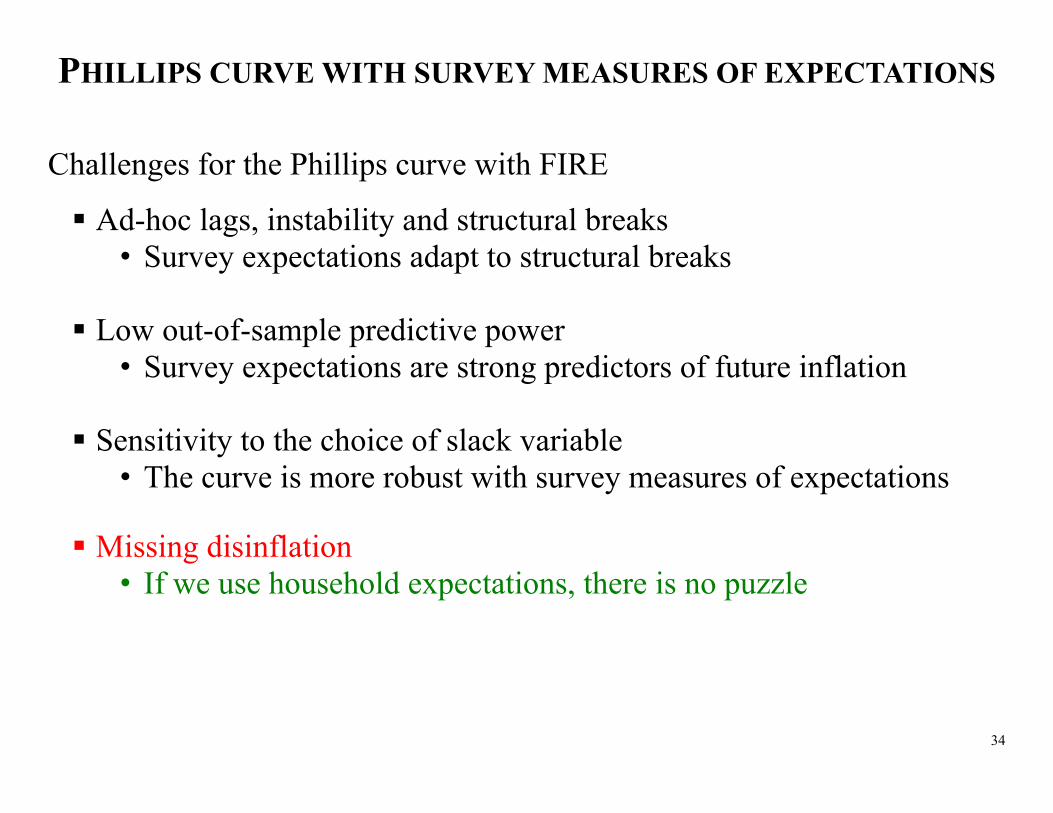
PHILLIPS CURVE WITH SURVEY MEASURES OF EXPECTATIONS
Challenges for the Phillips curve with FIRE
Ad-hoc lags, instability and structural breaks • Survey expectations adapt to structural breaks
Low out-of-sample predictive power
• Survey expectations are strong predictors of future inflation Sensitivity to the choice of slack variable
• The curve is more robust with survey measures of expectations
Missing disinflation • If we use household expectations, there is no puzzle
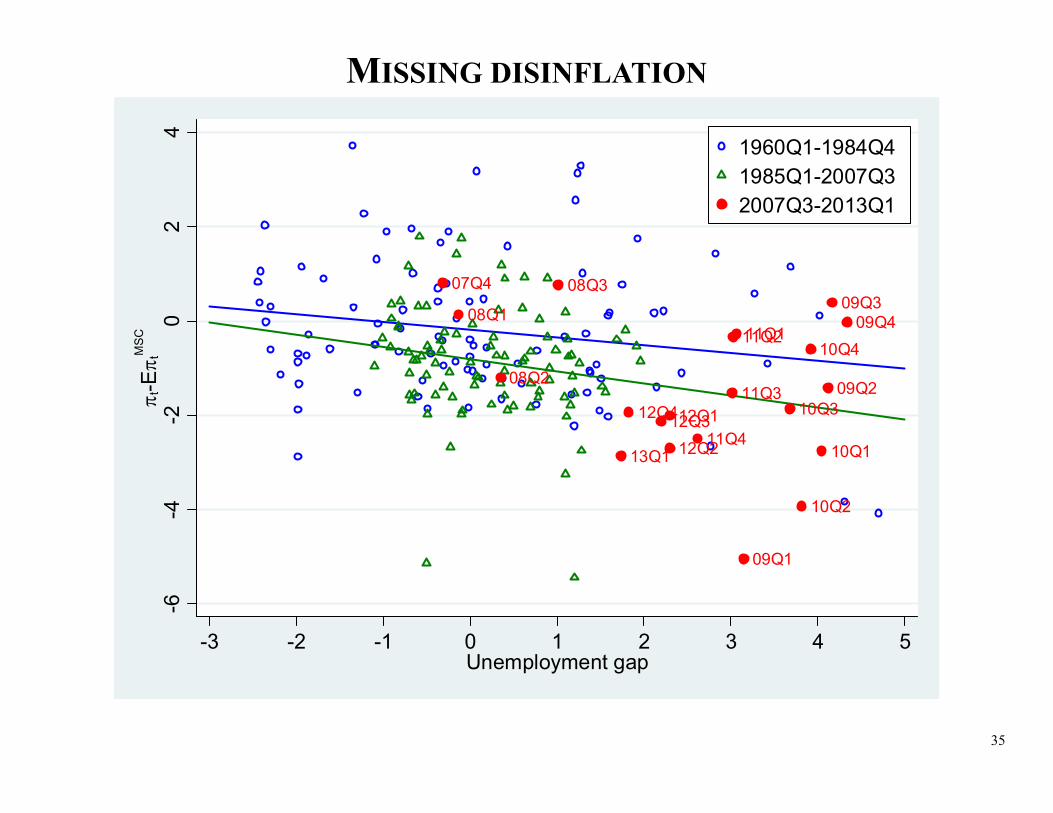
35
MISSING DISINFLATION
07Q4
08Q1
08Q2
08Q3
09Q1
09Q2
09Q309Q4
10Q1
10Q2
10Q3
10Q411Q111Q2
11Q3
11Q412Q1
12Q212Q312Q4
13Q1
-6-4
-20
24
t-E t
MSC
-3 -2 -1 0 1 2 3 4 5Unemployment gap
1960Q1-1984Q41985Q1-2007Q32007Q3-2013Q1

36
NKPC WITH AND WITHOUT FIRE Information Structure Phillips Curve
Full-information rational expectations with time-dependent pricing (Calvo 1983)
Sticky prices and backwards rule of thumb firms (Galí and Gertler 1999)
1
Sticky information (Mankiw and Reis 2002)
Adaptive learning (Milani 2005)
Rational inattention (Afrouzi and Yang 2016)
37
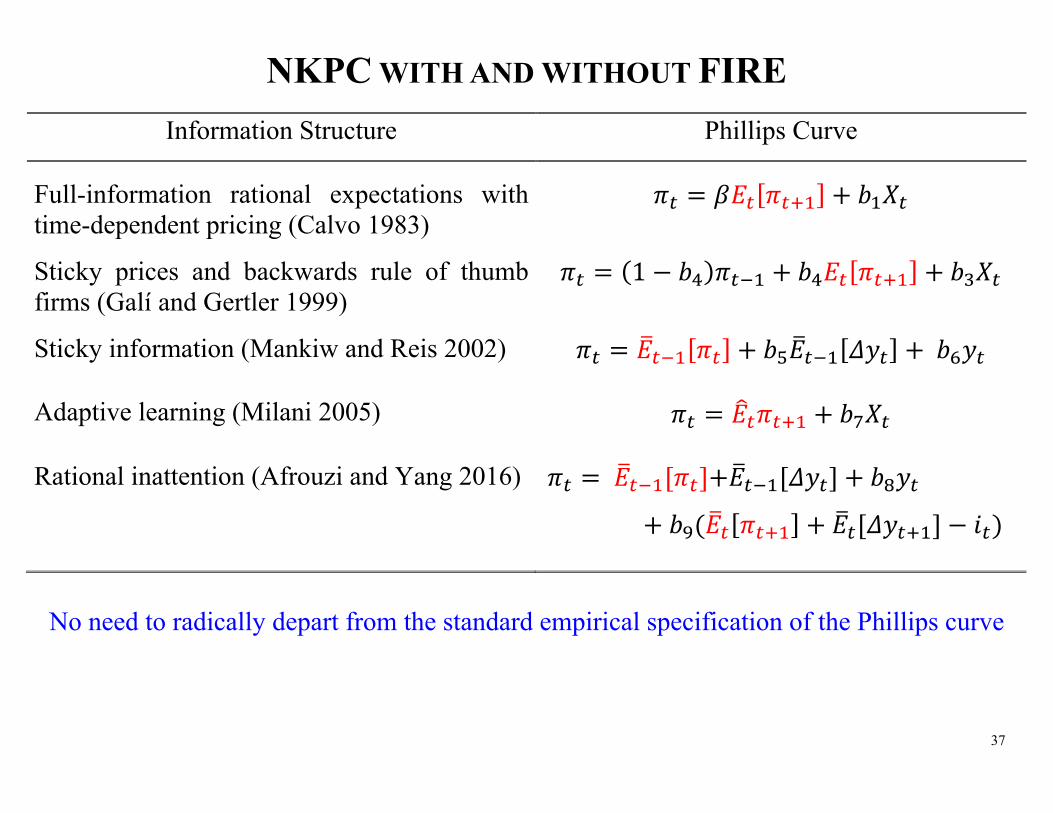
NKPC WITH AND WITHOUT FIRE Information Structure Phillips Curve
Full-information rational expectations with time-dependent pricing (Calvo 1983)
Sticky prices and backwards rule of thumb firms (Galí and Gertler 1999)
1
Sticky information (Mankiw and Reis 2002)
Adaptive learning (Milani 2005)
Rational inattention (Afrouzi and Yang 2016)
No need to radically depart from the standard empirical specification of the Phillips curve
38
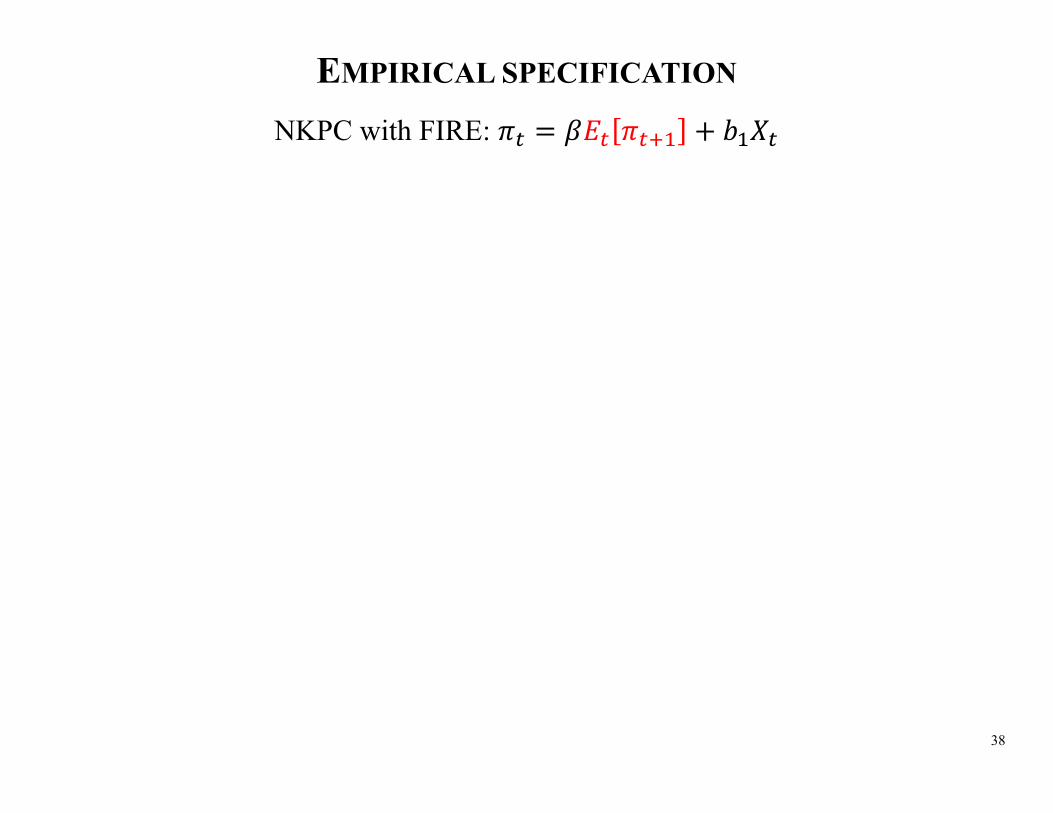
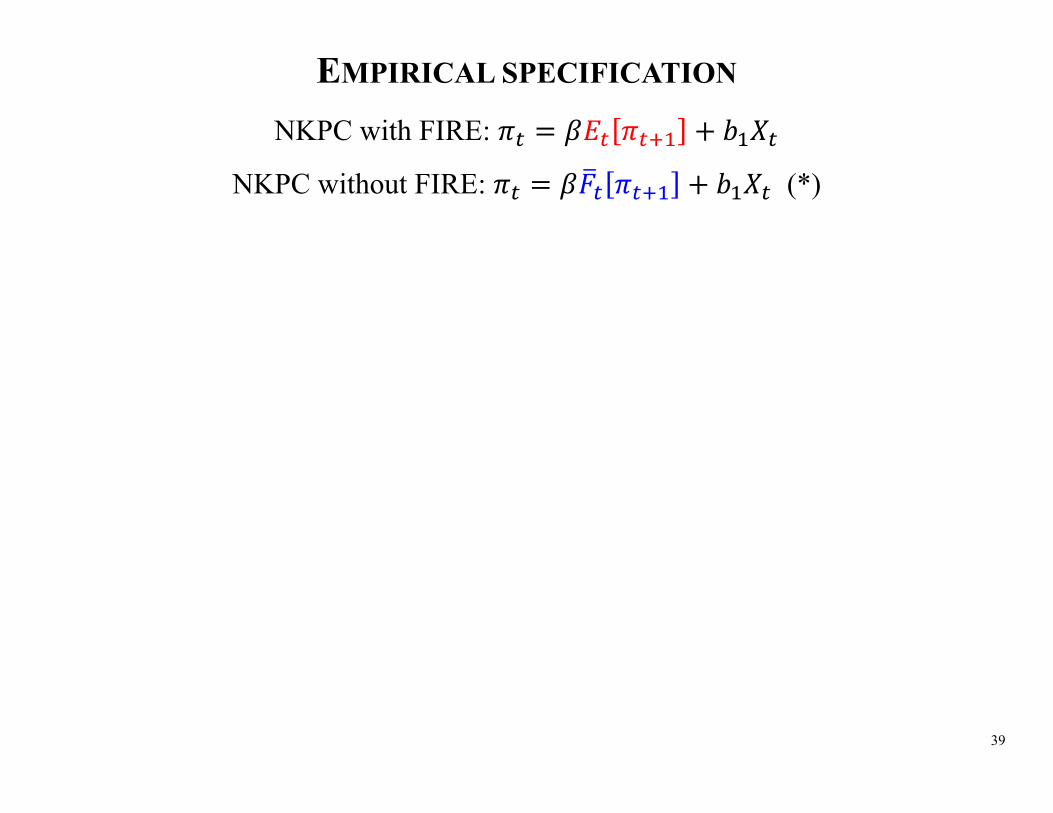
EMPIRICAL SPECIFICATION NKPC with FIRE:
39
EMPIRICAL SPECIFICATION NKPC with FIRE:
NKPC without FIRE: (*)
40
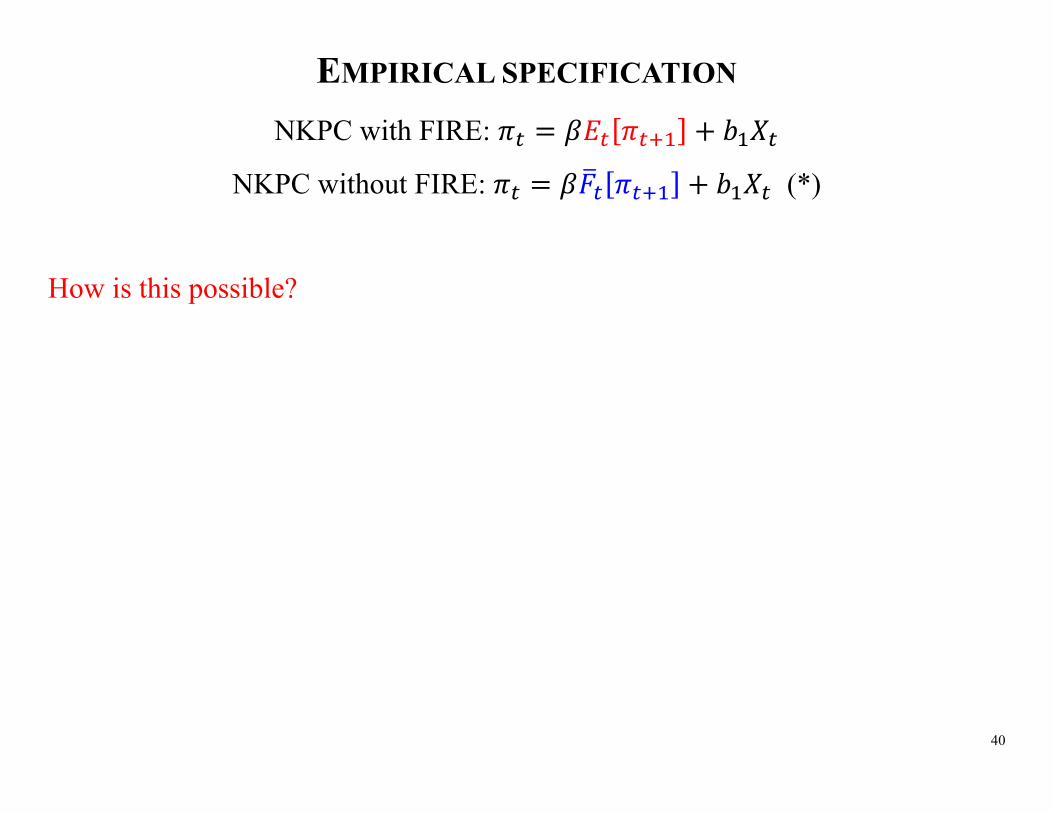
EMPIRICAL SPECIFICATION NKPC with FIRE:
NKPC without FIRE: (*)
How is this possible?

41
EMPIRICAL SPECIFICATION NKPC with FIRE:
NKPC without FIRE: (*)
How is this possible?
Adam and Padula (2011): Without full-information, inflation
1 1 1
where denotes date-t forecast for variable at time .

42
EMPIRICAL SPECIFICATION NKPC with FIRE:
NKPC without FIRE: (*)
How is this possible?
Adam and Padula (2011): Without full-information, inflation
1 1 1
where denotes date-t forecast for variable at time .
The Law of Iterated Expectations (LIE) allows collapsing this equation to (*).

43
EMPIRICAL SPECIFICATION NKPC with FIRE:
NKPC without FIRE: (*)
How is this possible?
Adam and Padula (2011): Without full-information, inflation
1 1 1
where denotes date-t forecast for variable at time .
The Law of Iterated Expectations (LIE) allows collapsing this equation to (*).
Test: ⋯ ⋯
44
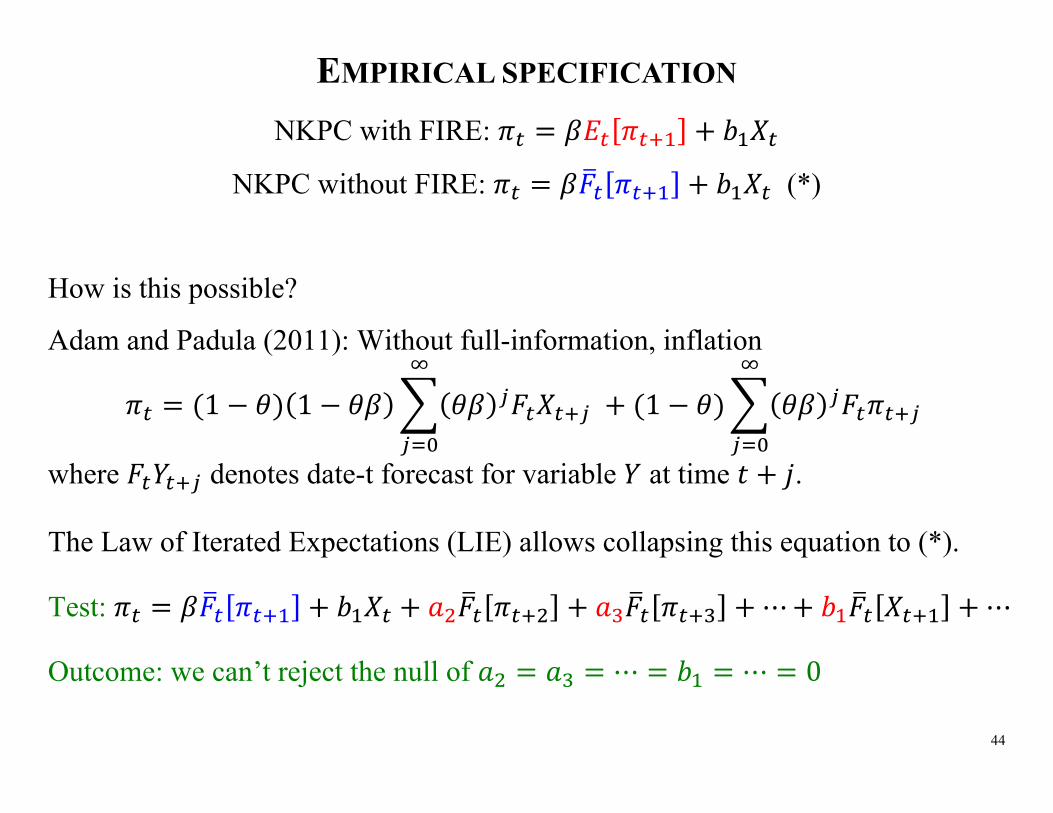
EMPIRICAL SPECIFICATION NKPC with FIRE:
NKPC without FIRE: (*)
How is this possible?
Adam and Padula (2011): Without full-information, inflation
1 1 1
where denotes date-t forecast for variable at time .
The Law of Iterated Expectations (LIE) allows collapsing this equation to (*).
Test: ⋯ ⋯
Outcome: we can’t reject the null of ⋯ ⋯ 0

45
CHALLENGES IN USING SURVEY EXPECTATIONS
Do we have expectations of the right agents?
o Professional forecasts / market expectations = expectations of firm managers?
o Household expectations are likely a good proxy for expectations of managers
02
46
810
12
1980 1985 1990 1995 2000 2005 2010
Asset Prices Michigan SPF (CPI)

46
CHALLENGES IN USING SURVEY EXPECTATIONS
Do we have expectations of the right agents?
o Professional forecasts / market expectations = expectations of firm managers?
o Household expectations are likely a good proxy for expectations of managers
Truth telling?
o Career concerns? Herding? Act upon expectations?
47
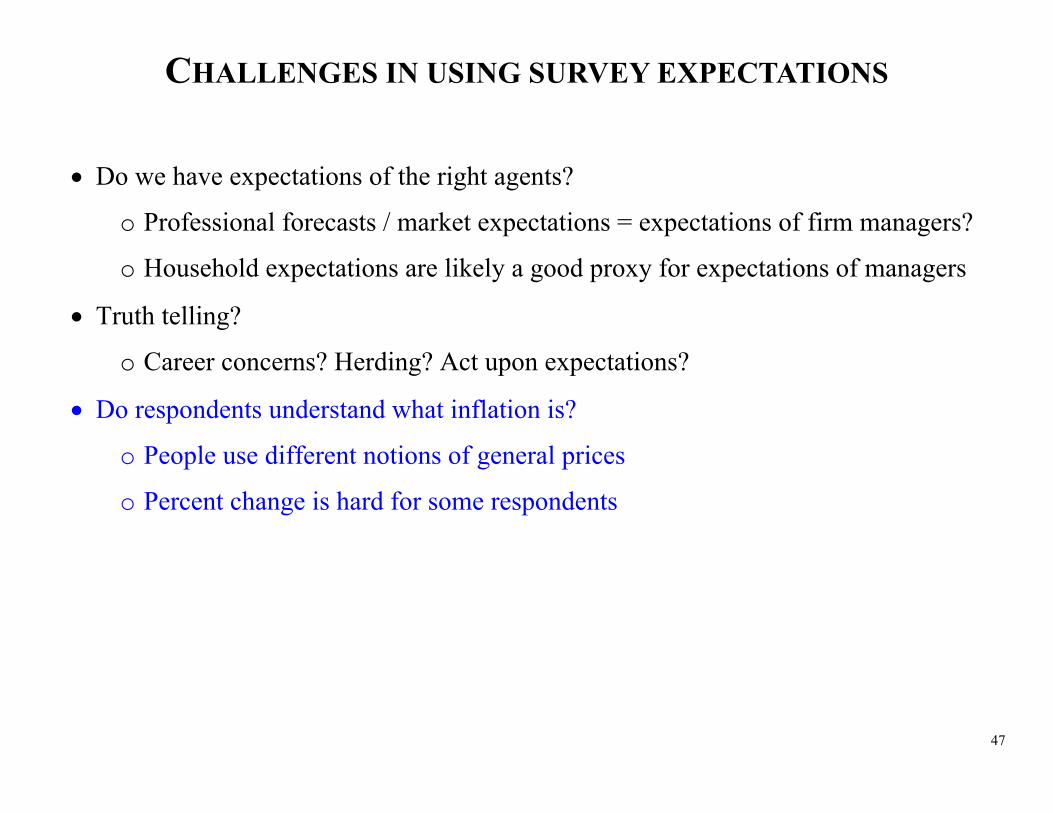
CHALLENGES IN USING SURVEY EXPECTATIONS
Do we have expectations of the right agents?
o Professional forecasts / market expectations = expectations of firm managers?
o Household expectations are likely a good proxy for expectations of managers
Truth telling?
o Career concerns? Herding? Act upon expectations?
Do respondents understand what inflation is?
o People use different notions of general prices
o Percent change is hard for some respondents

48
PHILLIPS CURVE WITH SURVEY INFLATION EXPECTATIONS
where
= the actual q-o-q inflation rate (CPI, annualized),
= one-year ahead inflation forecast (CPI),
= the unemployment rate,
= the natural rate of unemployment (CBO’s NAIRU).

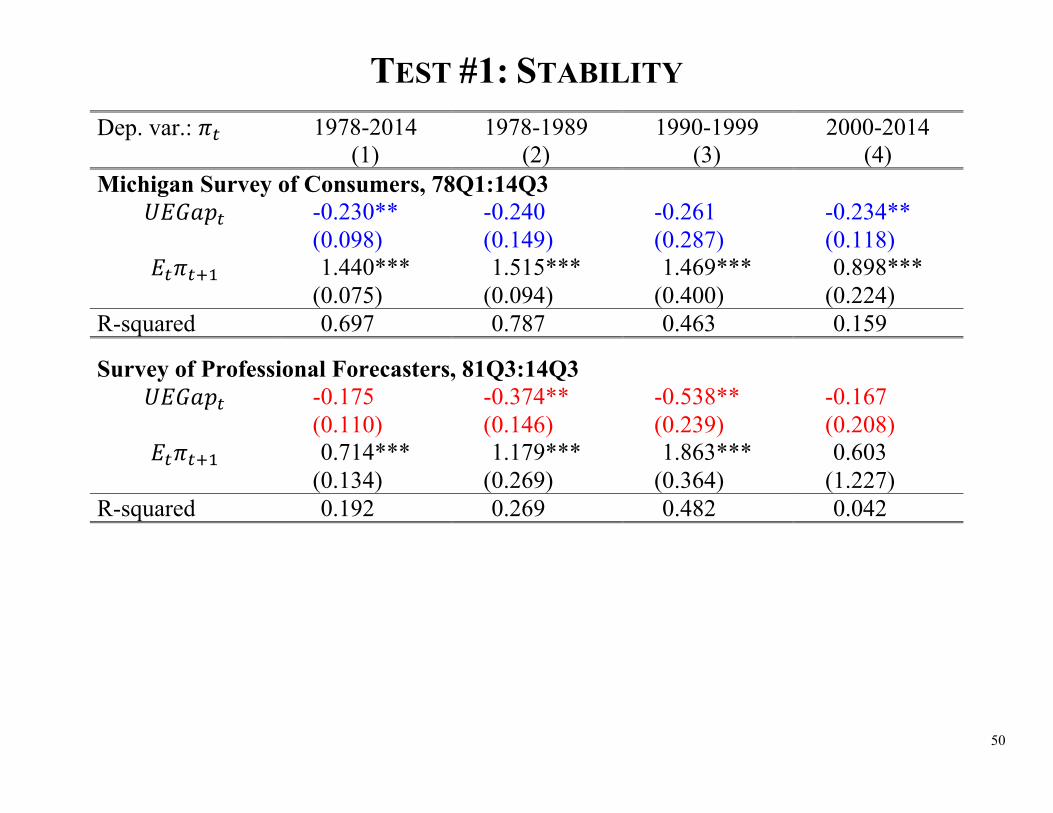
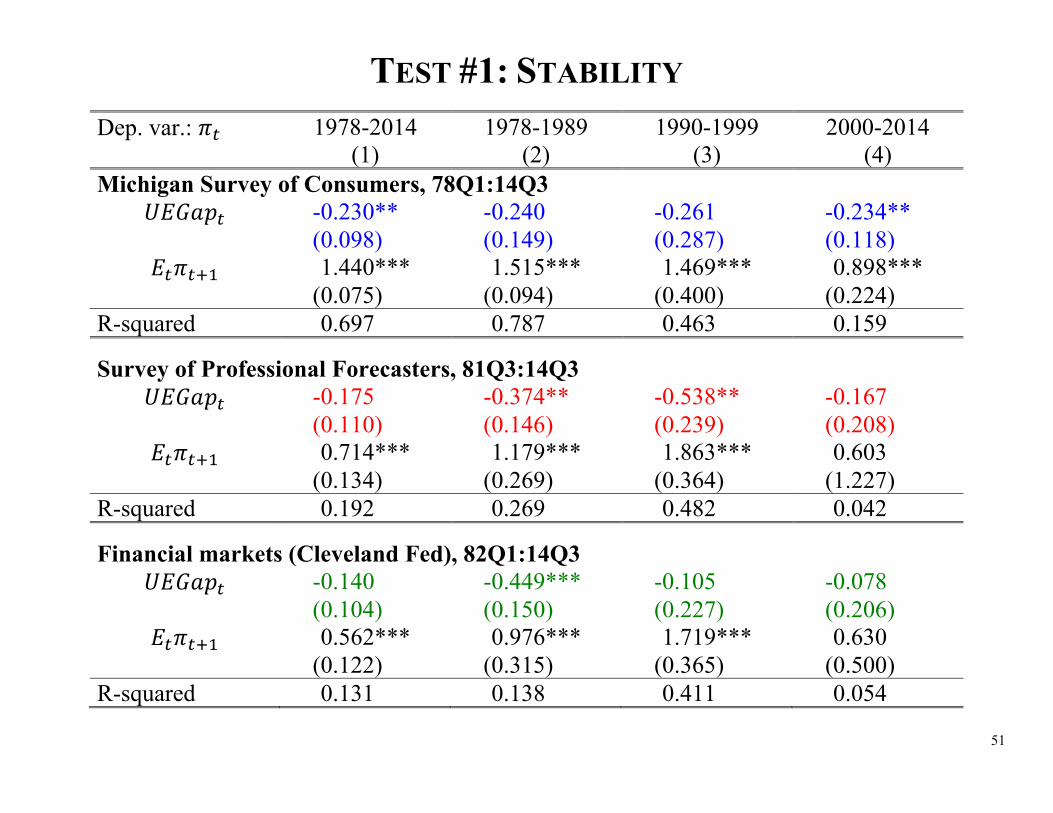
49
TEST #1: STABILITY Dep. var.: 1978-2014 1978-1989 1990-1999 2000-2014
(1) (2) (3) (4) Michigan Survey of Consumers, 78Q1:14Q3
-0.230** -0.240 -0.261 -0.234** (0.098) (0.149) (0.287) (0.118)
1.440*** 1.515*** 1.469*** 0.898*** (0.075) (0.094) (0.400) (0.224) R-squared 0.697 0.787 0.463 0.159
Survey of Professional Forecasters, 81Q3:14Q3 -0.175 -0.374** -0.538** -0.167
(0.110) (0.146) (0.239) (0.208) 0.714*** 1.179*** 1.863*** 0.603
(0.134) (0.269) (0.364) (1.227) R-squared 0.192 0.269 0.482 0.042
Financial markets (Cleveland Fed), 82Q1:14Q3 -0.140 -0.449*** -0.105 -0.078
(0.104) (0.150) (0.227) (0.206) 0.562*** 0.976*** 1.719*** 0.630
(0.122) (0.315) (0.365) (0.500) R-squared 0.131 0.138 0.411 0.054
50
TEST #1: STABILITY Dep. var.: 1978-2014 1978-1989 1990-1999 2000-2014
(1) (2) (3) (4) Michigan Survey of Consumers, 78Q1:14Q3
-0.230** -0.240 -0.261 -0.234** (0.098) (0.149) (0.287) (0.118)
1.440*** 1.515*** 1.469*** 0.898*** (0.075) (0.094) (0.400) (0.224) R-squared 0.697 0.787 0.463 0.159
Survey of Professional Forecasters, 81Q3:14Q3 -0.175 -0.374** -0.538** -0.167
(0.110) (0.146) (0.239) (0.208) 0.714*** 1.179*** 1.863*** 0.603
(0.134) (0.269) (0.364) (1.227) R-squared 0.192 0.269 0.482 0.042
Financial markets (Cleveland Fed), 82Q1:14Q3 -0.140 -0.449*** -0.105 -0.078
(0.104) (0.150) (0.227) (0.206) 0.562*** 0.976*** 1.719*** 0.630
(0.122) (0.315) (0.365) (0.500) R-squared 0.131 0.138 0.411 0.054
51
TEST #1: STABILITY Dep. var.: 1978-2014 1978-1989 1990-1999 2000-2014
(1) (2) (3) (4) Michigan Survey of Consumers, 78Q1:14Q3
-0.230** -0.240 -0.261 -0.234** (0.098) (0.149) (0.287) (0.118)
1.440*** 1.515*** 1.469*** 0.898*** (0.075) (0.094) (0.400) (0.224) R-squared 0.697 0.787 0.463 0.159
Survey of Professional Forecasters, 81Q3:14Q3 -0.175 -0.374** -0.538** -0.167
(0.110) (0.146) (0.239) (0.208) 0.714*** 1.179*** 1.863*** 0.603
(0.134) (0.269) (0.364) (1.227) R-squared 0.192 0.269 0.482 0.042
Financial markets (Cleveland Fed), 82Q1:14Q3 -0.140 -0.449*** -0.105 -0.078
(0.104) (0.150) (0.227) (0.206) 0.562*** 0.976*** 1.719*** 0.630
(0.122) (0.315) (0.365) (0.500) R-squared 0.131 0.138 0.411 0.054
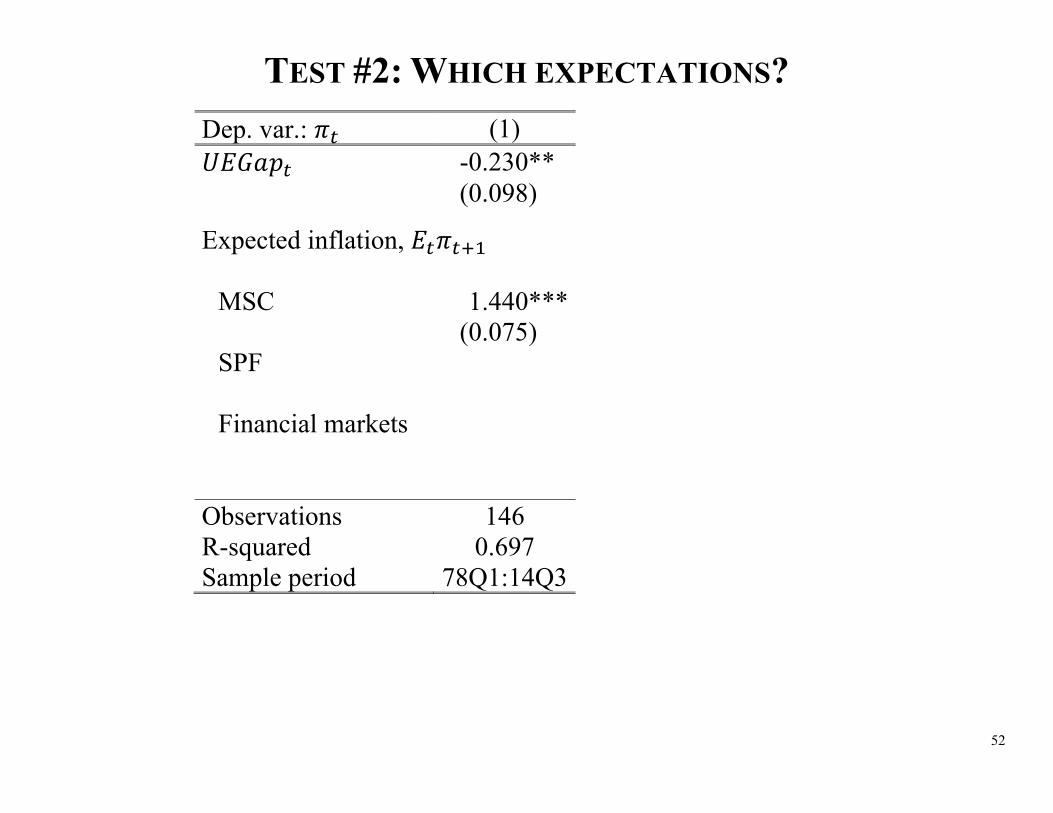
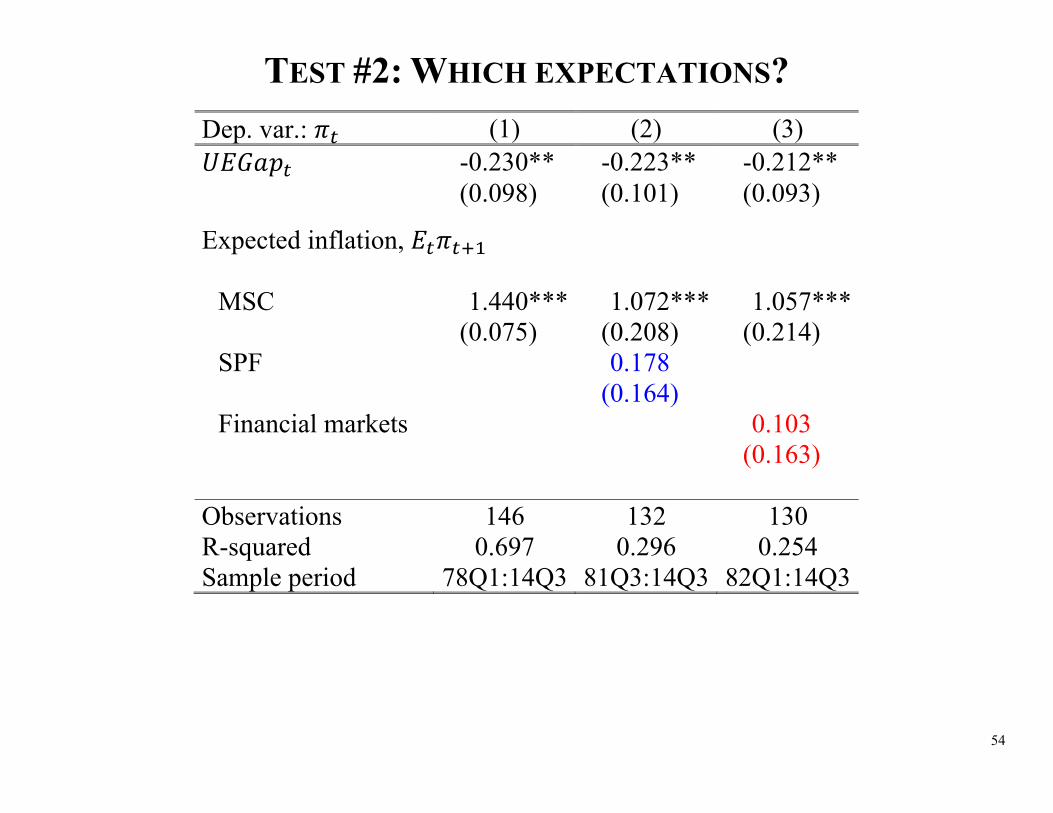
52
TEST #2: WHICH EXPECTATIONS? Dep. var.: (1) (2) (3)
-0.230** -0.223** -0.212** (0.098) (0.101) (0.093)
Expected inflation, MSC 1.440*** 1.072*** 1.057*** (0.075) (0.208) (0.214) SPF 0.178 (0.164) Financial markets 0.103 (0.163)
Observations 146 132 130 R-squared 0.697 0.296 0.254 Sample period 78Q1:14Q3 81Q3:14Q3 82Q1:14Q3

53
TEST #2: WHICH EXPECTATIONS? Dep. var.: (1) (2) (3)
-0.230** -0.223** -0.212** (0.098) (0.101) (0.093)
Expected inflation, MSC 1.440*** 1.072*** 1.057*** (0.075) (0.208) (0.214) SPF 0.178 (0.164) Financial markets 0.103 (0.163)
Observations 146 132 130 R-squared 0.697 0.296 0.254 Sample period 78Q1:14Q3 81Q3:14Q3 82Q1:14Q3
54
TEST #2: WHICH EXPECTATIONS? Dep. var.: (1) (2) (3)
-0.230** -0.223** -0.212** (0.098) (0.101) (0.093)
Expected inflation, MSC 1.440*** 1.072*** 1.057*** (0.075) (0.208) (0.214) SPF 0.178 (0.164) Financial markets 0.103 (0.163)
Observations 146 132 130 R-squared 0.697 0.296 0.254 Sample period 78Q1:14Q3 81Q3:14Q3 82Q1:14Q3

55
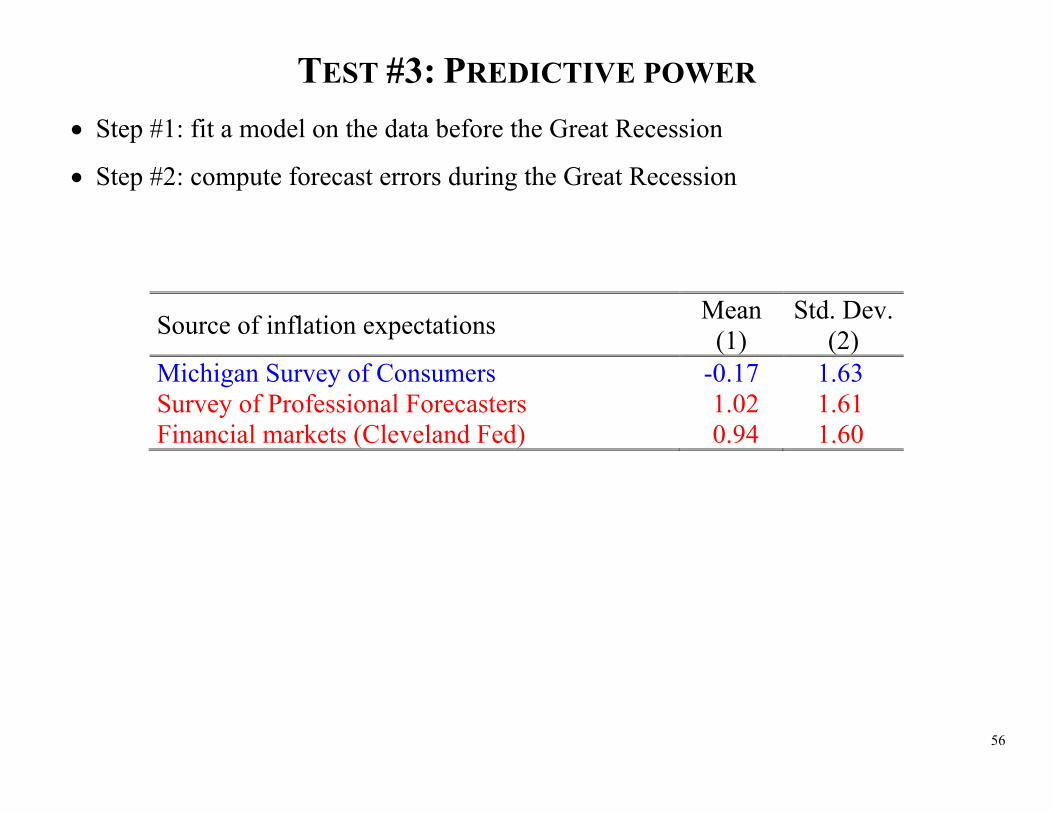
TEST #3: PREDICTIVE POWER Step #1: fit a model on the data before the Great Recession
Step #2: compute forecast errors during the Great Recession
56
TEST #3: PREDICTIVE POWER Step #1: fit a model on the data before the Great Recession
Step #2: compute forecast errors during the Great Recession
Source of inflation expectations Mean Std. Dev. (1) (2)
Michigan Survey of Consumers -0.17 1.63 Survey of Professional Forecasters 1.02 1.61 Financial markets (Cleveland Fed) 0.94 1.60

57
CONCLUDING REMARKS FIRE is useful and the New Keynesian Phillips Curve is an epitome of FIRE success
58
CONCLUDING REMARKS FIRE is useful and the New Keynesian Phillips Curve is an epitome of FIRE success
Pronounced deviations from FIRE in the data
59
CONCLUDING REMARKS FIRE is useful and the New Keynesian Phillips Curve is an epitome of FIRE success
Pronounced deviations from FIRE in the data
There are alternatives to FIRE such that one does not have to abandon rationality
60
CONCLUDING REMARKS FIRE is useful and the New Keynesian Phillips Curve is an epitome of FIRE success
Pronounced deviations from FIRE in the data
There are alternatives to FIRE such that one does not have to abandon rationality
The behavior of survey expectations is consistent with at least some of these
alternatives
61
CONCLUDING REMARKS FIRE is useful and the New Keynesian Phillips Curve is an epitome of FIRE success
Pronounced deviations from FIRE in the data
There are alternatives to FIRE such that one does not have to abandon rationality
The behavior of survey expectations is consistent with at least some of these
alternatives
Using survey expectations seems to yield a better-behaved Phillips curve

62
CONCLUDING REMARKS FIRE is useful and the New Keynesian Phillips Curve is an epitome of FIRE success
Pronounced deviations from FIRE in the data
There are alternatives to FIRE such that one does not have to abandon rationality
The behavior of survey expectations is consistent with at least some of these
alternatives
Using survey expectations seems to yield a better-behaved Phillips curve
Challenges for future work for non-FIRE models:
63
CONCLUDING REMARKS FIRE is useful and the New Keynesian Phillips Curve is an epitome of FIRE success
Pronounced deviations from FIRE in the data
There are alternatives to FIRE such that one does not have to abandon rationality
The behavior of survey expectations is consistent with at least some of these
alternatives
Using survey expectations seems to yield a better-behaved Phillips curve
Challenges for future work for non-FIRE models:
o Current state: "theory ahead of business cycle measurement"

64
CONCLUDING REMARKS FIRE is useful and the New Keynesian Phillips Curve is an epitome of FIRE success
Pronounced deviations from FIRE in the data
There are alternatives to FIRE such that one does not have to abandon rationality
The behavior of survey expectations is consistent with at least some of these
alternatives
Using survey expectations seems to yield a better-behaved Phillips curve
Challenges for future work for non-FIRE models:
o Current state: "theory ahead of business cycle measurement"
o Few measures of real-time beliefs of firms and other price setters
65
CONCLUDING REMARKS FIRE is useful and the New Keynesian Phillips Curve is an epitome of FIRE success
Pronounced deviations from FIRE in the data
There are alternatives to FIRE such that one does not have to abandon rationality
The behavior of survey expectations is consistent with at least some of these
alternatives
Using survey expectations seems to yield a better-behaved Phillips curve
Challenges for future work for non-FIRE models:
o Current state: "theory ahead of business cycle measurement"
o Few measures of real-time beliefs of firms and other price setters
o How to rule out many alternative deviations from FIRE
Impose discipline on non-FIRE models
Derive testable implications and test them