OLIVE OIL MARKETOLIVE OIL MARKET COMSUMER PROFILE and CONSUMPTION
21
OLIVE OIL MARKET OLIVE OIL MARKET COMSUMER PROFILE and CONSUMPTION PATTERNS CONSUMPTION PATTERNS C i Dik Cengiz Dikmen Türkiye June 2011 June 2011
Transcript of OLIVE OIL MARKETOLIVE OIL MARKET COMSUMER PROFILE and CONSUMPTION

OLIVE OIL MARKETOLIVE OIL MARKETCOMSUMER PROFILE and
CONSUMPTION PATTERNSCONSUMPTION PATTERNS
C i DikCengiz DikmenTürkiye
June 2011June 2011
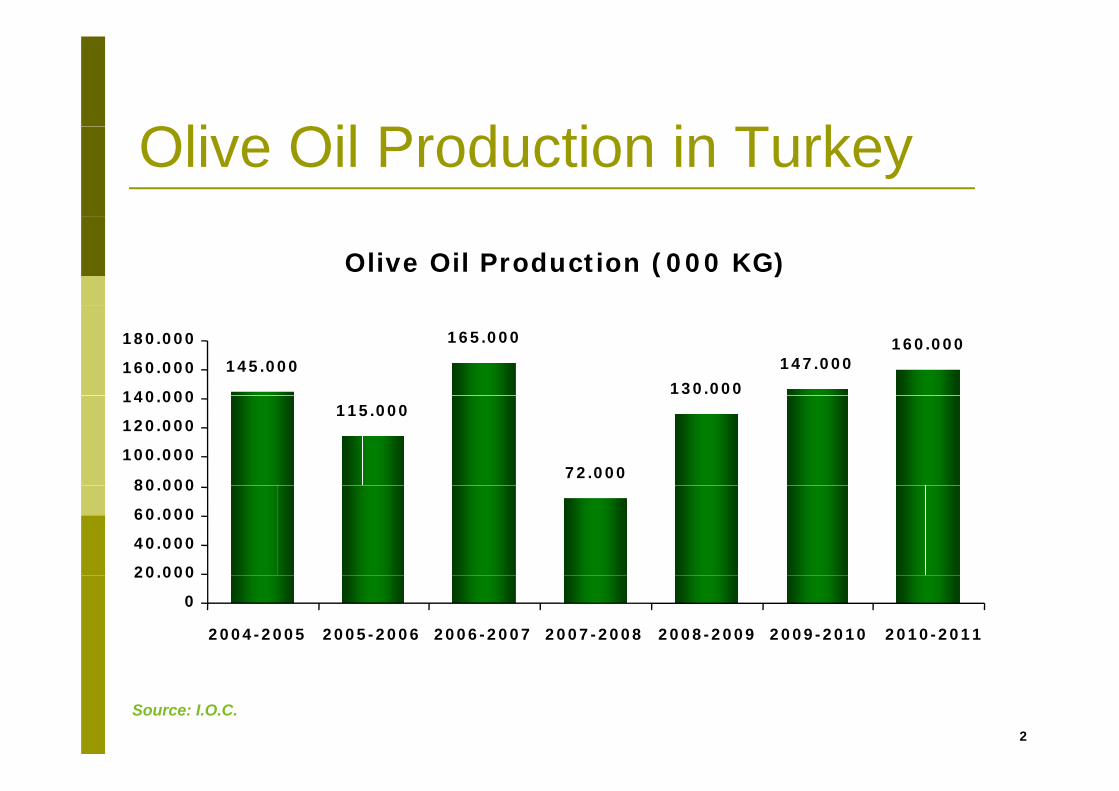
Oli Oil P d ti i T kOlive Oil Production in Turkey
Olive Oil Production (000 KG)
145.000
165.000
130.000
147.000160.000
140 000
160.000
180.000
115.000
72.00080 000
100.000
120.000
140.000
20.000
40.000
60.000
80.000
0
20.000
2004-2005 2005-2006 2006-2007 2007-2008 2008-2009 2009-2010 2010-2011
2
Source: I.O.C.

Oli Oil C ti i T kOlive Oil Consumption in Turkey
Olive Oil Consumption (000 KG)
80.000 85.000
108.000 110.000 115.000
100.000
120.000
140.000
60.00050.000
40.000
60.000
80.000
0
20.000
2004-2005 2005-2006 2006-2007 2007-2008 2008-2009 2009-2010 2010-2011*
3
Source: I.O.C. *Forecast

M k tMarketEdible Oil Market in TurkeyOlive Oil Market
kMarket Structure Market Growth SegmentsSegments
Sales ChannelPackaging PreferencesPackaging Preferences
4

Edibl Oil M k tEdible Oil MarketOn value base, edible oil make 71 % of total oil market .I 2010 dibl il t d d b 6 % In 2010, edible oil category decreased by 6 %.
V l Ch (%)V l Sh (%) V l Ch (%) P i Ch (%)Val. Chg (%)
-4
6
FATS&OILS
EDIBLE OIL
Val. Share (%)
71
Vol. Chg (%)
1
Price Chg (%)
5-6
-4
EDIBLE OIL
MARGARINE
71
18 -5
-1
1
-5
13BUTTER11 0 14
5
Source: Nielsen Türkiye Retail Report 2010

Edibl Oil M k tEdible Oil MarketSunflower Oil category which makes more than 70 Sunflower Oil category which makes more than 70 % of all edible oil consumption in volume has increased while olive oil category has decreased in 20102010.
74 5
Edible Oil Category Volume Shares
70,2 74,5
16,57,6 3,9 1,0
10,9 7,42,2
4,716,5
7,610,93,9 1,02,2
Sunflower Oil Olive Oil Canola OilCanola Oil Hazelnut OilCorn Oil
6
Source: Nielsen Türkiye Retail Report 2010 – Total Turkey W/O Bim
2009 2010
Oli Oil M k tI 2010
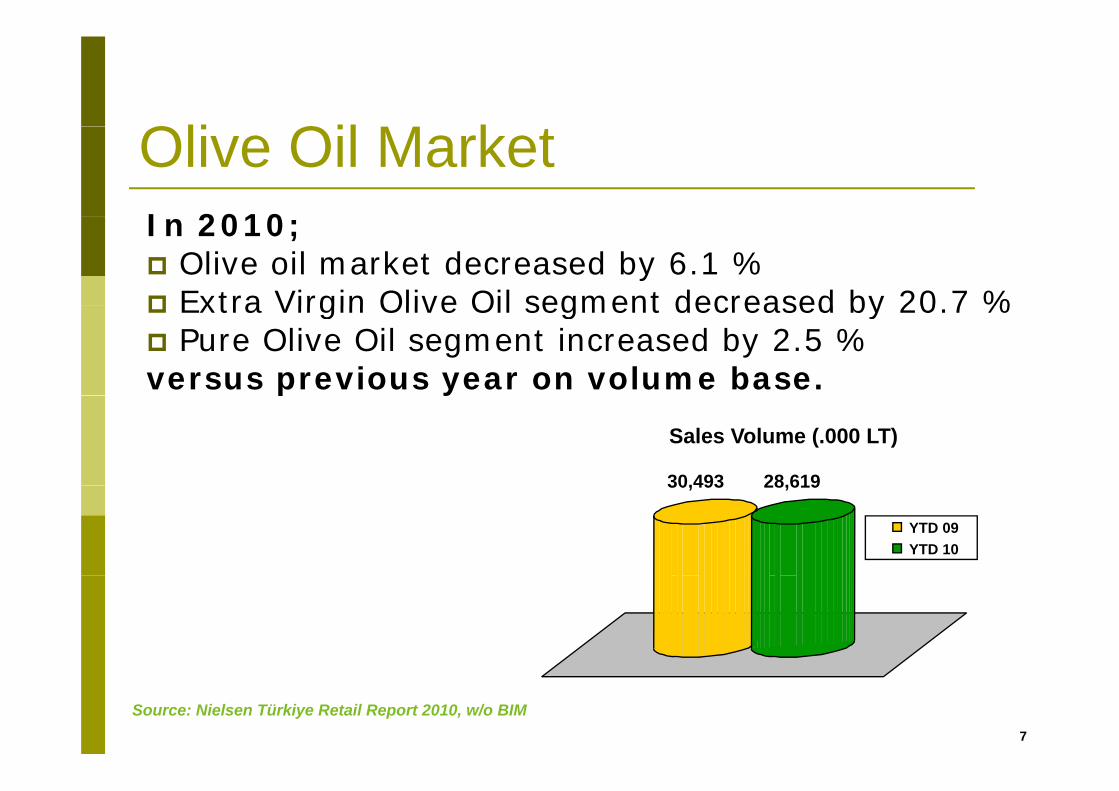
Olive Oil MarketIn 2010;
Olive oil market decreased by 6.1 %Extra Virgin Olive Oil segment decreased by 20 7 % Extra Virgin Olive Oil segment decreased by 20.7 % Pure Olive Oil segment increased by 2.5 %
versus previous year on volume base.p y
30,493 28,619
Sales Volume (.000 LT)
30,493 28,619
YTD 09YTD 10
7
Source: Nielsen Türkiye Retail Report 2010, w/o BIM
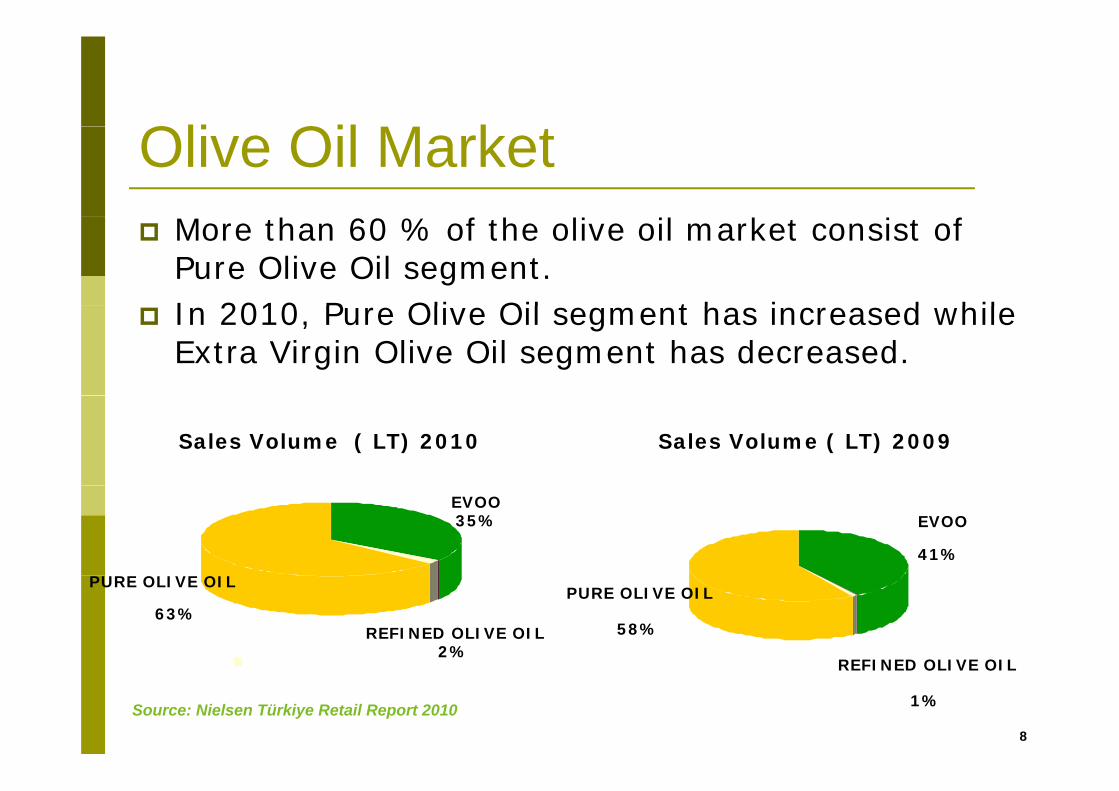
Oli Oil M k tOlive Oil MarketMore than 60 % of the olive oil market consist of Pure Olive Oil segment. I 2010 P Oli Oil t h i d hil In 2010, Pure Olive Oil segment has increased while Extra Virgin Olive Oil segment has decreased.
Sales Volume ( LT) 2010 Sales Volume ( LT) 2009
EVOO35% EVOO
41%
PURE OLIVE OIL
63%REFINED OLIVE OIL
2%
PURE OLIVE OIL
58%
REFINED OLIVE OIL
8
Source: Nielsen Türkiye Retail Report 2010
REFINED OLIVE OIL
1%

Oli Oil M k tOlive Oil MarketOlive oil consumption is stable except Ramadan period. Before and during Ramadan, the volume increases increases.
Olive Oil Consumption Volume Trend
(lt)
msu
mpt
ion
ve O
il C
omO
liv
9
Source: Nielsen Türkiye Retail Report 2010
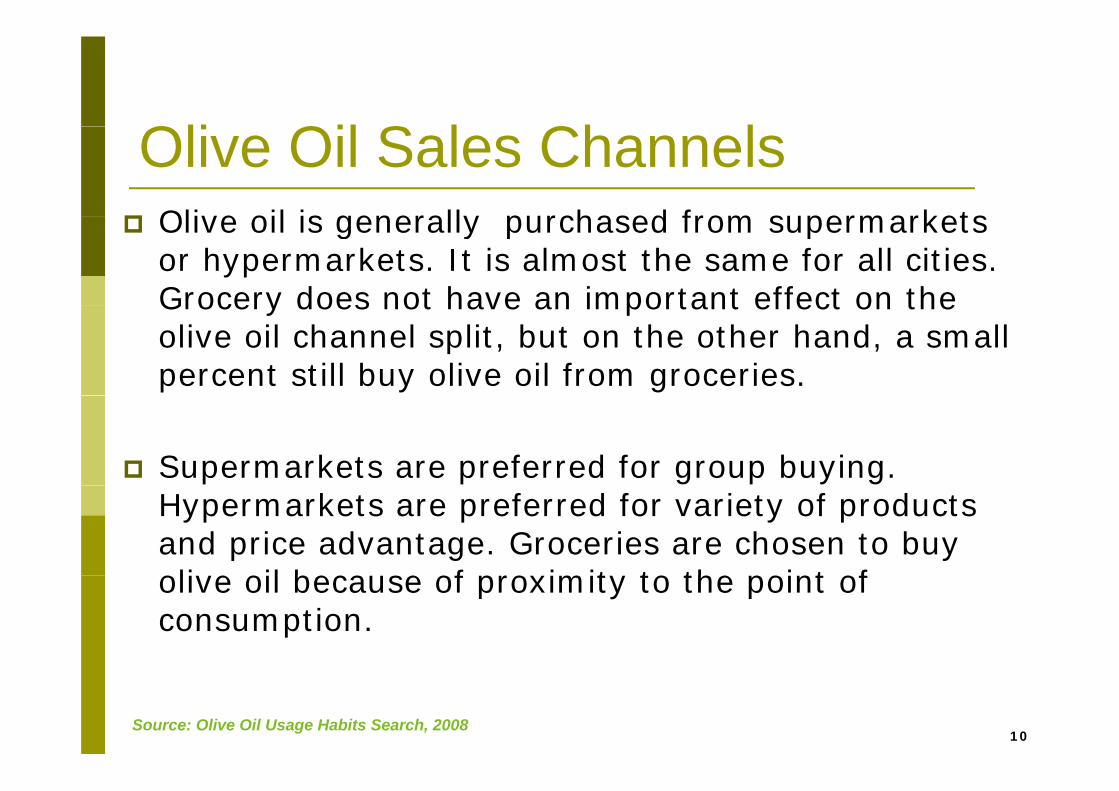
Oli Oil S l Ch lOlive oil is generally purchased from supermarkets
Olive Oil Sales ChannelsOlive oil is generally purchased from supermarkets or hypermarkets. It is almost the same for all cities. Grocery does not have an important effect on the Grocery does not have an important effect on the olive oil channel split, but on the other hand, a small percent still buy olive oil from groceries.
Supermarkets are preferred for group buying. Hypermarkets are preferred for variety of products and price advantage. Groceries are chosen to buy oli e oil beca se of p o imit to the point of olive oil because of proximity to the point of consumption.
10Source: Olive Oil Usage Habits Search, 2008

Oli Oil P k i P fOlive Oil Packaging Preferences
Most preferred package is tin 5 lt (almost 50 % ti )consumption)
2 lt and 1 lt packs comes the second and the thirdthird.
11

Oli Oil P k i P f5 lt tin is preferred due to ;
Olive Oil Packaging Preferences5 lt tin is preferred due to ;
Decrease purchase frequencyAffordable prices
Small sizes can are preferred because;Narrow spaces in the kitchensNarrow spaces in the kitchensPromotionsLess expenditure
Olive Oil is a price sensitive category and promotions are closely monitored by consumers. promotions are closely monitored by consumers.
On the other hand, brand awareness and reliability is still important.
12Source: Ipsos KMG
Consumer Profile and Consumption Patterns
Consumer Profile Olive Oil Perception Advantages and Disadvantages of Olive OilDishes Cooked with Olive Oil
13
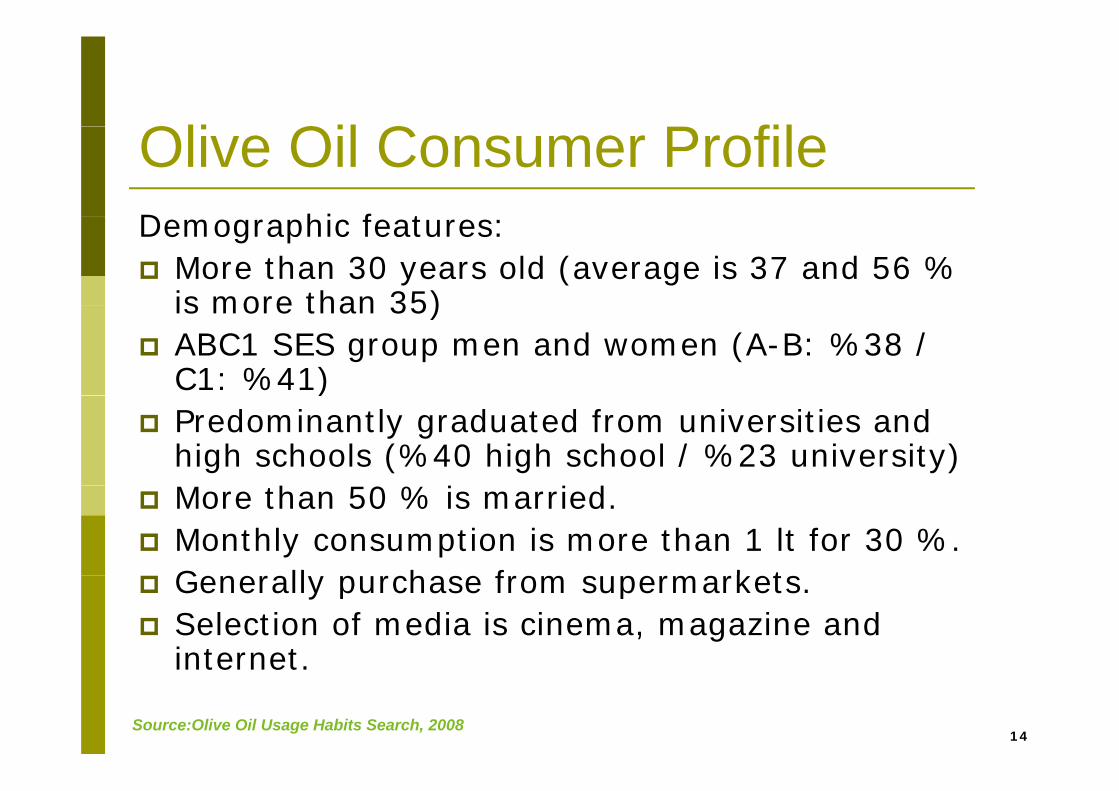
Oli Oil C P filOlive Oil Consumer ProfileD hi f t Demographic features:
More than 30 years old (average is 37 and 56 % is more than 35) is more than 35) ABC1 SES group men and women (A-B: %38 / C1: %41) )Predominantly graduated from universities and high schools (%40 high school / %23 university)
h 0 % i i dMore than 50 % is married.Monthly consumption is more than 1 lt for 30 %.Gene all p chase f om s pe ma ketsGenerally purchase from supermarkets.Selection of media is cinema, magazine and internet
14
internet.
Source:Olive Oil Usage Habits Search, 2008
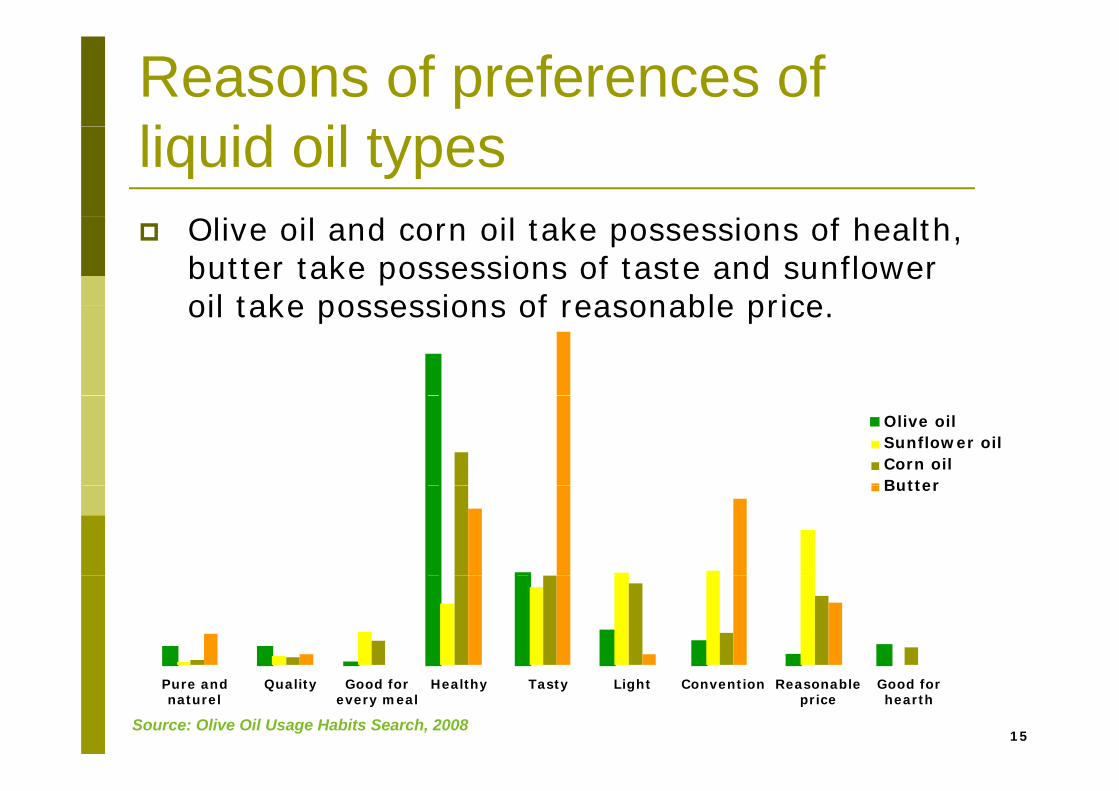
Reasons of preferences of li id il tliquid oil types
Olive oil and corn oil take possessions of health, butter take possessions of taste and sunflower oil take possessions of reasonable price oil take possessions of reasonable price.
Olive oilSunflower oilCorn oilButterButter
15
Pure andnaturel
Quality Good forevery meal
Healthy Tasty Light Convention Reasonableprice
Good forhearth
Source: Olive Oil Usage Habits Search, 2008
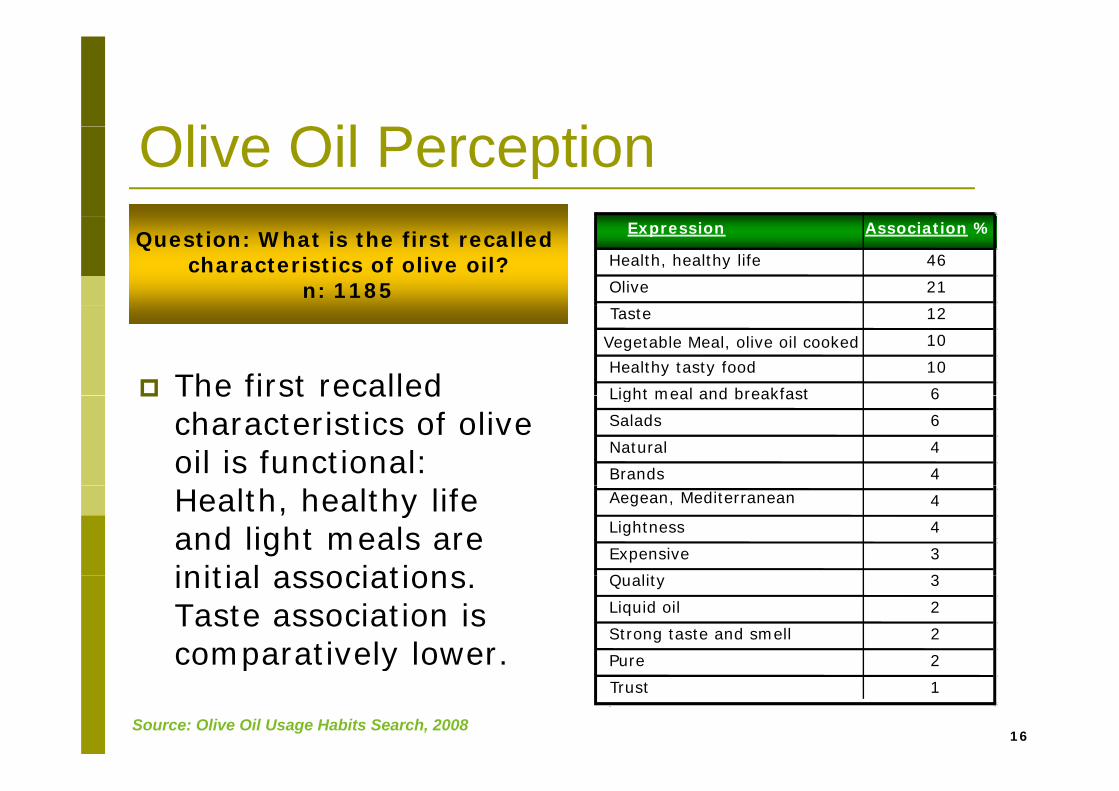
Oli Oil P tiOlive Oil PerceptionExpression Association %
Health, healthy life 46
Olive 21
Question: What is the first recalled characteristics of olive oil?
n: 1185
The first recalled
Taste 12
Vegetable Meal, olive oil cooked 10
Healthy tasty food 10
Light meal and breakfast 6The first recalled characteristics of olive oil is functional:
Light meal and breakfast 6
Salads 6
Natural 4
Brands 4
Health, healthy life and light meals are initial associations
Aegean, Mediterranean 4
Lightness 4
Expensive 3
Q lit 3initial associations. Taste association is comparatively lower.
Quality 3
Liquid oil 2
Strong taste and smell 2
Pure 2
16
co pa at e y o e Pure 2
Trust 1
Source: Olive Oil Usage Habits Search, 2008

Ad t f Oli OilAdvantages of Olive Oil
72 %Healthy
Question: What are the advantages of olive oil compared to other oils? Are there other advantages? n: 1119
9 %
11 %
72 %
Light
Tasty
Healthy
6 %
7 %
Easy to digest, stomach-friendly
Natural, pure
3 %
4 %
5 %
Does not cause blood vessel
Does not cause cholesterol
Does not exhaust hearth
1 %
3 %
3 %
Quality
Economical (more meal with less oil)
Does not cause blood vessel blockings, hearth-friendly
17
1 %Nitrous
Quality
Source: Olive Oil Usage Habits Search, 2008
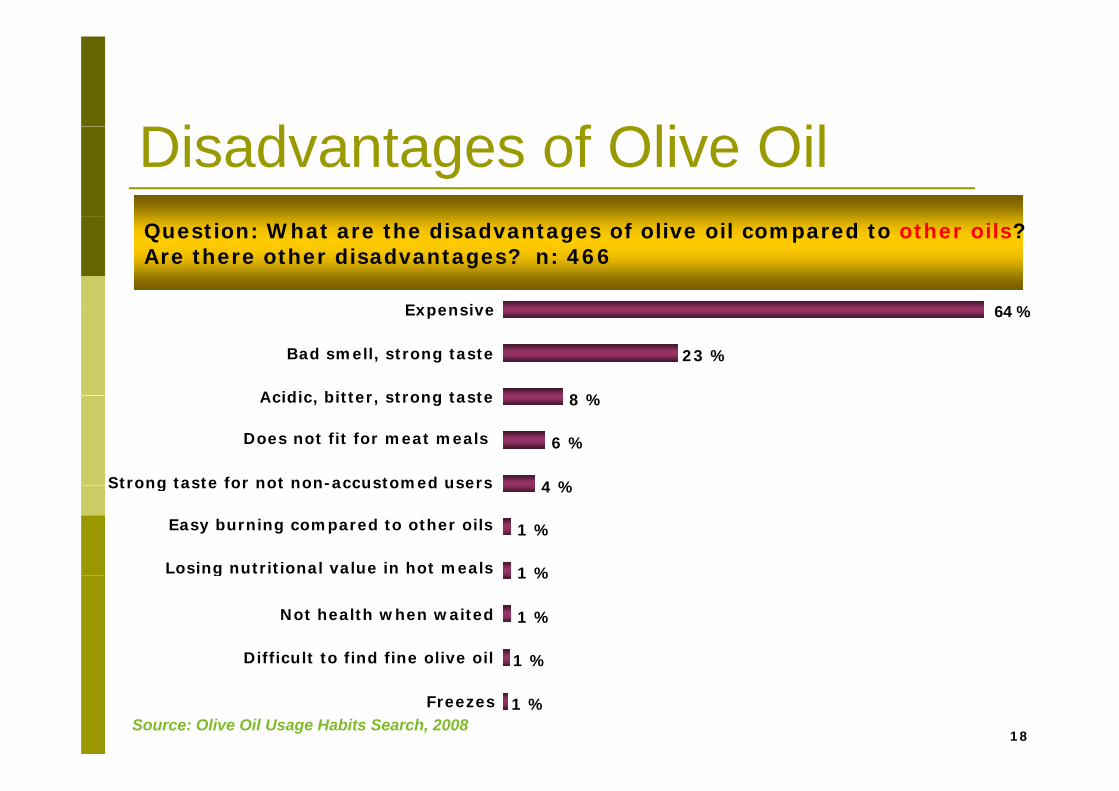
Di d t f Oli OilDisadvantages of Olive Oil
64 %E i
Question: What are the disadvantages of olive oil compared to other oils? Are there other disadvantages? n: 466
8 %
23 %
64 %
Acidic bitter strong taste
Bad smell, strong taste
Expensive
4 %
6 %
8 %
Strong taste for not non-accustomed users
Does not fit for meat meals
Acidic, bitter, strong taste
1 %
1 %
4 %
Losing nutritional value in hot meals
Easy burning compared to other oils
Strong taste for not non accustomed users
1 %
1 %
1 %
Difficult to find fine olive oil
Not health when waited
g
18
1 %
1 %
FreezesSource: Olive Oil Usage Habits Search, 2008
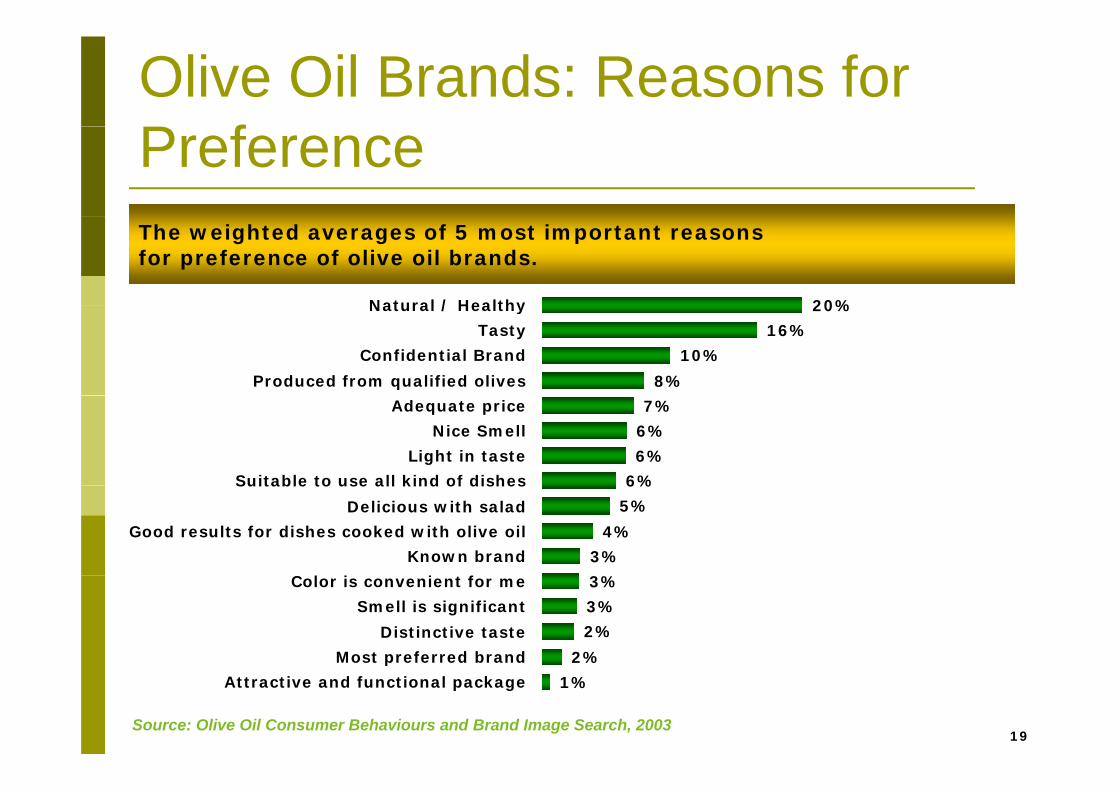
Olive Oil Brands: Reasons for P fPreference
20%Natural / Healthy
The weighted averages of 5 most important reasons for preference of olive oil brands.
8%
10%
16%
20%
Produced from qualified olives
Confidential Brand
Tasty
Natural / Healthy
6%
6%
6%
7%
Suitable to use all kind of dishes
Light in taste
Nice Smell
Adequate price
3%
4%
5%
6%
l i i f
Known brand
Good results for dishes cooked with olive oil
Delicious with salad
Suitable to use all kind of dishes
2%
2%
3%
3%
Most preferred brand
Distinctive taste
Smell is significant
Color is convenient for me
19Source: Olive Oil Consumer Behaviours and Brand Image Search, 2003
1%Attractive and functional package
p
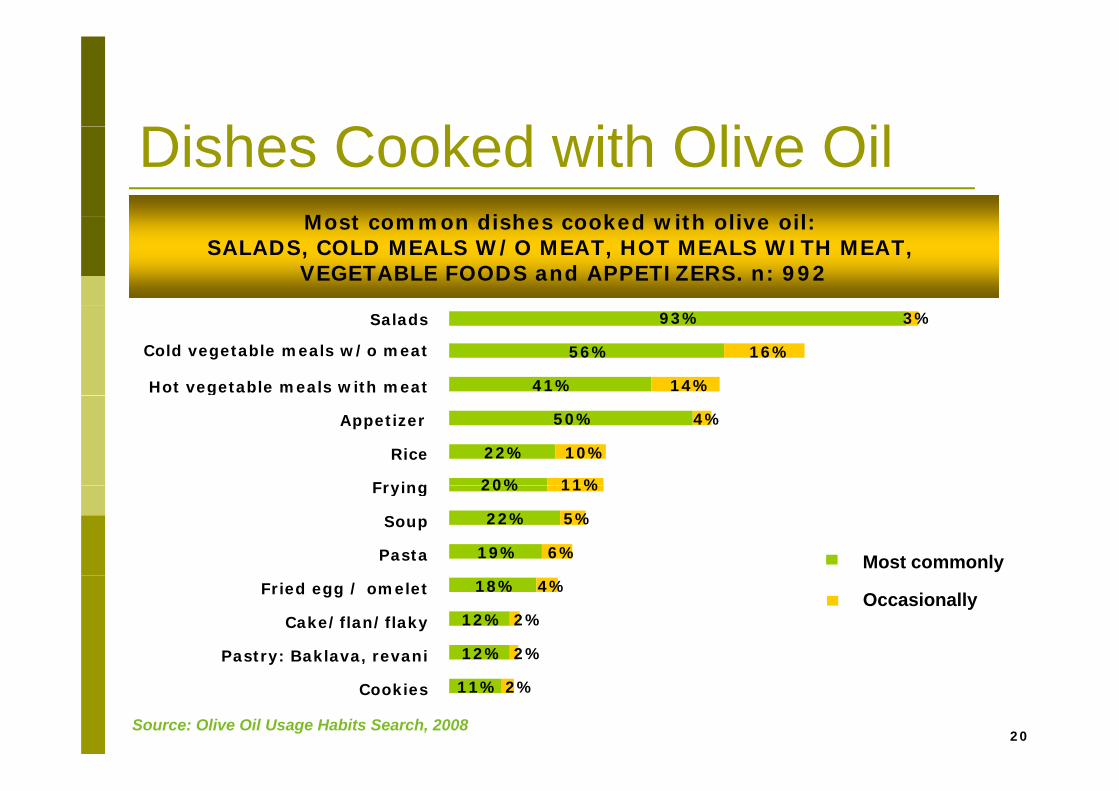
Di h C k d ith Oli OilDishes Cooked with Olive OilM t di h k d ith li il Most common dishes cooked with olive oil:
SALADS, COLD MEALS W/O MEAT, HOT MEALS WITH MEAT, VEGETABLE FOODS and APPETIZERS. n: 992
41%
56%
93%
14%
16%
3%
Hot vegetable meals with meat
Cold vegetable meals w/o meat
Salads
20%
22%
50%
11%
10%
4%
Frying
Rice
Appetizer
g
19%
22%
20%
6%
5%
11%
Pasta
Soup
Frying
Most commonly
12%
12%
18%
2%
2%
4%
Pastry: Baklava, revani
Cake/flan/flaky
Fried egg / omelet Occasionally
20
11% 2%Cookies
Source: Olive Oil Usage Habits Search, 2008

Thank You…