Customer Experience Lifecycle Mapping - J. Quimby Customer Experience Lifecycle Mapping - J. Quimby.
date post
20-Dec-2015Category
view
213download
0
Olin Degree Audit
Mel ChuaRob QuimbyNick Zola
Human Factors and
Interface DesignNov 1, 2005
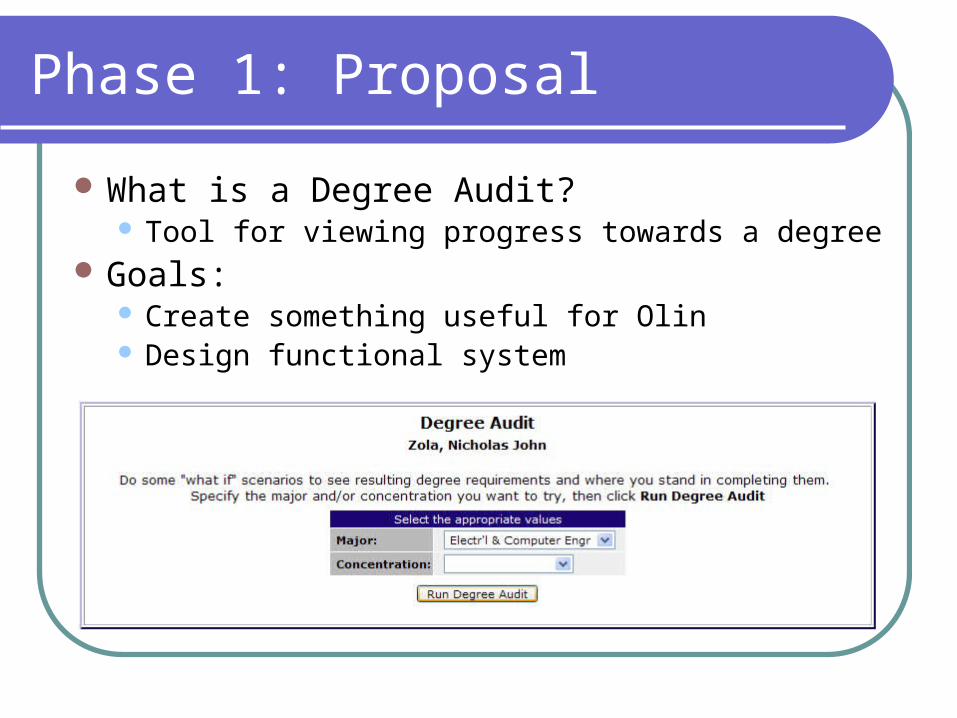
Phase 1: Proposal
What is a Degree Audit? Tool for viewing progress towards a degree
Goals: Create something useful for Olin Design functional system

Phase 1: Current System

Phase 2: User Interviews and Results
4 students, 2 faculty, 2 staff Students:
Can I graduate? What do I still need? What degree am I closest to?
Advisors: Can my advisees graduate? What do they still need? What does Olin need to offer so that they
can graduate?
Note: We didn’t actually interview these people.

Phase 2: Personas
Audrey Holden Got-it-together
ECE, certain of where she’s going
Wants easy way to plan ahead and see what she’s done
Neil Lennard E with…
something Taken a lot of
classes but not sure where he is
Wants to see what he’s closest to
Prof. Sophia Bentley
Capable ECE Program Chair
Good advisor, but lacks time
Needs quick way to check on advisee progress

Phase 3: Task Matrix
Tas
ks

Phase 3: Scenarios
Neil - Choosing A Major (current system approach)
Audrey - Choosing A Major (ideal system approach)
Sophia - Clearing For Registration (task-based approach)
Sophia and Audrey - Transfer Credit (current system approach)

Phase 3: Design Space
The process of choosing a degree at Olin.
And where we think we fit…

Phase 3: Initial Design Ideas
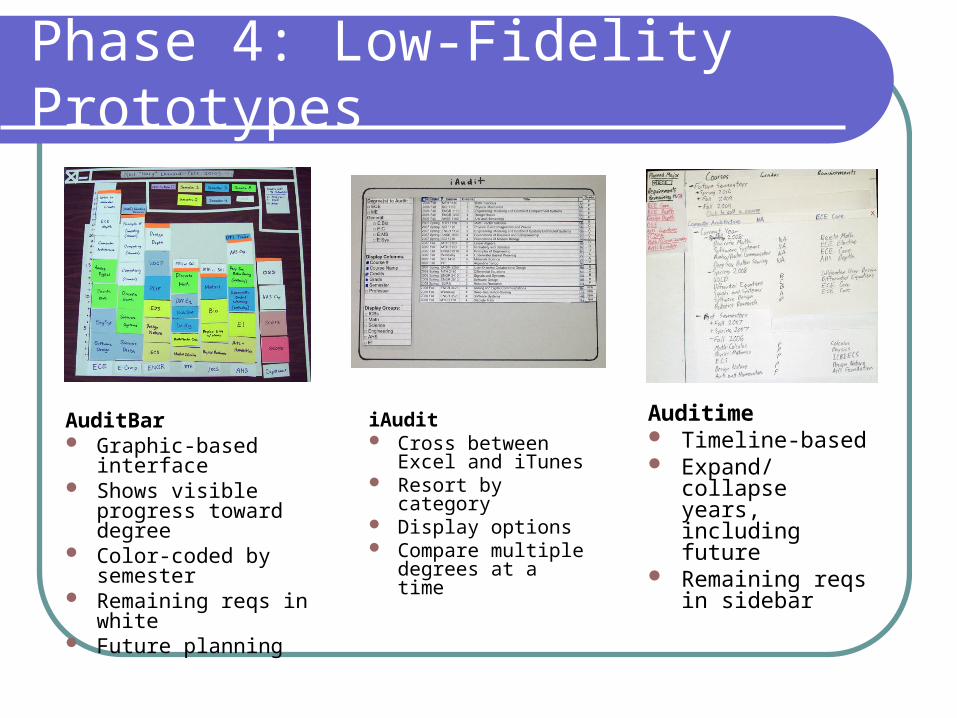
Phase 4: Low-Fidelity Prototypes
AuditBar Graphic-based
interface Shows visible
progress toward degree
Color-coded by semester
Remaining reqs in white
Future planning
iAudit Cross between
Excel and iTunes Resort by
category Display options Compare multiple
degrees at a time
Auditime Timeline-based Expand/
collapse years, including future
Remaining reqs in sidebar

Phase 4: Results and Decisions
Overall very positive Liked intuitive, flexible feel of iAudit/Auditime
Concerned with ICB Group, no cumulative stats, pop-up windows
Liked graphical, quick info-providing AuditBar Concerned with course redundancy, busy-ness, time
to learn
Our choice: AuditBar Design challenge (vs. recreating Excel) Innovative way of tracking degree progress Visually appealing, more interesting to create
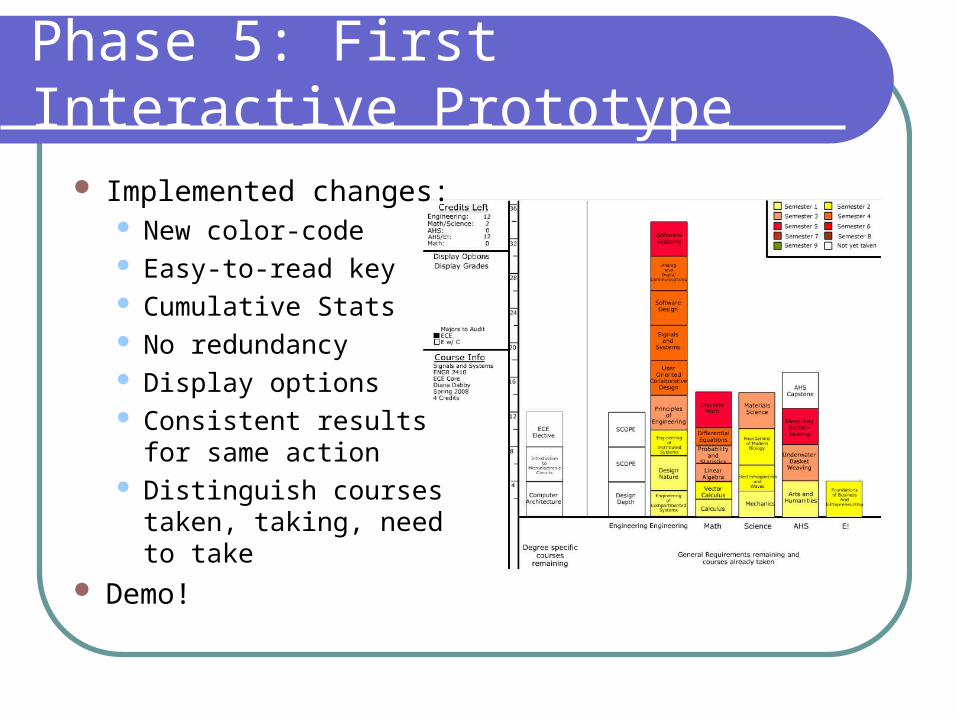
Phase 5: First Interactive Prototype
Implemented changes: New color-code Easy-to-read key Cumulative Stats No redundancy Display options Consistent results for
same action Distinguish courses
taken, taking, need to take
Demo!
Big Lesson and Future Phases
Biggest Lesson Learned:Goals aren’t sometimes foods
Future PhasesHeuristic Evaluation2nd Interactive PrototypeUser Evaluation3rd Interactive PrototypeSleep…