OLED Display & OLED Lighting: Technology Trends &...
29
OLED Display & OLED Lighting: Technology Trends & Market Forecast Jennifer Colegrove, Ph.D. VP, Emerging Display Technologies, NPD DisplaySearch
Transcript of OLED Display & OLED Lighting: Technology Trends &...

OLED Display & OLED Lighting: Technology Trends & Market Forecast
Jennifer Colegrove, Ph.D.
VP, Emerging Display Technologies,
NPD DisplaySearch

Outline
• OLED Display Technology and Market Forecast » New OLED Display Products » Technologies Challenges and New Progress » Flexible OLED Displays and Market Driver Forecast » OLED Display Shipments » OLED Display Forecast to 2019
• OLED Lighting Market and Forecast • Summary and Business Strategy Recommendation
2

OLED Products in the Market: • AMOLED is growing, but most products are <5
3

AMOLED TV 55” Coming in 2012
• At CES, both Samsung and LG demonstrated 55” AMOLED TV. • Both announced commercialization in 2012.
Source: Samsung Source: LG
4

OLED TV vs. 4K×2K LCD TV
• At IFA 2012 show in Berlin, main competition OLED TV vs 4KX2K LCD TV • There are only two possible OLED TV suppliers as of today, but 4K×2K LCD suppliers are
more numerous. • OLED TV announced price of $9,200. 4KX2K LCD TV announced price of $22,000.
5
OLED 1920X1080 LCD 4KX2K
Origin Brand Size Panel maker Brand Size Panel maker
Korea Samsung 55" Samsung Display Samsung 70" Samsung Display
LGE 55" LG Display LGE 84" LG Display
Japan Sony 84" LG Display
Sharp 60" Sharp
Toshiba 55" AUO
84" LG Display
China Hisense 50" CMI
65" CMI
Haier 65" CMI
Changhong 55" AUO
THTF 50" CMI
Source: DisplaySearch weekly TV supply chain executive briefing report
LG
Outline
• OLED Display Technology and Market Forecast » New OLED Display Products » Technologies Challenges and New Progress » Flexible OLED Displays and Market Driver Forecast » OLED Display Shipments » OLED Display Forecast to 2019
• OLED Lighting Market and Forecast • Summary and Business Strategy Recommendation
6

AM OLED and AM LCD Display Characteristics
AM OLED AM LCD
Thickness/weight Thinner, best is 0.05 mm; lighter Thicker, best is 0.8 mm; heavier
Diagonal Size Limited to small/medium sizes; largest demo is 55"
Can be larger; largest demo is ~100"
Viewing Angle Up to 180° Narrower, depends on liquid crystal type
Color Gamut >100% NTSC (top emission), ~70% NTSC (bottom); high at all gray levels
~70%, up to ~100% NTSC (LED backlight and new color filter); falls at low gray levels
Color Reproduction Better; gamut independent of view angle Good; gamut changes with viewing angle
Resolution Lower; 308 dpi (SM), 202 dpi (polymer) Higher; best is 498 dpi
Response Time Faster, nanoseconds. No motion blur, good for 3D
Slower, milliseconds
Contrast Ratio Higher Lower
Sunlight Readability Better than transmissive LCD, worse than transflective LCD
OK if transflective
Operating Temperature
Range is larger, can operate at low temps like –40°C.
Range is smaller, lowest temp is –10°C.
Power Consumption Lower at typical video content if ~30% of pixels are on
Higher at typical video content
Lifetime Shorter, up to 30K hour, but improving Much longer, above 50K hour
Manufacturing Investment
Lower, but lack of standards keeps the investment only slightly lower
Higher
Production Cost Expensive; low yield, potential to be low cost
Cheaper than AMOLED
Source: DisplaySearch OLED Technology Report 7

Obstacles and Solutions for Large OLED
Obstacles Potential Solutions
Scale to larger back plane a-Si TFT, oxide TFT, etc.
(Tile is another choice, but expensive.)
Color patterning Nozzle printing, LITI, white with color filter, blue
with color change methods
Lifetime
Material improvement, hermetic sealing. Red and
green is more than good enough. Blue still needs
some work.
Cost Improve yield of TFT backplane, material
utilization rate, White with color filter, TAC time
Competing with LCD Flexible/curve form factor, transparent TV?
Sony SMD
LGD
8

55” OLED TV cost currently
• 55” OLED TV cost is 8 or 10 times higher than 55” LCD TV. • Solutions: Improve yield of TFT backplane, material utilization
rate, White with color filter, TAC time
9
55” Module Costs Assuming Q3’12 Material Costs and Yield Estimates
X 7.8
X 10
Source: DisplaySearch AMOLED Process Roadmap Report

Comparison of LTPS, a-Si, and Oxide TFT
• Nearly all AMOLEDs on the market are currently based on LTPS TFT.
• Several companies are developing AMOLEDs using oxide or a-Si TFT backplanes, and are likely to start production in 2012.
Source: DisplaySearch OLED Technology Report
10

Comparison of Patterned RGB and White OLED with CF
• LG’s 55” AMOLED TV used white OLED with CF method. • Samsung’s 55” AMOLED TV used RGB.
Advantages Disadvantages
Patterned RGB
(Samsung)
High efficiency Good color
No color filter cost
Yield Cost
Material utilization efficiency Scalability is limited Aperture ratio issues
Differential aging Requires circular polarizer
White with RGBW
Color Filter (LG)
No mask Aperture ratio unaffected Fewer OLED process steps Reduced differential aging
Less color shift Lower voltage
No circular polarizer Higher material utilization
Scalable to large size
Loss of efficiency due to CF absorption
Color gamut a function of white spectrum
Cost of color filter
Source: DisplaySearch OLED Technology Report
11

Outline
• OLED Display Technology and Market Forecast » New OLED Display Products » Technologies Challenges and New Progress » Flexible OLED Displays and Market Driver Forecast » OLED Display Shipments » OLED Display Forecast to 2019
• OLED Lighting Market and Forecast • Summary and Business Strategy Recommendation
12
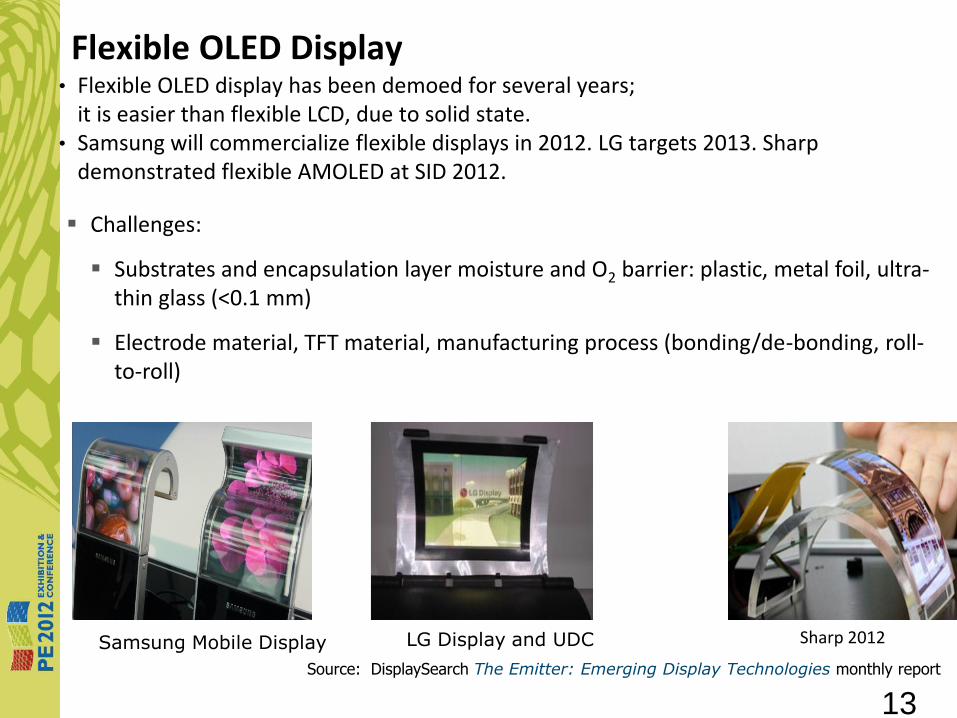
Flexible OLED Display • Flexible OLED display has been demoed for several years;
it is easier than flexible LCD, due to solid state. • Samsung will commercialize flexible displays in 2012. LG targets 2013. Sharp
demonstrated flexible AMOLED at SID 2012.
Samsung Mobile Display LG Display and UDC
Source: DisplaySearch The Emitter: Emerging Display Technologies monthly report
Sharp 2012
13
Challenges:
Substrates and encapsulation layer moisture and O2 barrier: plastic, metal foil, ultra-thin glass (<0.1 mm)
Electrode material, TFT material, manufacturing process (bonding/de-bonding, roll-to-roll)

Flexible OLED Display Market Drivers
• iPhone 5 reviews indicated “no wow factor.” The next “wow factor” will come from flexible displays.
• Near term will be fixed/curved, thin, and light weight, but not dynamic bendable.
Source: DisplaySearch The Emitter: Emerging Display Technologies monthly report
2012 2013 2014 2015 2016 2017 2018
1-4.x”
5-9.x”
>10”
Mobile Phone Display
(Samsung, LG…)
Tablet PC
(Samsung, LG…)
NB/Hybrid PC
(…)
14
Larger size show more benefit

Outline
• OLED Display Technology and Market Forecast » New OLED Display Products » Technologies Challenges and New Progress » Flexible OLED Displays and Market Driver Forecast » OLED Display Shipments » OLED Display Forecast to 2019
• OLED Lighting Market and Forecast • Summary and Business Strategy Recommendation
15

Looking Back 1999-2010
• PMOLED started shipments in 1999; AMOLED started at the end of 2002.
• Kodak DSC easyshare was the first AMOLED in market.
0
10
20
30
40
50
60
70
80
1999 2000 2001 2002 2003 2004 2005 2006 2007 2008 2009 2010
Sh
ipm
en
ts (
Mil
lio
ns)
PMOLED
AMOLED
Source: DisplaySearch OLED Technology Report
16

OLED Displays Shipment Share
• Samsung Mobile Display was #1 with 70.7% share in Q1’12. Visionox (China) became #2 with steady growth.
• WiseChip (Taiwan) is #3. • Japanese suppliers are
losing market share.
Source: DisplaySearch Q2’12 Quarterly OLED Shipment and Forecast Report
Samsung Mobile70.7%
Visionox7.5%
WiseChip6.2%
Pioneer4.3%
TDK4.0%
RiTdisplay3.7%
LG Display1.4%
Sony0.9%
Irico0.5%
Nippon Seiki0.5%
Truly0.3%
eMagin0.1%
© DisplaySearch
17

AMOLED Fab Activity • More than 10 new AMOLED fabs will be installed/updated in the next three years. • Samsung Display Corp’s Gen 5.5 AMOLED fab is established. • Samsung and LG are building their Gen 8 AMOLED lines.
Source: DisplaySearch Q2’12 Quarterly FPD Supply/Demand and Capital Spending Report
Order Equipment Equipment Install Mass Production
18

AMOLED Enters Medium/Large Size
• Currently most AMOLED shipments are <5”. • Small amounts are shipped for a large number of sizes >5”.
2009 2010 2011 2012 2013
5”
10”
15”
20”
50”
Mobile PC
7”, 15”, 17”, 25” Professional/broadcast
11”, 15” OLED TV
2014
DPF
>50” OLED TV
30”
Portable game
19
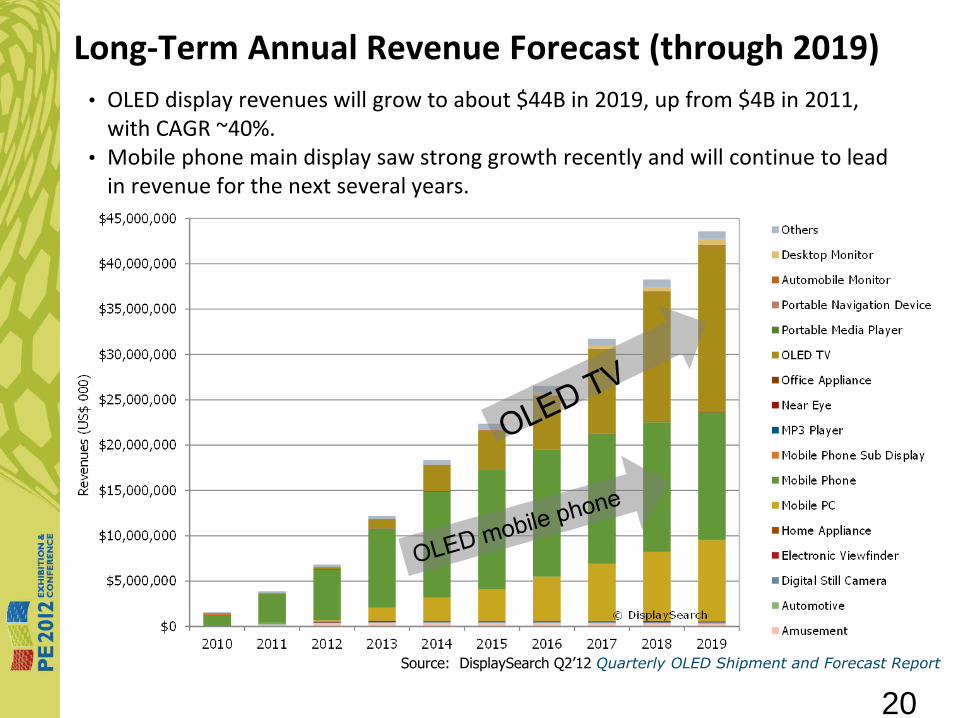
Long-Term Annual Revenue Forecast (through 2019)
• OLED display revenues will grow to about $44B in 2019, up from $4B in 2011, with CAGR ~40%.
• Mobile phone main display saw strong growth recently and will continue to lead in revenue for the next several years.
Source: DisplaySearch Q2’12 Quarterly OLED Shipment and Forecast Report
20

Outline
• OLED Display Technology and Market Forecast » New OLED Display Products » Technologies Challenges and New Progress » Flexible OLED Displays and Market Driver Forecast » OLED Display Shipments » OLED Display Forecast to 2019
• OLED Lighting Market and Forecast • Summary and Business Strategy Recommendation
21

OLED Lighting Market Drivers • Area/surface lighting: flexible or rigid form factor • Tunable color for decorative use and color
matching • Low drive voltage for better power, smaller
power supply • Fast switch on. Wide operation temperatures for
use in extreme environments • No noise; Environmentally friendly • High efficiency for energy saving • Thin, light weight • OLED lighting can be transparent like a window or
reflective like mirrors.
Source: GE
Source: Konica Minolta
Source: Ingo Maurer
Source: OSRAM
22

OLED Lighting Faces Different Challenges from Displays
Feature/Specification Display Lighting
Luminance (cd/m²) 150-1000 500-7000
Color Criteria Full color
balanced white, or RGB for
decorative lighting
Color Specification >100% of NTSC CRI >80
Typical Panel diagonal (cm) 2-100 5-200
Pixels yes no pixel, but small tiles
Lifetime (K hours) T50 is about 5-60 T70 need 10-100
Efficacy (lm/W) 10-100 10-150
Backplane
active matrix or passive matrix or
segment simple
Process typically batch roll-to-roll, or batch
Cost (US$/m²) ~$1000-2000 target $30-100
Issues
backplane scale to large size,
backplane cost, resolution/fine
patterning
uniformity and large area, high CRI,
material cost, high luminance,
infrastructure
Source: DisplaySearch OLED Technology Report
23
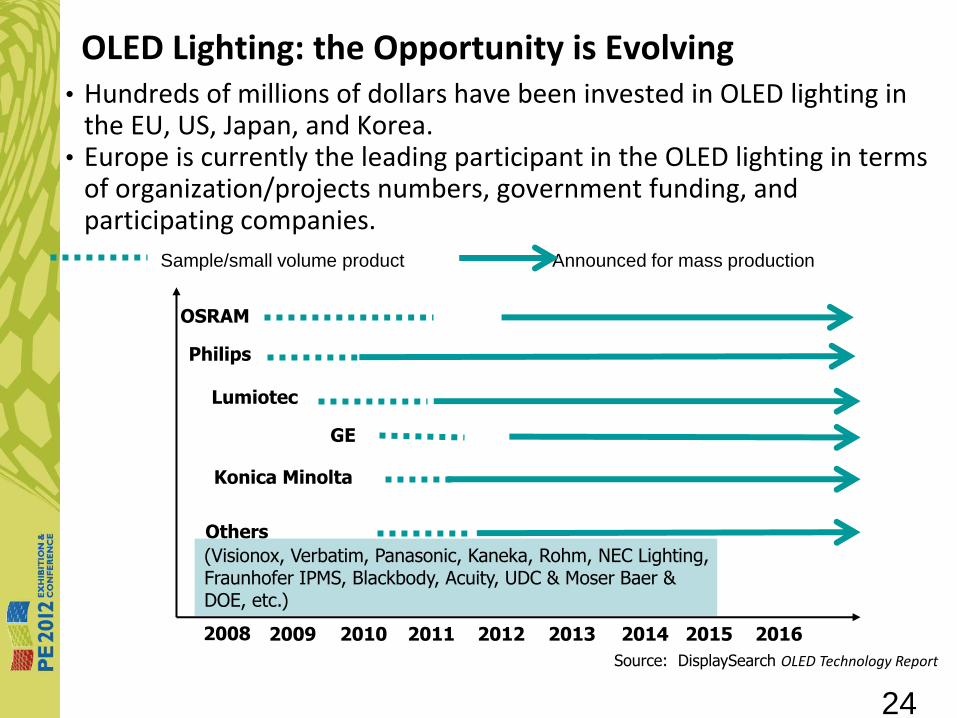
OLED Lighting: the Opportunity is Evolving • Hundreds of millions of dollars have been invested in OLED lighting in
the EU, US, Japan, and Korea. • Europe is currently the leading participant in the OLED lighting in terms
of organization/projects numbers, government funding, and participating companies.
Source: DisplaySearch OLED Technology Report
Sample/small volume product Announced for mass production
2008 2009 2010 2013 2012 2011 2014 2015 2016
OSRAM
Philips
Lumiotec
GE
Konica Minolta
Others
(Visionox, Verbatim, Panasonic, Kaneka, Rohm, NEC Lighting, Fraunhofer IPMS, Blackbody, Acuity, UDC & Moser Baer & DOE, etc.)
24

OLED Lighting Market Forecast
• The OLED lighting market started to pick up around 2011. • The OLED lighting market will reach $1.5B by 2015 and reach $6.3B by 2018.
Source: DisplaySearch OLED Lighting in 2009 and Beyond: The Bright Future
0
1000
2000
3000
4000
5000
6000
7000
OLED Lighting
Revenue ($M)
2008 2009 2010 2011 2012 2013 2014 2015 2016 2017 2018
25
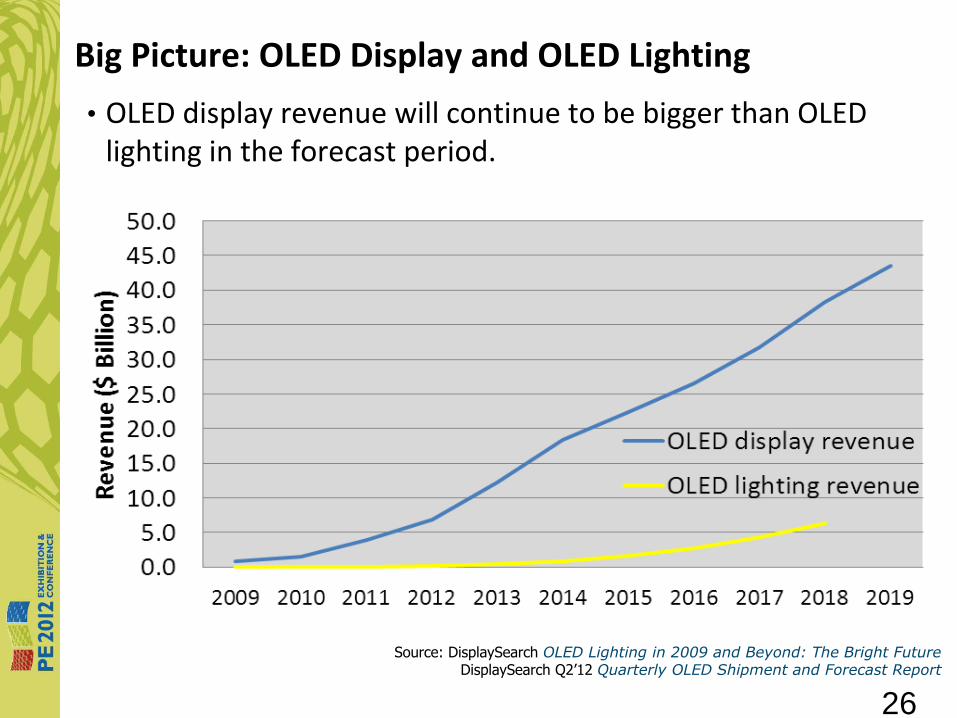
Big Picture: OLED Display and OLED Lighting
• OLED display revenue will continue to be bigger than OLED lighting in the forecast period.
Source: DisplaySearch OLED Lighting in 2009 and Beyond: The Bright Future DisplaySearch Q2’12 Quarterly OLED Shipment and Forecast Report
26

Outline
• OLED Display Technology and Market Forecast » New OLED Display Products » Technologies Challenges and New Progress » Flexible OLED Displays and Market Driver Forecast » OLED Display Shipments » OLED Display Forecast to 2019
• OLED Lighting Market and Forecast • Summary and Business Strategy Recommendation
27

Summary and Business Strategy Recommendations
• OLED display revenue reached $4B in 2011; DisplaySearch forecast that revenue will surpass $40B by 2019.
• Breakthroughs in oxide TFT and a-Si TFT backplanes and in color patterning are needed for AMOLED to move to larger sizes.
• OLED works in niche applications where LCD cannot compete: » Flexible displays » Transparent displays » Dual view (or even 3 or 4 views) » Lighting
• OLED lighting will reach $6.3B by 2018. » OLED lighting costs need to be reduced and efficiency needs to be improved for mass
adoption.
• Add touch screens
28