Olav pedersen what will we miss by changing screenings trategy to nipt-obp-150415
23
What will be missed by NIPT? If we change from current screening strategy with combined first trimester screening 1. Nordic Network for Fetal Medicine (NNFM) meeting Gøteborg 15. April 2015 Olav B Petersen, Ass Professor, PhD Department of Obstetrics and Gynecology Aarhus University Hospital Skejby Denmark
-
Upload
nnfm-nordic-network-of-fetal-medicine -
Category
Healthcare
-
view
128 -
download
2
Transcript of Olav pedersen what will we miss by changing screenings trategy to nipt-obp-150415
What will be missed by NIPT?
If we change from current screening strategy with combined first trimester screening
1. Nordic Network for Fetal Medicine (NNFM) meeting
Gøteborg 15. April 2015
Olav B Petersen, Ass Professor, PhD Department of Obstetrics and Gynecology Aarhus University Hospital Skejby Denmark


Danish National study 2007-2011

Material and methods
National Fetal Medicine Database • Study period: 2008-2011 • 219,324 booked for first trimester screening
(91.0% of all deliveries)
• 193,638 singleton pregnancies w/full combined First Trimester Screening (cFTS)
• 10,205 (5.3%) had a karyotype – 9,461 prenatal (92.7%) – 580 abortion (5.7%) – 217 postnatal (2.1%)
National Genetic Register
National Birth & diagnose Register

Results – abnormal karyotype 1,122 (11.0%) abnormal karyotype • Detectable by standard NIPT:
– Trisomy 21 500 – Trisomy 18/13 189 – Sex aneuploidies 126
• Undetectable by standard NIPT: – Balanced translocations 45 – With high risk of abnormal phenotype: 262
• Unbalanced translocations, other unbalanced re-arrangements, deletions, triploidy, other autosomal trisomy
72,6%
27,4%
23,4% Atypical abnormal karyotype

Random distribution?

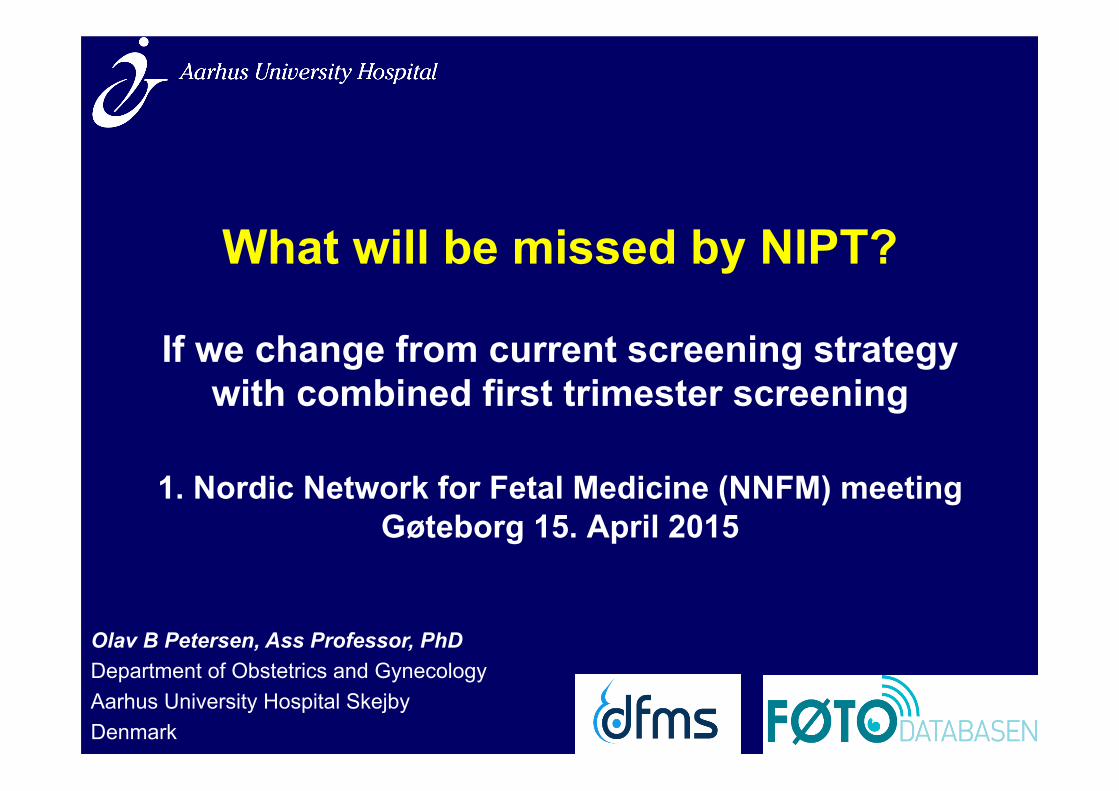
Random distributed in population?
Risk group Atypical abnormal (n) Prevalence (% - 95%CI)
Total 262 0.14 (0.12-0.16)

Random distributed in population?
Risk group Atypical abnormal (n) Prevalence (% - 95%CI)
Total 262 0.14 (0.12-0.16)
NT≥99% 31 2.28 (1.61-3.22)
Random distributed in population?
Risk group Atypical abnormal (n) Prevalence (% - 95%CI)
Total 262 0.14 (0.12-0.16)
NT≥99% 31 2.28 (1.61-3.22)
PAPP-A MoM <0·2 39 4·17 (3.07-5.65)
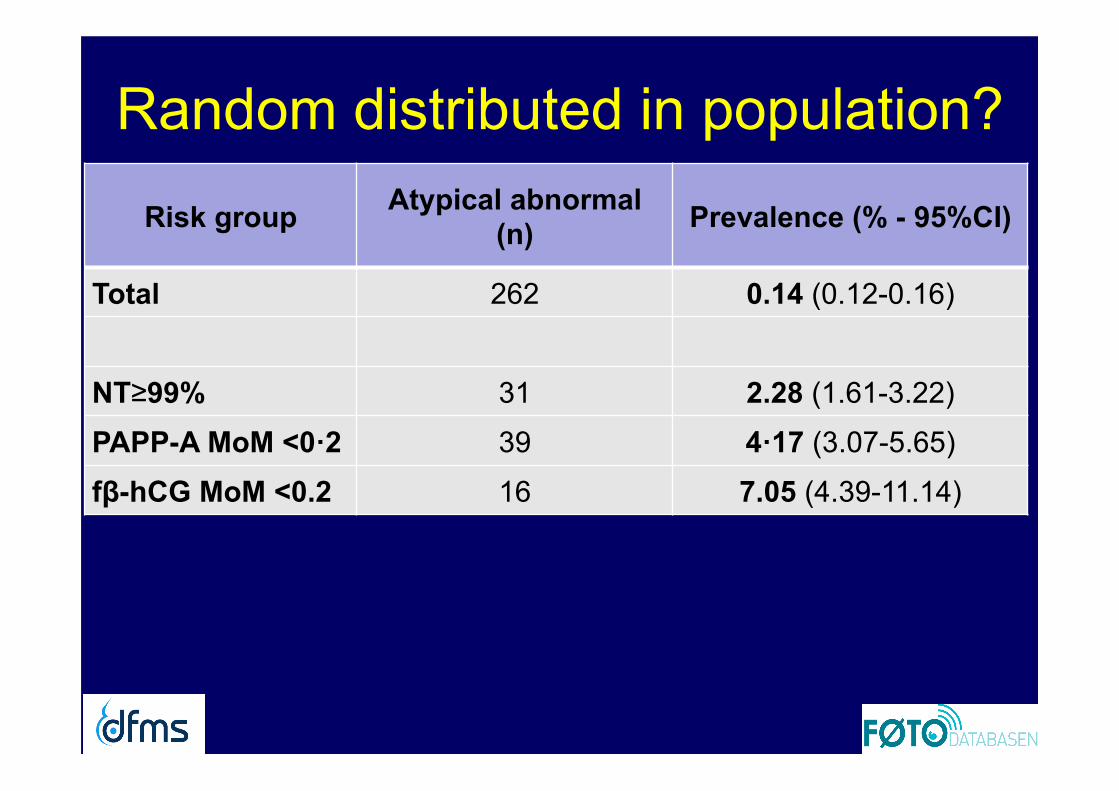
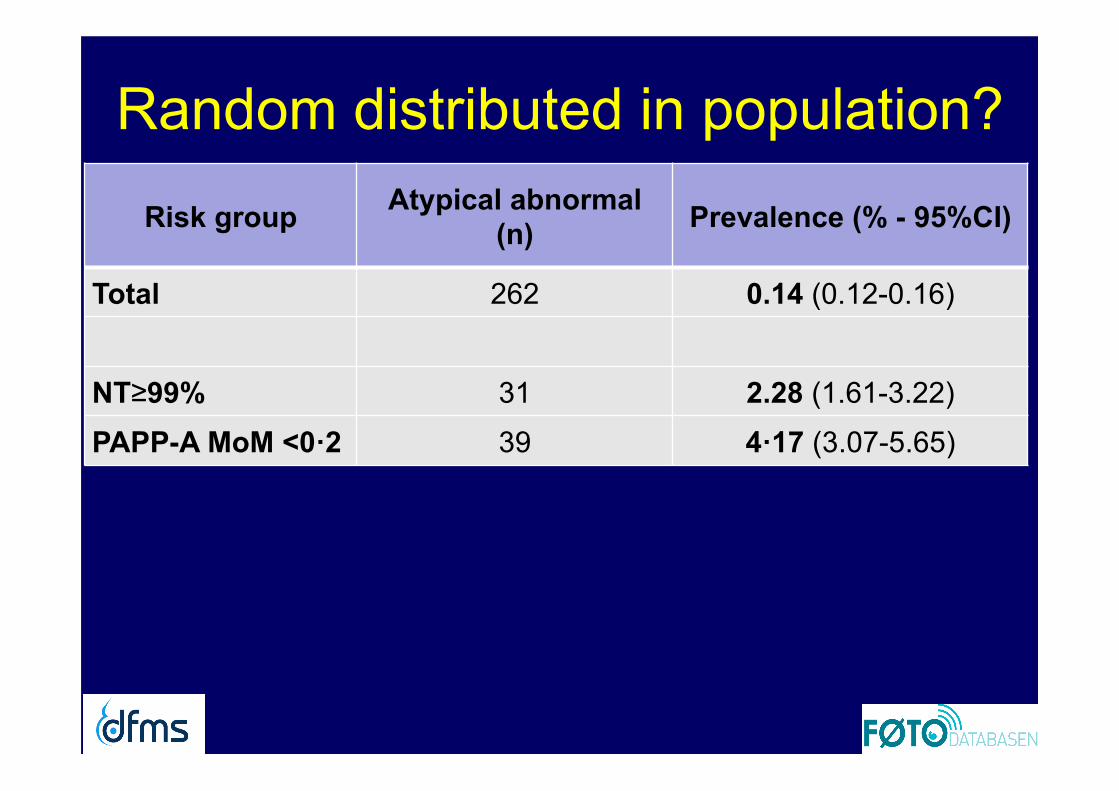
Random distributed in population?
Risk group Atypical abnormal (n) Prevalence (% - 95%CI)
Total 262 0.14 (0.12-0.16)
NT≥99% 31 2.28 (1.61-3.22)
PAPP-A MoM <0·2 39 4·17 (3.07-5.65)
fβ-hCG MoM <0.2 16 7.05 (4.39-11.14)

Random distributed in population?
Risk group Atypical abnormal (n) Prevalence (% - 95%CI)
Total 262 0.14 (0.12-0.16)
NT≥99% 31 2.28 (1.61-3.22)
PAPP-A MoM <0·2 39 4·17 (3.07-5.65)
fβ-hCG MoM <0.2 16 7.05 (4.39-11.14)
> 1:300 84 1.06 (0.86-1.31)
< 1:1000 152 0.08 (0.07-0.10)
Random distributed in population?
Risk group Atypical abnormal (n) Prevalence (% - 95%CI)
Total 262 0.14 (0.12-0.16)
NT≥99% 31 2.28 (1.61-3.22)
PAPP-A MoM <0·2 39 4·17 (3.07-5.65)
fβ-hCG MoM <0.2 16 7.05 (4.39-11.14)
> 1:300 84 (32.1%) 1.06 (0.86-1.31) < 1:1000 152 0.08 (0.07-0.10)

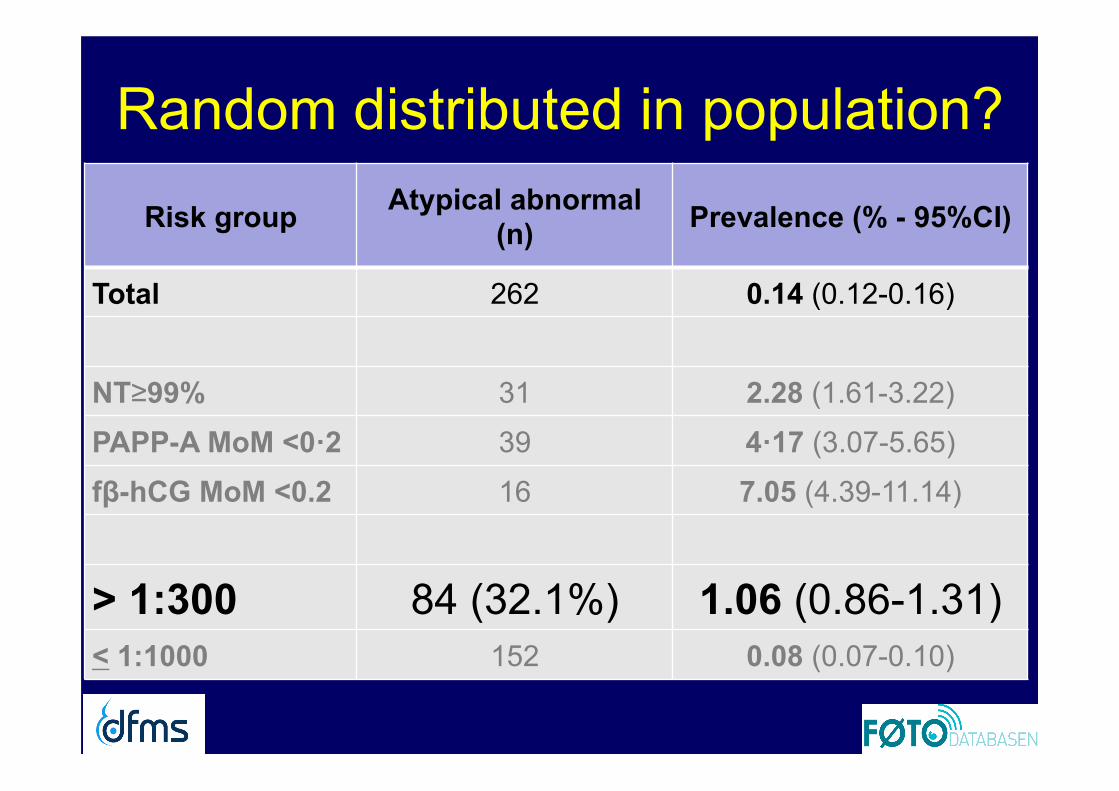
Random distributed in population?
Risk group Atypical abnormal (n) Prevalence (% - 95%CI)
Total 262 0.14 (0.12-0.16)
NT≥99% 31 2.28 (1.61-3.22)
PAPP-A MoM <0·2 39 4·17 (3.07-5.65)
fβ-hCG MoM <0.2 16 7.05 (4.39-11.14)
> 1:300 84 (32.1%) 1.06 (0.86-1.31) < 1:1000 152 0.08 (0.07-0.10)
LR: 13 (high risk/low risk LR: 7,5 (high risk/all)

Other studies on atypical anomalies Study Karyotypes Abnormal
karyotypes (n) Atypical abnormal (%)
Petersen et al, UOG 2014 n=10.205 1.077 23.4
Norton et al, O&G 2014 (high risk) n=26.059 2.973 16.9
Norton et al, SMFM 2015 (low risk) ? 2.575 21.7
Norton et al, NEJM 2015 (NEXT) 625 68 16.2 (23.5)

Conclusions
• Current NIPT will miss 1 out of 4 abnormal karyotypes of clinical significance
• LR: 7-13 for atypical abnormal if cFTS T21 risk >1:300
• 1 in 3 of atypical abnormal would be high risk of Downs Syndrome at cFTS (1 in 2 at SS)

Thank you
The Danish Fetal Medicine Study Group: Karin Sundberg, Finn Stener Jørgensen, Torben Larsen, Annette Wind Olesen, Lillian Skibsted, Eva Hoseth, Marianne Christiansen, Lene Sperling, Helle Zingenberg, Anne-Cathrine Shalmi, Hanne Søndergaard Jensen, Richard Farlie, Marianne Østergaard, Mette Holm Ibsen The Danish Clinical Genetics Study Group: Peter K A Jensen, Christina Fagerberg, Susanne Timshel, Susanne Kjærgaard, Anders Bojesen, Michael Bjørn Petersen
From Vancouver Airport

California study 2015

Norton (2015): 2.575 abnormal

Norton (2015): 2.575 abnormal • 24.5% of all abnormal karyotypes would be missed by
current NIPT
• 53.8% of these were detected by current 1st an 2nd trim sequentiel screening (SS)
• DR ALL abnormal chromosomal anomalies • NIPT: 75.4% • SS: 81.6%

Norton (2015) Conclusion

Implications for screening strategies? Test strategy
CVS
NIPT
Detection rate (%) T21
n=500 Atypical
abnormal n=262
All abnormal n=1077
cFTS CVS @ risk >1:300 4.1% 0% 87.2% 32.2% 70.0%

Test strategy
CVS
NIPT
Detection rate (%) T21 Atypical
abnormal
All abnormal
CVS @ >1:300 4.1% 0% 87.2% 32.2% 70.0%
NIPT for all (n=193.638) 0% 100% 100% 0% 75.7%
CVS @ >1:250 + risk factor NIPT @ 1:250-1:500 4,3% 2,1% 91,2% 37,4% 75,4%
CVS >1:300 + risk factor NIPT @ 1:300-1:1000 4,7% 5,6% 93,6% 37,8% 77,2%
Risk factors: Maternal age ≥ 45 yr, NT ≥ 3.5 mm, fβ-hCG ≥ 5 MoM, fβ-hCG or PAPP-A < 0.2 MoM
Implications for screening strategies?