OKLAHOMA2008D I saw it in the SHALE SHAKER ” March-April2009/SHALE SHAKER 1 This article is a...
10
“I saw it in the SHALE SHAKER” March-April 2009/ SHALE SHAKER 1 This article is a summary of 2008 Oklahoma drilling activity and highlights results that became public by January 1, 2009. Significant results registered after this date will appear in next year’s summary. Except where noted, all data were supplied online by Petroleum Information/Dwights LLC dba IHS Energy Group, all rights reserved. Without this excellent database this report could not have been completed. Cartography is by Russell Standridge of the Oklahoma Geological Survey. General Activity The working drilling rig number is a fundamental barometer of oil and gas activity in any area. The Baker Hughes Company has tracked monthly rotary drilling rig counts for many years and has compiled these into annual averages for regions all over the world. According to Baker Hughes (2009) the average number of active drilling rigs in Oklahoma for 2008 was 200; up from the 2007 average of 188. This increase in the annual average does not re- flect the recent drop that has occurred due to dramati- cally lower energy prices. Since the Oklahoma rig count peaked at 219 in the week of September 5th, the number of working rigs has fallen 27% to 159. This decline will undoubtedly continue into 2009 and end a three-year run of increasing activity (Figure 1). The price of natural gas is by far the most important factor controlling drilling activity in Oklahoma, with major price fluctuations having a close correlation with drilling activity (Figure 2). The average 2008 wellhead gas price in Oklahoma will be very close to $7.45 per thou- sand cubic feet (MCF) (Soltani, 2008), which is an all-time record. However, this is due to prices in the first half of the year. Since July, when Henry Hub prices peaked be- tween $13 and $14 per MCF, the price of natural gas has fallen dramatically, with year-end prices hovering between $5 and $6 per MCF. It should be noted that wellhead prices in Oklahoma historically average $1.32 below those of Henry Hub (Soltani, 2008). The long-term impact on drilling activity that this lat- est round of lower natural gas prices will have in Okla- homa is impossible to predict, but much will depend on the severity of winter weather. Of even greater concern than the number of active rigs is the fact that more than one quarter of the State’s gas production comes from wells that are less than a year old (Boyd, 2005). This makes it likely that, in addition to a drop in drilling activity, 2009 will also see a significant decrease in gas production and associated gross production tax revenue. Total completions in 2008 were 62% gas and 31% oil (Figure 3). Dry holes, which comprise all plugged and abandoned wells, including those junked for mechanical OKLAHOMA 2008 DRILLING HIGHLIGHTS by Dan T. Boyd, Oklahoma Geological Survey Figure 1. Oklahoma Average Rotary Drilling Rig Count, from 2000 through 2008. Data from Baker Hughes, 2009.
Transcript of OKLAHOMA2008D I saw it in the SHALE SHAKER ” March-April2009/SHALE SHAKER 1 This article is a...
“I saw it in the SHALE SHAKER” March-April 2009/ SHALE SHAKER 1
This article is a summary of 2008 Oklahoma drillingactivity and highlights results that became public byJanuary 1, 2009. Significant results registered after thisdate will appear in next year’s summary. Except wherenoted, all data were supplied online by PetroleumInformation/Dwights LLC dba IHS Energy Group, all rightsreserved. Without this excellent database this report couldnot have been completed. Cartography is by RussellStandridge of the Oklahoma Geological Survey.
General Activity
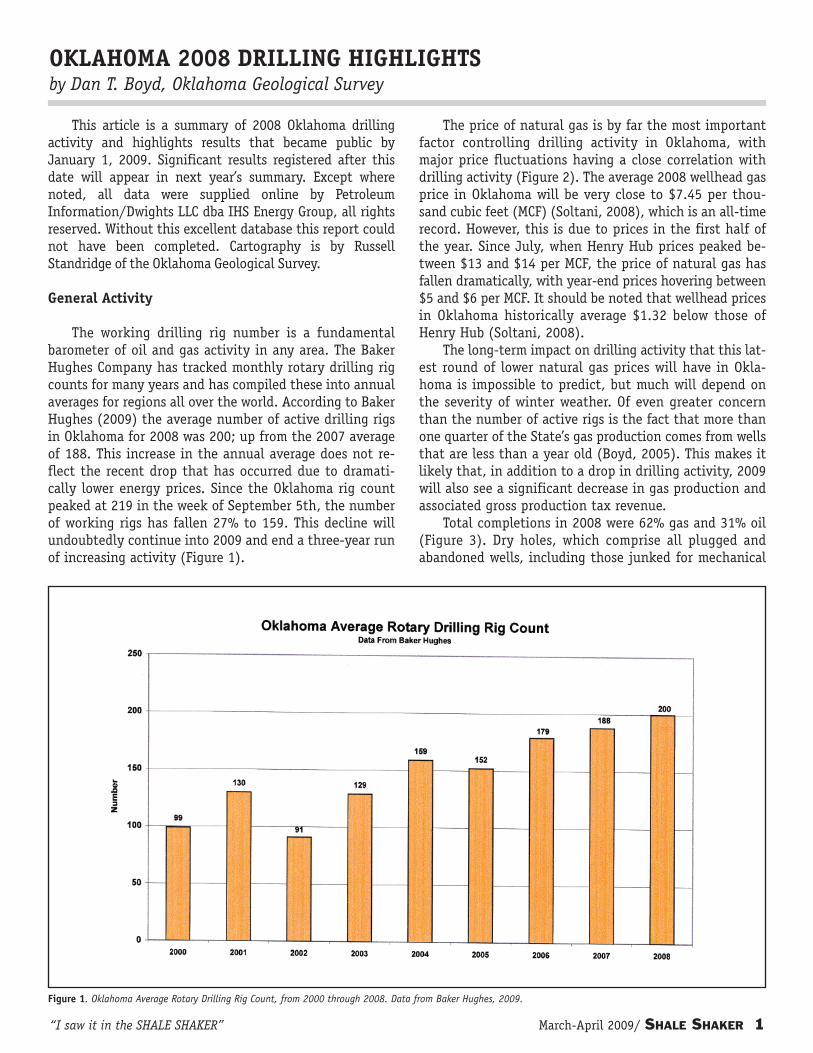
The working drilling rig number is a fundamentalbarometer of oil and gas activity in any area. The BakerHughes Company has tracked monthly rotary drilling rigcounts for many years and has compiled these into annualaverages for regions all over the world. According to BakerHughes (2009) the average number of active drilling rigsin Oklahoma for 2008 was 200; up from the 2007 averageof 188. This increase in the annual average does not re-flect the recent drop that has occurred due to dramati-cally lower energy prices. Since the Oklahoma rig countpeaked at 219 in the week of September 5th, the numberof working rigs has fallen 27% to 159. This decline willundoubtedly continue into 2009 and end a three-year runof increasing activity (Figure 1).
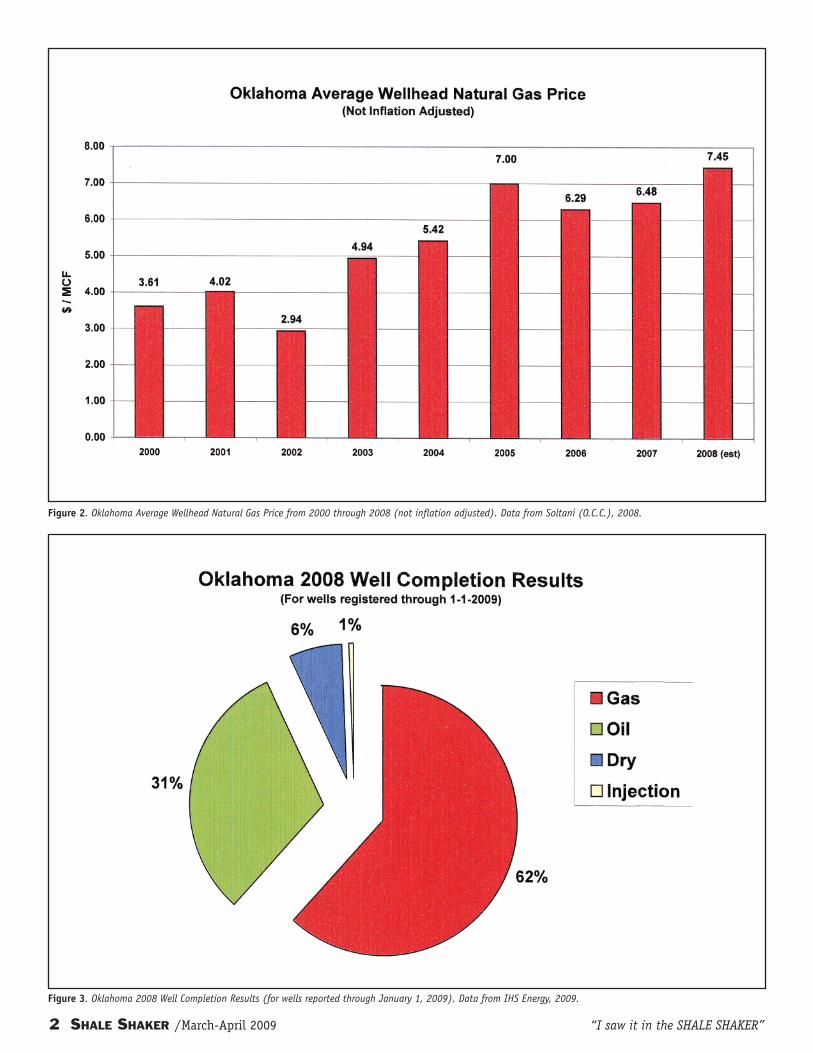
The price of natural gas is by far the most importantfactor controlling drilling activity in Oklahoma, withmajor price fluctuations having a close correlation withdrilling activity (Figure 2). The average 2008 wellhead gasprice in Oklahoma will be very close to $7.45 per thou-sand cubic feet (MCF) (Soltani, 2008), which is an all-timerecord. However, this is due to prices in the first half ofthe year. Since July, when Henry Hub prices peaked be-tween $13 and $14 per MCF, the price of natural gas hasfallen dramatically, with year-end prices hovering between$5 and $6 per MCF. It should be noted that wellhead pricesin Oklahoma historically average $1.32 below those ofHenry Hub (Soltani, 2008).
The long-term impact on drilling activity that this lat-est round of lower natural gas prices will have in Okla-homa is impossible to predict, but much will depend onthe severity of winter weather. Of even greater concernthan the number of active rigs is the fact that more thanone quarter of the State’s gas production comes from wellsthat are less than a year old (Boyd, 2005). This makes itlikely that, in addition to a drop in drilling activity, 2009will also see a significant decrease in gas production andassociated gross production tax revenue.
Total completions in 2008 were 62% gas and 31% oil(Figure 3). Dry holes, which comprise all plugged andabandoned wells, including those junked for mechanical
OKLAHOMA 2008 DRILLING HIGHLIGHTSby Dan T. Boyd, Oklahoma Geological Survey
Figure 1. Oklahoma Average Rotary Drilling Rig Count, from 2000 through 2008. Data from Baker Hughes, 2009.
2 SHALE SHAKER /March-April 2009 “I saw it in the SHALE SHAKER”
Figure 2. Oklahoma Average Wellhead Natural Gas Price from 2000 through 2008 (not inflation adjusted). Data from Soltani (O.C.C.), 2008.
Figure 3. Oklahoma 2008 Well Completion Results (for wells reported through January 1, 2009). Data from IHS Energy, 2009.
“I saw it in the SHALE SHAKER” March-April 2009/ SHALE SHAKER 3
reasons, accounted for only 6% of drilling in 2008. Thisoverall 94% success rate shows that drilling for both oiland gas in Oklahoma continues to be overwhelmingly de-velopmental. Although still far fewer than gas, oil com-pletion numbers did increase over the last year due torecord prices in the first part of the year. However, yearsof gas-focused drilling has brought a fundamental shift inhydrocarbon production in the State from oil to gas. Thistrend continues, with the barrel of oil equivalent produc-
tion now standing at 82% natural gas.Hundreds of companies drilled wells in 2008, but
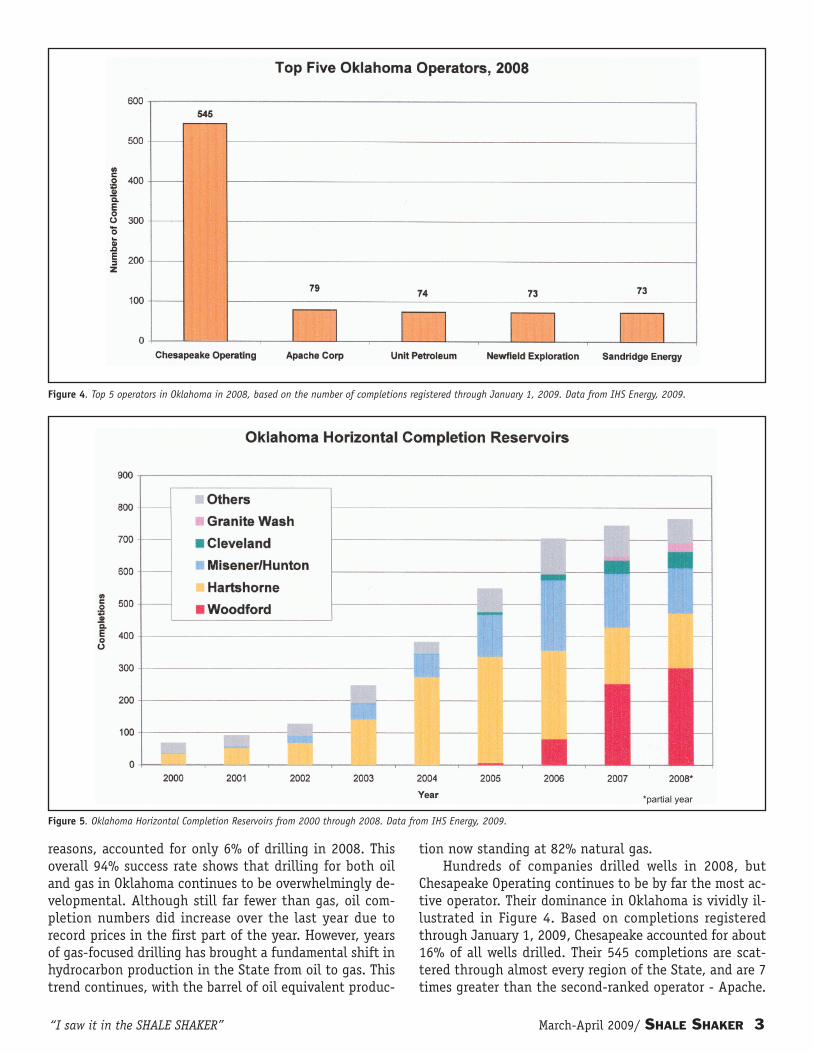
Chesapeake Operating continues to be by far the most ac-tive operator. Their dominance in Oklahoma is vividly il-lustrated in Figure 4. Based on completions registeredthrough January 1, 2009, Chesapeake accounted for about16% of all wells drilled. Their 545 completions are scat-tered through almost every region of the State, and are 7times greater than the second-ranked operator - Apache.
Figure 4. Top 5 operators in Oklahoma in 2008, based on the number of completions registered through January 1, 2009. Data from IHS Energy, 2009.
Figure 5. Oklahoma Horizontal Completion Reservoirs from 2000 through 2008. Data from IHS Energy, 2009.
*partial year

4 SHALE SHAKER /March-April 2009 “I saw it in the SHALE SHAKER”
In 2008 Chesapeake drilled more wells in Oklahoma thanthe next eight operators combined.
Coal and shale gas drilling in 2008 were most signifi-cant in the eastern part of the State, while conventionalreservoirs were more concentrated in the western part.Horizontal drilling is by far the most importantdrilling/completion technique to be recently applied inOklahoma. Its use has made formerly unproductive areasand reservoirs profitable and revitalized reservoirs thathave been producing for decades. It now represents 22%of State drilling activity and is a common thread runningthrough many of the notable wells listed here. In additionto increased wellbore exposure to low permeability reser-voirs, horizontal drilling is useful in dewatering dualporosity oil reservoirs. Dewatering is the process by whichreservoir pressure is reduced in fields with natural watersupport through aggressive water production. This pro-duction triggers associated gas expansion in poorer(unswept) parts of the reservoir, forcing oil into the nat-ural and/or induced fracture system and ultimately intothe wellbore.
Because of reporting delays, the 2008 horizontaldrilling shown in Figure 5 is grossly under-represented,with the final annual completion total, mostly driven bythe Woodford, likely to go off the vertical scale. Other ac-tive horizontal plays include the Hartshorne coalbedmethane in the Arkoma Basin, where El Paso E & P wasthe most active, and the Misener/Hunton, which is scat-tered throughout the State. Hunton horizontal drillingtends to be focused on de-watering in and around LincolnCounty, and here New Dominion was the most active op-
erator. Activity in both of these horizontal plays waned in2008, despite high oil and gas prices through most of theyear. However, the Cleveland horizontal play (see Well #2),which is located mostly in Ellis County, and the DesMoines Granite Wash horizontal play (see Well #3), in thedeep Anadarko Basin in Washita County, both picked uppace in 2008. The Cleveland play has many operators, butthe Granite Wash is being lead by Chesapeake, who com-pleted 25 of the 27 wells registered thus far for 2008.
Coalbed Methane
Last year’s most active play, which is now in secondplace behind the Woodford, is coalbed methane (CBM)(Figure 6). To contrast these top two plays, their drillingactivity and production will be shown together. CBM wellsin Oklahoma are located in two geologic regions: theArkoma Basin and the Cherokee Platform (Figure 7).About 2/3rds of CBM drilling in 2008 targeted theHartshorne coal in the Arkoma Basin as horizontal wells.A variety of coals produce on the Cherokee Platform, butthe most popular in 2008 were the Mulky and Riverton.These coals are completed in vertical wells, and in thisarea CEP Midcontinent and Canaan Resources were themost active operators (IHS Energy, 2009).
There are now about 6,000 completed CBM wells inOklahoma, of which 289 have been registered thus far for2008 (IHS Energy, 2009). The nearly 50% drop in CBM ac-tivity that was seen between 2006 and 2007 seems to havebeen arrested, with 2008 CBM drilling projected to beequal or only slightly below that of 2007 (Figure 6). As in
Figure 6. Oklahoma Coalbed Methane and Woodford Completions from 2000 through 2008. Data from IHS Energy, 2009.
“I saw it in the SHALE SHAKER” March-April 2009/ SHALE SHAKER 5
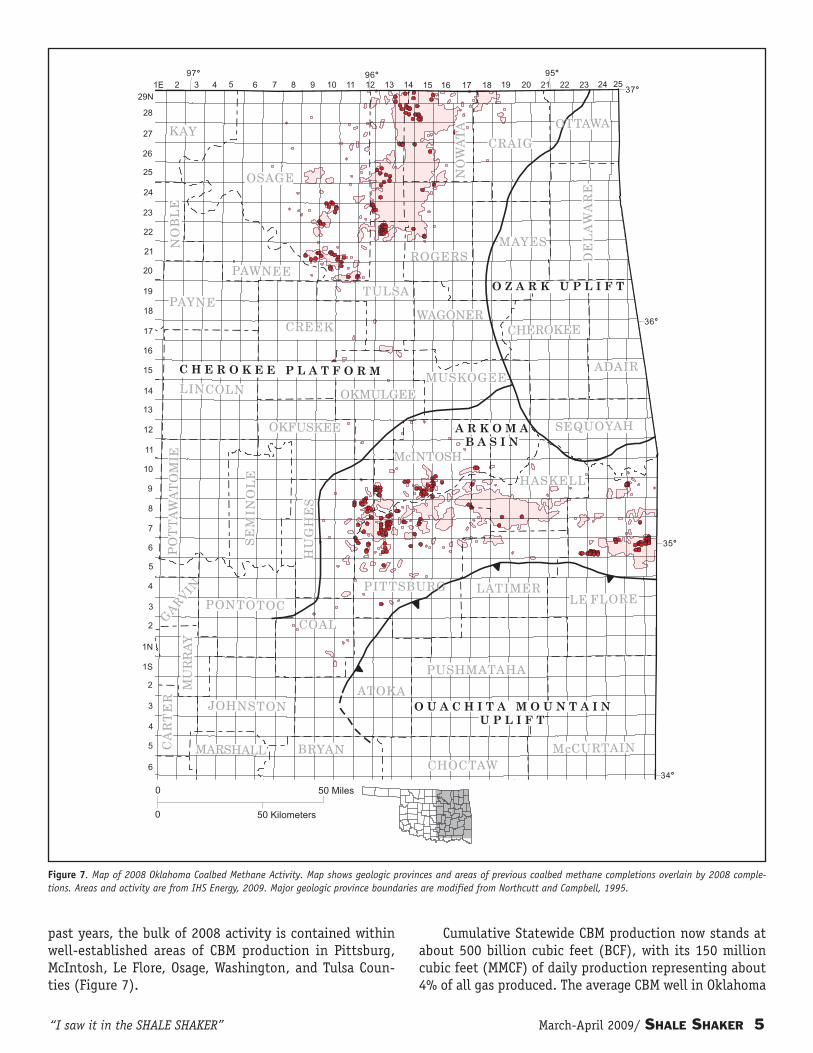
past years, the bulk of 2008 activity is contained withinwell-established areas of CBM production in Pittsburg,McIntosh, Le Flore, Osage, Washington, and Tulsa Coun-ties (Figure 7).
Cumulative Statewide CBM production now stands atabout 500 billion cubic feet (BCF), with its 150 millioncubic feet (MMCF) of daily production representing about4% of all gas produced. The average CBM well in Oklahoma
Figure 7. Map of 2008 Oklahoma Coalbed Methane Activity. Map shows geologic provinces and areas of previous coalbed methane completions overlain by 2008 comple-tions. Areas and activity are from IHS Energy, 2009. Major geologic province boundaries are modified from Northcutt and Campbell, 1995.
6 SHALE SHAKER /March-April 2009 “I saw it in the SHALE SHAKER”
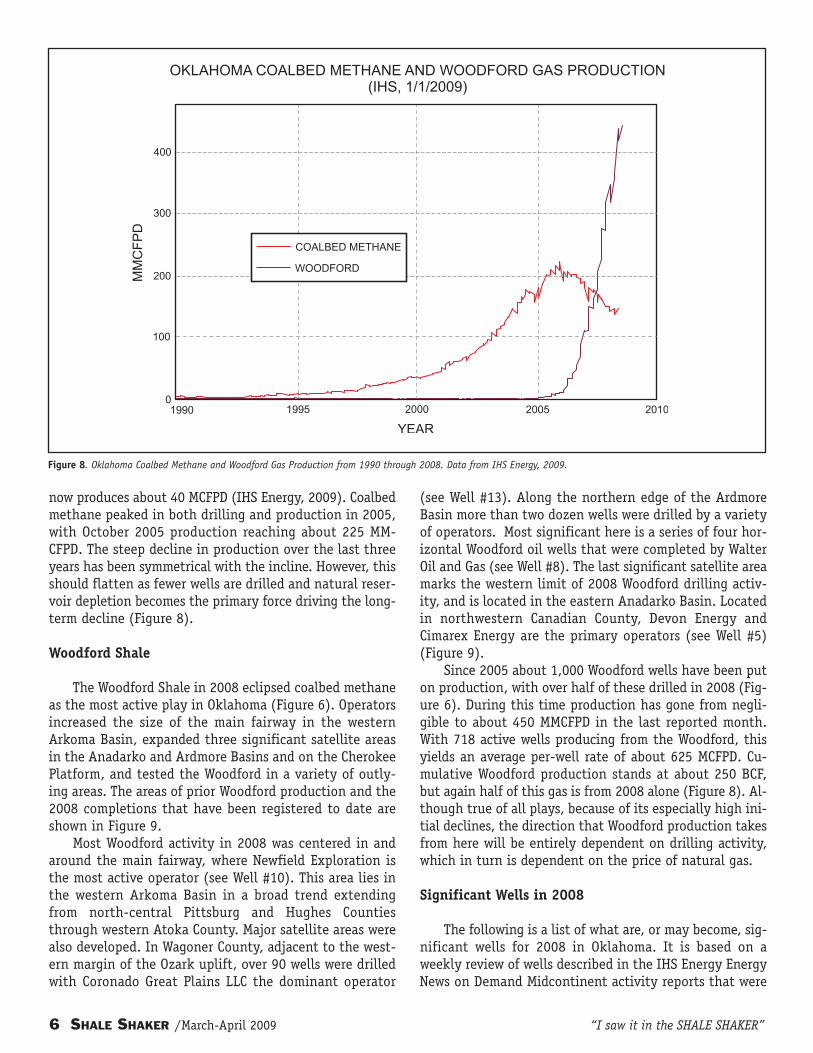
Figure 8. Oklahoma Coalbed Methane and Woodford Gas Production from 1990 through 2008. Data from IHS Energy, 2009.
now produces about 40 MCFPD (IHS Energy, 2009). Coalbedmethane peaked in both drilling and production in 2005,with October 2005 production reaching about 225 MM-CFPD. The steep decline in production over the last threeyears has been symmetrical with the incline. However, thisshould flatten as fewer wells are drilled and natural reser-voir depletion becomes the primary force driving the long-term decline (Figure 8).
Woodford Shale
The Woodford Shale in 2008 eclipsed coalbed methaneas the most active play in Oklahoma (Figure 6). Operatorsincreased the size of the main fairway in the westernArkoma Basin, expanded three significant satellite areasin the Anadarko and Ardmore Basins and on the CherokeePlatform, and tested the Woodford in a variety of outly-ing areas. The areas of prior Woodford production and the2008 completions that have been registered to date areshown in Figure 9.
Most Woodford activity in 2008 was centered in andaround the main fairway, where Newfield Exploration isthe most active operator (see Well #10). This area lies inthe western Arkoma Basin in a broad trend extendingfrom north-central Pittsburg and Hughes Countiesthrough western Atoka County. Major satellite areas werealso developed. In Wagoner County, adjacent to the west-ern margin of the Ozark uplift, over 90 wells were drilledwith Coronado Great Plains LLC the dominant operator
(see Well #13). Along the northern edge of the ArdmoreBasin more than two dozen wells were drilled by a varietyof operators. Most significant here is a series of four hor-izontal Woodford oil wells that were completed by WalterOil and Gas (see Well #8). The last significant satellite areamarks the western limit of 2008 Woodford drilling activ-ity, and is located in the eastern Anadarko Basin. Locatedin northwestern Canadian County, Devon Energy andCimarex Energy are the primary operators (see Well #5)(Figure 9).
Since 2005 about 1,000 Woodford wells have been puton production, with over half of these drilled in 2008 (Fig-ure 6). During this time production has gone from negli-gible to about 450 MMCFPD in the last reported month.With 718 active wells producing from the Woodford, thisyields an average per-well rate of about 625 MCFPD. Cu-mulative Woodford production stands at about 250 BCF,but again half of this gas is from 2008 alone (Figure 8). Al-though true of all plays, because of its especially high ini-tial declines, the direction that Woodford production takesfrom here will be entirely dependent on drilling activity,which in turn is dependent on the price of natural gas.
Significant Wells in 2008
The following is a list of what are, or may become, sig-nificant wells for 2008 in Oklahoma. It is based on aweekly review of wells described in the IHS Energy EnergyNews on Demand Midcontinent activity reports that were

“I saw it in the SHALE SHAKER” March-April 2009/ SHALE SHAKER 7
Figure 9. Map of 2008 Oklahoma Woodford Drilling Activity. Map shows geologic provinces and areas of previous Woodford completions overlain by 2008 completions. Areasand activity are from IHS Energy, 2009. Major geologic province boundaries are modified from Northcutt and Campbell, 1995.
released online throughout 2008. An initial list of 135possibilities compiled from these publications was distilledto a total of 13 potentially significant wells. Such a list-ing is necessarily subjective, and may miss wells thatcould eventually become noteworthy. Due to confiden-tiality issues, wells that may be notable for technical rea-sons will probably be missed. For instance, those thatconfirm some new type of trapping style or proved thebenefit of a new completion technique will be difficult toidentify until information is disseminated years later.
The wells shown here are of two general classes; thosethat establish significant production more than one milefrom existing production in the same reservoir, which isthe standard to be considered a discovery, and those that
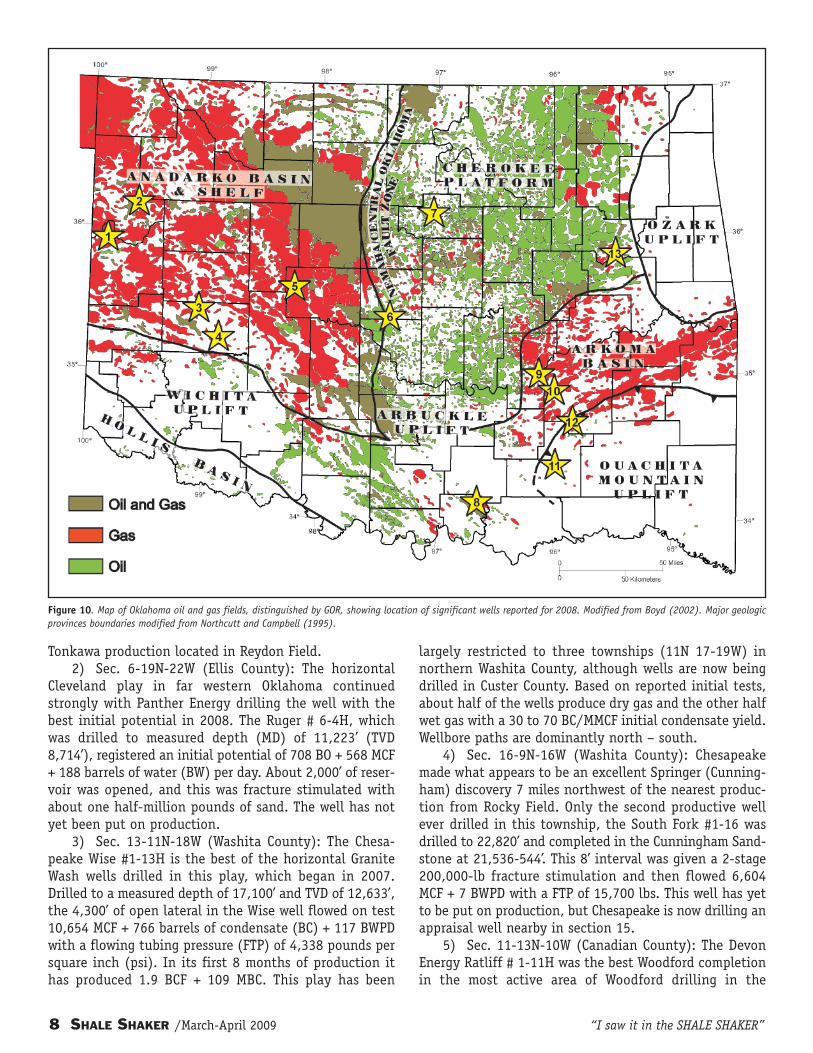
are notable for other reasons. The latter include rank wild-cats, major play expansions, or new production typesand/or completion techniques. The following are wells re-ported as completed in 2008 that are considered signifi-cant (Figure 10).
1) Sec. 28-17N-25W (Roger Mills): GHK completedthe first in a 7-well program of horizontal Tonkawa testsin Grand South Field with their Bachmann #1-28. This wellhad an initial flowing potential of 150 barrels of oil (BO)+ 436 MCFPD with no water reported, but has yet to go onproduction. Although lateral displacement is over 3,000’,only 1,300’ of reservoir was completed from a true verti-cal depth (TVD) of 8,156’. This multi-well program is lo-cated 12 miles northeast of the nearest horizontal
8 SHALE SHAKER /March-April 2009 “I saw it in the SHALE SHAKER”
Figure 10. Map of Oklahoma oil and gas fields, distinguished by GOR, showing location of significant wells reported for 2008. Modified from Boyd (2002). Major geologicprovinces boundaries modified from Northcutt and Campbell (1995).
Tonkawa production located in Reydon Field.2) Sec. 6-19N-22W (Ellis County): The horizontal
Cleveland play in far western Oklahoma continuedstrongly with Panther Energy drilling the well with thebest initial potential in 2008. The Ruger # 6-4H, whichwas drilled to measured depth (MD) of 11,223’ (TVD8,714’), registered an initial potential of 708 BO + 568 MCF+ 188 barrels of water (BW) per day. About 2,000’ of reser-voir was opened, and this was fracture stimulated withabout one half-million pounds of sand. The well has notyet been put on production.
3) Sec. 13-11N-18W (Washita County): The Chesa-peake Wise #1-13H is the best of the horizontal GraniteWash wells drilled in this play, which began in 2007.Drilled to a measured depth of 17,100’ and TVD of 12,633’,the 4,300’ of open lateral in the Wise well flowed on test10,654 MCF + 766 barrels of condensate (BC) + 117 BWPDwith a flowing tubing pressure (FTP) of 4,338 pounds persquare inch (psi). In its first 8 months of production ithas produced 1.9 BCF + 109 MBC. This play has been
largely restricted to three townships (11N 17-19W) innorthern Washita County, although wells are now beingdrilled in Custer County. Based on reported initial tests,about half of the wells produce dry gas and the other halfwet gas with a 30 to 70 BC/MMCF initial condensate yield.Wellbore paths are dominantly north – south.
4) Sec. 16-9N-16W (Washita County): Chesapeakemade what appears to be an excellent Springer (Cunning-ham) discovery 7 miles northwest of the nearest produc-tion from Rocky Field. Only the second productive wellever drilled in this township, the South Fork #1-16 wasdrilled to 22,820’ and completed in the Cunningham Sand-stone at 21,536-544’. This 8’ interval was given a 2-stage200,000-lb fracture stimulation and then flowed 6,604MCF + 7 BWPD with a FTP of 15,700 lbs. This well has yetto be put on production, but Chesapeake is now drilling anappraisal well nearby in section 15.
5) Sec. 11-13N-10W (Canadian County): The DevonEnergy Ratliff # 1-11H was the best Woodford completionin the most active area of Woodford drilling in the
“I saw it in the SHALE SHAKER” March-April 2009/ SHALE SHAKER 9
Anadarko Basin. This area in northwestern CanadianCounty, which was discovered by Devon the previous yearwith their Hancock discovery well drilled in sec. 36-13N-10W (see last year’s report), saw 14 wells completed in2008. The Ratliff was drilled to a TVD of 12,826’, and withabout 3,700’ of Woodford open, had an initial potentialof 6,601 MCF + 105 BO + 466 BW per day after a four-stage1.4 million pound fracture stimulation. In its first fourmonths of production the well produced about 500 MMCFand 7,500 BO.
6) Sec. 30-11N-2W (Oklahoma County): In their on-going dewatering project of the Arbuckle in Oklahoma CityField, in 2008 New Dominion completed 4 new wells. Withup to 8 laterals drilled from a single surface location, thebest initial potential this year came from the 3-30H Okla-homa City, which pumped on test 202 BO + 1,843 MCF +14,166 BW per day. In its first full month this well pro-duced 35,688 BO + 138 MMCF. Arbuckle production in thefield is rising steeply, with the last complete publishedmonth averaging a rate of about 1,700 BO + 10 MMCF perday. Incremental production from New Dominion’s dewa-tering operation stands at about 1.1 million barrels(MMBO) + 5.5 BCF, with water production/injection atabout 130,000 barrels per day.
7) Sec. 14-19N-2E (Payne County): In a clever use ofhorizontal drilling technology, EEC Inc. drilled an other-wise inaccessible Skinner Sandstone prospect under theOklahoma State University campus. The Stillwater #1-14Hbecame the first horizontal Skinner completion in Okla-homa, with a TVD of 4,037’ and a MD of 7,256’. With about2,700’ of lateral open the well had an initial potential of450 barrels of 34 API gravity crude, 230 MCF and no water.EEC is now drilling a second well in the same section.
8) Sec. 14-5S-6E (Marshall County): Drilled in 2007,but not registering until 2008, Walter O&G extended Ard-more Basin Woodford production to the eastern edge ofMarshall County with the drilling of their Porter #1-14.With a drilled depth of 7,975’ and a TVD of 5,067’, the wellinitially tested, from a 2,400’ lateral in the Woodford,1,110 MCF + 36 BO + 150 BW per day. In its first 11 monthsit produced 307 MMCF + 10 MBO, and in its last month av-eraged 500 MCF + 7 BO per day. Since the drilling of thePorter, 5 additional horizontal Woodford wells have beendrilled within 2 miles.
9) Sec. 1-6N-11E (Hughes County): Continental Re-sources registered the second highest initial potential fora Woodford gas well with the completion of their Blevins#1-1H. This well flowed 10,755 MCF + 2,284 BW per day ontest with an FTP of 1,450 psi. Drilled to a depth of 10,640’(TVD: 6,103’) its 3,747’ lateral was given an 8-stage frac-ture stimulation in which over 2.5 million pounds of sandwere used. Behind only the Newfield Sherman Ellis #4H-
22, which had an initial potential of 11.2 MMCFPD and isthe best well in the play thus far with over 3 BCF of pro-duction, the Blevins has not yet been put on production.
10) Sec. 9-5N-12E (Pittsburg County): Newfield Explo-ration remains the most active operator and driller of hor-izontal Woodford wells. Their three Elms wells (#2H4,#3H4, and #4H4), which have bottom-hole locations insection 4 to the north, demonstrate the technique ofdrilling multiple wells from a single surface location. Eachof these wells had initial potentials that ranged from 3 to4 MMCFPD coming from 3,900 to 4,500’ laterals. Each wascompleted with 8-stage fracture stimulations. At the endof 2008 Newfield was producing 209 Woodford wells, whichare almost all within the main fairway located in the west-ern part of the Arkoma Basin. In their last full month ofproduction these were making about 167 MMCFPD, whichis an average rate of about 800 MCFPD per well.
11) Sec. 18-2S-13E (Atoka County): Longfellow Energycompleted their Thompson #1-18 as a discovery in the BigFork chert. This rank wildcat is 11 miles from the nearestBig Fork production and 4.5 miles from uneconomic oilproduction from an unnamed 400’ reservoir in PotapoCreek Field. The Thompson is an 1,800’ deepening of a7,656’ dry hole drilled by Arco in 1992. Three Big Fork in-tervals were perforated and fracture stimulated between7,446’ to 8,800’. These had initial potentials of 2,100 MCF,5,045 MCF, and 1,600 MCF per day. Longfellow has alreadydrilled two offsets in sections 7 and 8 in the same town-ship, and at last report both were waiting to be com-pleted.
12) Sec. 32-3N-14E (Pittsburg County): Samson Re-sources completed the first in a program of three hori-zontal wells targeting the Wapanucka about 30 milesnortheast of the nearest horizontal Wapanucka. TheGladys Rose # 1H-5 was drilled to a total depth of 13,100’(10,388’ TVD) and after a 340,000-lb fracture stimulationtested 1.95 MMCF +17 BW per day from a lateral extend-ing about 2,000’ into the adjoining section (5-2N-14E).This well produced an average rate of 2.2 MMCFPD in itsfirst month. At last report Samson was drilling an ap-praisal well to the southwest in section 7-2N-14E.
13) Sec. 20-16N-18E (Wagoner County): In a major ex-pansion of the Woodford gas play, Coronado Great PlainsLLC completed 58 shallow (~1,100’) vertical wells in east-ern Wagoner County. Based on its initial potential, theirGlass #20-2 is the best to date. On test this well pumped526 MCF + 50 BWPD from a perforated interval extendingfrom 1048-74’. Coronado does not appear to fracture stim-ulate any of these wells, only cleaning perforations witha light acid job. The average initial potential for the wellsdrilled thus far is less than 100 MCFPD, and none have yetbeen put on production.
10 SHALE SHAKER /March-April 2009 “I saw it in the SHALE SHAKER”
ABOUT THE AUTHOR
DAN BOYD
Dan Boyd is a petroleum geologist with the Oklahoma Geological Survey, where he has been employed since2001. Dan received his Master of Science degree in geology from the University of Arizona in 1978. He spent thefirst 22 years of his career as an exploration and development geologist in the petroleum industry. From 1978through 1991 he worked on a variety of areas in the United States from Houston, Dallas, and Oklahoma City forMobil Oil and Union Texas Petroleum. In 1991 he moved overseas, working in Karachi Pakistan for four years andJakarta Indonesia for the following four. He returned with his family to the U.S. in 1999 with Arco (the successorto Union Texas) where, until Arco's sale to BP, he worked the offshore Philippines from Plano, Texas.
Since joining the OGS staff Dan has presented and published several reports on the history, status, and futureoutlook of the oil and gas industry in Oklahoma. He chaired the 2002 Symposium on Cherokee Reservoirs in theSouthern Midcontinent (OGS Circular 108), and prepared and presented a workshop on the Booch gas play in south-eastern Oklahoma (Special Publication 2005-1). His most recent study of oil reservoirs and recovery efficiencies(Shale Shaker May/June, 2008) demonstrates that large volumes of producible oil remain in the ground and thata major barrier to finding and producing this oil is shortcomings in State oil and gas data. Dan serves on the boardof Energy Libraries Online (ELO) from a conviction that the long term success of the Oklahoma industry dependson improving both the completeness and accessibility of State oil and gas data.
REFERENCES CITED
(The Oklahoma City Geological Society(OCGS), and the Shale Shaker EditorialBoard, are not responsible for omissionsof references cited in the text.)
Baker Hughes, 2009, 2008 AverageRotary Drilling Rig Count, Accessed at:http://www.bakerhughes.com/in-vestor/rig/rig_na.htm
Boyd, D.T., 2002, Map of Oklahomaoil and gas fields (distinguished by GORand conventional gas vs. coalbedmethane: Oklahoma Geological SurveyMap GM-36.
Boyd, D. T., 2005, Oklahoma oil andgas production: Its components andlong-term outlook: Oklahoma GeologyNotes, v. 65, no. 1, p. 4-23.
IHS Energy, 2009, Well Data suppliedby Petroleum Information/Dwights LLCdba IHS Energy Group, January 1, 2009.all rights reserved.
Northcutt, R. A.; and Campbell, J.A., 1995, Geologic provinces of Okla-homa: Oklahoma Geological Survey Open-File Report 5-95.
Soltani, Cameron, 2008 Oklahoma Cor-poration Commission, Oil and gas informa-tion: Oklahoma Corporation Commission:2006 Report on Crude Oil and Natural GasActivity within the State of Oklahoma; ac-cessed at: http://www.occ.state.ok.us/Di-visions/OG/AnnualReports/2005%20OIL%20AND%20GAS%20REPORT.pdf, partial 2008data from personal communication, De-cember 16, 2008.