Iowa Regents’ Hispanic Institute Valladolid, Spain Summer 2012

Oklahoma State Regents Meeting
January 30, 2014
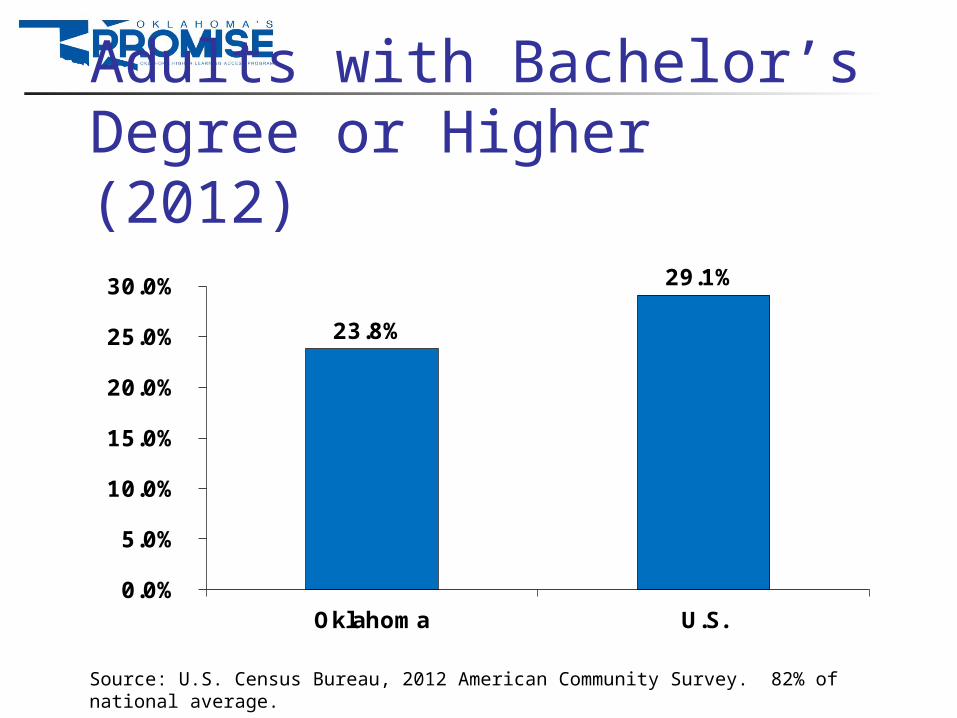
Adults with Bachelor’s Degree or Higher (2012)
23.8%
29.1%
0.0%
5.0%
10.0%
15.0%
20.0%
25.0%
30.0%
Oklahoma U.S.
Source: U.S. Census Bureau, 2012 American Community Survey. 82% of national average.
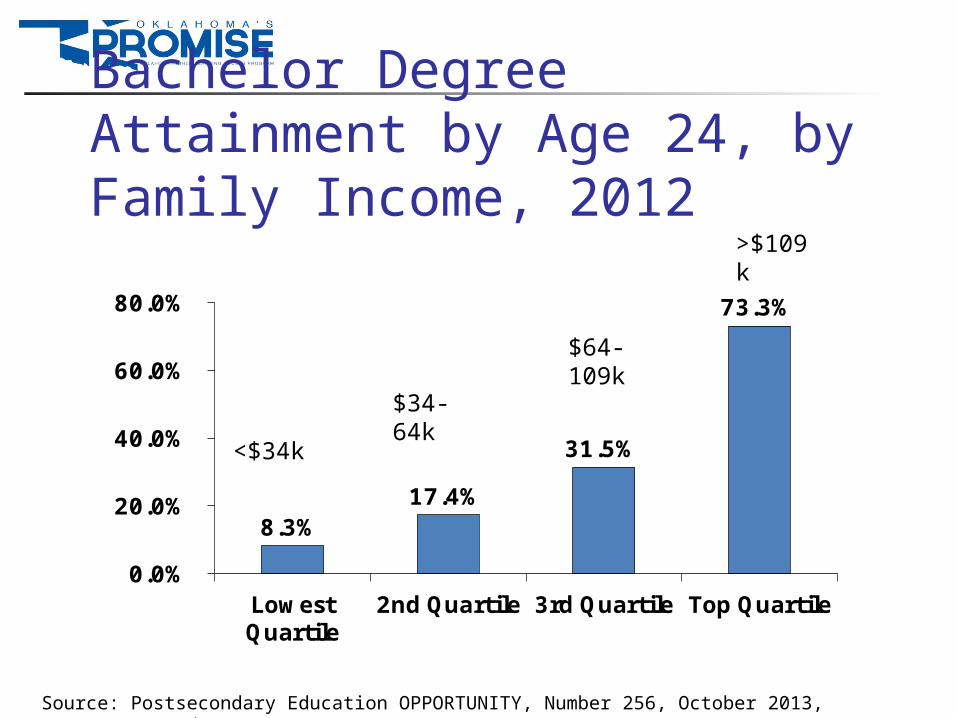
Bachelor Degree Attainment by Age 24, by Family Income, 2012
8.3%17.4%
31.5%
73.3%
0.0%
20.0%
40.0%
60.0%
80.0%
LowestQuartile
2nd Quartile 3rd Quartile Top Quartile
Source: Postsecondary Education OPPORTUNITY, Number 256, October 2013, www.postsecondary.org.
<$34k
$34-64k
$64-109k
>$109k
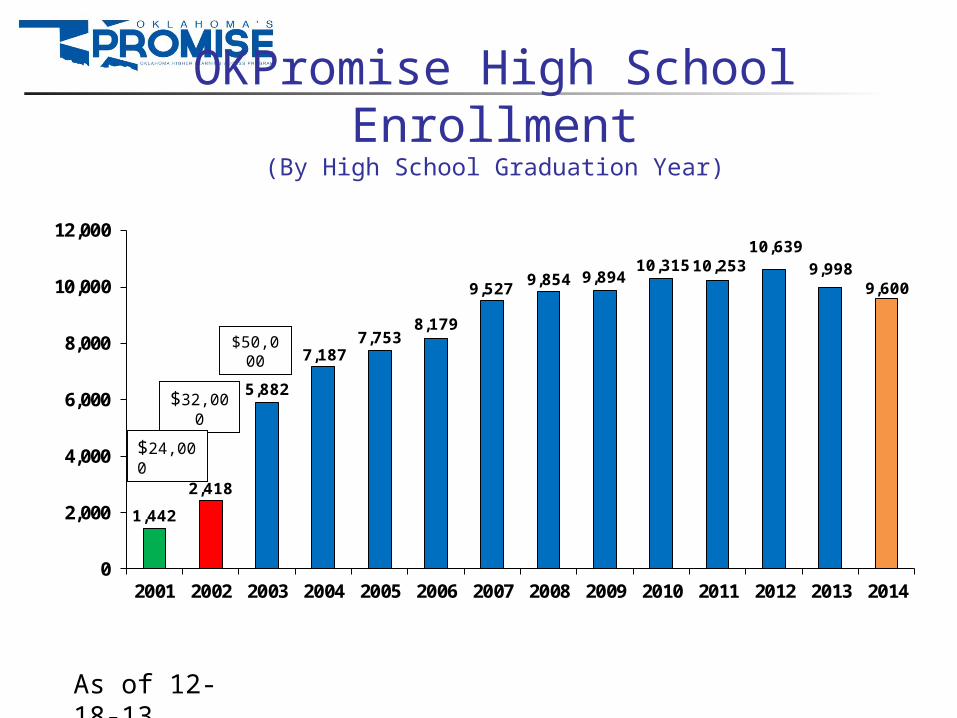
OKPromise High School Enrollment
(By High School Graduation Year)
1,442
2,418
5,882
7,1877,753
8,179
9,5279,854 9,894
10,31510,25310,639
9,9989,600
0
2,000
4,000
6,000
8,000
10,000
12,000
2001 2002 2003 2004 2005 2006 2007 2008 2009 2010 2011 2012 2013 2014
$32,000
$50,000
$24,000
As of 12-18-13

Estimated Percent of Oklahoma Families with Total Income Under
$50,000
61% 60%58% 58%
56%54%
52%
48%46%
48% 48%46% 45%
40%
50%
60%
70%
200
0
200
1
200
2
200
3
200
4
200
5
200
6
200
7
200
8
200
9
201
0
201
1
201
2
Source: US Census Bureau, 2000 Census, American Community Survey-2001-2012
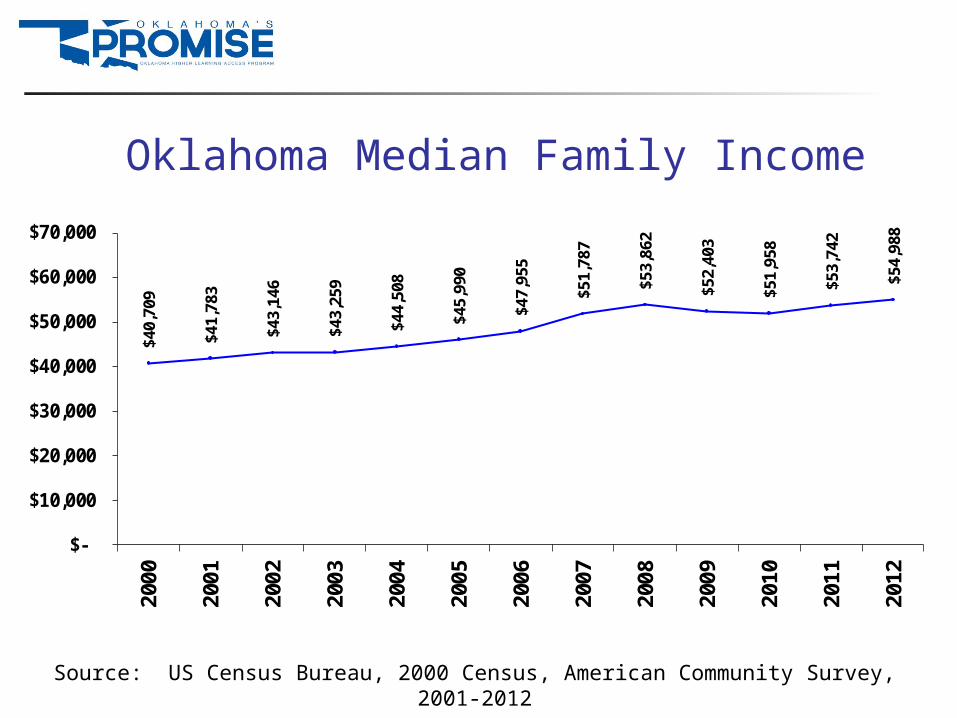
Oklahoma Median Family Income$4
0,70
9
$41,
783
$43,
146
$43,
259
$44,
508
$45,
990
$47,
955
$51,
787
$53,
862
$52,
403
$51,
958
$53,
742
$54,
988
$-
$10,000
$20,000
$30,000
$40,000
$50,000
$60,000
$70,000
2000
2001
2002
2003
2004
2005
2006
2007
2008
2009
2010
2011
2012
Source: US Census Bureau, 2000 Census, American Community Survey, 2001-2012

Inflation Impact on $50,000 Income Limit
$50,000 in year 2000 dollars equivalent to about $67,650 in year 2013 dollars*
$50,000 in 2013 equivalent to about $37,000 in year 2000 dollars*
*based on national consumer price index; 35.3% rate of inflation from 2000 to 2013

Projections of Oklahoma High School Graduates
37,300
41,650
-
10,000
20,000
30,000
40,000
2014 2015 2016 2017 2018 2019 2020 2021 2022
Sources: Ok. State Regents; OK SDE; USDE National Center for Education Statistics; Western Interstate Commission for Higher Education (WICHE).
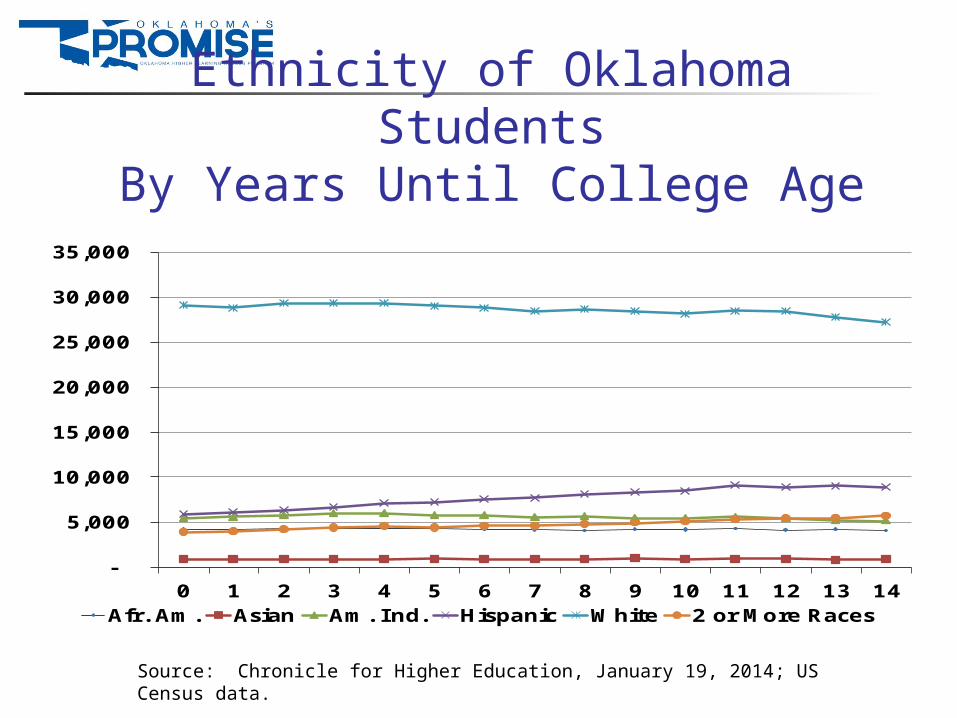
Ethnicity of Oklahoma StudentsBy Years Until College Age
-
5,000
10,000
15,000
20,000
25,000
30,000
35,000
0 1 2 3 4 5 6 7 8 9 10 11 12 13 14Afr. Am. Asian Am. Ind. Hispanic White 2 or More Races
Source: Chronicle for Higher Education, January 19, 2014; US Census data.

High School Requirement Completion Rates
67.2%71.7% 70.3% 69.2% 69.4%
66.4% 66.7% 65.4% 65.7% 64.8% 64.5% 64.8%
2002
2003
2004
2005
2006
2007
2008
2009
2010
2011
2012
2013
$32,000$50,000
As of 12-18-13

High School Students Completing OKPromise
Requirements(by Grad Year)
884
1,624
4,216
5,0515,365
5,673
6,3226,576 6,470
6,780 6,643 6,8666,476
0
2,000
4,000
6,000
8,000
2001 2002 2003 2004 2005 2006 2007 2008 2009 2010 2011 2012 2013
$32,000
$50,000
$24,000
As of 1-2-14

Ethnicity – 2013 HS Completers
52%
13%10% 10%
4% 4%7%
57%
17%
10% 10%
2% 4%0%
0%
25%
50%
75%W
hite
Am
er. I
nd
.
Afr
ican
Am
er.
His
pan
ic
Asi
an
mu
lti-r
acia
l
n/a
OKPromise All HS Seniors
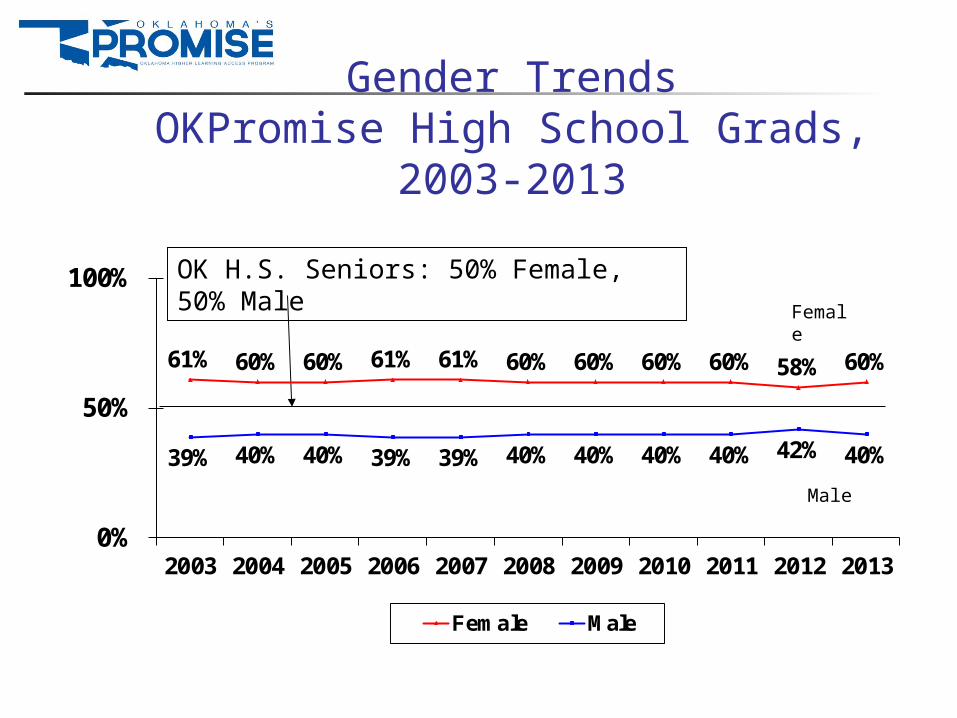
Gender TrendsOKPromise High School Grads, 2003-
2013
61% 60% 60% 61% 61% 60% 60% 60% 60% 58% 60%
39% 40% 40% 39% 39% 40% 40% 40% 40% 42% 40%
0%
50%
100%
2003 2004 2005 2006 2007 2008 2009 2010 2011 2012 2013
Female Male
OK H.S. Seniors: 50% Female, 50% Male
Female
Male

Geographic Distribution Trends OKPromise High School Grads, 2005-
2013
69% 66% 64% 63% 63% 60% 59% 58% 57%52%48%
31% 34% 36% 37% 37% 40% 41% 42% 43%
0%
25%
50%
75%
100%
2005 2006 2007 2008 2009 2010 2011 2012 2013
Rural OKProm Rural OK Urban OK Urban OKProm
“Urban” is defined as the 5 most populous counties – Oklahoma, Tulsa, Cleveland Canadian, and Comanche.
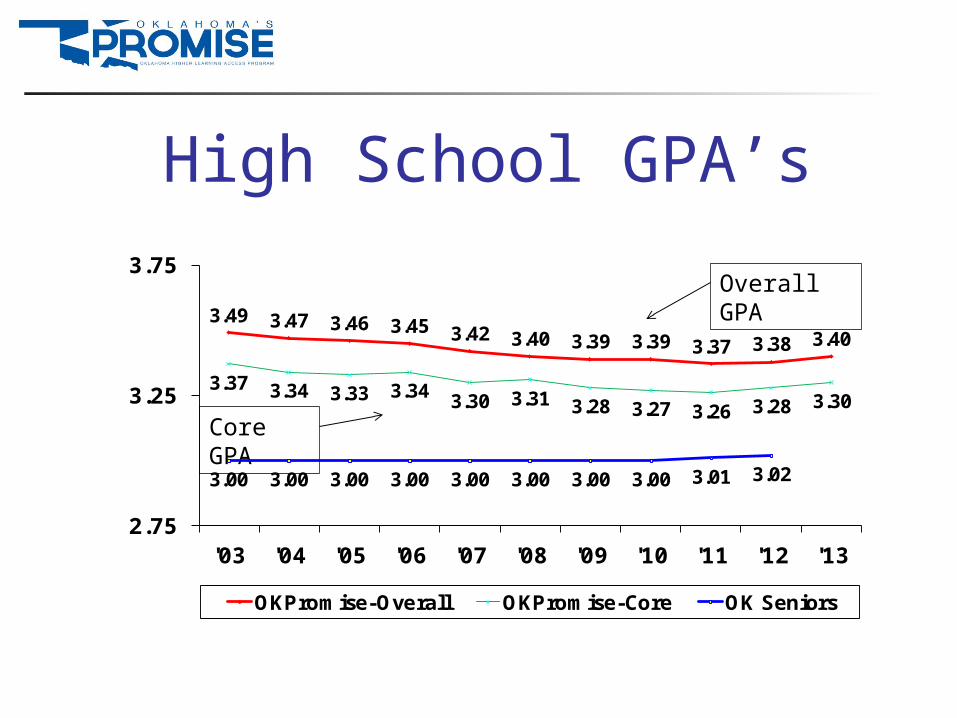
High School GPA’s
3.49 3.47 3.46 3.45 3.42 3.40 3.39 3.39 3.37 3.38 3.40
3.37 3.34 3.33 3.34 3.30 3.31 3.28 3.27 3.26 3.28 3.30
3.00 3.00 3.00 3.00 3.00 3.00 3.00 3.00 3.01 3.02
2.75
3.25
3.75
'03 '04 '05 '06 '07 '08 '09 '10 '11 '12 '13
OKPromise-Overall OKPromise-Core OK Seniors
Overall GPA
Core GPA

2013 ACT Composite Scores
21 21
0
5
10
15
20
OKPromise Non-OKPromise

2013 ACT Testers By Income*
74%
16% 10%
33%
46%
21%
0%
10%
20%
30%
40%
50%
60%
70%
80%
Under $50k Over $50k Not Reported
OKPromise Non-OKPromise
*Self-reported on ACT test application

2013 Average ACT Scores By Income*
21.021.8
20.019.3
22.8
21.1
17
18
19
20
21
22
23
24
Under $50k Over $50k Not Reported
OKPromise Non-OKPromise
*Self-reported on ACT test application
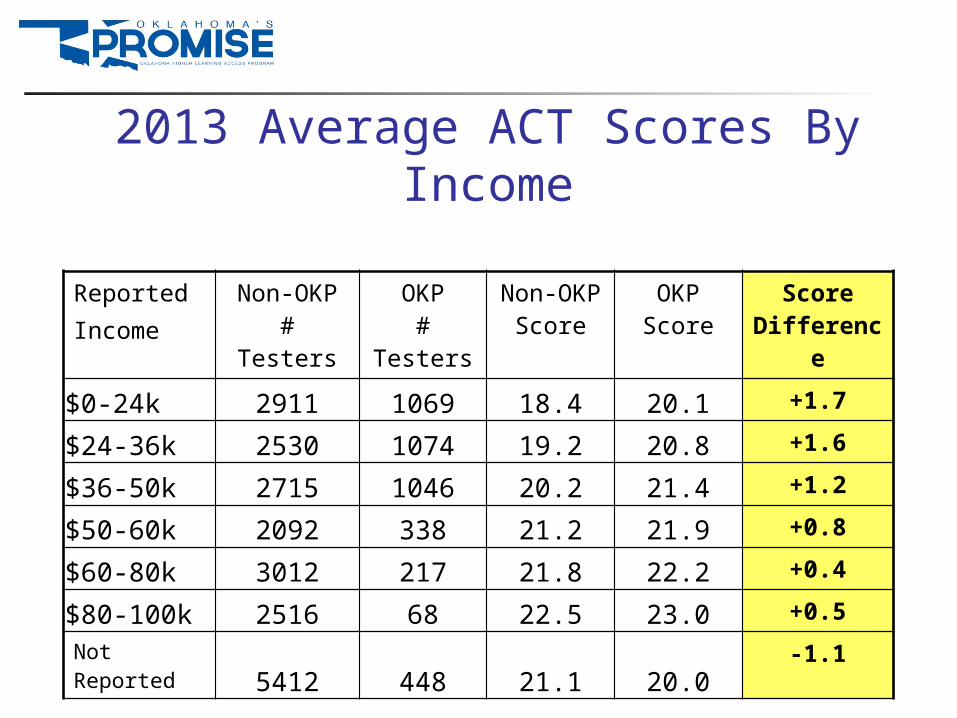
2013 Average ACT Scores By Income
Reported Income
Non-OKP# Testers
OKP#
Testers
Non-OKPScore
OKPScore
ScoreDifferenc
e
$0-24k 2911 1069 18.4 20.1 +1.7
$24-36k 2530 1074 19.2 20.8 +1.6
$36-50k 2715 1046 20.2 21.4 +1.2
$50-60k 2092 338 21.2 21.9 +0.8
$60-80k 3012 217 21.8 22.2 +0.4
$80-100k 2516 68 22.5 23.0 +0.5
Not Reported 5412 448 21.1 20.0
-1.1
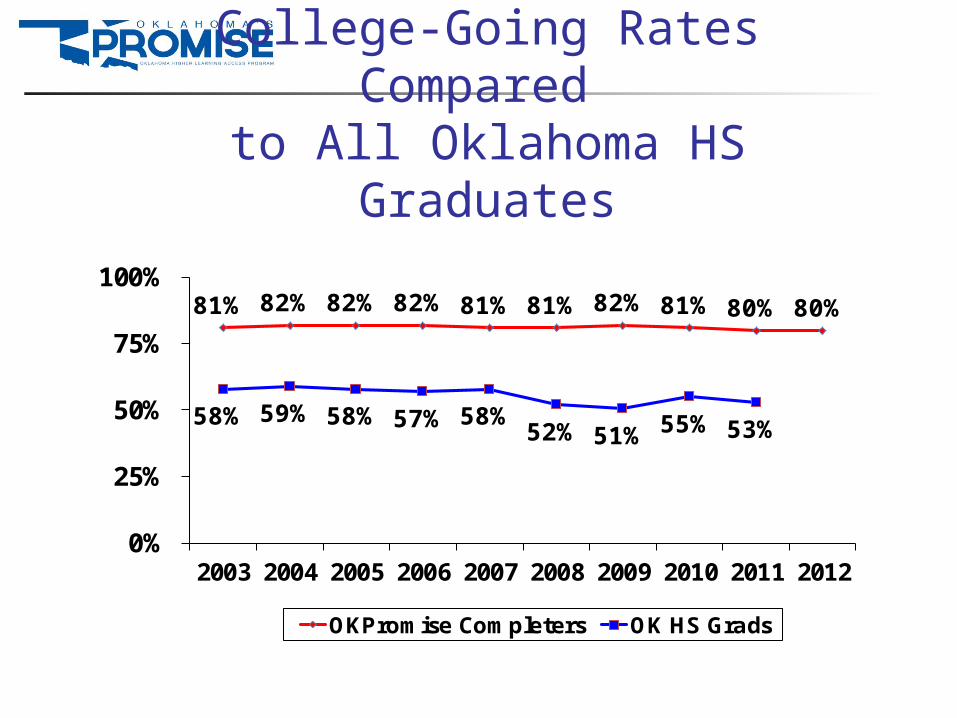
College-Going Rates Compared to All Oklahoma HS Graduates
81% 82% 82% 82% 81% 81% 82% 81% 80% 80%
58% 59% 58% 57% 58%52% 51% 55% 53%
0%
25%
50%
75%
100%
2003 2004 2005 2006 2007 2008 2009 2010 2011 2012
OKPromise Completers OK HS Grads
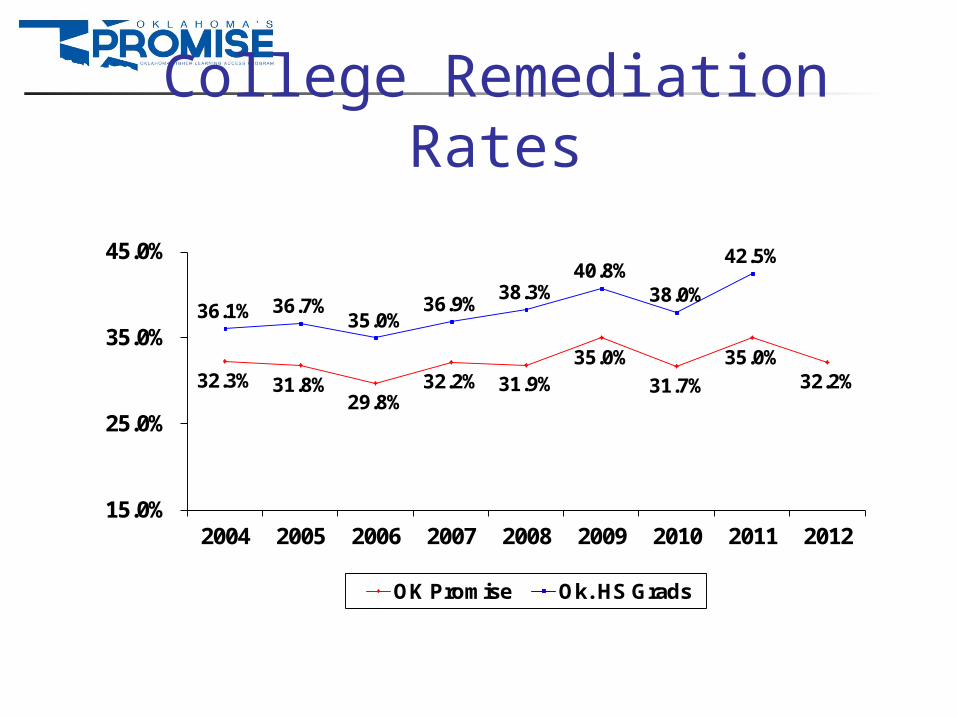
College Remediation Rates
32.3% 31.8%29.8%
32.2% 31.9%35.0%
31.7%
35.0%32.2%
36.1% 36.7%35.0%
36.9%38.3%
40.8%38.0%
42.5%
15.0%
25.0%
35.0%
45.0%
2004 2005 2006 2007 2008 2009 2010 2011 2012
OK Promise Ok. HS Grads

Full-Time College Enrollment
89% 90% 90%
78% 79%75%
60%
70%
80%
90%
100%
2010-11 2011-12 2012-13
OK-Promise Non-OKPromise
First-time entering students enrolled in 12 hours or more per fall or spring semester
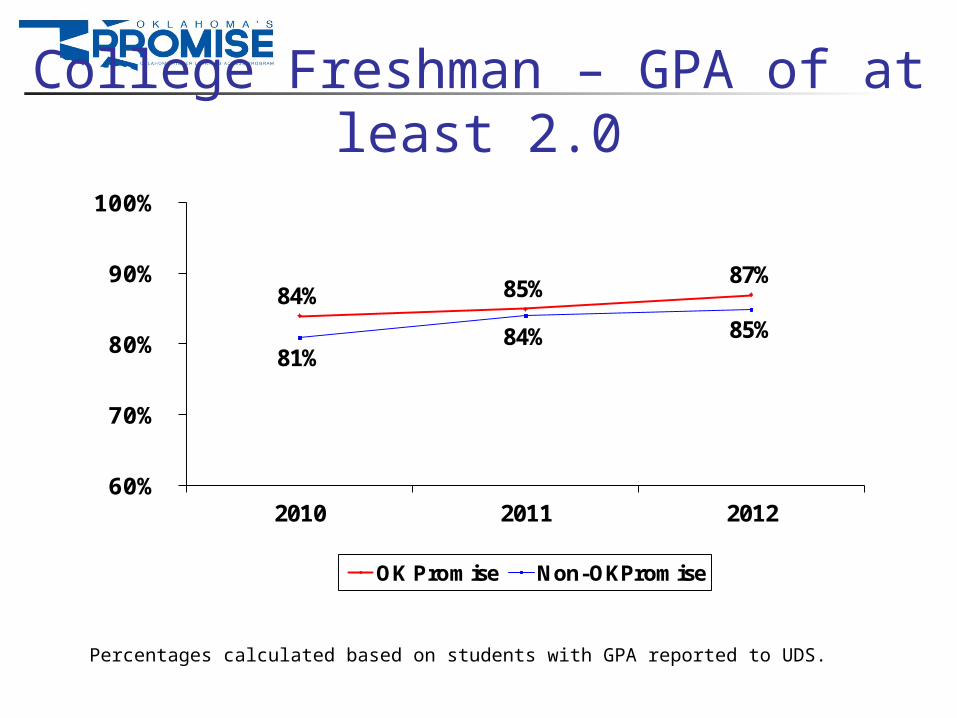
College Freshman – GPA of at least 2.0
84% 85%87%
81%84% 85%
60%
70%
80%
90%
100%
2010 2011 2012
OK Promise Non-OKPromise
Percentages calculated based on students with GPA reported to UDS.

College Freshman to Sophomore Persistence Rates
86% 85% 83% 83% 83% 83% 84% 84% 80%
77% 76% 74% 72% 70% 71% 68% 71% 70%
0%
25%
50%
75%
100%
2003 2004 2005 2006 2007 2008 2009 2010 2011
OKPromise Non-OKPromise Students

Degree Completion Rates(Degrees earned through 2012-13)
43.0%48.5%
53.0% 54.3%56.7%
31.2%
37.5%40.7%
45.7% 45.4%
20.0%
30.0%
40.0%
50.0%
60.0%
5-Yr(2008 fresh)
6-Yr(2007 fresh)
7-Yr(2006 fresh)
8-Yr(2005 fresh)
9-Yr(2004 fresh)
OK Promise Non-OK Promise Students

Employment of College Graduates
in Oklahoma(after 1 year, April 2010 – June 2011)
89%
92%
87%
88%
89%
90%
91%
92%
93%
All Grads OKPromise
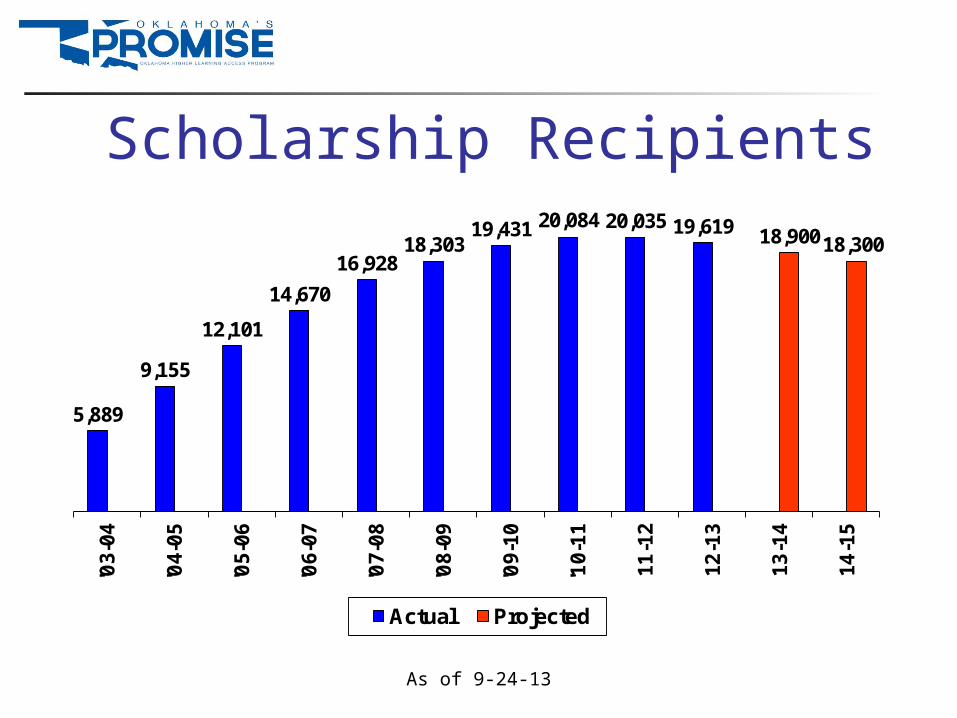
Scholarship Recipients
5,889
9,155
12,101
14,670
16,92818,303
19,431 20,084 20,035 19,619 18,90018,300
'03-
04
'04-
05
'05-
06
'06-
07
'07-
08
'08-
09
'09-
10
'10-
11
11-1
2
12-1
3
13-1
4
14-1
5
Actual Projected
As of 9-24-13

Factors Impacting Future Enrollment and Cost of Oklahoma’s Promise
Shrinking pool of potential applicants ($50,000 limit unchanged since 2000)
New statutory 2nd family income check for 2012 high school graduates
New statutory college GPA and “Satisfactory Academic Progress” requirements beginning in fall 2012

Scholarship Expenditures(In $ millions, by fiscal year)
$10.4
$17.8
$25.9
$33.8
$43.0
$50.9 $53.2$57.2 $59.5 $60.7 $60.5 $61.0
$0
$10
$20
$30
$40
$50
$60
$70
FY'0
4
FY'0
5
FY'0
6
FY'0
7
FY'0
8
FY'0
9
FY'1
0
FY'1
1
FY'1
2
FY'1
3
FY'1
4
FY'1
5
As of 10-16-13
Projected
Actual
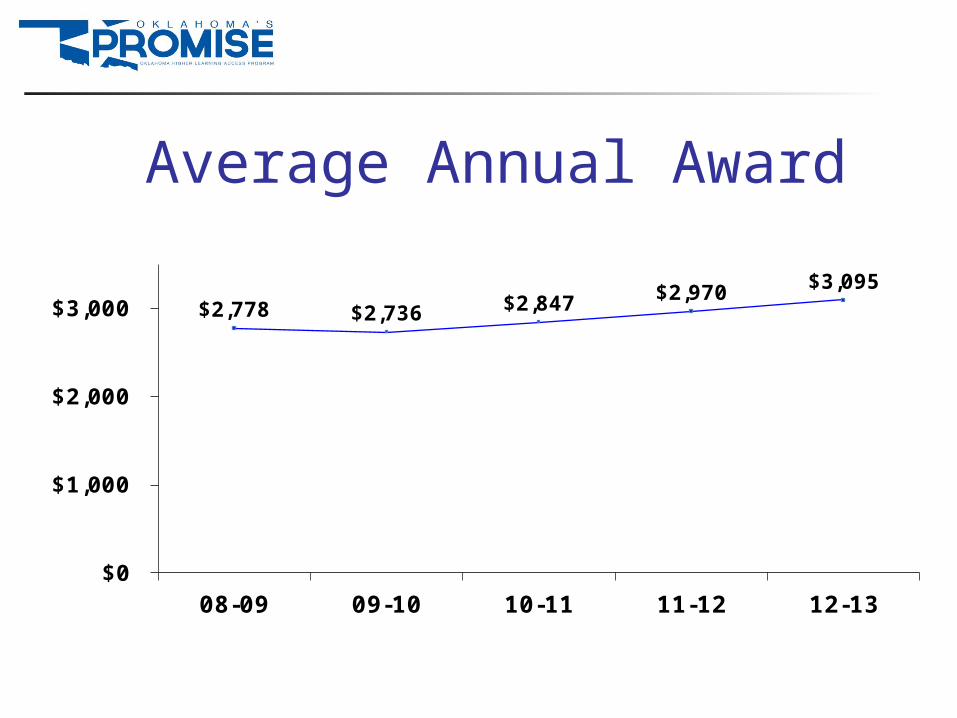
Average Annual Award
$2,778 $2,736 $2,847 $2,970 $3,095
$0
$1,000
$2,000
$3,000
08-09 09-10 10-11 11-12 12-13

Average Annual Scholarship by Type of Institution
$3,622 $3,728 $3,826
$2,943 $3,114$3,325
$1,304 $1,407 $1,473
$0
$1,000
$2,000
$3,000
$4,000
10-11 11-12 12-13
Research U. Regional U. 2-Yr Coll

2013 OKPromise Champions
B Cement 10
A Soper 15
2A Dove Science Academy - OKC 24
3A Sequoyah - Tahlequah 25
4A Santa Fe South – OKC 61
5A Southeast – OKC 61
6A Union - Tulsa 166

2013 OKPromise State Champions
6A-Union-Tulsa (166)
2A-Dove Science Academy-OKC (24)
4A-Santa Fe South-OKC (61)
5A-Southeast-OKC (61)
B-Cement (10)
A-Soper (15)
3A-Sequoyah-Tahlequah (10)
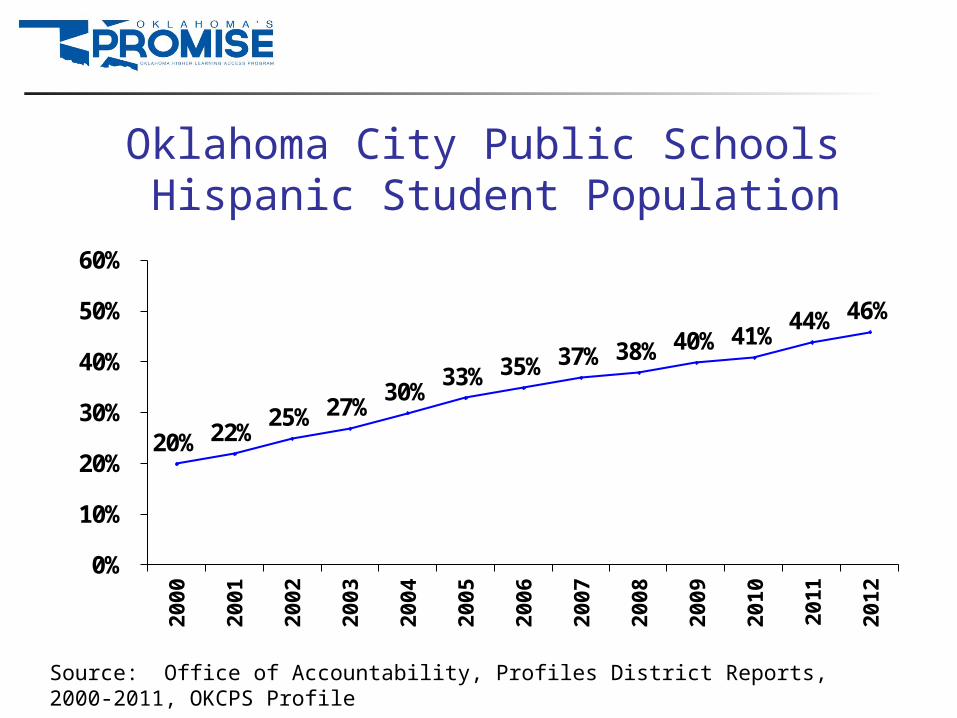
Oklahoma City Public Schools Hispanic Student Population
20% 22%25% 27%
30%33% 35% 37% 38% 40% 41%
44% 46%
0%
10%
20%
30%
40%
50%
60%
20
00
20
01
20
02
20
03
20
04
20
05
20
06
20
07
20
08
20
09
20
10
20
11
20
12
Source: Office of Accountability, Profiles District Reports, 2000-2011, OKCPS Profile

Santa Fe South H.S. - OKC
HS Grad Yr2006
2007
2008
2009
2010 2011 2012 2013
Enrolled 26 72 67 73 63 79 85 74
CompletedReqmnts
18 39 42 52 41 54 70 61
PercentCompleters
69% 54% 63% 71% 65% 68% 82% 82%

Union H.S. - TulsaHS Grad Yr 2006 2007
2008
2009 2010 2011 2012 2013
Enrolled 53 104 115 135 140 185 211 262
CompletedReqmnts
31 60 71 82 84 99 128 165
PercentCompleters
58% 58% 62% 61% 60% 54% 61% 63%
Updated 9-10-12

Union Public Schools Students Eligible for Free/Reduced Lunch
16% 16% 18% 20%26%
30% 33%37% 40% 41%
47%54%
59%48% 49% 49% 52% 53% 54% 55% 55% 55% 56% 59% 61% 62%
0%
10%
20%
30%
40%
50%
60%
70%
200
0
200
1
200
2
200
3
200
4
200
5
200
6
200
7
200
8
200
9
201
0
201
1
201
2
Source: Office of Accountability, Profiles District Reports, 2000-2012
All Oklahoma Public Schools
Union School District

U.S. Grant High School - OKC
HS Grad Yr2006
2007 2008
2009
2010 2011 2012 2013
Enrolled 48 93 111 133 164 206 216 169
CompletedReqmnts.
30 28 45 59 66 92 83 74
PercentCompleters
63% 30% 41% 44% 40% 45% 38% 44%
Tony Lugo
Photo By Steve Gooch, The Oklahoman